Glowworm Attack: Optical TEMPEST Sound Recovery via a Device's Power Indicator LED
←
→
Page content transcription
If your browser does not render page correctly, please read the page content below
Glowworm Attack: Optical TEMPEST Sound
       Recovery via a Device’s Power Indicator LED
                           Ben Nassi, Yaron Pirutin, Tomer Galor, Yuval Elovici, Boris Zadov
                                          Ben-Gurion University of the Negev
                               {nassib, yaronpir, tomercg, elovici, zadov}@post.bgu.ac.il
                                Website - https://www.nassiben.com/glowworm-attack
                               Video - https://www.youtube.com/watch?v=z4-OFLTHtiw

   Abstract—Two main classes of optical TEMPEST attacks              victim device. These studies have contributed to improved
against the confidentiality of information processed/delivered by    understanding regarding the risks posed by optical TEMPEST
devices have been demonstrated in the past two decades; the first    attacks.
class includes methods for recovering content from monitors, and
the second class includes methods for recovering keystrokes from        In this paper, we identify a new class of optical TEMPEST
physical and virtual keyboards. In this paper, we identify a new     attacks: sound recovery by analyzing optical emanations ob-
class of optical TEMPEST attacks: recovering sound by analyzing      tained from a device’s power indicator LED. We show that
optical emanations from a device’s power indicator LED. We           the power indicator LED of various devices leaks information
analyze the response of the power indicator LED of various           regarding the sound played by connected speakers. This occurs
devices to sound and show that there is an optical correlation
between the sound that is played by connected speakers and the       in devices whose power indicator LED is connected directly to
intensity of their power indicator LED due to the facts that: (1)    the device’s power line and lack integrated voltage stabilizers.
the power indicator LED of various devices is connected directly     As a result, the optical response (intensity) of the power
to the power line, (2) the intensity of a device’s power indicator   indicator LED of such devices is correlative to the power
LED is correlative to the power consumption, and (3) many            consumed by the device. This fact can be exploited to recover
devices lack a dedicated means of countering this phenomenon.
Based on our findings, we present the Glowworm attack, an            sound from the connected speakers directly, by obtaining
optical TEMPEST attack that can be used by eavesdroppers             optical measurements via an electro-optical sensor directed at
to recover sound by analyzing optical measurements obtained          the speakers’ power indicator LED, or indirectly, by obtaining
via an electro-optical sensor directed at the power indicator        optical measurements via an electro-optical sensor directed at
LED of various devices (e.g., speakers, USB hub splitters, and       the power indicator LED of the device used to supply power
microcontrollers). We propose an optical-audio transformation
(OAT) to recover sound in which we isolate the speech from           to the speakers (e.g., USB hub, microcontrollers).
optical measurements obtained by directing an electro-optical           Previous studies have discussed the risks a device’s power
sensor at a device’s power indicator LED Finally, we test the        indicator LED can pose to the information delivered/processed
performance of the Glowworm attack in various experimental           by the device due to the linear response of the power indicator
setups and show that an eavesdropper can apply the attack            LED [12, 13]. This fact was exploited in some studies to
to recover speech from speakers’ power LED indicator with
good intelligibility from a distance of 15 meters and with fair      establish covert channels by using a preinstalled malware that
intelligibility from 35 meters.                                      modulated the data via a device’s power indicator LED [14–
                                                                     16], however no prior work was able to demonstrate end-
                                                                     to-end sound recovery from a commercial device’s power
                      I. I NTRODUCTION                               indicator LED without the use of malware. Other studies [17–
   Optical TEMPEST attacks [1], which are methods aimed              20] presented optical methods for recovering sound by turning
at recovering information from systems through optical side          nearby objects into diaphragms (e.g., a hanging light bulb
effects, pose a great risk to privacy. In the past two decades,      [17], bag of chips [18], trash can [19], glass window [20]).
various studies have demonstrated novel techniques for recov-        In these studies, sound was recovered by obtaining optical
ering/extracting information from victim devices using optical       measurements from vibrating objects (objects vibrate when
sensors by exploiting the correlation between the optical side       sound waves hit their surface). However, each of these methods
effects of the information and the device that is used to            [17–20] suffer from one or more of the following limitations:
deliver/process the information. In this context, two main           (1) they are limited in range (the nearby vibrating object must
classes of attacks were introduced; the first class includes         be within five centimeters of the sound source [17, 18]), (2)
methods for recovering content from monitors [2–4]. The              their application can be detected by an optical sensor (because
second class includes methods for recovering keystrokes from         they require the eavesdropper to direct a laser beam into
physical and virtual keyboards [5–11]. In these studies, optical     the victim’s room [19]), (3) they require the eavesdropper to
data that was obtained directly from the victim device’s optical     compromise a device with malware (to stop the LiDAR from
emanations (e.g., [2]) or indirectly from reflections of the         turning so it can target a specific point or to exifltrate the col-
victim device’s optical emanations on nearby objects (e.g.,          lected data via the Internet [19]). In addition, all of the methods
[3, 4]) was used to recover the desired information from a           target the optical changes resulting from minuscule vibrations
2

of nearby objects that were affected by sound hitting their                            II. R ELATED W ORK
surface. We consider these methods to be optical side-channel
attacks rather than optical TEMPEST attacks, because they do         In this section, we review related work in the area of optical
not target the optical correlation between the information and    data leakage and sound eavesdropping. TEMPEST attacks
the device used to deliver/process the information. A recent      have attracted the interest of many researchers since Van Eck’s
paper presented a state-of-the-art sound recovery method [21]     paper was published in the mid-1980s [22]. The last three
using an EMR (electromagnetic radiation) TEMPEST attack           and a half decades have seen the development of various
against devices that contain an MSOC (mixed-signal system-        methods for extracting information from devices by exploiting
on-chip) with an integrated switching regulator from a distance   the correlation between the information delivered/processed
of 15 meters, however, to the best of our knowledge, no study     by a device and its: EMR emanations (e.g., [21, 23–28]),
has proposed a method capable of recovering sound from a          acoustic emanations (e.g., [29–36]), vibrations (e.g., [37–
device at distances greater than 15 meters using a TEMPEST        42]), and power consumption (e.g., [43–45]). In the past two
attack.                                                           decades, two main classes of optical TEMPEST attacks were
   In this paper, we present the Glowworm attack, an optical      introduced; the first class includes methods for recovering
TEMPEST attack aimed at recovering sound played by com-           content from monitors [2–4], and the second class includes
mercial speakers. First, we analyze speakers and show that the    methods for recovering keystrokes from physical and virtual
intensity of their power indicator LED is affected by played      keyboards [5–11]. In these studies, optical data that was
audio. Then, we analyze various devices (USB hub splitter,        obtained directly from the victim device’s optical emanations
micro-controller) used to supply power for the speakers and       (e.g., [2]) or indirectly from reflections of the victim device’s
show that the intensity of the devices’ power indicator LED       optical emanations on nearby objects (e.g., [3, 4]) was used
is also affected by audio played by the speakers. Then, we        to recover the desired information from a victim device.
suggest an optical-audio transformation (OAT) to isolate the         The risks posed by a device’s power indicator LED were
sound from the optical signal obtained via an electro-optical     discussed by [12, 13]. However, prior research demonstrating
sensor directed at the power indicator LED of the devices.        methods capable of exploiting a device’s power indicator LED
Finally, we examine the performance of the Glowworm attack        for data exifltration relied on preinstalled malware to establish
in various experimental setups. We show that it can be used by    optical covert channels [14–16]. The proposed methods leak
an eavesdropper to recover speech from virtual meetings by        data from devices that are connected to air-gapped networks by
obtaining optical measurements directly from the power LED        using preinstalled malware that modulated data optically via
indicator of speakers with good intelligibility from a distance   the integrated LED of a device (e.g., a keyboard [16], router
of 15 meters and with fair intelligibility from 35 meters.        [15], hard drive [14]).
   In this paper, we make the following contributions: (1) We        Recent studies have investigated sound eavesdropping [37–
reveal a new class of optical TEMPEST attack that violates        40, 46–48], suggesting various methods for recovering sound
the confidentiality of the information processed/delivered by     by analyzing the side effects of sound waves that caused
devices; the attack should be addressed by hardware man-          nearby lightweight objects (e.g., a bag of chips, a window)
ufacturers and considered by consumers. (2) We show that          and devices (e.g., motion sensors) to vibrate (turning such
optical TEMPEST attack can recover sound from a device at         objects/devices to diaphragms). In this context, malware was
greater distances (35 meters) than an existing SOTA method        used to recover sound by: (1) obtaining data from a device’s
that used an EMR (Electro-Magnetic Radiation) TEMPEST             motion sensors [37–40], (2) reprogramming a computer’s
attack (whose range was limited to 15 meters) [21]. (3) We        audio port from output to input [47], (3) inverting the process
propose a new method for recovering speech that is external       of a vibration motor [46], and (4) analyzing magnetic data
(obtains data without compromising a device in the target         obtained from a hard disk head [48]. These methods pose a
room), passive (does not rely on an active sensor), and does      serious threat to privacy, but they require the eavesdropper to
not depend on the distance between a sound source and a           compromise a device (with malware) located near the victim
nearby object.                                                    (sound source) in order to obtain data and exfiltrate it to the
   The remainder of the paper is structured as follows: In        eavesdropper.
Section II, we review related work. In Section III, we present       Optical methods for sound recovery were introduced by
the threat model. In Section IV, we analyze the response of a     [17–20]. A recent study demonstrated a method capable of
device’s power indicator LED to sound played by speakers.         classifying words from a precollected dictionary, by analyzing
In Section V, we present an optical audio transformation          the vibrations of a trash can using optical data obtained via
(OAT) for recovering sound, and in Section VI, we evaluate        a robotic vacuum cleaner’s LiDAR. This method requires the
Glowworm’s performance on the task of recovering sound.           eavesdropper to compromise the robotic vacuum cleaner in
In Section VII, we discuss potential improvements that can        order to: (1) prevent the LiDAR from turning and fix the
be made to optimize the quality of the sound recovered by         LiDAR on a specific object to increase the amount of data
an eavesdropper. In Section VIII, we suggest countermea-          collected from the vibrating object (because the frequency of
sure methods that can be applied to prevent the proposed          a robotic vacuum cleaner’s 360◦ LiDAR is limited to 7 Hz),
Glowworm attack. In Section IX, we present the responsible        and (2) exfiltrate the data from the robotic vacuum cleaner.
disclosure we made. In Section X, we discuss the limitations      Three studies [17, 18, 20] presented external optical methods
of the attack and mention future work directions.                 to recover sound that rely on data obtained via optical sensors,
3

Fig. 1. Glowworm’s threat model: The sound snd(t) of the virtual meeting (1) which is played by the connected speakers creates changes in the power
consumption of the power indicator LED of a (2) connected peripheral (e.g., the speakers themselves, a USB hub splitter). The eavesdropper directs an
electro-optical sensor at the power indicator LED of a connected peripheral using a telescope (3). The optical signal opt(t) is sampled from the electro-optical
sensor via an ADC (4) and processed, using an algorithm to recover the acoustic signal snd∗ (t) (5).

without the use of malware. The laser microphone [20, 20] is a                   purpose that may include spying on individuals (e.g., to obtain
well-known method that recovers sound using an external laser                    sensitive information that can be used for blackmail) or spying
transceiver in which a laser beam is directed through a window                   on an organizations (e.g., to obtain a company’s IP and
into a target room; the laser beam is reflected off an object and                use it to give a competitor an advantage). We assume the
returned to the transceiver which then converts the beam to an                   eavesdropper is located within 35 meters of the target room.
audio signal. The visual microphone [18] recovers sound by                       The eavesdropper can be: (1) a person located in a room in an
analyzing the vibrations of material inside the victim’s room                    adjacent building, (2) a person in a nearby car. We consider
(e.g., a bag of chips, water) using video obtained from a high-                  this threat as highly probable in the COVID-19 era due to
speed video camera (2200 FPS) to recover speech. Lamphone                        the number of personal and business meetings being held in
[17] recovers sound using a remote electro-optical sensor by                     unsecured settings, including home offices.
exploiting the vibrations of a hanging light bulb; the vibrations                   In order to recover the sound in this scenario, the eaves-
cause optical changes due to the non-uniform intensity of light-                 dropper performs the Glowworm attack. We assume that the
ing, which varies at each angle. These methods [17, 18, 20]                      a power indicator LED of a vulnerable device is visible from
pose a great privacy threat, however from an eavesdropper’s                      outside the room/office. We consider two types of attacks: (1)
perspective, they are limited in one of the following ways: they                 a direct attack, where the eavesdropper recovers sound from
rely on (1) a very high sound level (over 100 dB) which is                       the power indicator LED of the speakers, and (2) an indirect
beyond the sound level of speech and meetings (e.g., [17, 18]),                  attack, where the eavesdropper recovers sound from the power
(2) active sensors that use a laser beam (e.g., [20]), a fact                    indicator LED of the device used to provide the power to the
that increases the likelihood of detection (compared to passive                  speakers (e.g., a connected USB hub, a microcontroller). Note
sensors), (3) hanging light bulbs, which are not commonly                        that the Glowworm attack can be applied by eavesdroppers
used in office settings today (e.g., Lamphone [17]), or (4)                      to recover: (1) the speech of any person speaking to the
specialized equipment for spying [20], a fact that may limit                     victim during a virtual meeting, and (2) any sound (e.g., music
their availability in some countries (limiting the sale of such                  from YouTube, videos from the Internet) that is played by the
equipment to, e.g., police departments).                                         speakers during the virtual meeting, which may or may not be
                                                                                 related to the meeting; in this paper, we present the attack in
                         III. T HREAT M ODEL                                     the context of recovering speech from a virtual meeting.
   In this section, we describe the threat model and explain                        The main components used to perform the Glowworm attack
its significance with respect to other methods. The Glowworm                     are: (1) A telescope - This piece of equipment is used to focus
attack targets the speech of participants in virtual meeting plat-               the field of view on a device’s power indicator LED from a
forms (e.g., Zoom, Google Meet, Skype, Microsoft Teams).                         distance. (2) An electro-optical sensor - This sensor is mounted
During the COVID-19 pandemic, these platforms became a                           on the telescope and consists of a photodiode that converts
popular way for people to meet and share information; per-                       light into an electrical current; the current is generated when
sonal and valuable information is routinely exchanged when                       photons are absorbed in the photodiode. (3) A sound recovery
these platforms are used for personal and business meetings.                     system - This system receives an optical signal as input and
   We assume that an individual is located inside a room or                      outputs the recovered acoustic signal. The eavesdropper can
office and using his/her computer to conduct a virtual meeting                   implement such a system with: (a) dedicated hardware (e.g.,
with another person (or a group) using a virtual meeting                         using capacitors, resistors), or (b) the use of ADC to sample
platform. The purpose of the conversation can vary, for ex-                      the electro-optical sensor and process the data using a sound
ample, the individuals may want to discuss business (e.g.,                       recovery algorithm running on a laptop. In this study, we use
sharing something with a client or colleague) or something                       the latter digital approach.
of a personal nature (e.g., talking about medical test results                      Fig. 1 outlines the threat model: The sound snd(t) played
with a doctor).                                                                  by the speakers in the victim’s room results in changes in the
   We consider an eavesdropper that is a malicious entity                        power consumption due to the direct connection of the power
interested in recovering speech from meetings and using the                      indicator LED to the input power line and the device’s lack
valuable information discussed in the meeting for a malicious                    of voltage stabilizers. These changes in power consumption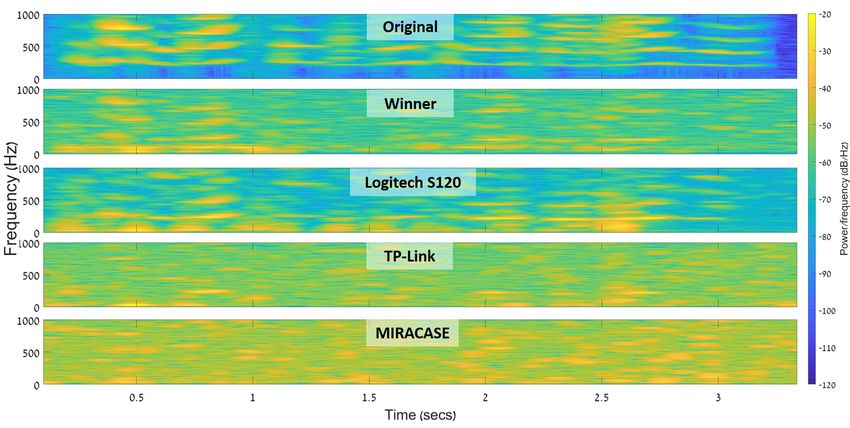
4
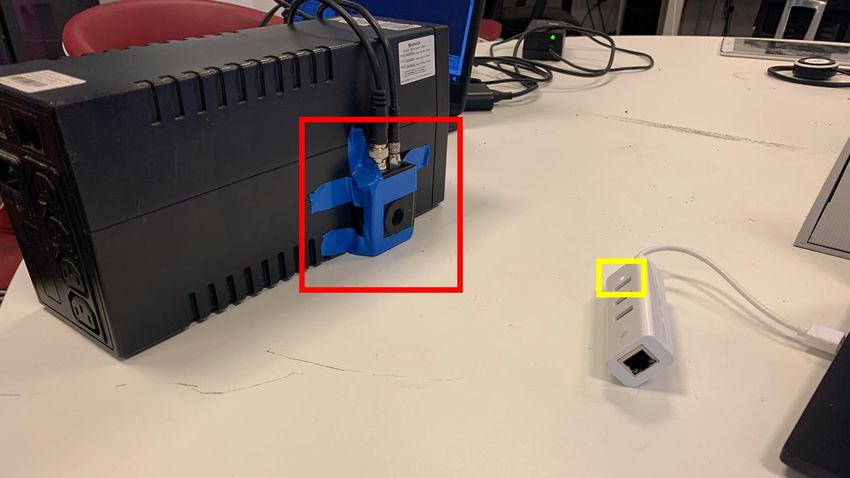
Fig. 2. Left: Four of the devices examined in the experiments described in Section IV. Center: A Thorlabs PDA100A2 electro-optical sensor (boxed in red)
is directed at the power indicator LED of a USB hub splitter (boxed in yellow). Right: The USB adapter is connected to the (1) speakers, (2) power socket,
and (3) ADC via a BNC cable which is used to measure the power consumed by the USB hub splitter.
influence the intensity of the light produced by the device’s opposed to the laser microphone [20] in which a laser beam
power indicator LED, resulting in a pattern of changes over is directed at a glass window).
time that the eavesdropper measures with an optical sensor (4) Capable of recovering speech without the need to com-
which is directed at a device’s power indicator LED via a pile a dictionary: Glowworm can be used to recover any speech
telescope. The analog output of the electro-optical sensor is (as opposed to other methods that are limited to classifying
sampled by the ADC to a digital optical signal opt(t). The isolated words contained in a precompiled dictionary [37–
eavesdropper then processes the optical signal opt(t), using an 39, 51]).
optical-audio transformation, to an acoustic signal snd∗ (t). (5) Not dependent on being withing hearing range: Glow-
In order to keep the digital processing as light as possi- worm can be applied by eavesdroppers that are located beyond
ble in terms of computation, we sample the electro-optical hearing range, from a distance of 15-35 meters (as opposed
sensor with the ADC set at the minimal sampling frequency to other methods that require the eavesdropper to be located
allowing comprehensible audio recovery; Glowworm is aimed within 15 meters of the victim [18, 21]).
at recovering speech, and this requires a sufficient sampling
(6) Capable of recovering speech at a virtual meeting’s
frequency rate. The spectrum of speech covers quite a wide
sound level of 70 dB (in contrast to other methods that can
portion of the audible frequency spectrum. Speech consists of
only be used to recover sound at a high volume [17, 18, 48]).
vowel and consonant sounds; the vowel sounds and the cavities
that contribute to the formation of the different vowels range
from 85 to 180 Hz for a typical adult male and from 165 to
255 Hz for a typical adult female. In terms of frequency, the IV. A NALYSIS
consonant sounds are above 500 Hz (more specifically, in the
2-4 KHz frequency range) [49]. As a result, a telephone system
samples an audio signal at 8 KHz. However, many studies In this section, we describe the series of experiments per-
have shown that an even lower sampling rate is sufficient for formed to evaluate the risk of optical sound recovery posed
recovering comprehensible sound (e.g., 2200 Hz for the visual by the vulnerability of the power indicator LED of various
microphone [18]). In this study, we sample the electro-optical devices. The experiments analyze: (1) the influence of sound
sensor at a sampling rate of 4/8 KHz. played from speakers on the power consumption of various
The significance of Glowworm’s threat model with respect devices, (2) the response of the device’s power indicator LED
to related work is that Glowworm is: to sound, and (3) the side effects added to the optical signal
(1) Not dependent on the distance between a sound source which are not the result of sound played from the speakers.
and a nearby object: Glowworm analyzes the intensity of a The devices used in these experiments are: Logitech S120
device’s power indicator LED, which is affected by a device’s speakers [52], Winner speakers [53], a TP-Link UE330 USB
power consumption. As a result, the attack is not limited based hub splitter [54], a MIRACASE MHUB500 USB hub splitter
on the required distance between a sound source and a nearby [55], a Raspberry Pi (RP) 4, a Google Nest Mini [56],
lightweight object (diaphragm) that vibrates in response to and Creative Pebble speakers [57]. Four of the devices are
sound (as opposed to other sound recovery methods that presented in Fig. 2.
are limited in that there can be no more than one meter The experiments were conducted as follows: An electro-
between the sound source and a vibrating object [17–20, 37– optical sensor (the Thorlabs PDA100A2 [58], which is an
40, 46, 48, 50, 51]). amplified switchable gain light sensor that consists of a
(2) External: Glowworm does not rely on compromising a photodiode which is used to convert light/photons to electrical
device to obtain the data needed to recover sound (as opposed voltage) was directed at the power indicator LED of each
to other sound recovery methods that require eavesdroppers to device. The voltage was obtained from the electro-optical
compromise a device with malware first [37–39, 46–48]). sensor using a 24-bit ADC NI-9234 card [59] and processed
(3) Passive and relies on a benign sensor: The method relies in a LabVIEW script that we wrote. The internal gain of
on a passive electro-optical sensor that is not considered spying the electro-optical sensor was set at the highest level before
equipment and gives no indication regarding its application (as reaching saturation. The setup is presented in Fig. 2.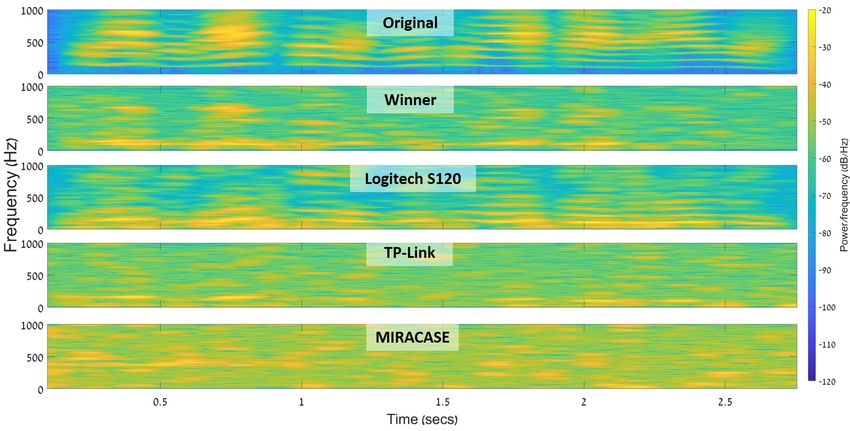
5

Fig. 3. The six spectrograms on the right are obtained from power (upper row) and optical (bottom row) measurements of three devices when the speakers
played a frequency scan (0-4 KHz) on the left.

A. Understanding How Played Sound Affects the Power Con-                        Results: Fig. 3 presents (1) three spectrograms extracted
   sumption                                                                 from the optical signal, and (2) three spectrograms extracted
                                                                            from the power signal. As can be seen, the chirp function
   Here we explore the effect of played sound on a device’s
                                                                            played by the speakers affected the power consumption of all
power consumption and show that it linearly affects the
                                                                            three devices. In the case of the RP, the frequency scan that
device’s power indicator LED due to the fact that hardware
                                                                            was played by the speakers (0-4 KHz) can be spotted in the
manufacturers do not integrate any voltage stabilizers or filters
                                                                            power consumption signal). In the cases of the TP-Link USB
in some products. We show that optical measurements can be
                                                                            hub splitter and Logitech speaker, a frequency scan between
used to recover sound using an electro-optical sensor directed
                                                                            0-8 KHz can be seen in the power consumption signal (we
at a device’s power indicator LED and eliminate any other
                                                                            discuss this phenomenon later in this section). Moreover, as
reasonable side effects that could explain this phenomenon.
                                                                            shown in Fig. 3, the intensity of the power indicator LED of
   1) How Played Sound Affects a Device’s Power Consump-
                                                                            the devices is perfectly correlated with the power consumed
      tion and the Intensity of Its Power Indicator LED
                                                                            by the devices (excluding some optical noise which will be
   Here, we show that the intensity of a device’s power
                                                                            discussed later in the paper).
indicator LED is highly correlated with the device’s power
consumption.                                                                    Conclusions: Based on these experiments, we concluded
                                                                            that: (1) The power consumed by the three devices correlates
   Experimental Setup: We created a USB adapter that allows
                                                                            with the sound that the speakers play and the intensity of
us to obtain power measurements from any device with a
                                                                            their power indicator LED. (2) The manufacturers of these
USB input connector (the connector can be seen in Fig.
                                                                            devices do not distort/change the known linear response of the
2). We conducted three experiments. In the first experiment,
                                                                            intensity of an LED to power consumption [12] by integrating
the Logitech speakers’ USB was connected to the adapter
                                                                            filters and voltage stabilizers into the electrical circuits. (3)
which was connected directly to the electricity. In the second
                                                                            The power consumed by the speakers influences the devices
experiment, the Logitech speakers’ USB was connected to the
                                                                            providing the power to the speakers (e.g., USB hub splitter,
TP-Link USB hub splitter. The input USB connector of the
                                                                            RP). (4) The linear correlation between the power consumed
USB hub splitter was connected to the adapter which was
                                                                            by the device, the audio played, and the intensity of the power
connected to a PC. In the third experiment, the Logitech
                                                                            indicator LED of the devices shows sound can be recovered by
speakers’ USB was connected to the RP. The input micro
                                                                            obtaining optical measurements via an electro-optical sensor
USB connector of the RP was connected to the adapter which
                                                                            directed at a device’s power indicator LED.
was connected to the electricity. In all of these experiments,
the audio was played via the speakers (at 70 dB). The audio                     2) Ruling Out Other Possible Side Effects
played from the speakers is a 30 second audio file that consists                One might argue that the optical measurements could be
of a chirp function (a frequency scan between 0-4 KHz). We                  affected by a phenomenon unrelated to the changes in the
obtained optical measurements via the electro-optical sensor                intensity of a device’s power indicator LED. For example, one
which was directed at the power indicator LED of the speakers               reasonable argument is that electromagnetic radiation emitted
(in the first experiment), the USB hub splitter (second exper-              from the device was captured by the electro-optical sensor.
iment), and the RP (third experiment). In addition, in each of              Another reasonable argument is that the optical sensor captures
the experiments, we obtained power measurements from the                    minuscule vibrations of the power indicator LED caused by
adapter by connecting it to a BNC cable that was connected to               the device’s vibrations due to the sound waves produced from
a 24-bit ADC NI-9234 card [59]. The ADC was used to obtain                  the speakers. In order to disprove these claims, we conducted
optical and electrical measurements simultaneously from each                the following set of experiments.
tested device.                                                                  Experimental Setup: We placed an RP on a table and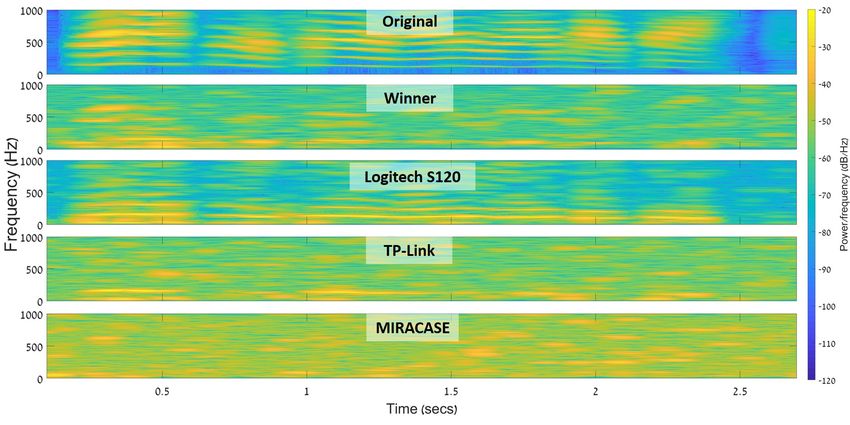
6

Fig. 4. From left to right: Spectrograms obtained from optical measurements when the RP’s power indicator LED was visible (first) and covered (second).
Spectrograms obtained from gyroscope measurements for three axes.

directed the electro-optical sensor at its power indicator LED
from a distance of one meter (through a telescope with a 15 cm
lens diameter). We connected the USB cable of the Logitech
speakers to the RP which was connected to the electricity on
the other end. The speakers were placed on a different surface
than the RP in order to eliminate any vibration resulting from
the sound waves produced by the speakers. The speakers
played an audio file consisting of a chirp function which is
a frequency scan between 200-400 Hz.                                         Fig. 5. FFT graphs extracted from optical measurements of the power
                                                                             indicator LED of various devices when no sound was played. The frequency
   We conducted the following three experiments: In the                      of the LED (100 Hz) can be seen in the graph for each device.
first experiment, we obtained optical measurements when the
electro-optical sensor was directed at the RP, however we cov-
ered the device’s power indicator LED with tape (to examine                  result of changes in a device’s power consumption which
whether the played signal appears in the optical measurements                linearly affect the intensity of the LED.
and rule out any effect of EMR). In the second experiment, we
attached a gyroscope (MPU-6050 GY-521 [60]) to the RP to                     B. Exploring the Optical Response
measure its vibrations (to examine whether the played signal                    Here we explore the recovered optical signal, including the
appears in the gyroscope measurements and rule out any effect                baseline, side effects added, and SNR (signal-to-noise ratio).
of vibration). We obtained measurements from the gyroscope                      1) Characterizing the Optical Signal When No Sound Is
via another RP which was used to sample the gyroscope at                            Played
1000 Hz. In the third experiment, we obtained optical mea-                      Here we examine the characteristics of the optical signal
surements when the electro-optical sensor was directed at the                when no sound is played.
RP’s power indicator LED (in order to prove that the played                     Experimental Setup: We obtained five seconds of optical
signal can be identified in the optical measurements). The                   measurements via an electro-optical sensor directed at the
third experiment was performed for the purpose of validation.                power indicator LED of four devices.
The frequency band tested in these experiments (200-400 Hz)                     Results: The FFT graphs extracted from the optical mea-
was chosen, since the maximum sampling rate our gyroscope                    surements of the devices when no sound was played are
provided was 1000 Hz, which means that only frequencies                      presented in Fig. 5. As can be seen, a peak appears in the
below 500 Hz can be measured.                                                FFT at around 100 Hz; this peak is the result of the power
   Results: The results are presented in Fig. 4. As can be seen,             line frequency used to supply power to the LED. Power lines
the frequency scan appears in the spectrogram obtained from                  are designed to operate at frequencies of 50 or 60 Hz, however
the optical measurements when a device’s power indicator                     certain types of loads contain nonlinear components such as
LED is visible. However, the frequency scan cannot be spotted                diodes and transistors, and as a result, the loads produce
in the spectrograms obtained from (1) the optical measure-                   frequencies which are multiples of the fundamental power
ments when a device’s power indicator LED is covered, or (2)                 line frequency (50 or 60 Hz) and are called power system
the gyroscope measurements in each of the three axes.                        harmonics. Since a diode bridge is integrated into the LED,
   Conclusions: Based on these experiments, we concluded                     it distorts the fundamental power line frequency, resulting in
that (1) the optical measurements are not affected by elec-                  power system harmonics (50 Hz, 100 Hz, 200 Hz, etc.) that
tromagnetic radiation (if they were, the frequency scan would                are reflected in the LED’s light intensity. Since the optical
have appeared in the spectrogram when the power indicator                    signal is obtained via an electro-optical sensor directed at a
LED was covered with tape); and (2) the optical measurements                 device’s power indicator LED, the frequency of 50 Hz and its
are not affected by the vibration caused by the sound waves                  harmonics (100 Hz, 200 Hz, 300 Hz, etc.) are added to the
produced from the speakers (if they were, the frequency scan                 raw optical signal and are not the result of the sound we wish
would have appeared in the spectrograms obtained from the                    to recover.
gyroscope on at least one of the three axes). These experiments                 Conclusions: The power system harmonics, which are added
prove that the frequency scan in the optical measurements                    to the optical signal and are not the result of the sound played,
obtained from a device’s visible power indicator LED is the                  need to be filtered in order to recover the played signal.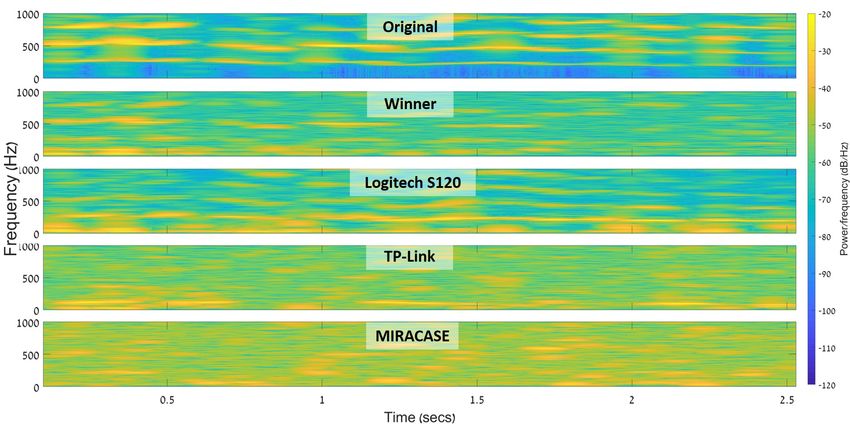
7
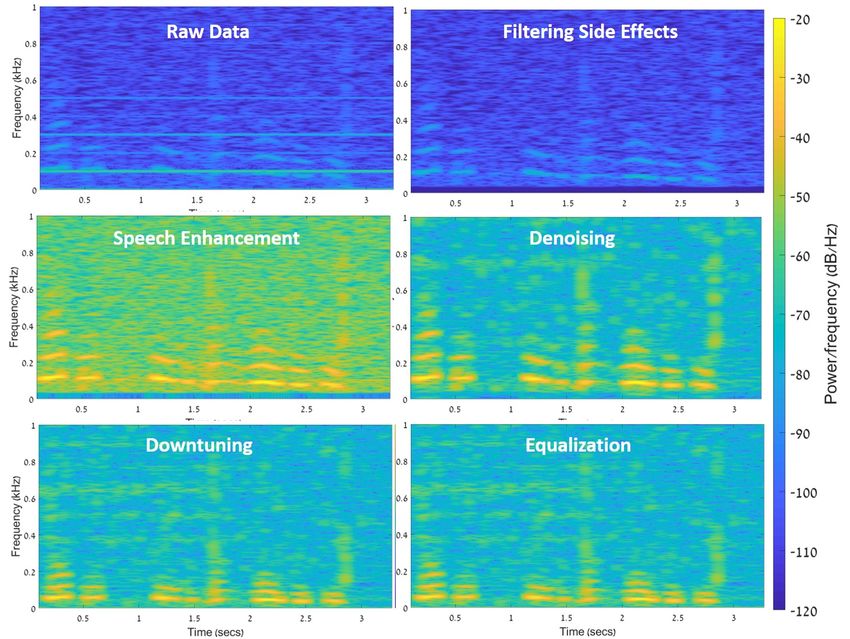
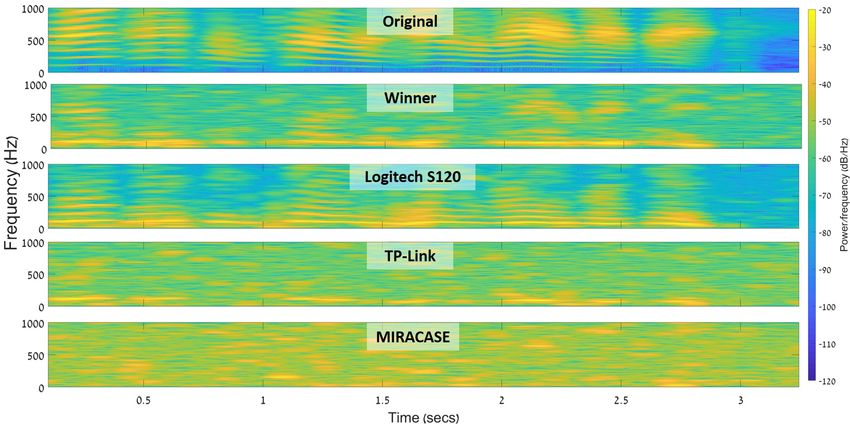
Fig. 6. Spectrograms extracted from optical measurements obtained from the power indicator LED of various devices when a chirp function was played
(frequency scan between 0-4 KHz). Note that in some devices (e.g., Logitech S120 speakers) the original frequency played by the speakers appears in the
spectrum of the optical signal, while in other cases (e.g., TP-Link UE330, MIRACASE MHUB500), only the first harmonic of the frequency appears in the
spectrum of the optical signal.
Fig. 7. SNR of various devices in the spectrum of 0-4 KHz at three sound levels (60, 70 dB).
TABLE I
S UMMARY OF R ECOVERED O PTICAL SNR OF VARIOUS D EVICES AT S OUND L EVEL OF 70 D B
Recovered Signal
Device 0-4000 Hz 0-1000 Hz 1000-2000 Hz 2000-3000 Hz 3000-4000 Hz
Avg. Avg. Avg. Avg. Avg.
Manufacturer Model Type Tone STD STD STD STD STD
SNR [dB] SNR [dB] SNR [dB] SNR [dB] SNR [dB]
Logitech S120 Original 40.75 7.52 45.09 4.46 41.50 3.59 41.65 5.88 34.42 10.73
Winner Speakers Original 58.04 5.67 56.83 7.37 61.34 2.69 58.44 3.30 55.44 6.60
CREATIVE Pebble Modern 2.0 Original 6.95 9.67 17.46 13.35 4.17 2.39 0.2 0.5 6 5.69
TP-Link UE330 First harmonic 20.65 14.53 36.85 8.02 21.35 12.37 16.12 10.98 7.61 8.73
USB Hub
MIRACASE MHUB500 First harmonic 10.72 14.79 31.71 11.41 5.33 9.62 2.74 5.66 2.72 5.55
Raspberry Pi 4 Microcontroller Original 15.73 9.59 26.85 6.23 18.21 4.79 11.46 6.16 5.93 5.70
Google Google Nest Smart Assistant Original 1.53 4.15 3.81 6.23 2.3 4.68 0 0 0 0
2) Power Indicator LED’s Response to Sound at 0-4 KHz Conclusions: Based on these experiments, we concluded
In the next experiments, we tested the response of the that: (1) For devices with a weak recovered optical signal,
power indicator LED of various devices to a wide range of the application of denoising techniques is required to optimize
frequencies. the SNR. (2) For devices where the recovered optical signal
Experimental Setup: We conducted the following experi- appears in the first harmonic, the use of downtuning is
ments: In the first experiment, we obtained optical measure- required.
ments from the power indicator LED of two speakers (Log- Next, we conducted an experiment to calculate the SNR of
itech S120 speakers and Winner speakers) that were connected each of the seven devices (Logitech S120 speakers, Winner
to the electricity. In the second experiment, we obtained optical speakers, TP-Link UE330 USB hub splitter, MIRACASE
measurements from the power indicator LED of devices (TP- MHUB500 USB hub splitter, RP, Google Nest Mini, and
Link UE330 USB hub splitter [54], MIRACASE MHUB500 Creative Pebble speakers) across the 0-4 kHz spectrum at two
USB hub splitter [55], RP) that were used to provide power levels (60 and 70 dB).
to the speakers via their USB input ports. In each of the Experimental Setup: We used the same experimental setup
experiments, the audio was played via speakers at a sound as the previous experiment, however this time we played a
level of 70 dB. The audio played from the speakers is a 30 different audio file which consists of various sine waves (120,
second audio file that consists of a chirp function (a frequency 170,....1020 Hz), where each sine wave was played separately
scan between 0-4 KHz). for two seconds. We played the audio file via the the speakers
Results: Fig. 6 presents the spectrograms obtained from the at two sound levels (60 and 70 dB) and obtained optical
optical measurements. Three observations can be made from measurements.
the spectrograms: (1) For some devices, the signal that appears Results: The SNR is presented in Fig. 7 and Table I. We
in the optical measurements is much stronger (e.g., Logitech used the SNR as a measure in order to assess Glowworm’s
S120 speakers) than that of other devices (e.g., the RP). (2) to capture essential frequency bands used for speech recovery.
For some devices, the signal obtained matches the original Based on the experiments we conducted, we consider an SNR
chirp function (e.g., Winner speakers). (3) For some devices, over 40 dB as a high quality signal; an SNR between 20 and
only the first harmonic of the chirp appears in the spectrogram 40 dB as a medium quality signal; and an SNR below 20 dB as
(e.g., TP-Link USB hub splitter). a low quality signal. The following observations can be made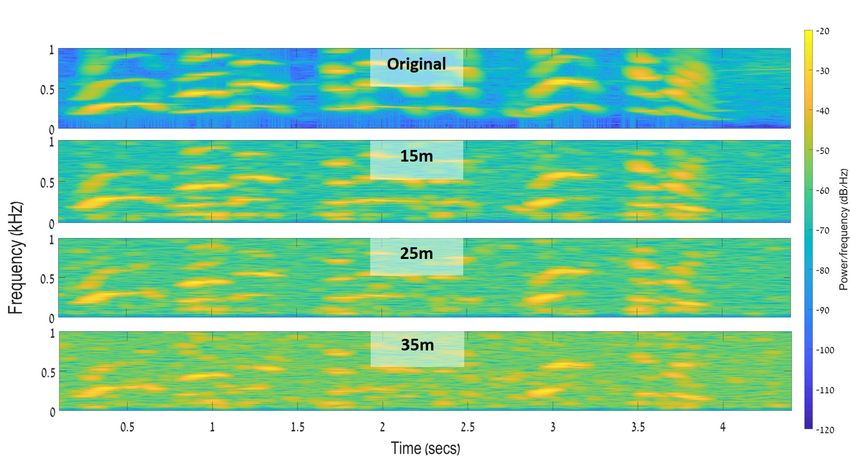
8

based on the results: (1) The SNR changes depending on the
type of device used.
   This is the result of the differences in their power con-
sumption and the intensity of the light emitted from their
power indicator LED. (2) For some devices, the SNR has
a low standard deviation (STD) throughout the spectrum
examined (e.g., the STD of the SNR of the optical signal
obtained from the Logitech S120 speakers is 7.5, and the
STD of the SNR of the optical signal obtained from the
Winner speakers is 5.6), which indicates a stable response,
while for other devices, the SNR has a large STD (e.g., RP),
which is usually the result of a decrease in the SNR as a           Fig. 8. SNR obtained from Logitech S120 speakers’ power indicator LED
function of the frequency. (3) For some devices, the effective      when ambient lights were on and off.
spectrum that can be used to recover sound is narrow. For
example, the SNR obtained from the power indicator LED of
the MIRACASE MHUB500E is only stable up to 1000 Hz;                 effect of ambient light on the SNR calculated from the optical
for this device, the SNR of the spectrum beyond 1000 Hz is          signal is negligible, and no additional procedures are required.
extremely unstable. (4) In general, the SNR of the recovered        This is due to the fact that the ambient light only adds its power
signal improves as the sound level increases. This phenomenon       system harmonics to the spectrum of the optical signal, and
can be explained as follows: When the volume of the sound           the harmonics can be filtered early in the processing stage.
played by the speakers increases, the power consumption                Conclusion: Ambient light present in the power indicator
increases. The power is the product of voltage and current.         LED’s environment does not affect Glowworm’s ability to
The current consumed from AC-DC converter output stage              recover sound.
capacitors (which have a limited amount of energy) increases,
and as a result, the voltage level decreases proportionally to               V. O PTICAL -ACOUSTIC T RANSFORMATION
the current and volume levels. Since a device’s power indicator
LED is connected in parallel to the capacitor, it is linearly          In this section, we leverage the findings presented in Section
affected by voltage levels; its intensity also increases, and a     IV and present optical-acoustic transformation (OAT), which
greater amount of light is emitted. As a result, more photons       we used to recover audio signals from the optical signals
are captured by the electro-optical sensor, which yields a better   obtained from an electro-optical sensor directed at a device’s
SNR. (5) The improvement in the SNR that results from higher        power indicator LED. Throughout this section, we consider
volume levels varies depending on the device; in some cases,        snd(t) as the audio played inside the target’s room by the
the improvement is significant (e.g., the TP-Link USB hub           speakers, opt(t) as the optical signal obtained via an electro-
splitter and RP), while in other cases (e.g., Winner speakers),     optical sensor directed at the power indicator LED of a device,
the improvement is less dramatic. (6) For some vulnerable           and snd∗ (t) as the audio signal recovered from opt(t) using
devices (e.g., Google Nest Mini and Creative Pebble speakers),      OAT. OAT consists of the following stages:
the SNR is poor due to the weak intensity of their power               Filtering Side Effects. As discussed in Section IV and
indicator LED. This fact requires more sensitive electro-optical    presented in Fig. 5, there are factors which affect the optical
sensor (with lower noise level) to recover sound from their         signal opt(t) that are not the result of the sound played snd(t)
power indicator LED.                                                (e.g., peaks which are added to the spectrum that are the result
   Conclusions: Based on these experiments, we concluded            of the light frequency of the power indicator LED and its
that (1) a sound level of 70 dB (the sound level of virtual         harmonics - 100 Hz, 200 Hz, etc.). We filter the light frequency
meetings) produces a high SNR, and (2) for devices in which         and its harmonics (its first, second, third, ... order harmonics)
the SNR decreases as a function of the frequency, an equalizer      from opt(t) using notch/bandstop filters.
needs to be used to amplify the energy of weak frequency               Downtuning. As discussed in Section IV and presented in
ranges.                                                             Fig. 6, in some cases only the second order of the frequencies
   3) The Influence of Ambient Light                                of the played signal snd(t) appears in the optical signal opt(t).
   In the next experiment we investigate the influence of           As a result, the recovered signal snd∗ (t) is uptuned compared
ambient light in the LED’s environment on the SNR calculated        to the original signal snd(t) played by the speakers. This
from the optical signal obtained.                                   case requires the eavesdropper to apply downtuning to the
   Experimental Setup: An electro-optical sensor was directed       optical signal opt(t) in order to recover sound at the original
at the power indicator LED of speakers (Logitech S120 speak-        pitch. Downtuning is a standard procedure in the area of
ers) from a distance of five meters. The electro-optical sensor     sound processing used to play a song at a lower tone. We
obtained measurements from the speakers’ power indicator            implemented this procedure digitally according to [61].
LED while the speakers played various sine waves (120,                 Speech Enhancement. Speech enhancement is performed
170,....1020 Hz). This setup was repeated twice: (1) when the       to maximize the signal’s dynamic range before applying
lights were on, and (2) when the lights were off.                   additional filters. To do so, we normalize the signal by scaling
   Results: The SNR is presented in Fig. 8. As can be seen, the     the values of opt(t) to the range of [-1,1]
9

                                                                                 Fig. 10. Experimental setup: the telescope and the four devices used in the
                                                                                 experiments. A PDA100A2 electro-optical sensor is mounted on the telescope.
                                                                                 The electro-optical sensor outputs voltage which is sampled via an ADC (NI-
                                                                                 9234) and processed in LabVIEW.
Fig. 9. The influence of the five stages of optical-audio transformation (OAT)
on the recovered signal.
                                                                                                           VI. E VALUATION
                                                                                    In this section, we evaluate the performance of the Glow-
   Denoising. This is the process of removing noise from a                       worm attack in terms of its ability to recover speech from
signal to increase the SNR and optimize its quality. Various                     the power indicator LED of various devices. We start by
techniques have been demonstrated to reduce noise, however                       comparing Glowworm’s performance to the performance of
we reduce noise by applying spectral subtraction, an adaptive                    the visual microphone and Lamphone in a lab setup. Then,
technique proposed for denoising single channel speech [62].                     we test the influence of distance and the sound volume on
                                                                                 Glowworm’s performance when recovering speech through an
  Equalizer. As discussed in Section IV and presented in                         office’s transparent glass window/door.
Fig. 7, the SNR obtained from some devices is unstable and                          The reader can assess the quality of the recovered sound
decreases as a function of the frequency. We use an equalizer                    visually by analyzing the extracted spectrograms, qualitatively
in order to amplify the response of weak frequencies by                          by listening to the recovered audio signal online,1 , 2 and quan-
adjusting the balance between frequency components within                        titatively based on metrics used by the audio processing com-
an electronic signal.                                                            munity to compare a recovered signal to its original signal: (1)
   The techniques that enable OAT to recover audio signals                       Intelligibility - a measure of the comprehensibility of speech in
from the optical signals are extremely popular in the area of                    given conditions [63]. To measure intelligibility, we used the
speech processing; we used them for the following reasons:                       metric suggested by [64] which results in values between [0,1].
(1) the techniques rely on a speech signal that is obtained from                 A higher intelligibility indicates better sound quality. (2) Log-
a single channel; if eavesdroppers have the capability of sam-                   Likelihood Ratio (LLR) - a metric that captures how closely
pling a device’s power indicator LED using multiple sensors,                     the spectral shape of a recovered signal matches that of the
thereby obtaining several signals via multiple channels, other                   original clean signal [65]. A lower LLR indicates better sound
methods can also be applied to recover an optimized signal,                      quality. (3) NIST-SNR - the speech-to-noise ratio, which is
(2) these techniques do not require any prior data collection                    defined as the logarithmic ratio between the estimated speech
to create a model; recent methods use learning-based models                      power and noise power over 20 consecutive milliseconds. A
(e.g., neural networks) to optimize the speech quality in noisy                  higher NIST-SNR indicates better sound quality.
channels, however such methods require a large amount of                            We used the following equipment and configurations to
data for the training phase in order to create robust models,                    recover sound in the experiments conducted and described
something eavesdroppers would likely prefer to avoid, and (3)                    in this section: a telescope (with a 20 cm lens diameter)
the techniques can be applied in real-time applications, so the                  was directed at the power indicator LED of the device. We
optical signal obtained can be converted to audio with minimal                   mounted an electro-optical sensor (Thorlabs PDA100A2 [58])
delay.                                                                           to the telescope. The voltage was obtained from the electro-
                                                                                 optical sensor using a 24-bit ADC NI-9234 card [59] and
   The influence of each step of the OAT on the recovered                        was processed in a LabVIEW script that we wrote. The
signal when the transformation is used to recover an arbitrary                   sampling frequency of the ADC was configured at 2 KHz.
sentence is illustrated in Fig. 9. As can be seen, the raw                       In the remainder of this section we refer to this setup as the
optical signal is very noisy. However, the application of speech
enhancement and denoising techniques significantly improves                          1   https://youtu.be/Mi6T2K9zQgE
the SNR. The equalizer is only used for fine-tuning.                                 2   https://youtu.be/eZD4SdeKe7E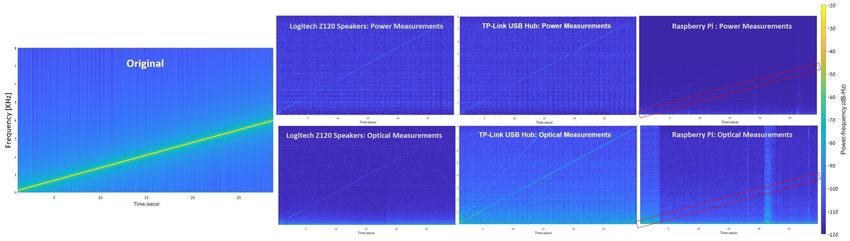
10

                                                                            are reported in Table II. Comparing these results to the results
                                                                            reported in the original Lamphone [17] and visual microphone
                                                                            [18] studies on the same sentences, we find that: (1) The
                                                                            average intelligibility of the speech recovered from the power
                                                                            indicator LED of the speakers (by applying the attack in a
                                                                            direct manner) is considered good/fair (according to [63]),
                                                                            however the average intelligibility of the speech recovered
                                                                            from the power indicator LED of the USB hub splitters (by
                                                                            applying the attack in an indirect manner) is considered poor.
                                                                            The visual microphone and Lamphone yield the same level of
                                                                            results in terms of intelligibility, as their average intelligibility
                                                                            is also considered good. (2) The average LLR of the speech
                                                                            recovered from the power indicator LED of Winner speakers
Fig. 11. mabw0 sa1:"She had your dark suit in greasy wash water all year"
recovered from various devices.                                             is 1.74, which is lower (better) than Lamphone’s average LLR
                                                                            (1.8) but higher (worse) than the visual microphone’s average
                                                                            LLR (1.53). The average LLR of the other devices was higher
eavesdropping equipment. The level of the played sound was                  (worse) than that of the visual microphone and Lamphone.
measured using a professional decibel meter.                                (3) The average NIST-SNR of the speech recovered from the
                                                                            power indicator LED of the Logitech S120 speakers is 11.9,
A. Comparing Glowworm to the Visual Microphone and Lam-                     which is higher (better) than Lamphone’s average LLR (9.6)
   phone                                                                    but lower (worse) than the visual microphone’s average LLR
   First, we compare the performance of Glowworm to that of                 (24.5). The average NIST-SNR of the other devices was lower
the visual microphone [18] and Lamphone [17] using a similar                (worse) than that of the visual microphone and Lamphone.
experimental setup to the one used in the studies presenting                   We conclude that the quality of the speech recovered by
those techniques. In those studies, the recovery of six sen-                Glowworm is highly dependant on the device that is tested.
tences from the TIMIT repository [66] was demonstrated by                   We note that the Glowworm attack does not rely on the
playing the sentences via speakers and analyzing the recovered              distance between the sound source and a lightweight vibrating
speech in a lab setup. We compare Glowworm’s performance                    object, whereas the results reported by Lamphone and the
when recovering the same sentences from the power indicator                 visual microphone are based on experiments performed when
LED of the four devices that with the highest SNR in Table I:               a vibrating object was placed a few centimeters from speakers.
Two types of speakers (Logitech S120 and Winner speakers)                   As a result, the quality of a signal recovered using the
and two types of USB hub splitters (TP-Link UE330 and                       Glowworm attack at a fixed distance is stable and does not
MIRACASE MHUB500).                                                          vary depending on the distance to nearby objects.
   Experimental Setup: We replicated the experimental setup
used in both the visual microphone [18] and Lamphone [17]
                                                                            B. The Influence of Distance on Glowworm’s Performance
studies as follows: We placed the devices on a desktop inside
a lab and played the same six sentences from the TIMIT                         Next, we evaluate the influence of distance on Glowworm’s
repository [66] that were recovered by the visual microphone                performance.
and Lamphone via the speakers, at the same volume level used                   We evaluate Glowworm’s performance on the task of recov-
in the visual microphone study (an average sound level of 95                ering sound at the speech level of a typical virtual meeting:
dB). We note that the speakers we used this research are not                70 dB. In the following set of experiments we attempted
capable of producing speech at sound levels higher than 85                  to recover sound from the power indicator LED of Winner
dB, so we set the maximum sound level. In our experiment,                   speakers from various distances. We placed the speakers on
the eavesdropping equipment was placed 2.5 meters from                      a desktop inside an office; the eavesdropping equipment was
the devices, behind a closed door. Our experimental setup is                located outside the office, behind two closed clear glass doors.
presented in Fig. 10. In this experiment, the performance of                As a result, no sound from the speakers was heard from the
the Glowworm attack was evaluated on the task of recovering                 eavesdropper’s position.
speech by applying the attack in a direct manner, obtaining                    The setup can be seen in Fig. 12.
optical measurements from the power indicator LED of two                       First, we start by examining the influence of the sound level
speakers, and in indirect manner, obtaining optical measure-                on the SNR.
ments from the power indicator LED of two USB hub splitters.                   Experimental Setup: We created an audio file that consists of
   Results: We recovered speech by applying OAT to the op-                  various sine waves (120, 170, 220, .... 1970 Hz) and placed the
tical measurements. The recovered audio signals are available               eavesdropping equipment 15, 25, and 35 meters away from the
online1 where they can be heard. The signals recovered by                   speakers. We played the audio file via the speakers at 70 dB,
the power indicator LED of the two speakers and USB hub                     obtaining the optical measurements. The electro-optical sensor
splitters when we played the sentence "She had your dark suit               was configured for the highest gain level before saturation.
in greasy wash water all year" are presented in Fig. 11. The                   Results: Fig. 13 presents the SNR for various distances. As
intelligibility, LLR, and NIST-SNR of the recovered signals                 can be seen from the results, the SNR looks very promising
11
TABLE II
P ERFORMANCE OF G LOWWORM ON S PEECH R ECOVERY FROM VARIOUS D EVICES
Intelligibility LLR NIST-SNR
Speakers USB Hub Splitters Speakers USB Hub Splitters Speakers USB Hub Splitters
Speech Winner Logitech S120 TP-Link MIRACASE Winner Logitech S120 TP-Link MIRACASE Winner Logitech S120 TP-Link MIRACASE
Female speaker - "She had your dark suit in
0.618 0.426 0.378 0.374 1.765 2.238 2.023 2.758 3.3 12.8 5 5
fadg0, sa1 greasy wash water all year"
Female speaker - "Don’t ask me to carry
0.623 0.542 0.341 0.333 1.787 2.39 2.585 2.322 9.5 5 11.5 5
fadg0, sa2 an oily rag like that"
Male speaker - "She had your dark suit in
0.666 0.542 0.366 0.350 2.126 2.134 2.154 2.323 15.5 8.8 10.5 5.5
mccs0, sa1 greasy wash water all year"
Male speaker - "Don’t ask me to carry
0.709 0.539 0.428 0.434 1.663 2.508 2.719 2.581 4 15.8 12.3 3.8
mccs0, sa2 an oily rag like that"
Male speaker - "She had your dark suit in
0.574 0.45 0.368 0.318 1.576 2.029 2.24 2.009 9.8 8.8 8.8 6
mabw0, sa1 greasy wash water all year"
Male speaker - "Don’t ask me to carry
0.697 0.56 0.368 0.347 1.658 2.176 1.774 2.237 13 20.3 9.3 4.8
mabw0, sa2 an oily rag like that"
Average 0.647 0.509 0.374 0.359 1.763 2.246 2.249 2.372 9.183 11.917 9.567 5.017
STD 0.051 0.056 0.028 0.041 0.276 0.175 0.317 0.263 4.825 5.539 2.592 0.738
Fig. 12. Experimental setup: The eavesdropping equipment, which was placed Fig. 14. "We will make America great again!" recovered from various
outside an office (in a location denoted by the red rectangle), was directed at distances.
the speakers which were placed in various locations (denoted with blue stars)
at a distance of 15, 25, and 35 meters from the eavesdropping equipment. Two TABLE III
closed glass doors separated the eavesdropping equipment and the speakers "W E W ILL M AKE A MERICA G REAT AGAIN !" - R ESULTS OF R ECOVERED
(denoted by yellow bars). S PEECH FROM VARIOUS D ISTANCES
Intelligibility LLR NIST SNR
15m 0.607 1.704 17.3
25m 0.552 3.24 14
35m 0.476 3.359 9.3
online2 where they can be heard. The spectrogram of the
recovered speech is presented in Fig. 14, and the intelligibility,
LLR, and NIST-SNR of the recovered signals are reported in
Table III.
Fig. 13. The SNR for various distances at a sound level of 70 dB. Conclusions: The results demonstrate that the intelligibility
of the recovered signals is considered good up to a distance
of 15 meters and fair up to a distance of 35 meters.
and stable through the entire spectrum measured. Unsurpris- The results obtained show that Glowworm allows eaves-
ingly, the SNR decreases as a function of the distance, since droppers to recover sound from a distance of 35 meters at
light deteriorates with distance. a lower sound level than eavesdropping methods proposed in
Next, we evaluated Glowworm’s performance in terms of previous studies which require higher sound levels of 85-94
its ability to recover speech audio from various distances. In dB [48] and +95 dB [18, 50]. In addition, the results show that
order to do so, we recovered a well-known statement made by by analyzing optical measurements, eavesdroppers can double
Donald Trump: "We will make America great again!" the range of the previous SOTA method used to recover sound
Experimental Setup: We placed the eavesdropping equip- from a device using EMR analysis [21].
ment at three distances (15, 25, and 35 meters) from the
Winner speakers’ power indicator LED. We played the audio
file via the speakers at 70 dB. The electro-optical sensor was VII. P OTENTIAL I MPROVEMENTS
configured for the highest gain level before saturation. In this section, we suggest methods that eavesdroppers
Results: We recovered speech by applying OAT to the op- can use to optimize the quality of the recovered audio or
tical measurements. The recovered audio signals are available increase the range (i.e., distance between the eavesdropper and12
a device’s power indicator LED), without changing the setup ‘
of the target location.
The potential improvements suggested below are presented
based on the component they optimize.
Telescope. The amount of light that is captured by a
telescope with a diameter of 2r is determined by the area
of its lens (πr2 ). As a result, using telescopes with a larger
lens diameter enables the sensor to capture more light and
optimizes the SNR of the recovered audio signal.
Fig. 15. Circuits vulnerable to the Glowworm attack (a), a countermeasures
Electro-Optical Sensor. The sensitivity of the system can using a capacitor (b), an additional OPAMP amplifier (c), and the existing
be enhanced by increasing the sensor’s internal gain. Eaves- OPAMP (d).
droppers can use a sensor that supports higher internal gain
levels (note that the electro-optical sensor used in this study,
PDA100A2 [58], outputs voltage in the range of [-10,10] and IX. R ESPONSIBLE D ISCLOSURE
supports a maximum internal gain of 70 dB). Alternatively, the We performed the following steps:
sensitivity of the system can be enhanced by using an electro- 1) We disclosed the details of the attack with the man-
optical sensor with a lower noise level. Another option for ufacturers of the devices that were analyzed in this
maximizing the SNR is to profile the electro-optical sensor’s research via their bug bounty programs and contact-us
self-noise (when the light is recorded) in order to filter its self email addresses: Google, Logitech, Creative, TP-Link,
noise. Raspberry Pi, Winner, and MIRACASE. The email sent
Sound Recovery System. While many advanced denoising to each of the manufacturers contained explanations
methods have been presented in the audio processing field, a about the research, the Glowworm attack, proof that
large amount of data is often required to train a model that their devices are vulnerable to the Glowworm attack
profiles the noise in order to optimize the output’s quality. (electric and optical spectrograms of chirp functions),
Such algorithms/models can be used in place of the simple and recovered speech signals.
methods used in this research. In addition, various advanced 2) We did not share the paper in order to keep the names
dedicated algorithms for improving speech quality can also be of the other manufacturers confidential. In addition,
used to extend the effective band of the recovered signal (e.g., we decided to refrain from informing manufacturers of
artificial bandwidth extension algorithms [67–71]). In addition, devices that were not tested in this research about the
more sensitive ADC (with lower sound level) can be used to Glowworm attack. We made this decision in order to
sample the electro-optical sensor. prevent the information from spreading before giving
the affected device manufacturers time to respond.
VIII. C OUNTERMEASURES
3) We encouraged the manufacturers to meet with us in
In this section, we describe several countermeasure methods order to ensure that they understood the problem and
that can be used to mitigate or prevent the Glowworm attack. assist them in developing a countermeasure.
Manufacturer side. In most devices the power indicator 4) We explained to the manufacturers that we sent our
LED is connected directly to the power line (see Fig. 15a). As findings to a conference and our paper may become
a result, the device’s power indicator LED is highly affected by public around November.
the power consumption fluctuations that occur when speakers 5) We refrained from: (1) uploading the paper to arXiv, (2)
produce sound. To counter this phenomenon, a few approaches discussing our findings with other researchers, and (3)
should be considered by hardware manufacturers: (1) Using a sending the research to non-academic conferences.
capacitor: A capacitor can be integrated in parallel to the power
Google, TP-Link, and Creative responded to our disclosure,
LED indicator; in this case, the capacitor behaves as a low-pass
asked us for more details, sent the findings of this research to
filter (see Fig. 15b). This is a straightforward and inexpensive
their product team, and informed us that they would update
solution for reducing AC fluctuations. However, in devices
us regarding their next steps. AS of this writing, Logitech,
with high power consumption, the integrated capacitor must
Raspberry Pi, Winner, and MIRACASE have not responded
be large enough to supply a sufficient amount of current to the
to our disclosure.
speakers. (2) Using an OPAMP: This can be implemented by
integrating an additional OPAMP between the power line and
the power indicator LED (see Fig. 15c) or by using an existing X. D ISCUSSION , L IMITATIONS & F UTURE W ORK
GPIO port of an integrated microcontroller as a power supply The purpose of this research was to raise awareness regard-
for the power indicator LED (see Fig. 15d). In both cases, this ing the feasibility of recovering sound by analyzing optical
will eliminate power line AC fluctuations by a factor of the measurements obtained from an electro-optical sensor directed
OPAMP amplifier’s CMRR (common mode rejection ratio). at a device’s power indicator LED. While we are the first to
Consumer side. The attack can also be prevented by placing demonstrate this method in the academic realm, we wonder
black tape over a device’s power indicator LED. While this whether our method is already known within the military and
solution decreases a device’s UX, it prevents the attackers from espionage realms. While we can only hypothesize about the
obtaining optical measurements from vulnerable devices. answer to this question, for the following reasons we believeYou can also read