Voice patterns in schizophrenia: A systematic review and Bayesian meta-analysis - bioRxiv
←
→
Page content transcription
If your browser does not render page correctly, please read the page content below
bioRxiv preprint first posted online Mar. 21, 2019; doi: http://dx.doi.org/10.1101/583815. The copyright holder for this preprint
 (which was not peer-reviewed) is the author/funder, who has granted bioRxiv a license to display the preprint in perpetuity.
                              It is made available under a CC-BY-NC-ND 4.0 International license.
     Running title: VOICE IN SCHIZOPHRENIA: REVIEW AND META-ANALYSIS

         Voice patterns in schizophrenia: A systematic review and
                          Bayesian meta-analysis

                  Parola Albertoa, Simonsen Arndisb,c, Bliksted Vibekeb,c, Fusaroli Riccardoc,d

        a   Department of Psychology, University of Turin, Italy
        b   Psychosis Research Unit - Department of Clinical Medicine, Aarhus University, Denmark
        c
        The Interacting Minds Center - School of Culture and Society, Aarhus University,
     Denmark
        d
        Department of Linguistics, Semiotics and Cognitive Science – School of Communication
     and Culture, Aarhus University, Denmark

     Correspondence concerning this article should be addressed to:
     Alberto Parola, Dipartimento di Psicologia, Via Po 14, 10123 Turin (Italy).
     Phone number: +390116703065
     Fax number: +39 0118159039
     E-mail: alparola@unito.it
     Word counts abstract (max 250): 214
     Word counts text body (max 5000): 4682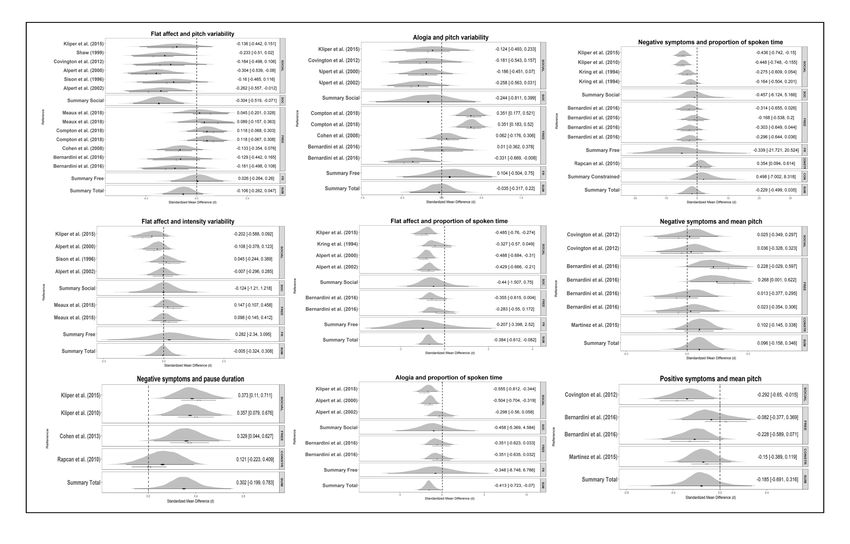
bioRxiv preprint first posted online Mar. 21, 2019; doi: http://dx.doi.org/10.1101/583815. The copyright holder for this preprint
 (which was not peer-reviewed) is the author/funder, who has granted bioRxiv a license to display the preprint in perpetuity.
                              It is made available under a CC-BY-NC-ND 4.0 International license.
                                                                                                                                    2
     VOICE IN SCHIZOPHRENIA: REVIEW AND META-ANALYSIS

                                                                 Abstract

     Voice atypicalities characterize schizophrenia (SCZ) since its first definitions, often

     associated with core negative symptoms such as flat affect and alogia and with social

     impairment. While this suggests that voice atypicalities may represent a marker of clinical

     features and social functioning in SCZ, the state of evidence for this is uncertain. We

     systematically reviewed and meta-analyzed the evidence for distinctive acoustic patterns in

     SCZ, as well as their relation to clinical features. We identified 46 articles, including 55

     studies for a total of 1254 participants with SCZ and 699 comparison participants. We

     calculate summary effect size (Hedges’g) estimates using multilevel Bayesian modeling. We

     identified weak atypicalities in pitch variability (g = - 0.55) related to flat affect, and stronger

     atypicalities in proportion of spoken time, speech rate, and pauses (g’s between -0.75 and -

     1.89) related to alogia and flat affect. However, the effects are modest compared to perceptual

     and clinical judgments, and characterized by large heterogeneity between studies. Moderator

     analyses revealed that tasks with a more demanding cognitive and social components have

     significantly larger effects both in contrasting patients and controls and in assessing

     symptomatology. We conclude that studies of acoustic patterns are a promising but, yet

     unsystematic avenue for establishing markers of SCZ. We outlined recommendations towards

     more cumulative, open, and theory-driven research.

     Keywords:

     Voice analysis, social communication, machine learning, biomarker, negative symptoms,

     speech signal.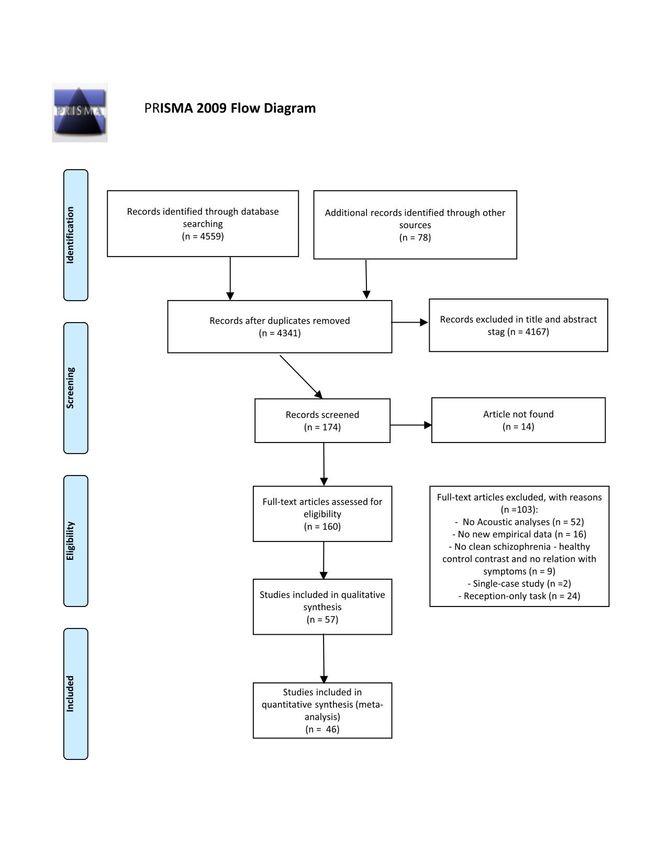
bioRxiv preprint first posted online Mar. 21, 2019; doi: http://dx.doi.org/10.1101/583815. The copyright holder for this preprint
 (which was not peer-reviewed) is the author/funder, who has granted bioRxiv a license to display the preprint in perpetuity.
                              It is made available under a CC-BY-NC-ND 4.0 International license.
                                                                                                                                    3
     VOICE IN SCHIZOPHRENIA: REVIEW AND META-ANALYSIS

                                                              Introduction

     Individuals with schizophrenia (SCZ) display atypical voice patterns, qualitatively described

     in terms of poverty of speech, increased pauses, distinctive tone and intensity of voice1–7.

     Voice atypicalities have been reported since the first definitions of the disorder8,9, are used in

     the clinical assessment process, and assume an even stronger relevance in the light of growing

     findings associating voice patterns to cognitive function, emotional states, and social

     engagement10–19.

                        Voice atypicalities may thus constitute a window into the underlying clinical

     and cognitive features of the disorder. Indeed, they have been associated with core negative

     symptoms of SCZ such as blunted affect (e.g. diminished emotional expression, lack of vocal

     intonation), and alogia (e.g. poverty of speech, latency of speech and blocking)2,3,20–22.

     Negative symptoms are included among the primary diagnostic criteria of SCZ (DSM-V), and

     are associated with early age of onset, poor social and functional outcome, reduced quality of

     life, and poor response to medication and treatment23–26. Vocal expression also reflects a key

     component of social communication, a domain frequently impaired in individuals with

     SCZ27–31. Difficulties in controlling voice to express affective and emotional contents or to

     mark relevant information may dramatically reduce the ability of these individuals to

     communicate effectively in social context. Impairments in social communication may in turn

     lead to experience of failure in social situations, and to perceive negative social judgments on

     the part of others, resulting in social withdrawal and further aggravating the social cognitive

     impairments28,32–36. Voice atypicalities may thus represent an important biometric index that

     parallels both clinical features and social cognitive functioning of individuals with SCZ over

     time. A better comprehension of voice abnormalities could provide tools to better assess the

     cognitive and social features of this heterogeneous disorder. However, despite the importance
bioRxiv preprint first posted online Mar. 21, 2019; doi: http://dx.doi.org/10.1101/583815. The copyright holder for this preprint
(which was not peer-reviewed) is the author/funder, who has granted bioRxiv a license to display the preprint in perpetuity.
It is made available under a CC-BY-NC-ND 4.0 International license.
4
VOICE IN SCHIZOPHRENIA: REVIEW AND META-ANALYSIS
in studying vocal expression in schizophrenia, and the routine assessments performed using
interview-based clinical rating scales, our understanding of voice abnormalities in
schizophrenia is limited. Previous work on voice atypicalities can be organized into three
categories: qualitative perceptual rating, quantitative acoustic analysis, and multivariate
machine learning (ML) investigations. Most previous studies employing qualitative ratings
reported robust differences between patients with SCZ and healthy controls (HC) across
several perceptual features of their voice4,37,38. However informative, qualitative rating scales
have serious limitations. They rely on raters’ expertise and intuition, thus lacking scalability
to large corpora, and they display low sensitivity to complex and multivariate acoustic
patterns and variations in context and time2,13,39,40. A different approach involves the use of
automated analysis of speech to identify acoustic features of vocal production, arguably with
a greater reliability, sensitivity and validity. However, such studies have so far reported
smaller and seemingly more contradictory findings: some indicate slower speech41 , more
pronounced pauses42–44 and reduced prosodic variability21,43,45; while others indicate no
reliable acoustic differences between individuals with SCZ and HC46–48. A meta-analysis of
13 studies38 suggests large differences between individuals with SCZ and HC on pause and
speech duration, and more modest on intensity and pitch variability. However, the number of
studies included in the meta-analysis was small compared to the currently available literature
and, given the high heterogeneity of patients with SCZ, a more systematic review accounting
for the potential sources of heterogeneity in the effects is required: individual differences (e.g.
sex, age and education), contextual factors (e.g. type of task) and clinical features (e.g.
symptomatology and medication). A few studies have adopted a more fine-grained
perspective, and assessed the relationship between acoustic measures and clinical features
with some promise; however, the findings are still sparse3,39,46,49,50.
Finally, more recent studies tried to capitalize on the technological
advancements in speech signal processing, and the application of multivariate ML techniquesbioRxiv preprint first posted online Mar. 21, 2019; doi: http://dx.doi.org/10.1101/583815. The copyright holder for this preprint
(which was not peer-reviewed) is the author/funder, who has granted bioRxiv a license to display the preprint in perpetuity.
It is made available under a CC-BY-NC-ND 4.0 International license.
5
VOICE IN SCHIZOPHRENIA: REVIEW AND META-ANALYSIS
to better capture the complex, multivariate and often non-linear nature of acoustic patterns51,52
47
(see also the appendix to for an introduction to ML techniques in the context of voice
analysis). These studies extract more nuanced acoustic measures, e.g. spectral and glottal
features, and assess how accurately the diagnosis can be identified only relying on acoustic
measures. The results are promising16,17,19,42,43,53, but a complete and comparative overview of
the findings in SCZ is currently missing. Crucially, the reliability of ML results has been
shown to be strongly dependent on the availability of large datasets and the validation of the
findings across datasets54–58.
Despite the promise of acoustic markers of clinical features in schizophrenia, it
is yet unclear how to quantify them, that is, which acoustic features we should focus on, and
the evidence for their relation to specific clinical features of the disorder. The aim of the
present study was to fill this gap by systematically reviewing and meta-analyzing the current
state of evidence for acoustic atypicalities in SCZ as a whole as well as their relation to the
specific clinical features. Further, we evaluated the size and availability of previous datasets,
and the attitudes towards data sharing of the authors of the studies reviewed to assess whether
a more cumulative science of voice atypicalities in SCZ can be attempted. Note that the aim
of this meta-analysis is less to provide a more accurate estimation of the voice atypicalities in
SCZ than it is to provide the bases for more effective future studies, by identifying current
practices, issues and promising venues.
Methods
Inclusion criteria for literature search
We adopted the Preferred Reporting Items for Systematic Reviews and Meta-Analyses
Guidelines (PRISMA59) for transparent reporting of a systematic review. We pre-registered
our protocol by specifying a priori the study rationale, eligibility criteria, search strategy,
moderator variables, and statistical analyses (see https://bit.ly/2EEFeQZ). The literaturebioRxiv preprint first posted online Mar. 21, 2019; doi: http://dx.doi.org/10.1101/583815. The copyright holder for this preprint
(which was not peer-reviewed) is the author/funder, who has granted bioRxiv a license to display the preprint in perpetuity.
It is made available under a CC-BY-NC-ND 4.0 International license.
6
VOICE IN SCHIZOPHRENIA: REVIEW AND META-ANALYSIS
search was conducted on Pubmed and Google Scholar, the latter including dissertations and
unpublished manuscripts. The search terms used were (prosody OR inflection OR intensity
OR pitch OR fundamental frequency OR speech rate OR voice quality OR acoustic OR
intonation OR vocal) AND (schizo*). The search was conducted on August 21 2017, and
updated on April 12 2018. We complemented the list by performing a backward and forward
literature search: we screened the bibliography of the papers found and the papers citing them
as identified by Google Scholar.
Articles were screened for eligibility by two authors (P.A and S.A). Study selection was
conducted according to the following inclusion criteria: (a) empirical study, (b) quantification
of acoustic features in the vocal production of participants with SCZ or schizoaffective
disorder1 (c) sample including at least two individuals with SCZ or schizoaffective disorder,
(d) inclusion of a non-clinical comparison group, or an assessment of variation in acoustic
features in relation to severity of clinical features. Clinical comparison groups (e.g. with
depression) were excluded because the limited number of studies did not permit meta-analytic
estimations. Fig. 1 shows the flow-diagram of study selection. We report the assessment of
the risk of bias in the Supplementary Materials.
1
We included schizotypy in literature search to better cover schizophrenia spectrum disorder. However, given
schizotypy is only included in the schizophrenia spectrum in the ICD and is mentioned in the personality
disorders in the DSM classification, we only included schizotypy in additional analysis in the supplementary
material.bioRxiv preprint first posted online Mar. 21, 2019; doi: http://dx.doi.org/10.1101/583815. The copyright holder for this preprint
(which was not peer-reviewed) is the author/funder, who has granted bioRxiv a license to display the preprint in perpetuity.
It is made available under a CC-BY-NC-ND 4.0 International license.
7
VOICE IN SCHIZOPHRENIA: REVIEW AND META-ANALYSIS
Figure 1bioRxiv preprint first posted online Mar. 21, 2019; doi: http://dx.doi.org/10.1101/583815. The copyright holder for this preprint
(which was not peer-reviewed) is the author/funder, who has granted bioRxiv a license to display the preprint in perpetuity.
It is made available under a CC-BY-NC-ND 4.0 International license.
8
VOICE IN SCHIZOPHRENIA: REVIEW AND META-ANALYSIS
Data extraction
For all the studies we reported the available clinical and demographic data, including pre-
registered potential moderations. In particular we report: sample sizes, matching criteria,
presence of a non-clinical control group, diagnosis, demographical variables (age, education,
gender, language and ethnicity), clinical information (symptom clinical ratings, duration of
illness, age of onset, hospitalization), level of intelligence (IQ), cognitive screening,
medication. Further we extracted information about the speech production task, group-level
acoustic estimates (mean and standard deviation), and correlation coefficients between
acoustic measures and clinical ratings. We grouped speech production tasks into three
categories: 1) Constrained production includes highly structured monological tasks such as
reading aloud or repeating sequence of numbers. 2) Free monological production includes
less constrained monological tasks such as description of pictures or videos, or providing
narrative accounts (e.g. of a happy event, or of one’s life). Compared to constrained
production, free production is more challenging, as the linguistic materials are less pre-
defined by the task. 3) Social interaction includes structured and semi-structured interviews,
as well as spontaneous conversations. The production is dialogical and involves interpersonal
factors and dynamics. Selected characteristics of included studies are available in Table 1.9
VOICE IN SCHIZOPHRENIA: REVIEW AND META-ANALYSIS
Table 1. Selected characteristics of the studies included in the meta-analysis.
Authors Control Sample size and matching Clinical features Task Medication Findings
group criteria
1 Pinheiro et al. YES 17 SZ PANNS, SANS, Constrained production (reading NR Duration of utterance: (words duration/ms): NS
(2016) 18 CT SAPS single words) Pitch mean (Hz): NS
Age, sex, education, Intensity mean (db): NS
parental SES
2 Zhang et al. YES 26 SZ PANNS, SANS, Social interaction (phone Not Formants (F1, F2, F3, F4, F5, F6) (Hz/db): NS
(2016) 30 CT CGI-S conversation) medicated Formant bandwidth: NS
Age, sex, education Formants intensity variability (entropy): NS
Spectral features: Mel-frequency cepstral coefficient (MFCC): p < .001 (Lower in SZ)
Linear prediction coding (LPC): p < .001 (Higher in SZ)
3 Bernardini et NO 20 PANNS, SANS Spontaneous production NR Correlations: PANSS TOTAL: Percent time talking: NS; Pitch mean: NS; Pitch variability:
al. (2016) NA (narrative) NS.
SANS TOTAL: Percent time talking: NS; Pitch mean: NS; Pitch variability: NS.
PANSS NEGATIVE: Percent time talking: NS; Pitch mean: NS; Pitch variability: NS.
SANS FLAT AFFECT: Percent time talking: NS; Pitch mean: NS; Pitch variability: NS;
SANS ALOGIA: Percent time talking: NS; Pitch mean: NS; Pitch variability: NS.
3 Bernardini et NO 20 PANNS, SANS Spontaneous production NR Correlations: PANSS TOTAL: Percent time talking: NS; Pitch mean: NS; Pitch variability:
al. (2016) NA (narrative) NS;
SANS TOTAL: Percent time talking: NS; Pitch mean: NS; Pitch variability: NS.
PANSS NEGATIVE: Percent time talking: NS; Pitch mean: p = .04 (Positive); Pitch
variability: NS.
SANS FLAT AFFECT: Percent time talking: NS; Pitch mean: NS; F0 SD: NS;
SANS ALOGIA: Percent time talking: NS; Pitch mean: p = .005 (Positive); Pitch variability:
p < .05 (Negative).
4 Martínez- YES 45 SZ BPRS Constrained interaction Medicated Pause percentage (>300ms): p < .001 (Higher in SZ)
Sánchez et al. 35 CT (reading) Pitch mean (Hz): NS
(2015) Age, sex, education Pitch variability (Hz): NS
Intensity variability (Hz): NS
Intensity mean (db): p < .001 (Lower in SZ)
Correlations: BPRS TOTAL: Proportion of pauses: NS; Pitch mean: NS; Pitch variability:
NS; Intensity mean: NS.
BPRS NEGATIVE: Proportion of pauses: NS; Pitch mean: NS; Pitch variability: NS;
Intensity mean: NS
BPRS POSITIVE: Proportion of pauses: p = .021 (Negative); Pitch mean: NS; Pitch
variability: NS; Intensity mean: NS
6 Alpert et al. NO 30 SZ SANS Social interaction (interview) Medicated Correlations: SANS FLAT AFFECT: Percent time talking: p < .01 (Negative); Speech latency:
(2002) NA NS; Pitch variability: p < .05 (Negative); Intensity variability: NS;
SANS ALOGIA: Percent time talking: NS; Speech latency: NS; Pitch variability: NS; Intensity10
VOICE IN SCHIZOPHRENIA: REVIEW AND META-ANALYSIS
variability: NS
7 Rapcan. et al. YES 39 SZ SANS, BPRS Constrained interaction (reading Medicated Duration of utterance (s.) p < .001 (Shorter in SZ)
(2010) 18 CT brief text) Percent time talking: NS
NR Duration of pauses (s.): p = .011
Percentage of silence: p < .001 (Higher in SZ)
Number of pauses (>250ms): p < .001 (Higher in SZ)
Pitch variability (cv): NS
Intensity variability: p < .04 (Higher in SZ)
Correlations: BPRS TOTAL: Duration of utterance: p < .01 (Positive); Proportion of silence;
p < .05 (Negative); Duration of pauses: NS; Number of pauses: NS; Pitch variability: NS;
Intensity variability: p < .05 (Positive).
NEGATIVE SANS: Duration of utterance: p < .05 (Positive); Duration of pauses: NS;
Proportion of silence: p < .05 (Negative); Number of pauses: NS; Pitch variability: NS;
Intensity variability: p < .05 (Positive).
9 Cannizzaro et YES 13 SZ PANSS Constrained (count) + Medicated Duration of pauses (>200msec): TASK 1 (Constrained): NS; TASK 2 (Free): p < .001
al. (2005) 6 CT Spontaneous (narrative (Higher in SZ).
NR elicitation) Percentage of pauses: TASK 1: NS; TASK 2: p11
VOICE IN SCHIZOPHRENIA: REVIEW AND META-ANALYSIS
21 Alpert et al. YES 46 SZ SANS Social interaction (semi- Medicated Speech rate (words/s): p < .001 (Lower in SZ)
(2000) 20 CT structured interview) Percent time talking: p = .012 (Lower in SZ)
Age, education Pitch variability (SEMITONES): p = .001 (Lower in SZ)
Intensity variability (db): NS
Correlations: SANS FLAT AFFECT: Percent time talking: p < .01 (Negative); Pitch
variability: p < .01 (Negative); Intensity variability: NS;
SANS ALOGIA: Percent time talking: p < .01 (Negative); Pitch variability: NS; Intensity
variability: NS
23 Covington et NO 25 SZ PANSS Social interaction (PANNS Medicated Correlations: SANS TOTAL: Pitch mean: NS; Pitch variability: NS;
al. (2012) interview) PANSS NEGATIVE: Pitch mean: NS; Pitch variability: NS;
PANSS POSITIVE: Pitch mean: NS; Pitch variability: NS;
SANS FLAT AFFECT: Pitch mean: NS; Pitch variability: NS;
SANS ALOGIA: Pitch mean: NS; Pitch variability: NS;
24 Matsumoto et YES 6 SZ SANS, SAPS Spontaneous production (picture Medicated Pause duration (>250ms): NS.
al. (2013) 6 CT elicitation) Number of pauses: p = .04 (Lower in SZ).
Age, education, IQ.
25 Alpert et al. NO 17 SZ SANS Social interaction (semi- Medicated Correlations: SANS ALOGIA: Speech rate: p < .01 (Negative); Duration of pauses: within-
(1994) NA structured interview) + clauses: NS; between-clauses: p < .01 (Positive); switching-clauses p < .01 (Positive);
Spontaneous production Number of pauses: within-clauses: NS; between-clauses: NS; switching-clauses: NS;
(narrative elicitation) filled pause within-clauses: NS; filled pause between-clauses: NS
26 Kring et al. NO 23 SZ SANS, BPRS Social interaction (semi- Unmedicated Correlations: BPRS TOTAL: Percent time talking: NS;
(1994). NA structured interview) BPRS POSITIVE: Percent time talking: NS
BPRS NEGATIVE: Percent time talking: NS
BPRS BLUNTED: Percent time talking: NS
SANS TOTAL: Percent time talking: NS
27 Pinheiro et al. YES 15 SZ PANNS, SANS, Constrained interaction (reading Medicated Duration of utterance (words/msec): p = .028 (Higher in SZ).
(2017) 16 CT SAPS single words) Pitch mean (hz): NS
Age. sex. and parental SES Intensity mean (db): NS
28 Resnick et al. YES 10 SZ NR Social interaction (clinical Medicated Duration of pauses (> 250ms): p = .013 (Higher in SZ).
(1984) 20 CT interview) Percent time talking: NS
Age
29 Mandal et al. YES 40 SZ NR Spontaneous production (facial Medicated Speech rate (words/sec): p < .001 (Lower in SZ).
(1990) 60 CT expression picture elicitation) Percent time talking: p < .001 (Lower in SZ).
NR Response latency: p < .001 (Lower in SZ).
30 Tavano et al. YES 37 SZ BPRS Spontaneous production Medicated TASK 1 (Free): Speech rate (words/sec): p = .027(Lower in SZ).
(2008) 37 CT (narrative) + Social interaction TASK 2 (Social): Speech rate: p < .001 (Lower in SZ).
Age and sex. interview)
31 Perlini et al. YES 30 SZ BPRS Spontaneous production Medicated Speech rate: p = .009 (Lower in SZ).12
VOICE IN SCHIZOPHRENIA: REVIEW AND META-ANALYSIS
(2012) 30 CT (narrative) + Social interaction
Age, sex and education (interview)
32 Rutter et al. YES 12 SZ NR Social interaction (conversation) NR Speech rate: Task 1: NS; Task 2: NS;
(1997) 12 CT Percent time talking: Task 1: p = .019 (Lower in SZ); Tasks 2: NS
Sex
33 St-Hilaire et al. YES 48 SZ BPRS Social interaction (semi- Medicated Speech rate (words/sec): p < .001 (Lower in SZ).
(2008) 48 CT structured interview)
Age, sex, parental SES and
ethnicity
34 Shaw et al. NO 30 SZ SANS Social interaction (interview) Medicated Correlations: SANS FLAT AFFECT: Duration of pauses: p < .01 (Positive); Pitch variability:
(1999) NS
35 Docherty YES 53 SZ PANSS, PSYRATS Social interaction (interview) NR Speech rate: NS
(2012) 23 CT
Age, sex, parent education,
ethnicity
37 Rochester et YES 40 SZ NR Social interaction (interviews) Medicated Percent time talking: p = .001 (Lower in SZ).
al. (1977) 20 CT Duration of pauses: p < .001 (Higher in SZ).
Sex. age
40 Compton et al. YES 94 SZ PANSS, SANS, Spontaneous production Medicated Pitch variability: Task 1 (Free): NS; Task 2 (Constrained): NS
(2018) 101 CT CAINS (narrative) + Constrained Correlations: TOTAL SANS: Pitch variability: P = .002 (Positive)
Age. ethnicity. race and interaction (reading) NEGATIVE PANSS: Pitch variability: NS
marital status SANS FLAT AFFECT: Pitch variability: NS
SANS ALOGIA: Pitch variability: p < .001 (Positive).
41 Salomé et al. YES 10 SZ NR Spontaneous production Medicated Speech rate: p = .014 (Lower in SZ).
(2002) 10 CT (narrative) Number of pauses: NS
Sex. and education
43 Kliper et al. YES 22 SZ SANS Social interaction (interview) + NR Correlations: SANS TOTAL: Duration of utterance: p < .001 (Negative); Percent time
(2010) 20 CT Constrained interaction talking: p < .01 (Negative); Duration of pauses: p < .05 (Positive); Intensity variability: p <
NR (reading) .01 (Negative)
44 Kliper. et al. YES 22 SZ PANSS, SANS Social interaction (clinical Nr Duration of utterance: p < .001 (Lower in SZ).
(2015) 20 CT interviews) Percent time talking: p < .001 (Lower in SZ).
Age. sex and education. Duration of pauses: p < .001 (Higher in SZ).
Pitch variability: p < .001 (Lower in SZ).
Intensity variability: p < .001 (Higher in SZ).
Correlations: TOTAL PANSS: Duration of utterance: NS; Percent time talking: NS; Duration
of pauses: NS; Pitch variability: NS; Intensity variability: NS.
SANS TOTAL: Duration of utterance: p = .04 (Negative); Percent time talking: p < .01
(Negative); Duration of pauses: p < .01 (Positive); Pitch variability: NS; Intensity13
VOICE IN SCHIZOPHRENIA: REVIEW AND META-ANALYSIS
variability: NS.
SANS FLAT AFFECT: Duration of utterance: p < .01 (Negative); Percent time talking: p <
.01 (Negative); Duration of pauses: p < .01 (Positive); Pitch variability: NS; Intensity
variability: NS.
SANS ALOGIA: Duration of utterance: p < .01 (Negative); Percent time talking: p < .01
(Negative); Duration of pauses: p < .01 (Positive); Pitch variability: NS; Intensity
variability: NS.
47 Ross et al. YES 45 SZ SANS, SAPS, Constrained production Medication TASK 1 (Constrained): Pitch variability: p < .0001 (Lower in SZ).
(2001) 19 CT BPRS (repetition) + social interaction stabilized TASK 2 (Social): Pitch variability: p < .0001 (Lower in SZ).
Not matched (interview)
51 Püschel et al. YES 45 SZ SANS, PANSS, Constrained production Medicated Duration of pauses: NS
(1998) 45 CT INSKA (counting and reading passage) Number of pauses: p = .0001
Sex and age Silence percentage: p = .0002
Duration of utterance: p = .0001
Total length of pauses p = .0001
Total length of utterances p = .0001
Pitch mean: NS
Pitch variability: p = .0137
Intensity variability: p = .0001
57 Meaux et al. YES 36 SZ BPRS Spontaneous production NR Pitch variability: Task 1 (Free): NS; Task 2: NS.
(2018) 25 CT (emotional picture elicitation) Intensity variability: Task 1 (Free): NS; Task 2: NS.
Sex and education CORRELATION:
BPRS BLUNTED AFFECT: Pitch variability: Task 1 (Free): NS; Task 2 (Free): NS; Intensity
variability; Task 1 (Free): NS; Task 2 (Free): NS
Note: We included in the table those studies that reported: 1) descriptive statistics for SZ and HC groups, correlation coefficients, or statistical tests for these measures. P-
values of statistical tests comparing individuals with SZ and HC and correlation coefficients have been extracted from original articles. When estimates for acoustic measures
were reported for subgroups of patients, or for different task conditions within the same speech task, we averaged across them weighting the values by sample size, and we
then computed independent samples t-test between individuals with SZ and HC groups. When in the original articles were provided estimates for acoustic measures but not
p-value of the comparisons between groups, we computed independent samples t-test (or correlation coefficient) between individuals with SZ and HC control groups. When
the authors provided us original data we recomputed independent samples t-tests (or correlation coefficients) using the original data. Clinical features: PANSS, The Positive
And Negative Symptoms Scale; SANS, Scale for the Assessment of Negative Symptoms; SAPS, Scale for the Assessment of Positive symptoms. CGI-S, The Clinical Global
Impression Scale; BPRS, Brief Psychiatric Rating Scale; PSYRATS, The Psychotic Symptom Rating Scales; CAINS, The Clinical Assessment Interview for Negative Symptoms;
InSka, The Intentionality Scale.bioRxiv preprint first posted online Mar. 21, 2019; doi: http://dx.doi.org/10.1101/583815. The copyright holder for this preprint
(which was not peer-reviewed) is the author/funder, who has granted bioRxiv a license to display the preprint in perpetuity.
It is made available under a CC-BY-NC-ND 4.0 International license.
14
VOICE IN SCHIZOPHRENIA: REVIEW AND META-ANALYSIS
When more than four studies reported statistical estimates for an acoustic measure, or
correlation with symptomatology, we performed meta-analysis of the effects. When estimates
for acoustic measures were reported for subgroups of patients, or for different task conditions
within the same speech task, we averaged across them weighting the values by sample size.
In case of multivariate ML studies, we used a different focus. Multivariate ML approaches
differ from the studies previously described in two main ways. While more traditional studies
focus on a single feature at time, multivariate ML studies analyze multiple acoustic features
simultaneously. While more traditional studies focus on best explaining all the current
samples (minimizing within sample error), multivariate ML studies focus on generalizability
of the results to new samples (minimizing out-of-sample error), e.g. by using validation and
cross-validation techniques. In reviewing ML studies, we focused on reporting the algorithms
adopted, the acoustic feature considered and the performance of the algorithms in either
discriminating individuals with SCZ from HC with respect to the acoustic measures
considered or predicting the severity of clinical features (e.g. negative symptoms) from
acoustic measures (see Table S3 in appendix).
We contacted all authors to obtain missing group-level estimates and individual-level data.
Statistics on authors’ contact availability, propensity to respond and self-reported barriers to
data sharing are also reported.
Statistical analysis
Meta-analyses were performed following well-established procedures60–63 and complemented
by a Bayesian framework64,65. To estimate the differences in vocal patterns between
individuals with SCZ and HC we extracted the standardized mean difference (SMD; also
known as Hedges’ g). To estimate relations between vocal patterns and clinical features we
extracted the raw correlation coefficient (Pearson’s r). These effects were analyzed using 2-bioRxiv preprint first posted online Mar. 21, 2019; doi: http://dx.doi.org/10.1101/583815. The copyright holder for this preprint
(which was not peer-reviewed) is the author/funder, who has granted bioRxiv a license to display the preprint in perpetuity.
It is made available under a CC-BY-NC-ND 4.0 International license.
15
VOICE IN SCHIZOPHRENIA: REVIEW AND META-ANALYSIS
level hierarchical Bayesian regression models to estimate the pooled effect sizes and
corresponding credible (i.e., Bayesian confidence) intervals. The multilevel structure allowed
us to explicitly model the heterogeneity (or 2) in the results of the studies analyzed. By
including a random effect by study, we assumed that the variability in experimental design,
acoustic analyses and population samples could generate heterogeneous findings and allowed
the model to estimate such heterogeneity. We then measured and tested for heterogeneity of
the studies using the Cochran’s Q statistic66, which reveals how much of the overall variance
can be attributed to true between-study variance. To analyze the influence of potential
moderators explaining between study heterogeneity, meta-regression models were applied
separately. Note that only speech task presented enough data points to be analyzed as
moderator. Other pre-registered moderators were not sufficiently reported and would have
required access to individual level data for adequate treatment.
Priors were chosen to be only weakly informative so that their influence on the meta-analytic
estimates were small, only discounting extreme values: a normal distribution centered at 0 (no
effect), with a standard deviation of 0.5 for the overall effect, and a positive truncated normal
distribution centered at 0, with a standard deviation of 0.5 for the heterogeneity of effects
(standard deviation of random effects). We report 95% credible intervals (CIs), i.e. the
intervals within which there is a 95% probability that the true value of the parameter (e.g.
effect size) is contained, given the assumptions of the model. We provide evidence ratios
(ER) and credibility scores. ERs quantify the evidence provided by the data in favor of the
effect of diagnosis or of clinical feature (e.g. longer pauses in SCZ compared to HC) against
the alternatives (e.g. same length or shorter pauses in schizophrenia). An ER equal to 3
indicates the hypothesis is 3 times more likely than the alternative. A credibility score
indicates the percentage of posterior estimates falling above 0. Because Bayesian methods are
less commonly used and understood, we also report p-values in order to reach a broader
audience. Note that the p-values are calculated on the same 2-level hierarchical model as thebioRxiv preprint first posted online Mar. 21, 2019; doi: http://dx.doi.org/10.1101/583815. The copyright holder for this preprint
(which was not peer-reviewed) is the author/funder, who has granted bioRxiv a license to display the preprint in perpetuity.
It is made available under a CC-BY-NC-ND 4.0 International license.
16
VOICE IN SCHIZOPHRENIA: REVIEW AND META-ANALYSIS
Bayesian inference, with the difference that p-value statistics rely on completely flat priors
and assume Gaussian distributions for all estimated parameters.
To assess the potential role of speech production task in explaining the patterns observed, we
compared the baseline model with a second multilevel Bayesian model including task as
predictor of difference in vocal patterns. We used Leave-One-Out-Information-Criterion
(LOOIC) and stacking weights indicating the probability that the model including task is
better able to predict new data than baseline67.
To explore the possibility of publication bias, potential for funnel plot asymmetry was
examined visually and tested using the rank correlation test68. The raw data and analysis
scripts are available at https://osf.io/qdkt4/. The supplementary materials report an additional
analysis including schizotypy. All computation was done in R69 relying on metafor, brms and
Stan63,70,71.
Results
3.1 Study selection
See Fig. 1 for full details on the selection. We were able to retrieve relevant statistical
estimates from 46 articles (55 studies) from the texts or the authors. The meta-analysis
included a total of 1254 participants (466 F) with SCZ and 699 comparison participants (323
F). We contacted a total of 57 authors – including those of studies that were later deemed
ineligible due to lack of statistical estimates – requesting additional information and
individual level acoustic estimates for each participant: 40 (70.2%) responded and 10 (18%)
provided at least some of the requested data. Chief reasons to decline sharing data were: i)
effort required (n = 15, 50 %), ii) data loss (n = 14, 43.3% of respondents), iii) ethical
concerns with data sharing (n = 3, 3 %), iv) skepticism towards quantitative meta-analyses (n
=1, 3.3%). For full details on the email to the authors and their answers see Supplementary
Material.bioRxiv preprint first posted online Mar. 21, 2019; doi: http://dx.doi.org/10.1101/583815. The copyright holder for this preprint
(which was not peer-reviewed) is the author/funder, who has granted bioRxiv a license to display the preprint in perpetuity.
It is made available under a CC-BY-NC-ND 4.0 International license.
17
VOICE IN SCHIZOPHRENIA: REVIEW AND META-ANALYSIS
3.2 Differences in acoustic patterns between individuals with schizophrenia and healthy
controls
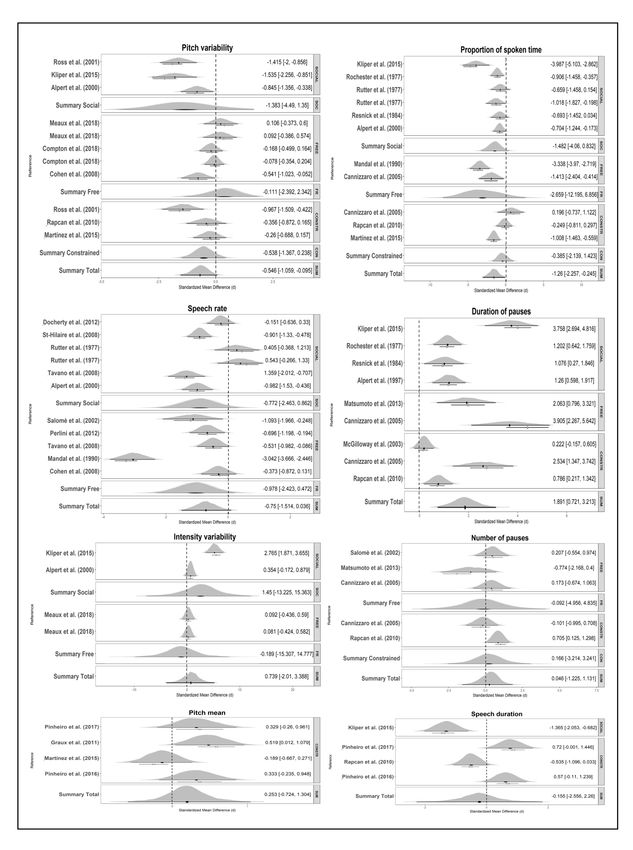
Detailed results are reported in Table 2. Hierarchical Bayesian meta-analyses revealed
significant effects of diagnosis (in terms of Hedges’ g) on pitch variability (-0.55, 95% CIs: -
1.06, 0.09), proportion of spoken time (-1.26, 95% CIs: -2.26, 0.25), speech rate (-0.75, 95%
CIs: -1.51, 0.04), and duration of pauses (1.89, 95% CIs: 0.72, 3.21), see Fig. 2. No
significant effect was found for pitch mean (0.25, 95% CIs: -0.72, 1.30), intensity variability
(0.739, 95% CIs: -2.01, 3.39), duration of utterance (-0.155, 95% CIs: -2.56, 2.26) and
number of pauses (0.05, 95% CIs: -1.23, 1.13). We generally found high heterogeneity
between studies, indicating a likely high diversity in samples and methods, and publication
bias, indicating a tendency to publish only significant results, thus making the published
literature not fully representative of the actual population of study (see Table 2).bioRxiv preprint first posted online Mar. 21, 2019; doi: http://dx.doi.org/10.1101/583815. The copyright holder for this preprint
(which was not peer-reviewed) is the author/funder, who has granted bioRxiv a license to display the preprint in perpetuity.
It is made available under a CC-BY-NC-ND 4.0 International license.
18
VOICE IN SCHIZOPHRENIA: REVIEW AND META-ANALYSIS
Figure 219
VOICE IN SCHIZOPHRENIA: REVIEW AND META-ANALYSIS
Table 2. Main Results of the meta-analysis for the effect of diagnosis on acoustic measures, and for the correlations between acoustic measures and symptoms ratings.
Effect of diagnosis on acoustic measures
Acoustic Participants Number of Influential study Estimates -Hedges’g P - value ER (Credibility) Sigma squared Q- stats (p- Publication bias
Features (female) and studies [95% CI] [95% CI] value)
median (articles)
Pitch Mean 103 SZ (22 F) 4 (4) Yes, Martinez 0.253 [-0.724, 1.304] .273 3.467 (78%) 1.131 [0.005, 7.19] 8.282 (p = No, K = 0.0, p = 1.0
95 CT (23 F) Sanchez et al. .041)
(2015)
Removing 0.505 [-0.859, 1.994] .273 9.471 (90%) 2.143 [0.0, 16.934]
influential
Pitch 387 SZ (92F) 11 (8) No -0.546 [-1.059, - .005 99.0 (99%) 0.566 [0.152, 1.64] 58.895 (p < Yes, K = -0.709, p =
variability 257 CT (106 F) 0.095] .001) .002
Intensity 104 SZ (22 F) 4 (3) Yes, Kliper et al. 0.739 [-2.01, 3.388] .164 3.648 (78%) 7.888 [0.56, 47.934] 35.89 (p < No,
variability 65 CT (20 F) (2015) .001) K =1.0, p = .083
Removing 0.152 [-1.005, 1.311] .164 2.62 (72%) 1.932 [0.00, 13.486]
influential
Proportion of 267 SZ (106 F) 11 (9) No -1.26 [-2.257, -0.245] .001 149.943 (99%) 2.538 [0.787, 7.224] 113.308 (p < No, K = -0.236 p=
spoken time 211 (98 F) .001) .359
Duration of 93 SZ (30 F) 4 (4) No -0.155 [-2.556, 2.26] .739 1.475 (60%) 6.045 [0.32, 37.49] 27.78 (p < No, K = 0.333, p = .75
utterance 72 CT (30 F) .001)
Speech rate 336 SZ (111 F) 11 (9) No -0.75 [-1.514, 0.036] .015 32.473 (97%) 1.447 [0.467, 3.915] 104.414 (p < No, K = -0.055, p =
259 (107 F) .001) .879
Duration of 221 SZ (128 F) 9 (8) No 1.891 [0.721, 3.213] < .001 234.294 (100%) 3.129 [0.754, 10.086] 75.624 (p < Yes, K = 0.667 p =
pauses 150 CT (92 F) .001) .013
Number of 68 SZ (23 F) 5 (4) Yes, Matsumoto 0.046 [-1.225, 1.131] .782 1.321 (57%) 1.531 [0.017, 8.496] 11.61 (p = .02) Yes, K = -1.0, p = .017
pauses 40 CT (13 F) et al. (2013)
Removing 0.355 [-0.991, 1.615] .782 4.739 (83%) 1.481 [0.001, 10.692]
influential
Correlations between acoustic measures and clinical symptoms ratings
Acoustic Clinical Number of Participants Influential study Pearson’s r P- ER Sigma squared Q- stats Publication bias
Features features studies 95% CI value (credibility) 95% CI20
VOICE IN SCHIZOPHRENIA: REVIEW AND META-ANALYSIS
Pitch Mean Negative 7 (3) 107 SZ (33 F) No 0.096 [-0.158, .136 4.198 (81%) 0.071 [0.00, 9.976 (p = No, K = -0.619, p =
symptoms 21 0.346] 0.345] .126) .069
Positive 4 (3) 107 (33 F) No -0.185 [-0.691, .04 6.89 (87%) 0.245 [0, 1.714] 3.586 (p = No, K = 0.333, p =
symptoms 21 0.316] .31) .75
Pitch General 5 (4) 146 (48 F) No -0.091 [-0.34, .3 3.84 (79%) 0.057 [0, 0.354] 2.283 (p = No, K = 0, p =1.0
variability psychopatology 22 0.15] .684)
Negative 11 (6) 261 (77 F) -0.01 [-0.196, .836 1.117 (53%) 0.041 [0.002, 19.292 (p = No, K = -0.2, p =
symptoms 22 0.144] 0.135] .037) 0.445
Positive 4 (3) 107 (33 F) Yes, Covington et -0.027 [-0.686, .698 1.509 (60%) 0.525 [0.001, 7.248 (p = No, K = 0.333, p =
symptoms 21 al., (2012) 0.763] 4.294] .064) .75
Removing -0.05 [-0.715, .755 1.517 (60%) 0.422 [0.001,
influential 0.62] 2.944]
Alogia rating 9 (7) 313 (68 F) No -0.035 [-0.317, .465 1.5 (60%) 0.135 [0.032, 45.478 (p < No, K = - 0.314, p =
26 0.22] 0.421] .001) .246
Flat affect 13 (10) 403 (81 F) No -0.106 [-0.262, - .044 11.719 (92%) 0.053 [0.009, 32.763 (p = No, K = -0.117 p =
rating 30 0.047] 0.153] .001) .582
Intensity Flat affect 6 (5) 158 (22 F) No -0.005 [-0.324, .745 1.03 (51%) 0.117 [0.001, 10.219 (p = No, K = -0.067, P =
variability rating 30 0.308] 0.658] .069) 1.0
Proportion of General 5(4) 124 (35 F) Yes, Rapcan et al. -0.026 [-0.53, .85 1.714 (63%) 0.268 [0.005, 11.475 (p = No, K = -0.4, p =
spoken time psychopatology 22 (2010) 0.375] 1.411] .022) .483
Removing -0.069 [-0.536, .662 1.816 (65%) 0.235 [0.005,
influential 0.335] 1.335]
Negative 9 (5) 146 (35 F) No -0.229 [-0.499, .198 23.29 (96%) 0.131 [0.027, 35.506 (p < No, K = 0.333, p=
psychopatology 22 0.035] 0.405] .001) .26
Alogia rating 5 (4) 138 (23 F) No -0.413 [-0.723, - < 58.259 (98%) 0.127 [0, 0.805] 7.344 (p = No, k = 0.333, p =
22 0.07] .001 .119) .435
Flat affect 6 (5) 161 (23 F) No -0.384 [-0.612, - < 83.211 (99%) 0.08 [0, 0.456] 7.901 (p = Yes, K = .867, p =
rating 22.5 0.082] .001 .162) .017
Duration of Negative 4 (4) 109 (30 F) Yes, Rapcan et al. 0.302 [-0.199, .003 15.667 (94%) 0.246 [0, 1.754] 4.971 (p = No, K = 0.333, p =
pauses psychopatology 24 (2010) 0.783] .174) .75
Removing 0.295 [-0.211, = 14.267 (93%) 0.37 [0, 2.129]
influential 0.757] .008
Note: CI, credible interval; P values are 2-tailed; Evidence ratio (ER) quantify the evidence provided by the data in favor of the effect of associations between clinical features and acoustic
measures (e.g. longer pauses associated to higher rating of alogia) against the alternatives (e.g. no association). An ER equal to 3 indicates the hypothesis is 3 times more likely than the
alternative. A credibility score indicates the percentage of posterior estimates falling above 0.bioRxiv preprint first posted online Mar. 21, 2019; doi: http://dx.doi.org/10.1101/583815. The copyright holder for this preprint
(which was not peer-reviewed) is the author/funder, who has granted bioRxiv a license to display the preprint in perpetuity.
It is made available under a CC-BY-NC-ND 4.0 International license.
21
VOICE IN SCHIZOPHRENIA: REVIEW AND META-ANALYSIS
Moderator analysis
For detailed results, see Table S1 (in appendix). Adding the speech production task employed
systematically increased the explained variability in SCZ atypicalities for pitch variability,
proportion of spoken time, speech rate, number of pauses, duration of pauses and intensity
variability (stacking weights: 100%). In general, we observe that dialogical and free speech
show the biggest differences, while constrained monologue displays the smallest SCZ
atypicalities in vocal patterns, except for pitch variability.
3.3 Correlation between acoustic measures and clinical ratings
For detailed results, see Table 2. Hierarchical Bayesian meta-analysis revealed significant
overall correlation between flat affect and pitch variability (-0.11, 95% CIs: -0.26, 0.05) and
proportion of spoken time (-0.38, 95% CIs: -0.61, -0.08), alogia and proportion of spoken
time (-0.41, 95% CIs: -0.72, 0.07), positive symptoms and pitch mean (-0.19, 95% CIs: -0.69,
0.32), negative symptoms and pause duration (0.30, 95% CIs:-0.20, 0.78), see Fig. 3. No
significant correlation was found between flat affect and intensity variability (-0.01, 95% CIs:
-0.32, 0.31), alogia and pitch variability (-0.04, 95% CIs: -0.32, 0.22), general
psychopathology and proportion of spoken time (-0.03, 95% CIs: -0.53, 0.375) and pitch
variability (-0.09, 95% CIs:-0.34-, 0.15), positive symptoms and pitch variability (-0.03, 95%
CIs: -0.68, .076), negative symptoms and pitch mean (0.01, 95% CIs:-0.16, 0.35), pitch
variability (-0.01, 95% CIs:-0.20, 0.14), and proportion of spoken time (-0.23, 95% CIs: -
0.50, 0.04) (see Table 2). We generally found high heterogeneity between studies, and
publication bias (see Table 2).22 VOICE IN SCHIZOPHRENIA: REVIEW AND META-ANALYSIS Figure 3
bioRxiv preprint first posted online Mar. 21, 2019; doi: http://dx.doi.org/10.1101/583815. The copyright holder for this preprint
 (which was not peer-reviewed) is the author/funder, who has granted bioRxiv a license to display the preprint in perpetuity.
                              It is made available under a CC-BY-NC-ND 4.0 International license.
                                                                                                                                    23
     VOICE IN SCHIZOPHRENIA: REVIEW AND META-ANALYSIS

     Moderator analysis

     For detailed results see Table S2 (in appendix). Adding speech task to the model credibly

     improved it for correlation between pitch variability and positive symptom severity, negative

     symptom severity, alogia and flat affect, and between proportion of spoken time and total

     psychopatology, negative symptom severity, alogia and flat affect (stacking weight 100%). In

     general, we see that dialogic speech shows the strongest correlations with symptomatology,

     and constrained monological speech the weakest ones.

     3.4. Multivariate machine learning (ML) studies

     We found 4 ML articles fitting our criteria, all focused on identifying acoustic markers of the

     disorder42,43,72,73 and 1 including the prediction of severity of clinical features from acoustic

     measures72. Three studies employed linear discriminant analysis (LDA) and one employed

     support vector machines to classify individuals with SZ vs. HC. All studies reported accuracy

     beyond 75% and up to 87.5%. All the results were cross-validated. Only one study42 reported

     additional performance indices such as specificity, sensitivity, and area under the curve

     (AUC).

     Only 1 study72 attempted to predict the symptomatology (negative symptoms severity) from

     acoustic measures. The study relied on LDA and reported an accuracy of 78.6% in classifying

     individuals with SCZ with higher vs lower scores of negative symptoms (PANSS negative <

     11 and SANS < 13), and 71.4 % accuracy in predicting a future (14 days after) measurement

     of negative symptoms.

     Discussion

     Overview

     Early descriptions of schizophrenia point to atypical voice patterns and studies relying on

     perceptual judgments and clinical ratings of voice patterns have indeed found large
bioRxiv preprint first posted online Mar. 21, 2019; doi: http://dx.doi.org/10.1101/583815. The copyright holder for this preprint
(which was not peer-reviewed) is the author/funder, who has granted bioRxiv a license to display the preprint in perpetuity.
It is made available under a CC-BY-NC-ND 4.0 International license.
24
VOICE IN SCHIZOPHRENIA: REVIEW AND META-ANALYSIS
differences between patients and controls38. This suggests the existence of acoustic markers of
the disorder. We set out to systematically review and meta-analyze the literature on the topic
to assess the evidence for atypical acoustic patterns as markers of the disorder and to better
inform future research. We were able to analyze the aggregated data from 46 unique articles
including 1212 individuals with SCZ and 699 HC. The univariate studies identified several
null results, as well as weak atypicalities in pitch variability (perhaps in relation to flat affect),
and stronger duration atypicalities (possibly related to alogia and flat affect). The effect sizes
suggest a within-sample discriminative accuracy between 66% and 80%, likely less if
assessing new data. The multivariate ML studies paint a more promising picture, with overall
out-of-sample accuracies between 76.5% and 87.5%. When assessing the relation between
acoustic features and symptomatology, we found that specific symptoms that are more
directly related to voice, e.g. in their description in clinical scales, yield slightly stronger
results, with flat affect being related to speech variability and proportion of spoken time; and
alogia being related to proportion of spoken time. Further, the results across all analyses
suggest that dialogical productions, that is, tasks with a perhaps higher cognitive load and a
more demanding social component, tend to involve larger effect sizes both in contrasting
patients and controls and in assessing symptomatology. Free monological production follows
and constrained production produces generally the smallest effects. Crucially, the studies
analyzed mostly used widely different methods for sample selection, acoustic pre-
preprocessing, feature extraction and selection. Indeed, we find large heterogeneity in the
findings of the analyzed studies, and a large uncertainty in all our meta-analytic estimates.
What have we then learned? In line with a previous non-systematic meta-analysis (13 studies,
Cohen et al 201438), we do indeed find evidence for acoustic markers of schizophrenia,
further supporting the relation between clinical features of SCZ and voice patterns. However,
the effect sizes are too small for practical applications, not comparable to those of perceptualbioRxiv preprint first posted online Mar. 21, 2019; doi: http://dx.doi.org/10.1101/583815. The copyright holder for this preprint
(which was not peer-reviewed) is the author/funder, who has granted bioRxiv a license to display the preprint in perpetuity.
It is made available under a CC-BY-NC-ND 4.0 International license.
25
VOICE IN SCHIZOPHRENIA: REVIEW AND META-ANALYSIS
and clinical judgments, and in any case plagued by large between-studies. While good
progress has been made in the field, the review highlights a number of issues to be overcome
to more satisfactorily understand acoustic patterns in schizophrenia and their potential. In
particular we identified the following obstacles to the scientific understanding of acoustic
features in schizophrenia: i) small sample sizes in terms of both participants and repeated
measures, ii) heterogeneous, not fully up-to-date and underspecified methods in data
collection and analysis, leading to scarce comparability between studies; iii) very limited
attempts at theory driven research directly tackling the mechanisms underlying atypical vocal
patterns in schizophrenia.
Sample size. Schizophrenia is a heterogeneous disorder, and indeed several studies attempted
to more specifically investigate the relation of acoustic features with the symptomatology of
the disorder. However, given the limited meta-analytic effect sizes and the awareness that
replications tend to show a marked shrinkage of effect sizes74, we need to move beyond small
heterogeneous studies. The majority of the studies analyzed include between 20 and 30
patients, plausibly due to the difficulty in accessing clinical populations. However, an
expected Cohen’s d of 0.6 (pitch variability) would require at least 74 participants per group
to reach a 95% power (calculations relying on G*Power75) at which effect size estimates are
reliable76. If we considered the more conservative possibility of a smaller true effect size of
0.3, the required sample size would be 290 participants per group. While including as varied a
sample as possible is an unavoidable concern, there are strategies to reduce the sample size
needed. For instance, one could employ repeated measures, that is, collecting repeated voice
samples over time. Using 10 repeated measures per participant brings the required sample
from 290 participants per group to 82 (assuming that they are still representative of the full
population). Repeated measures are also very useful to better understand the reliability of the
acoustic patterns over re-testing and potentially across different contexts. In particular, webioRxiv preprint first posted online Mar. 21, 2019; doi: http://dx.doi.org/10.1101/583815. The copyright holder for this preprint
(which was not peer-reviewed) is the author/funder, who has granted bioRxiv a license to display the preprint in perpetuity.
It is made available under a CC-BY-NC-ND 4.0 International license.
26
VOICE IN SCHIZOPHRENIA: REVIEW AND META-ANALYSIS
have seen that dialogical speech production tasks might yield stronger vocal differences, but
without a controlled within-subject contrast it is difficult to assess whether this is due to the
nature of the task or to other confounds in the sample and study design.
We had initially aimed to investigate the role of demographical (age, education, gender,
language and ethnicity), cognitive and clinical features of the participants. However, we could
not access sufficient information to perform these analyses, which would be best performed
on individual-level data. Analysing how acoustic features vary with symptomatology and
context of speech production can help uncover the mechanisms behind atypical vocal patterns
and provide an additional insight into schizophrenia. Indeed, we observe that acoustic features
are more strongly related to specific symptoms (alogia, flat affect) than to global scores of
psychopathology.
Methods. We found that the field predominantly focuses on traditional acoustic features:
pitch, intensity and duration measures. Even in these cases, the processing of the voice
recordings and extraction of the features is poorly documented and arguably widely
heterogeneous. Previous studies have found that different assumptions and settings in the
feature extraction process might significantly affect the results (e.g. Kiss et al 201277 shows
different results for different choice of ceiling in pitch extraction). Further, speech pathology
and speech signal processing research has developed a wide array of acoustic features more
directly relatable to production mechanisms like fine-grained muscle control, or clarity of
articulation (for some examples see78), which are almost completely ignored in schizophrenia
research. To overcome these barriers, we recommend the use of freely available open source
software solutions providing standard procedures in the extraction of acoustic features and the
documentation of the settings chosen79,80. Use of new features should be compared against
this baseline to facilitate comparability between studies.bioRxiv preprint first posted online Mar. 21, 2019; doi: http://dx.doi.org/10.1101/583815. The copyright holder for this preprint
(which was not peer-reviewed) is the author/funder, who has granted bioRxiv a license to display the preprint in perpetuity.
It is made available under a CC-BY-NC-ND 4.0 International license.
27
VOICE IN SCHIZOPHRENIA: REVIEW AND META-ANALYSIS
Further, the vast majority of the studies focused on one acoustic feature at a time failing to
produce effects comparable to those found in perceptual judgment studies. This supports the
idea that perception is a complex process, non-linearly combining multiple acoustic cues.
Multivariate techniques may thus allow to better capture vocal atypicalities. Indeed, the four
ML studies we were able to identify provide promising out-of-sample accuracies, indicating
that voice of individuals with SCZ may contain enough information to reliable distinguish
between the two populations. However, the almost complete lack of overlap in features and
methods employed in these studies makes it hard to assess how reliable the findings are across
samples and whether there are more promising features and algorithms we should focus on.
Theory-driven research. A common feature of many of the studies reviewed is the lack of
theoretical background. For example, limited attention is paid to clinical features and their
severity and the choice of the speech-production task and acoustic measures used is often
under-motivated. On the contrary, by putting hypothesized mechanisms to the test, more
theory-driven research on vocal production in schizophrenia would improve our
understanding of the disorder itself. For instance, social cognitionimpairment81–83 would
motivate hypotheses on prosodic patterns when speaking to an interlocutor, while lack of
motivation and energy84–86 would be reflected in a more general lack of articulatory clarity.
By including different tasks with diverse cognitive and social constraints, it would be possible
to produce more robust results not specifically bound to a specific context, and to investigate
the mechanisms and contextual factors responsible for voice abnormalities.
Open Science. The recommendations to rely on large sample sizes, include individual
differences, and cumulatively employ acoustic features from previous studies might seem too
cumbersome, or even unreasonable, given the high costs of research, ethical and practical
constraints in accessing clinical populations and proliferation of acoustic measures. This isbioRxiv preprint first posted online Mar. 21, 2019; doi: http://dx.doi.org/10.1101/583815. The copyright holder for this preprint
(which was not peer-reviewed) is the author/funder, who has granted bioRxiv a license to display the preprint in perpetuity.
It is made available under a CC-BY-NC-ND 4.0 International license.
28
VOICE IN SCHIZOPHRENIA: REVIEW AND META-ANALYSIS
why we recommend open science practices to be included already in the research design.
Releasing in controlled and ethically sound ways one’s datasets enables the construction of
large collective samples and re-analysis of the data to replicate and extend previous findings.
However, accessing previous dataset is currently unfeasible, due to lack of answers from
corresponding authors, data loss and the practical and time-consuming hurdle of finding,
preparing and sharing the data years after the study was published. This suggests that
planning data-sharing from the onset of the study is necessary to ensure a more open,
collective and nuanced science of acoustic markers in schizophrenia, conscious of the
individual differences and diverse symptomatology. Sharing identifiable (voice) data related
to clinical populations requires serious ethical considerations and careful sharing systems, but
there are available datasets of voice recordings in e.g. people with Parkinson’s, bipolar
disorder, depression and autism spectrum disorder78,87–90, thus suggesting that these hurdles
can be overcome. In line with these recommendations, all the data and the codes used in this
manuscript are available at https://osf.io/qdkt4/.
Conclusion
We have systematically reviewed the evidence for acoustic markers of schizophrenia and its
symptomatology, as well as the research practices employed. We did not find conclusive
evidence for clear acoustic markers of schizophrenia, although pitch variability and duration
are potential candidates. Multivariate studies are more promising, but their generalizability
across samples could not be assessed. To advance the study of vocal markers of schizophrenia
we outlined a series of recommendations towards more cumulative, open, and theory-driven
research.You can also read