Efficient conversion of chemical energy into mechanical work by Hsp70 chaperones
←
→
Page content transcription
If your browser does not render page correctly, please read the page content below
RESEARCH ARTICLE

                                   Efficient conversion of chemical energy
                                   into mechanical work by Hsp70
                                   chaperones
                                   Salvatore Assenza1,2†, Alberto Stefano Sassi3,4†, Ruth Kellner5,
                                   Benjamin Schuler5,6, Paolo De Los Rios3,7, Alessandro Barducci8*
                                   1
                                     Laboratory of Food and Soft Materials, ETH Zürich, Zürich, Switzerland;
                                   2
                                     Departmento de Fı́sica Teórica de la Materia Condensada, Universidad Autónoma
                                   de Madrid, Madrid, Spain; 3Institute of Physics, School of Basic Sciences, École
                                   Polytechnique Fédérale de Lausanne (EPFL), Lausanne, Switzerland; 4IBM TJ Watson
                                   Research Center, Yorktown Heights, New York, United States; 5Department of
                                   Biochemistry, University of Zurich, Zurich, Switzerland; 6Department of Physics,
                                   University of Zurich, Zurich, Switzerland; 7Institute of Bioengineering, School of Life
                                   Sciences, Ecole Polytechnique Fédérale de Lausanne (EPFL), Lausanne, Switzerland;
                                   8
                                     Centre de Biochimie Structurale (CBS), INSERM, CNRS, Université de Montpellier,
                                   Montpellier, France

                                   Abstract Hsp70 molecular chaperones are abundant ATP-dependent nanomachines that actively
                                   reshape non-native, misfolded proteins and assist a wide variety of essential cellular processes.
                                   Here, we combine complementary theoretical approaches to elucidate the structural and
                                   thermodynamic details of the chaperone-induced expansion of a substrate protein, with a particular
                                   emphasis on the critical role played by ATP hydrolysis. We first determine the conformational free-
*For correspondence:
                                   energy cost of the substrate expansion due to the binding of multiple chaperones using coarse-
alessandro.barducci@cbs.cnrs.fr
                                   grained molecular simulations. We then exploit this result to implement a non-equilibrium rate
†
 These authors contributed         model which estimates the degree of expansion as a function of the free energy provided by ATP
equally to this work               hydrolysis. Our results are in quantitative agreement with recent single-molecule FRET experiments
Competing interests: The           and highlight the stark non-equilibrium nature of the process, showing that Hsp70s are optimized
authors declare that no            to effectively convert chemical energy into mechanical work close to physiological conditions.
competing interests exist.
Funding: See page 14

Received: 15 May 2019
Accepted: 17 December 2019         Introduction
Published: 17 December 2019        Even though in vitro most proteins can reach their native structure spontaneously (Anfinsen, 1973),
                                   this is not always the case in cellular conditions and proteins can populate misfolded states which
Reviewing editor: Arup K
                                   can form cytotoxic aggregates (Dobson, 2003). In order to counteract misfolding and aggregation,
Chakraborty, Massachusetts
Institute of Technology, United
                                   cells employ specialized proteins, called molecular chaperones, which act on non-native protein sub-
States                             strates by processes that stringently depend on ATP hydrolysis for most chaperone
                                   families (Hartl, 1996). Among them, the ubiquitous 70 kDa heat-shock proteins (Hsp70s) play a spe-
   Copyright Assenza et al. This
                                   cial role because they assist a plethora of fundamental cellular processes beyond prevention of
article is distributed under the
                                   aggregation (Clerico et al., 2019; Rosenzweig et al., 2019).
terms of the Creative Commons
Attribution License, which            Decades of biochemical and structural studies have clarified the core elements of the Hsp70 func-
permits unrestricted use and       tional cycle at the molecular level (Mayer, 2013). Hsp70s consist of two domains: the substrate bind-
redistribution provided that the   ing domain (SBD) interacts with disparate substrate proteins, whereas the nucleotide binding
original author and source are     domain (NBD) is responsible for the binding and hydrolysis of ATP. The two domains are allosteri-
credited.                          cally coupled, and the nature of the nucleotide bound to the NBD affects the structure of the SBD

Assenza et al. eLife 2019;8:e48491. DOI: https://doi.org/10.7554/eLife.48491                                                     1 of 20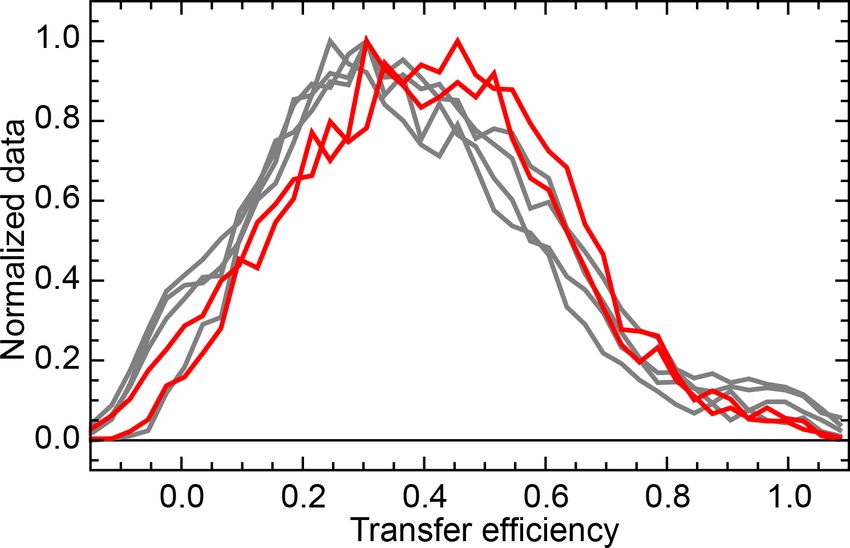
Research article                                                  Physics of Living Systems Structural Biology and Molecular Biophysics

                                   and as a consequence the affinity for the substrate and its association/dissociation rates. More pre-
                                   cisely, when the chaperone is in the ATP-bound state, the SBD is open and easily accessible to the
                                   substrate, whereas the SBD is closed when ADP is bound. These structural differences result in sub-
                                   strate binding and unbinding rates when ATP is bound that are orders of magnitude faster than
                                   when ADP is bound (Mayer et al., 2000). Furthermore, the coupling is bidirectional: the substrate,
                                   together with a co-localized J-domain protein (JDP) that serves as cochaperone (Kampinga and
                                   Craig, 2010; Kampinga et al., 2019), greatly accelerates the hydrolysis of ATP. Substrate binding
                                   thus benefits from the fast association rate of the ATP-bound state and the slow dissociation rate of
                                   the ADP-bound state, resulting in a non-equilibrium affinity (ultra-affinity) that can be enhanced
                                   beyond the maximum limit allowed by thermodynamic equilibrium, namely the affinity of the ADP-
                                   bound state (De Los Rios and Barducci, 2014; Barducci and De Los Rios, 2015).
                                      More recently, the consequences of Hsp70 binding on the conformational ensembles of its sub-
                                   strates have also been investigated. Several lines of evidence indicate that the binding of Hsp70s to
                                   a polypeptide induces its expansion. Biochemical assays revealed that binding of Hsp70 increases
                                   the sensitivity of misfolded Luciferase to proteolysis and decreases its propensity to bind Thioflavin-
                                   T, strongly suggesting a loss of compactness (Sharma et al., 2010). Nuclear Magnetic Resonance
                                   (NMR) measurements have shown that Hsp70s destabilize the tertiary structure of several different
                                   substrates (Lee et al., 2015; Sekhar et al., 2015). Moreover, a single-molecule study based on För-
                                   ster resonance energy transfer (FRET) spectroscopy quantified the considerable expansion of
                                   unfolded rhodanese in native conditions upon binding of multiple Hsp70 chaperones. In particular,
                                   this study revealed that the expansion is stringently ATP-dependent, because upon ATP exhaustion
                                   the system relaxes to the expansion values observed in the absence of chaperones (Kellner et al.,
                                   2014).
                                      Despite these advances in the characterization of Hsp70 functioning, the mechanistic understand-
                                   ing of how the energy of ATP hydrolysis is used to expand a substrate has lagged behind. Our goal
                                   here is precisely to fill this gap between the molecular and functional characterization of Hsp70. To
                                   this aim, we first explore the structural and energetic features of Hsp70-bound rhodanese using
                                   Molecular Dynamics (MD) simulations. We next integrate this molecular information into a rate
                                   model that explicitly includes the Hsp70-rhodanese interactions and the chaperone ATPase cycle,
                                   thus elucidating how Hsp70s convert the chemical energy of ATP into mechanical work necessary to
                                   expand their substrates.

                                   Results
                                   Structural and thermodynamic characterization of chaperone-substrate
                                   complexes
                                   To characterize the main features of chaperone-induced expansion, we performed MD simulations
                                   of the Hsp70/rhodanese complexes. We relied on a one-bead-per-residue Coarse Grained (CG)
                                   force field (Smith et al., 2014), which has been tailored to match experimental FRET data of
                                   intrinsically disordered proteins and satisfactorily reproduces the compactness of unfolded rhoda-
                                   nese in native conditions without any further tuning (see Materials and methods). Hsp70 chaperones
                                   were modeled with a structure-based potential to account for their excluded volume and they were
                                   artificially restrained to binding sites on the substrate. We identified six binding sites on the rhoda-
                                   nese sequence using two distinct bioinformatic algorithms (Rüdiger et al., 1997; Van Durme et al.,
                                   2009). Considering that each binding site could be either free or bound to a Hsp70 protein, we thus
                                   took into account a total of 26 = 64 distinct chaperone/substrate complexes, which were exhaustively
                                   simulated. In Figure 1, we report the distributions of the substrate potential energy and of the
                                   radius of gyration (Rg ) for three representative complexes with one (left), three (center) and six (right)
                                   bound chaperones. Consistently with FRET results (Kellner et al., 2014), chaperone binding leads to
                                   larger radii of gyration and higher potential energies, implying that the excluded-volume interactions
                                   due to the large Hsp70s progressively expand the complex and disrupt the attractive intra-chain
                                   interactions in rhodanese.
                                       We then calculated the conformational free energy of all the possible chaperone/rhodanese com-
                                   plexes to obtain a quantitative picture of the energy landscape governing the chaperone-induced
                                   expansion. To this aim, we performed extensive sets of non-equilibrium steering MD trajectories for

Assenza et al. eLife 2019;8:e48491. DOI: https://doi.org/10.7554/eLife.48491                                                                 2 of 20
Research article                                            Physics of Living Systems Structural Biology and Molecular Biophysics

     Potential Energy (kcal/mol)

                                                                 Potential Energy (kcal/mol)

                                                                                                               Potential Energy (kcal/mol)
Figure 1. Progressive expansion of substrate by multiple Hsp70 binding. Probability density maps of substrate potential energy and radius of gyration
for representative Hsp70/rhodanese complexes with one (left), three (center) and six (right) bound chaperones. The different Hsp70 chaperones have
been represented with different colors to ease their discernibility.
The online version of this article includes the following source data for figure 1:
Source data 1. Text files containing the data used to generate the probability density maps in Figure 1.

                                                      each complex, and measured the work needed to steer it to a completely extended reference struc-
                                                      ture (Rg >260 Å), whose conformational free energy is not affected by chaperone binding. Equilibrium
                                                      free-energy differences with respect to this reference state were then estimated from non-equilib-
                                                      rium work distributions via the Jarzynski equality (Jarzynski, 1997), thus allowing the determination
                                                      of the conformational free energy DG of each distinct chaperone/substrate complex (see Figure 2—
                                                      figure supplement 1 and Materials and methods).
                                                          In Figure 2 (main), we report DG for each complex as a function of its mean radius of gyration
                                                      using different colors for different stoichiometries. The conformational free energy increased with
                                                      the swelling of the substrate due to the progressive binding of the chaperones. The increase in sub-
                                                      strate potential energy due to the loss of intra-chain interactions upon Hsp70 binding is therefore
                                                      only marginally compensated by the gain in conformational entropy. Notably, the conformational
                                                      free energy is not uniquely determined by the stoichiometry, and is significantly affected by the spe-
                                                      cific binding pattern. The conformational free-energy cost DDG of adding a single chaperone (inset
                                                      in Figure 2) is positive for all complexes, but it varies from 2 kcal/mol up to 7 kcal/mol depending
                                                      on the stoichiometry of the complex and on the particular choice of the binding sites. The increase
                                                      of DG as a function of Rg is quantitatively captured by Sanchez (1979) theory for the coil-to-globule
                                                      collapse transition in polymers (see Figure 2 and Materials and methods). Remarkably, the excellent
                                                      agreement is not the outcome of a fitting procedure since all the parameters were extracted from
                                                      experiments (see Appendix 2). This result further reinforces the reliability of our simulations as well
                                                      as the general applicability of the present setup beyond the particular system considered in this
                                                      work.

                                                      ATP hydrolysis promotes multiple chaperone binding
                                                      The structural and thermodynamic characterization obtained by molecular simulations can be prof-
                                                      itably complemented by a kinetic model encompassing relevant biochemical processes in order to
                                                      determine the probability of each chaperone/substrate complex as a function of the chemical condi-
                                                      tions. Notably, a model of the Hsp70 biochemical cycle based on experimental rates was previously
                                                      used to illustrate how ATP-hydrolysis may result into non-equilibrium ultra-affinity for peptide sub-
                                                      strates (De Los Rios and Barducci, 2014). Here, we extend this result to the more complex case of
                                                      Hsp70-induced expansion by taking into account multiple chaperone binding events and their conse-
                                                      quences on the conformational free energy of the substrate.
                                                         In our model, each state corresponds to a single configuration of the chaperone/substrate com-
                                                      plex, which is defined by the occupation state of the six Hsp70 binding sites on rhodanese. Each site

Assenza et al. eLife 2019;8:e48491. DOI: https://doi.org/10.7554/eLife.48491                                                                                 3 of 20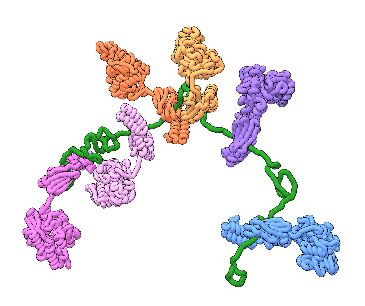
Research article Physics of Living Systems Structural Biology and Molecular Biophysics
Figure 2. Hsp70-induced swelling increases the conformational free energy of the system. Conformational free-
energy differences DG of the Hsp70/rhodanese complexes with respect to the unbound substrate (n = 0) plotted
as a function of the corresponding radius of gyration Rg . Each point represents one of the 64 possible binding
configurations with color code indicating the number of bound chaperones. The black curve was obtained using
the model in Sanchez (1979) (see Appendix 2). (inset) Distribution of DDG corresponding to the free-energy cost
for binding an additional Hsp70 to a chaperone/substrate complex.
The online version of this article includes the following source data and figure supplement(s) for figure 2:
Source data 1. Data from simulation results and Sanchez theory used to generate the plot in Figure 2 and the his-
togram in the inset of Figure 2.
Figure supplement 1. Free energy computation of different combinations of bound chaperones from steered MD
simulations.
Figure supplement 1—source data 1. Simulation data used to generate the free energy plots; the work per-
formed by the pulling force for each trajectory is also included in the subfolders.
can be either free or occupied by an ADP- or ATP-bound chaperone for a total of 36 = 729 different
states. All the relevant molecular processes corresponding to transitions between these states are
explicitly modeled, including chaperone binding/unbinding, nucleotide exchange and ATP hydrolysis
(see Figure 3). We took advantage of available biochemical data for determining the rate constants
associated to all the relevant reactions (see Materials and methods). Importantly, kinetic rates for
Hsp70 binding were modulated by the conformational free energies determined by CG MD simula-
tions. Indeed, the unbinding rates of Hsp70 from large-sized protein substrates were observed to be
similar to the ones from small peptides, whereas the binding rates can be up to two orders of magni-
tude smaller (Schmid et al., 1994; Mayer et al., 2000; Kellner et al., 2014). This evidence was fur-
ther corroborated by a recent NMR study (Sekhar et al., 2018) suggesting a conformational
selection scenario where the energetic cost due to substrate expansion mostly affects the Hsp70/
rhodanese binding rate. Accordingly, we thus considered a substrate-independent unbinding rate
constant koff , while we expressed the binding rate constant as
0
kon;ij ¼ kon exp½ bDDGij ; (1)
Assenza et al. eLife 2019;8:e48491. DOI: https://doi.org/10.7554/eLife.48491 4 of 20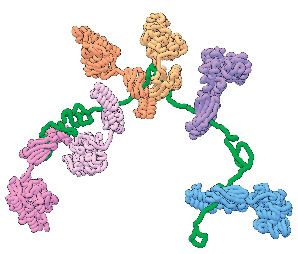
Research article Physics of Living Systems Structural Biology and Molecular Biophysics
ATP ADP
ATP k off k off ADP
k on ∙[Hsp70∙ATP] k on ∙[Hsp70∙ADP]
s eff
k s + k ex,DT
s eff
k h + k ex,TD
ATP ATP
k off k on ∙[Hsp70∙ATP]
Figure 3. The relevant biochemical reactions of the Hsp70/rhodanese system can be described by a rate model.
Each chaperone binding site on rhodanese (black dots) can be either free or occupied by an Hsp70 (yellow), which
in turn can be either ADP- or ATP-bound. We depict here for the sake of clarity only a representative portion of
the full model, which takes into account six binding sites. The reaction cycle is governed by the rates for
ATP ADP ATP ADP
chaperone binding/unbinding to the substrate (kon ; kon ; koff ; koff ) and for hydrolysis (khs ), synthesis (kss ) and
eff eff
exchange (kex;DT ; kex;TD Þ of nucleotides bound to the chaperones (see Materials and methods for further details).
ATP ADP
Importantly, the binding rate constants, kon and kon , take into account the conformational free energies,
according to Equation (1).
0
where b ¼ 1=kB T, kB is the Boltzmann constant, T is the absolute temperature, kon is the binding rate
measured for a peptide substrate, and DDGij is the conformational free-energy cost of Hsp70 bind-
ing, which depends on the specific initial and final binding patterns i and j in the rhodanese/chaper-
one complex (see Figure 2, inset). The interactions with JDP cochaperones were not explicitly
modeled but the cochaperones were assumed to be colocalized with the substrate, so that their
effect was implicitly taken into account in the choice of the rate constants for ATP hydrolysis
(Kampinga and Craig, 2010; Hu et al., 2006).
The analytical solution of the model provides the steady-state probability of each binding config-
uration and allows the exploration of their dependence on external conditions. It is particularly
instructive to investigate the system behavior as a function of the ratio between the concentrations
of ATP and ADP, which is intimately connected to the energy released by ATP hydrolysis. At thermo-
dynamic equilibrium, the ½ATP=½ADP ratio is greatly tilted in favor of ADP
(½ATPeq =½ADPeq ’ 10 9 10 8 ; Alberty, 2005), whereas in the cell ATP is maintained in excess over
ADP by energy-consuming chemostats (½ATP=½ADP>1; Milo and Phillips, 2015). The ½ATP=½ADP
ratio hence determines how far the system is from equilibrium, thus representing a natural control
parameter for the non-equilibrium biochemical cycle. We thus report in Figure 4 (top panel) the
compound probabilities for complexes with the same stoichiometry n as a function of this nucleotide
ratio. In conditions close to equilibrium (very low values of ½ATP=½ADP), the vast majority of the sub-
strate proteins are free and only about 10% of them are bound to a single chaperone. The popula-
tion of equimolar complexes increases for ½ATP=½ADP between 10 2 and 10 1 and gives way to
larger complexes with multiple chaperones for higher values of the nucleotide ratio. For
½ATP=½ADP>1, most substrates are bound to at least 4 chaperones, with an average stoichiometry
~ 4:9 (solid line in Figure 4), bottom panel). Further increase of the nucleotide ratio does not
Assenza et al. eLife 2019;8:e48491. DOI: https://doi.org/10.7554/eLife.48491 5 of 20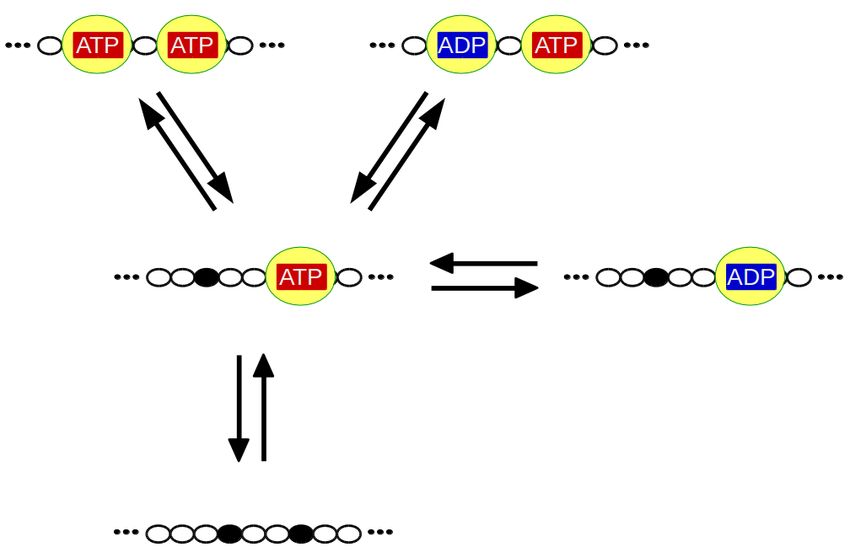
Research article Physics of Living Systems Structural Biology and Molecular Biophysics
significantly change this scenario indicating an
almost constant behaviour in large excess of ATP
ð½ATP=½ADP>10Þ. It is important here to under-
score that the binding of the chaperones in these
conditions is a non-equilibrium effect, driven by
the Hsp70-induced hydrolysis of ATP, and it is
not a mere consequence of the excess of ATP
over ADP or of the large difference between the
substrate association rates to the ATP- and ADP-
bound chaperones. Indeed, if we neglect Hsp70
ATPase activity (khh ; ksh ¼ 0) without changing any
ATPase (non-equilibrium)
of the other model parameters, efficient chaper-
one binding is abolished (
1, as shown in
the bottom panel of Figure 4, dashed line). As a
matter of fact, in such equilibrium scenario an
excess of ATP over ADP actually slightly disfavors
chaperone binding, because the Hsp70 affinity
for the substrate is slightly lower in the ATP-
no ATPase (equilibrium)
bound state than in the ADP-bound state
ATP ATP ADP ADP
(koff =kon >koff =kon , see De Los Rios and Bar-
ducci, 2014 for further discussion.)
Combining the steady-state probabilities
derived from the rate model with the results of
Figure 4. Hsp70 binding is a non-equilibrium process
that depends on ATP hydrolysis. (Top) compound
the MD simulations, we can now exhaustively
probabilities for Hsp70/substrate complexes with given characterize the structural properties of the sys-
number of bound chaperones n as a function of [ATP]/ tem. This provides the opportunity to directly
[ADP]. (Bottom) Mean value as a function of [ATP]/ compare our model with the results from FRET
[ADP] with (solid line) and without (dashed line) ATP experiments both in equilibrium and non-equilib-
hydrolysis. rium conditions. To this aim, we first focused on
The online version of this article includes the following the average radius of gyration of the system at
source data for figure 4:
thermodynamic equilibrium (½ATP
½ADP) or in
Source data 1. Data from rate model employed to non-equilibrium conditions with ATP in large
generate the plots in Figure 4. excess over ADP (½ATP=½ADP>10). In order to
probe the robustness of our results with respect
to inaccuracies in the molecular model, we also
took into account normally distributed errors on
the conformational free energies DGi .
The results are reported as histograms in Figure 5 and they suggest that at equilibrium the aver-
age radius of gyration is extremely close to what would be measured in the case of free substrate
(dashed line). This is in agreement with the experimental observation that the formation of rhoda-
nese–DnaK complexes is strictly dependent on the hydrolysis of ATP and that ADP cannot trigger
the expansion of the substrate (Kellner et al., 2014). Conversely, in large excess of ATP we observe
a substantial swelling of the substrate (75< Rg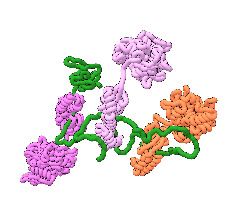
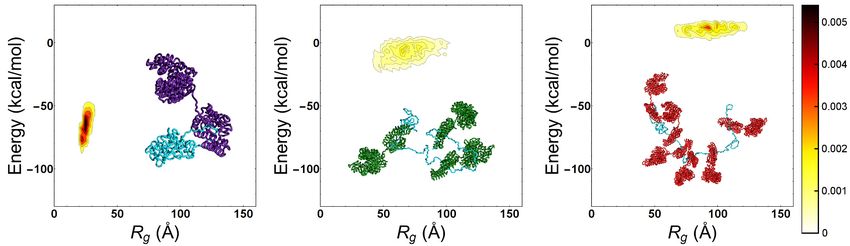
Research article Physics of Living Systems Structural Biology and Molecular Biophysics
correctly captured the non-monotonic behaviour
of FRET efficiency as a function of the sequence
separation between the dyes, which was not
reproduced in previous
calculations (Kellner et al., 2014). This agree-
ment corroborates the prediction of the DnaK
binding sites on the rhodanese sequence and the
overall reliability of our model.
Energy balance and
thermodynamic efficiency
Molecular chaperones consume energy via ATP
hydrolysis in order to expand rhodanese. It is
hence important to determine how effective they
Figure 5. Simulation results match sm FRET
experimental data. Histograms of the radius of gyration are as molecular machines, as well as to assess
for equilibrium (blue) and non equilibrium (red) values how favorable the physiological conditions are to
of [ATP]. The black dashed line indicates the average perform their biological task.
radius of unbound rhodanese. (inset) FRET transfer To this aim, we calculated the global increase
efficiencies as a function of the sequence separation in the overall conformational free energy of the
between the fluorescent dyes. The black circles substrate with respect to equilibrium conditions,
correspond to the experimental values (Kellner et al., DGSwell (Figure 6, top). This quantity measures
2014). Calculated efficiencies taking into account
the excess probability of each complex with
uncertainties are reported as blue (equilibrium
respect to equilibrium conditions weighted by its
conditions) and red circles (ATP excess).
The online version of this article includes the following corresponding conformational free energy DGi .
source data for figure 5: X ½ATP
eq
Source data 1. Molecular simulation data used to gen-
DG Swell ¼ pi pi DGi ; (2)
½ADP
erate the plots in Figure 5. i
½ATP
where pi ½ADP is the probability of complex i for
a given value of ½ATP=½ADP and peq
i is the same
quantity computed at equilibrium conditions. In order to investigate the conversion of chemical
energy into mechanical work, it is instructive to focus on the ratio between DGSwell and the free
energy of hydrolysis of ATP DGh ,
" !#
½ATPeq
½ATP
DGh ¼ kB T ln ln : (3)
½ADP ½ADPeq
The ratio DGSwell =DGh reports on the effectiveness of the transduction process. We plot in Figure 6
(top) this quantity as a function of the ½ATP=½ADP ratio considering the estimated inaccuracies of
the model as previously done for the gyration radius. Not surprisingly, all these curves exhibit a max-
imum because the probabilities of the different states, and thus also DGSwell , attain plateaus for
½ATP
½ADP (see 4, top panel), whereas DGh increases monotonically with the nucleotide ratio. The
regime where transduction is maximally efficient intriguingly corresponds to values of ½ATP=½ADP
that are typical of cellular conditions (grey area).
We highlight that in our model Hsp70 functioning encompasses two distinct yet intertwined pro-
cesses: the ATP-dependent binding of the chaperones to the substrate, and its consequent expan-
sion. In this two-step mechanism, the amount of energy available for the mechanical expansion is
limited by that provided by non-equilibrium Hsp70 binding, which does not explicitly depend on the
overall conformational properties of the substrate. To further dissect the energetic determinants of
Hsp70 functioning and obtain more general conclusions, we thus analyzed the energy balance of
chaperone binding to a model substrate, such as a peptide with a single binding site. To this aim,
we focused on a simplified reaction cycle, which essentially corresponds to a single triangle within
the overall scheme in Figure 3 and does not imply any conformational free-energy variation upon
Hsp70 binding. We report in Figure 6 (bottom panel, black solid line) the non-equilibrium dissocia-
tion constant, Kdneq , normalized with respect to its equilibrium value Kdeq , as a function of [ATP]/[ADP].
Assenza et al. eLife 2019;8:e48491. DOI: https://doi.org/10.7554/eLife.48491 7 of 20Research article Physics of Living Systems Structural Biology and Molecular Biophysics
Figure 6. The conversion of chemical energy into mechanical work by Hsp70s is optimal in cellular conditions
thanks to the chaperone intrinsic rates. (Top) Ratio between the conformational free energy and the free energy of
ATP hydrolysis, as a function of [ATP]/[ADP]. Dark green curve results from data from molecular simulations and
light green curves takes into account normally-distributed uncertainties on calculated DGi . (Bottom) Effective
dissociation constant in the case of a single binding site normalized with respect to the corresponding value in
equilibrium, as a function of [ATP]/[ADP] (solid black line). Ratio between the non-equilibrium excess of binding
free energy DGb and the free energy of ATP hydrolysis DGh , as a function of [ATP]/[ADP] (dashed red line). The
gray region indicates the interval corresponding to physiological conditions.
The online version of this article includes the following source data for figure 6:
Source data 1. Free-energy curves used to generate the plots in Figure 6.
When the ratio between the concentrations of ATP and ADP approaches the physiological regime,
the dissociation constant drops significantly until it settles at a value that is two orders of magnitude
lower than its equilibrium counterpart, as already discussed in De Los Rios and Barducci (2014).
Assenza et al. eLife 2019;8:e48491. DOI: https://doi.org/10.7554/eLife.48491 8 of 20Research article Physics of Living Systems Structural Biology and Molecular Biophysics
Here, we convert the dissociation constant into a binding free-energy excess with respect to
equilibrium
neq
K
DGb ¼ kB T ln deq (4)
Kd
that we can compare to the free energy of ATP hydrolysis, DGh , as previously done in the case of
DGSwell . Interestingly, also in this case the energy ratio is maximal in cellular conditions (red dashed
line in Figure 6, bottom panel), suggesting that the optimality of the overall expansion process does
not depend on specific features of the substrate but it is a direct consequence of the intrinsic kinetic
parameters of Hsp70 chaperones.
Discussion
Integrating molecular simulations, polymer theory, single-molecule experimental data and non-equi-
librium rate models, we have developed a comprehensive framework that provides a quantitative
picture of Hsp70-induced expansion of substrate proteins and offers a broad insight into the cellular
functioning of this versatile chaperone machine.
We relied on molecular simulations for characterizing the structural and thermodynamic features
of the complexes formed by the bacterial chaperone DnaK and its unfolded substrate rhodanese.
Notably, we investigated a large variety of possible chaperone-substrate complexes for determining
their conformational free energy as a function of stoichiometry and chaperone binding patterns. This
computational strategy based on an enhanced-sampling protocol confirmed that excluded-volume
interactions upon chaperone binding can greatly perturb the conformational ensemble of the
unfolded substrate leading to its expansion. Remarkably, simulation results were found to be in
excellent agreement with the predictions of Sanchez theory for globule to coil transition, thus pro-
viding another example of how polymer theory can be successfully used to decipher the behaviour
of disordered proteins (Sherman and Haran, 2006; Hofmann et al., 2012; Schuler et al., 2016).
We then combined conformational free energies with available biochemical data to develop an ana-
lytical rate model of the chaperone/substrate reaction cycle, which included both chaperone bind-
ing/unbinding and nucleotide hydrolysis/exchange processes.
This model fully takes into account non-equilibrium effects due to ATP hydrolysis and represents
a natural extension of the ultra-affinity framework originally developed for peptide substrates with a
single Hsp70 binding site (De Los Rios and Barducci, 2014). We could thus investigate the popula-
tion of each complex and the average structural properties of the system as a function of the ATP/
ADP nucleotide ratio, which measures how far the system is from thermodynamic equilibrium. The
reliability of the model was corroborated by a quantitative comparison with recent single-
molecule FRET data, indicating that our non-equilibrium framework accurately captures the salient
features of the ATP-dependent expansion. We then used this unprecedented access to the thermo-
dynamics details of this complex molecular process to compare the free-energy cost associated with
substrate swelling with the chemical energy released by ATP-hydrolysis. Remarkably, this analysis
revealed that energy transduction is maximally efficient for ATP/ADP values in cellular conditions.
This result hints at the possibility that Hsp70 chaperones have been tuned by evolution to optimize
the conversion of chemical energy into mechanical work for substrate expansion. Further analysis
indicated that this optimality is likely inherited from the intrinsic properties of Hsp70 chaperones,
which can convert up to 20% of the ATP chemical energy into non-equilibrium, excess binding
energy at physiological conditions (Figure 6, bottom panel).
From a broader perspective, the ATP-driven action of Hsp70s induces a non-equilibrium redistri-
bution of their protein-substrates over their structural ensemble. In particular, thanks to the fine-tun-
ing of the process by co-chaperones (J-domain proteins and Nucleotide Exchange Factors), the
expansion process highlighted here, followed by substrate release, may result in the enhancement
of the native state population beyond the predictions of thermodynamic equilibrium, as recently
observed even under otherwise denaturing conditions (Goloubinoff et al., 2018). Consistently, Zhao
and coworkers have recently observed that Hsp70 chaperones crucially contribute in vivo to the solu-
bility and functionality of a sizeable fraction of the E. coli proteome that, in their absence, would
instead spontaneously misfold and aggregate (Zhao et al., 2019). Remarkably, a similar effect has
Assenza et al. eLife 2019;8:e48491. DOI: https://doi.org/10.7554/eLife.48491 9 of 20Research article Physics of Living Systems Structural Biology and Molecular Biophysics
been observed in vitro for the GroEL chaperonin (Chakrabarti et al., 2017; Goloubinoff et al.,
2018), hinting at the possibility that multiple chaperone families might reshape the equilibrium con-
formational distribution of proteins through energy-consuming processes. These considerations
might have important consequences for our ability to translate results from in vitro experiments to
the active cellular context (Bershtein et al., 2013). Likewise, they raise fundamental questions about
the evolution of protein sequences: indeed, since chaperones are ubiquitous and very much con-
served across the different kingdoms of life, their ability to favor native states might have partially
relieved the selection pressure for strong equilibrium thermodynamic stability, thus allowing evolu-
tion to proceed faster and to be more tolerant for slightly destabilizing mutations, as suggested in
Rutherford and Lindquist (1998); Tokuriki and Tawfik (2009).
Besides the unfolding of non-native substrates discussed in this work, Hsp70s are highly versatile
machines that play a fundamental role in a variety of diverse cellular functions such as protein trans-
location, protein translation, and disassembly of protein complexes. All these processes share basic
analogies from the mechanistic point of view: in all these cases, Hsp70 binding to flexible substrates
in constrained environments requires the energy of ATP hydrolysis (ultra-affinity) and results in the
generation of effective forces due to excluded volume effects (entropic pulling), which ultimately
drive protein translocation into mitochondria (De Los Rios et al., 2006; Assenza et al., 2015), cla-
thrin cage disassembly (Sousa et al., 2016) and/or prevention of ribosome stalling (Liu et al., 2013).
Here, by detailing how energy flows from ATP hydrolysis to mechanical work due to entropic pulling,
we have elucidated a general force-generating mechanism of Hsp70 chaperones. This mechanism
does not rely on any power-stroke conformational change but it rather depends on the efficient con-
version of ATP chemical energy into ultra-affinity.
Materials and methods
Molecular model
In all the simulations, rhodanese and Hsp70 were coarse grained at the single-residue level as collec-
tions of beads centered on the Ca atom of each amino acid. The unfolded state of bovine rhodanese
(PDB:2RHS) was modeled according to the force field for disordered proteins from Smith et al.
(2014). Two- and three-body bonded interactions along the substrate backbone were included via
harmonic potentials, namely Vbond ¼ kl b ðrb lÞ2 =2 and Vbend ¼ 12 k a ða 0 Þ2 , respectively. In the
P P
1=2
previous formulas, rb denotes bond lengths; a the bend angles; l ¼ 3:9 Å; ðkl =kB TÞ ¼ 0:046 Å;
1
0 ¼ 2:12 rad; ðk =kB TÞ ¼ 0:26; and kB T is the thermal energy. Four-body bonded interactions were
2
implemented as Fourier terms, Vdihed ¼ kB T d 4s¼1 ½As cosðsfd Þ þ Bs sinðsfd Þ, where fd is the torsion
P P
angle and A1 ¼ 0:705, A2 ¼ 0:313, A3 ¼ 0:079, A4 ¼ 0:041, B1 ¼ 0:175, B2 ¼ 0:093, B3 ¼ 0:030,
B4 ¼ 0:030. The steric repulsion was implemented through a Weeks-Chandler-Andersen potential,
P
VWCA ¼ ij Vr , where
8 6
< 4k T s 12 s 1
þ kB T if rij 26 s
B rij rij
Vr ¼ : (5)
:
0 otherwise
In the previous formula, rij is the distance between beads i and j, while s ¼ 4:8 Å. The hydropho-
bic part of the potential is specific to the interacting residues and is modeled as the attractive part
P
of the Lennard-Jones potential, Vhydro ¼ h ij Vh , where
8 12 6
1
s s
< 4
ij rij rij if rij 26 s
Vh ¼ : (6)
ij
:
otherwise
In the previous formula, h ¼ 0:7722 kB T sets the overall strength of the hydrophobic interactions,
while ij depends on the residues i and j involved in the interaction, and is defined as the geometric
pffiffiffiffiffiffiffi
mean of their hydrophobicities, ij i j . The values of the hydrophobicities considered are based
on a shifted and normalized Monera hydrophobicity scale (Smith et al., 2014). Electrostatic interac-
tions were neglected based on control FRET experiments (see section 5.3). Without further tuning,
Assenza et al. eLife 2019;8:e48491. DOI: https://doi.org/10.7554/eLife.48491 10 of 20Research article Physics of Living Systems Structural Biology and Molecular Biophysics
this force field gives a radius of gyration of unbound rhodanese equal to Rg ¼ ð23:3 0:1Þ Å, which is
in good agreement with the experimental value Rg ¼ ð20:1 0:8Þ Å (Kellner et al., 2014;
Hofmann et al., 2014).
We modeled Hsp70 by means of a simple structure-based potential (Assenza et al., 2015) built
on the conformation of ADP-bound Hsp70 (Bertelsen et al., 2009, PDB:2KHO). We described both
the NBD (residues 4–680) and the SBD (residues 690–603) as rigid bodies whereas the interdomain
linker (residues 681–689) was modeled according to the potential for flexible proteins described
above. Importantly, non-bonded interactions of Hsp70 residues were limited to excluded volume
effects and described by WCA potential (see Equation (5)). Electrostatic interactions were not
explicitly included due to their marginal role in Hsp70/rhodanese complexes evidenced by FRET
experiments (Appendix 1).
The binding sites for DnaK on the substrate were identified by applying the algorithms by
Rüdiger et al. (1997) and Van Durme et al., 2009 on rhodanese and selecting only fragments for
which at least partial consensus between the two predictions was obtained. Following this proce-
dure, we identified six binding sites roughly centered on residues 10, 118, 131, 162, 188, 260 of the
rhodanese sequence. The residues of the binding site were aligned to a SBD-bound peptide
reported in the literature (PDB:1DKX Zhu et al., 1996) and constrained to move rigidly with the cor-
responding SBD, thus ensuring that each chaperone was irreversibly bound to the substrate. Follow-
ing this procedure, 26 = 64 different chaperone/substrate complexes were built depending on the
occupancy of each binding site.
Simulation protocols
All the simulations were performed with a version of LAMMPS (Plimpton, 1995) patched with the
open-source, community-developed PLUMED library (Bonomi et al., 2019), version
2.1 (Tribello et al., 2014). The temperature T ¼ 293 K was controlled through a Langevin thermostat
with damping parameter 16 ns-1. The time step was set equal to 1 fs, and each residue had a mass
equal to 1 Da.
In order to obtain conformational properties, for each of the 64 chaperone/rhodanese complexes
we performed at least 10 independent simulations of 2 107 timesteps. To ensure that full equilibra-
tion was achieved, only the last 107 timesteps of the obtained trajectories were considered for analy-
sis. Statistical errors on the computed quantities were estimated as standard errors of the mean
computed across independent realizations and are smaller than the size of symbols reported in the
figures. The FRET efficiency E for a given couple of dyes was computed starting from the distance r
separating the corresponding amino acids as
1
E¼ 6 ; (7)
r
1þ r0
where r0 = 54 Å, as in Kellner et al. (2014). For each realization, the time average of E was com-
puted. The final values employed to compute the results reported in the inset of Figure 5 in the
main text were obtained as the average between independent realizations.
The conformational free energies were computed by means of steered simulations, where for
each complex rhodanese was pulled from equilibrium until an elongated conformation was obtained
(Figure 2—figure supplement 1, top panel). Due to the large intermolecular distances, the effect of
chaperones on the conformational properties of fully-stretched rhodanese is negligible, so that this
state can be used as a reference to compute the free-energy differences between different chaper-
one/rhodanese complexes. The pulling was implemented by adding a harmonic potential acting on
the radius of gyration Rg of rhodanese. The equilibrium position of the harmonic trap was increased
at a constant pulling speed v = 10-5Å/fs from the equilibrium value up to Rg ¼ Rfin
g . For each chaper-
one/substrate complex, 100 independent pulling simulations were performed, starting from uncorre-
lated initial snapshots extracted from the equilibrium distribution. For each realization, the work W
performed by the bias potential during the steering process was measured. The free-energy differ-
ence dG between the equilibrium starting point and the reference state (corresponding to Rfin g ) was
then computed via the Jarzynski (1997) equality:
Assenza et al. eLife 2019;8:e48491. DOI: https://doi.org/10.7554/eLife.48491 11 of 20Research article Physics of Living Systems Structural Biology and Molecular Biophysics
dG W
e kB T
¼ ; (8)
where < . . .> denotes statistical average. The error on dG was estimated according to the bootstrap
method. The quantity DG considered in the main text was finally computed as DG ¼ dG0 dG, where
dG0 corresponds to the case of rhodanese alone (Figure 2—figure supplement 1, bottom panel).
The uncertainty on DG was estimated by propagating the error bars on dG and is always smaller than
the size of symbols. In order to enhance the robustness of the results, the final values reported in
the main text were obtained as a further average over the values of Rfin
g within the range 260 Å
Rfin
g 290 Å.
Rate model
For the kinetic model we consider a system in which each of the six binding sites can either be occu-
pied by a chaperone in the ATP or ADP state, or it can be free, so that in total there are 36 = 729
possible configurations. The concentration ci of each state evolves in time according to a system of
rate equations
dci X X
¼ kji cj kij ci (9)
dt j j
where kij is the transition rate from state i to state j. The first term in the right hand side (r.h.s.) of
Equation (9) represents the total flux of molecules from the other states toward state i, while the
second term in the r.h.s. of Equation (9) accounts for the flux of molecules from state i to any other
state. We focused on the steady-state, when the concentrations of the various states do not change
over time, which is defined by
dci
¼0 (10)
dt
Here, we provide a list of the relevant reactions that must be taken into account and of their cor-
responding rates. Each configuration is labelled by means of six symbols: 0 for empty sites, T for
sites occupied by an ATP-bound chaperone and D for sites occupied by an ADP-bound chaperone
(e.g. ð0; T; 0; D; 0; 0Þ, where the first, third, fifth and sixth Hsp70 binding sites are unoccupied, the sec-
ond binding site is associated to a chaperone in the ATP-bound state while the fourth binding site is
associated with a chaperone in the ADP-bound state). With this notation, the rates corresponding to
every reaction are easily determined. Examples of the reactions that need to be considered are
. binding/unbinding
½Hsp70ADP kadp
on e
bDDG
ð0; T; 0; 0; 0; 0Þ ) * ð0; T; 0; D; 0; 0Þ
kadp
off
½Hsp70ADP katp
on e
bDDG
ð0; T; 0; 0; 0; 0Þ ) * ð0; T; 0; T; 0; 0Þ
katp
off
. hydrolysis/synthesis
ksh
ð0; T; 0; T; 0; 0Þ ) s* ð0; T; 0; D; 0; 0Þ
ks
. nucleotide exchange
keff
ex;DT
ð0; T; 0; D; 0; 0Þ ) * ð0; T; 0; T; 0; 0Þ:
keff
ex;TD
We further provide, as an example, the equation for a precise configuration, say ð0; T; 0; D; 0; 0Þ
(here the label stands for the concentration of the configuration). The two binding sites that are
Assenza et al. eLife 2019;8:e48491. DOI: https://doi.org/10.7554/eLife.48491 12 of 20Research article Physics of Living Systems Structural Biology and Molecular Biophysics
occupied can undergo chaperone unbinding, ATP hydrolysis/synthesis or nucleotide exchange. The
remaining unoccupied binding sites can bind either an ATP- or an ADP-bound chaperone. We thus
have
d eff eff atp adp
ð0; T; 0; D; 0; 0Þ ¼ ð0; T; 0; D; 0; 0Þ ðkex;DT þ kss þ kex;TD þ khs þ koff þ koff Þþ
dt
atp bDDG
þð0; 0; 0; D; 0; 0Þ½Hsp70 ATPkon e þ
adp bDDG
þð0; T; 0; 0; 0; 0Þ½Hsp70 ADPkon e þ
atp
þðT; T; 0; D; 0; 0Þkoff þ
adp
þðD; T; 0; D; 0; 0Þkoff þ
atp
þð0; T; T; D; 0; 0Þkoff þ (11)
adp
þð0; T; D; D; 0; 0Þkoff þ
atp
þð0; T; 0; D; T; 0Þkoff þ
adp
þð0; T; 0; D; D; 0Þkoff þ
atp
þð0; T; 0; D; 0; TÞkoff þ
adp
þð0; T; 0; D; 0; DÞkoff :
Below we further detail the rates of our model.
It is possible to move from an ATP-state to an ADP-state either via hydrolysis/synthesis or via
nucleotide exchange. In the case of exchange, effective constants are used, which take into account
the unbinding of one nucleotide species and the binding of the different one. The effective
exchange rates are thus a function of the ratio [ATP]/[ADP] (see also De Los Rios and Barducci,
2014):
½ATP
eff
kD kþT ½ADP
kex;DT ¼ ½ATP
(12)
kþD þ kþT ½ADP
eff k
T kþD
kex;TD ¼ ½ATP
; (13)
kþD þ kþT ½ADP
where kþD , kþT , k D and k T are the binding and unbinding rates for ADP and ATP respectively.
The rates of binding between the chaperone and single peptides have been previously deter-
mined experimentally (Mayer et al., 2000), and they were corrected in order to take into account
the conformational change of the full polypeptide substrate upon binding, as we illustrated in the
main text.
Substrate binding enhances the chaperone ATPase activity. Furthermore, the stimulation of ATP
hydrolysis always takes place in cooperation with JDP co-chaperones. In our model, we did not con-
sider them explicitly but their contribution was implicitly included through the choice of the rate
constants.
In particular, the hydrolysis rate in the absence of the substrate, kh , is much smaller than the same
rate in the presence of the substrate, khs (kh
khs ). We assumed that the ratio between the rate of
hydrolysis kh and the rate of synthesis ks is not altered by the substrate:
kh khs
¼ : (14)
ks kss
The substrate binding/unbinding rates, the rates of nucleotide exchange and the hydrolysis and
synthesis rates are collectively constrained by thermodynamic relations. Indeed, when the ratio
between the concentrations of ATP and ADP is equal its equilibrium value (when the spontaneous
hydrolysis and synthesis reactions are at steady state and compensate each other), detailed balance
must be satisfied (Ge et al., 2012). As a consequence, for every closed cycle in the reaction network
the product of the rates in one direction must be equal to the product of the rates in the opposite
atp adp atp adp
direction. Therefore, if kon , kon , koff and koff are the rate of substrate binding and unbinding from a
chaperone in the ATP and ADP states, we must have
Assenza et al. eLife 2019;8:e48491. DOI: https://doi.org/10.7554/eLife.48491 13 of 20Research article Physics of Living Systems Structural Biology and Molecular Biophysics
atp s adp atp adp
kon kh koff ks kon koff
adp s atp
¼ adp atp
¼ 1: (15)
kon ks koff kh kon koff
Remarkably, taking the rates as provided in Mayer et al. (2000); Hu et al. (2006); Kellner et al.
(2014), this relation is not satisfied, and we had thus to modify them. We thus calculated the product
in the formula above and then corrected the rates in the following way:
atp adp
kon koff
adp atp
¼r (16)
kon koff
atp adp atp 1=4 adp 1=4
kon ; koff ! kon =r ; koff =r (17)
atp atp
adp
kon ; koff adp
! kon r 1=4 ; koff r 1=4 : (18)
The concentration of free chaperones in the ATP and in the ADP states was obtained, at the lead-
ing order, by solving a three-state system whose reactions have the form
Hsp70 þ ADP ) * Hsp70 ADP ) * Hsp70 ATP ) * Hsp70 þ ATP: (19)
Since we worked in the assumption of excess of chaperones in the system, once these concentra-
tions were obtained, they remained fixed once for all, without being considered as a variable of the
biochemical network.
We report in the following table the rates used in the model.
Parameters of the model (Mayer et al., 2000; Hu et al., 2006; Kellner et al., 2014)
atp 1 adp 3 1
koff 2:31 s koff 2 10 s
4 1 1
k T 1:33 10 s k D 0:022 s
atp
kon 1:28 106 M 1 s 1 adp
kon 103 M 1 s 1
kþT 1:3 105 M 1
s 1
kþD 2:67 105 M 1 s 1
4 1 1
kh 6 10 s khs 1:8 s
To test the robustness of the model for the radius of gyration, the average FRET efficiency and
the free-energy DGswell , 100 realizations were implemented, taking each time the values DGi from a
Gaussian distribution with s ¼ 0:3 kcal/mol and mean equal to the value obtained with the MD
simulations.
Molecular graphics
Molecular graphics in Figures 1 and 6 have been generated with UCSF Chimera, developed by the
Resource for Biocomputing, Visualization, and Informatics at the University of California, San Fran-
cisco, with support from NIH P41-GM103311 (Pettersen et al., 2004).
Additional information
Funding
Funder Grant reference number Author
Agence Nationale de la Re- ANR-14-ACHN-0016 Alessandro Barducci
cherche
Schweizerischer Nationalfonds 200020_163042 Paolo De Los Rios
zur Förderung der Wis-
senschaftlichen Forschung
Assenza et al. eLife 2019;8:e48491. DOI: https://doi.org/10.7554/eLife.48491 14 of 20Research article Physics of Living Systems Structural Biology and Molecular Biophysics
The funders had no role in study design, data collection and interpretation, or the
decision to submit the work for publication.
Author contributions
Salvatore Assenza, Alberto Stefano Sassi, Validation, Investigation, Methodology; Ruth Kellner, Vali-
dation, Investigation; Benjamin Schuler, Resources, Methodology; Paolo De Los Rios, Resources,
Supervision, Methodology; Alessandro Barducci, Conceptualization, Resources, Supervision, Meth-
odology, Project administration
Author ORCIDs
Salvatore Assenza https://orcid.org/0000-0001-9983-8927
Alberto Stefano Sassi https://orcid.org/0000-0002-1269-4746
Benjamin Schuler http://orcid.org/0000-0002-5970-4251
Paolo De Los Rios https://orcid.org/0000-0002-5394-5062
Alessandro Barducci https://orcid.org/0000-0002-1911-8039
Decision letter and Author response
Decision letter https://doi.org/10.7554/eLife.48491.sa1
Author response https://doi.org/10.7554/eLife.48491.sa2
Additional files
Supplementary files
. Source data 1. Auxiliary files for molecular dynamics simulations.
. Transparent reporting form
Data availability
All the source data used for generating relevant figures (Figures 1, 2, 4, 5, 6, Figure 2—figure sup-
plement 1, Appendix 1—figure 1) have been provided as supporting files. All the information neces-
sary for reproducing the molecular simulations have been deposited in github (https://github.com/
saassenza/Hsp70Unfoldase; also provided as Source data 1) and PLUMED NEST (plumID:19.076)
repositories.
References
Alberty RA. 2005. Thermodynamics of Biochemical Reactions. John Wiley & Sons. DOI: https://doi.org/10.1002/
0471332607
Anfinsen CB. 1973. Principles that govern the folding of protein chains. Science 181:223–230. DOI: https://doi.
org/10.1126/science.181.4096.223
Assenza S, De Los Rios P, Barducci A. 2015. Quantifying the role of chaperones in protein translocation by
computational modeling. Frontiers in Molecular Biosciences 2:8. DOI: https://doi.org/10.3389/fmolb.2015.
00008, PMID: 25988176
Barducci A, De Los Rios P. 2015. Non-equilibrium conformational dynamics in the function of molecular
chaperones. Current Opinion in Structural Biology 30:161–169. DOI: https://doi.org/10.1016/j.sbi.2015.02.008,
PMID: 25771489
Bershtein S, Mu W, Serohijos AW, Zhou J, Shakhnovich EI. 2013. Protein quality control acts on folding
intermediates to shape the effects of mutations on organismal fitness. Molecular Cell 49:133–144. DOI: https://
doi.org/10.1016/j.molcel.2012.11.004, PMID: 23219534
Bertelsen EB, Chang L, Gestwicki JE, Zuiderweg ER. 2009. Solution conformation of wild-type E. coli Hsp70
(DnaK) chaperone complexed with ADP and substrate. PNAS 106:8471–8476. DOI: https://doi.org/10.1073/
pnas.0903503106, PMID: 19439666
Bonomi M, Bussi G, Camilloni C, Tribello GA, Bana P, Barducci A, Bernetti M, Bolhuis PG, Bottaro S, Branduardi
D, Capelli R, Carloni P, Ceriotti M, Cesari A, Chen H, Chen W, Colizzi F, De S, De La Pierre M, Donadio D,
et al. 2019. Promoting transparency and reproducibility in enhanced molecular simulations. Nature Methods
16:670–673. DOI: https://doi.org/10.1038/s41592-019-0506-8, PMID: 31363226
Chakrabarti S, Hyeon C, Ye X, Lorimer GH, Thirumalai D. 2017. Molecular chaperones maximize the native state
yield on biological times by driving substrates out of equilibrium. PNAS 114:E10919–E10927. DOI: https://doi.
org/10.1073/pnas.1712962114
Assenza et al. eLife 2019;8:e48491. DOI: https://doi.org/10.7554/eLife.48491 15 of 20Research article Physics of Living Systems Structural Biology and Molecular Biophysics
Clerico EM, Meng W, Pozhidaeva A, Bhasne K, Petridis C, Gierasch LM. 2019. Hsp70 molecular chaperones:
multifunctional allosteric holding and unfolding machines. Biochemical Journal 476:1653–1677. DOI: https://
doi.org/10.1042/BCJ20170380, PMID: 31201219
De Los Rios P, Ben-Zvi A, Slutsky O, Azem A, Goloubinoff P. 2006. Hsp70 chaperones accelerate protein
translocation and the unfolding of stable protein aggregates by entropic pulling. PNAS 103:6166–6171.
DOI: https://doi.org/10.1073/pnas.0510496103, PMID: 16606842
De Los Rios P, Barducci A. 2014. Hsp70 chaperones are non-equilibrium machines that achieve ultra-affinity by
energy consumption. eLife 3:e02218. DOI: https://doi.org/10.7554/eLife.02218, PMID: 24867638
Dobson CM. 2003. Protein folding and misfolding. Nature 426:884–890. DOI: https://doi.org/10.1038/
nature02261, PMID: 14685248
Ge H, Qian M, Qian H. 2012. Stochastic theory of nonequilibrium steady states. Part II: applications in chemical
biophysics. Physics Reports 510:87–118. DOI: https://doi.org/10.1016/j.physrep.2011.09.001
Goloubinoff P, Sassi AS, Fauvet B, Barducci A, De Los Rios P. 2018. Chaperones convert the energy from ATP
into the nonequilibrium stabilization of native proteins. Nature Chemical Biology 14:388–395. DOI: https://doi.
org/10.1038/s41589-018-0013-8, PMID: 29507388
Hartl FU. 1996. Molecular chaperones in cellular protein folding. Nature 381:571–580. DOI: https://doi.org/10.
1038/381571a0, PMID: 8637592
Hillger F, Nettels D, Dorsch S, Schuler B. 2007. Detection and analysis of protein aggregation with confocal
single molecule fluorescence spectroscopy. Journal of Fluorescence 17:759–765. DOI: https://doi.org/10.1007/
s10895-007-0187-z, PMID: 17447125
Hofmann H, Soranno A, Borgia A, Gast K, Nettels D, Schuler B. 2012. Polymer scaling laws of unfolded and
intrinsically disordered proteins quantified with single-molecule spectroscopy. PNAS 109:16155–16160.
DOI: https://doi.org/10.1073/pnas.1207719109, PMID: 22984159
Hofmann H, Hillger F, Delley C, Hoffmann A, Pfeil SH, Nettels D, Lipman EA, Schuler B. 2014. Role of denatured-
state properties in chaperonin action probed by single-molecule spectroscopy. Biophysical Journal 107:2891–
2902. DOI: https://doi.org/10.1016/j.bpj.2014.11.002, PMID: 25517154
Hu B, Mayer MP, Tomita M. 2006. Modeling Hsp70-mediated protein folding. Biophysical Journal 91:496–507.
DOI: https://doi.org/10.1529/biophysj.106.083394, PMID: 16648174
Jarzynski C. 1997. Nonequilibrium equality for free energy differences. Physical Review Letters 78:2690–2693.
DOI: https://doi.org/10.1103/PhysRevLett.78.2690
Kampinga HH, Andreasson C, Barducci A, Cheetham ME, Cyr D, Emanuelsson C, Genevaux P, Gestwicki JE,
Goloubinoff P, Huerta-Cepas J, Kirstein J, Liberek K, Mayer MP, Nagata K, Nillegoda NB, Pulido P, Ramos C,
De Los Rios P, Rospert S, Rosenzweig R, et al. 2019. Function, evolution, and structure of J-domain proteins.
Cell Stress and Chaperones 24:7–15. DOI: https://doi.org/10.1007/s12192-018-0948-4, PMID: 30478692
Kampinga HH, Craig EA. 2010. The HSP70 chaperone machinery: j proteins as drivers of functional specificity.
Nature Reviews Molecular Cell Biology 11:579–592. DOI: https://doi.org/10.1038/nrm2941, PMID: 20651708
Kellner R, Hofmann H, Barducci A, Wunderlich B, Nettels D, Schuler B. 2014. Single-molecule spectroscopy
reveals chaperone-mediated expansion of substrate protein. PNAS 111:13355–13360. DOI: https://doi.org/10.
1073/pnas.1407086111, PMID: 25165400
Lee JH, Zhang D, Hughes C, Okuno Y, Sekhar A, Cavagnero S. 2015. Heterogeneous binding of the SH3 client
protein to the DnaK molecular chaperone. PNAS 112:E4206–E4215. DOI: https://doi.org/10.1073/pnas.
1505173112, PMID: 26195753
Liu B, Han Y, Qian SB. 2013. Cotranslational response to proteotoxic stress by elongation pausing of ribosomes.
Molecular Cell 49:453–463. DOI: https://doi.org/10.1016/j.molcel.2012.12.001, PMID: 23290916
Mayer MP, Schröder H, Rüdiger S, Paal K, Laufen T, Bukau B. 2000. Multistep mechanism of substrate binding
determines chaperone activity of Hsp70. Nature Structural Biology 7:586–593. DOI: https://doi.org/10.1038/
76819, PMID: 10876246
Mayer MP. 2013. Hsp70 chaperone dynamics and molecular mechanism. Trends in Biochemical Sciences 38:507–
514. DOI: https://doi.org/10.1016/j.tibs.2013.08.001, PMID: 24012426
Miller DM, Kurzban GP, Mendoza JA, Chirgwin JM, Hardies SC, Horowitz PM. 1992. Recombinant bovine
rhodanese: purification and comparison with bovine liver rhodanese. Biochimica Et Biophysica Acta (BBA) -
Protein Structure and Molecular Enzymology 1121:286–292. DOI: https://doi.org/10.1016/0167-4838(92)
90158-A
Milo R, Phillips R. 2015. Cell Biology by the Numbers. Garland Science.
Müller BK, Zaychikov E, Bräuchle C, Lamb DC. 2005. Pulsed interleaved excitation. Biophysical Journal 89:3508–
3522. DOI: https://doi.org/10.1529/biophysj.105.064766, PMID: 16113120
Pettersen EF, Goddard TD, Huang CC, Couch GS, Greenblatt DM, Meng EC, Ferrin TE. 2004. UCSF Chimera?A
visualization system for exploratory research and analysis. Journal of Computational Chemistry 25:1605–1612.
DOI: https://doi.org/10.1002/jcc.20084
Plimpton S. 1995. Fast parallel algorithms for Short-Range molecular dynamics. Journal of Computational Physics
117:1–19. DOI: https://doi.org/10.1006/jcph.1995.1039
Rosenzweig R, Nillegoda NB, Mayer MP, Bukau B. 2019. The Hsp70 chaperone network. Nature Reviews
Molecular Cell Biology 20:665–680. DOI: https://doi.org/10.1038/s41580-019-0133-3, PMID: 31253954
Rüdiger S, Germeroth L, Schneider-Mergener J, Bukau B. 1997. Substrate specificity of the DnaK chaperone
determined by screening cellulose-bound peptide libraries. The EMBO Journal 16:1501–1507. DOI: https://doi.
org/10.1093/emboj/16.7.1501, PMID: 9130695
Assenza et al. eLife 2019;8:e48491. DOI: https://doi.org/10.7554/eLife.48491 16 of 20You can also read