2 Finance - OECD iLibrary
←
→
Page content transcription
If your browser does not render page correctly, please read the page content below
63
2 Finance
Regional financial integration can bring long-term growth benefits, notably
through greater capital flows, technological transfer and risk diversification.
This chapter discusses financial integration in the Union for the
Mediterranean region. The analysis acknowledges that full benefits from
financial openness are possible only in the presence of policies that
strengthen local financial markets and regulatory and prudential frameworks.
This is a priority for Middle East and North Africa (MENA) and Western
Balkan sub-regions, which feature relatively low levels of financial
development. These regions can reap the benefits of a more effective
implementation of the regulatory frameworks for investment, with a
deepening of South-South and other sub-regional investment flows.
Remittances represent a significant inflow in the Southern and Eastern
Mediterranean that would greatly benefit from the establishment of practical
formal frameworks for money transfer.
REGIONAL INTEGRATION IN THE UNION FOR THE MEDITERRANEAN: PROGRESS REPORT © OECD 2021
64
Key takeaways
Financial development in the Union for the Mediterranean (UfM) region varies significantly
across countries as well as within sub-regions. Strengthening of local financial markets in MENA
and Western Balkans countries is a necessary step to fully benefit from the gains of financial
integration with other countries in the region.
Restrictions on foreign direct investment remain high in several MENA countries, in particular
in certain service activities. In terms of cross-border restrictions, MENA markets show
significantly higher degrees of impediments than other Union for the Mediterranean (UfM) sub-
regions. Restrictions in the manufacturing and services sectors, notably concerning foreign
ownership of equities strongly account for these gaps.
Within the UfM region, EU countries are the main senders and receivers of foreign direct
investment. There is significant untapped potential within the MENA and Western Balkans
regions, and between the two sub-regions, which share limited Foreign Direct Investment (FDI)
flows.
Foreign bank penetration is relatively nascent in Southern and Eastern UfM member states.
MENA countries like Morocco and Jordan have pursued banking integration policies to promote
cross-border bank penetration. Under an appropriate macro-prudential framework designed to
counter spillovers, bank integration can increase efficiency and stability of domestic bank and
enhance capital transfer.
Remittances represent a significant financial flow in the MENA and Western Balkans countries
and an important source of income. However, the cost of sending remittances remains high,
and it is estimated that a significant portion of remittances is sent through informal channels.
International cooperation should facilitate establishing practical frameworks for the transfer of
remittances through formal channels that are recommended to avoid losses to informal
channels. Encouraging the use of formal channels for sending remittances contributes to
greater financial literacy.
Monitoring of financial flows at the UfM level requires reliable and harmonised data collection.
Data on FDI flows and stocks in international databases is lacking for a number of countries in
the region, notably in the MENA and Western Balkans regions. A greater engagement with
international specialised bodies, such as the OECD Investment Committee's Working Group on
International Investment Statistics, could enhance data availability and comparability.
REGIONAL INTEGRATION IN THE UNION FOR THE MEDITERRANEAN: PROGRESS REPORT © OECD 2021
65 Introduction Financial integration is the process through which economic agents gain equal access to financial markets regionally or globally. Integrated financial markets provide participants with a single set of rules, equal access to financial instruments, and equal treatment within the market (Baele et al, 2004[1]). Features of financial integration include an increase in international financial flows, convergence of asset prices across countries and foreign penetration in the banking sector. International financial flows can take various forms. Capital flows typically refer to equity and debt flows for investment purposes, such as foreign direct investment (FDI), foreign portfolio investment and bank lending. Other types of international financial flows include remittances and official development assistance (ODA). The process of financial integration is formally driven by the lifting of cross-border restrictions, such as restrictions on foreign investments, and by the harmonisation of financial regulations. The impact of financial integration has been extensively discussed in the economic literature. Empirical research suggests that integration has a positive impact on long-term growth – notably through larger, more efficient capital flows – but the relationship is not linear, and these benefits have been disputed to some degree (OECD, 2011[2]). Integration can increase the size of financial markets, allowing for economies of scale to develop; these are associated with lower costs, higher liquidity and risk-sharing through portfolio diversification (European Commission, 2018[3]). The reduction of costs and risks and the improved access to capital is beneficial for both investors and borrowers, and can facilitate a more productive allocation of investment capital by increasing investment opportunities. Lifting barriers to foreign investments allows both companies and investors to choose the most productive platforms and placements, and may lead to capital inflows to new markets. Recent evidence has highlighted the productivity benefits of FDI through technology transfers (Fons-Rosen et al, 2018[4]). Financial institutions can benefit from integration by increasing the scale of their operations, leading to greater efficiency and profitability (African Development Bank, 2010[5]). In the banking sector, foreign penetration can improve the efficiency and quality of domestic banking-sector services through increased competition and knowledge transfer (Agénor, 2001[6]). Since the 1990s, capital inflows to emerging economies, notably in East Asia and Latin America, have increased significantly both in volume and as a share of gross domestic product (GDP) (OECD, 2018[7]) (World Bank, 2014[8]). Through capital deepening and technological transfer, the rise in foreign capital has contributed to the growth potential of receiving countries. Greater access to affordable finance is especially beneficial in the case of small and medium-sized enterprises, which struggle the most in accessing capital. The challenges of financial integration The growing interconnectedness of financial markets can amplify the cross-border transmission of instability (OECD, 2012[9]). Research showed an association between capital flows, mainly portfolio and bank flows, and financial crises, in particular if liberalisation takes place before policy-related distortions have been removed and before domestic markets, institutions, and the administrative capacity of the prudential authorities have developed enough to generate confidence that foreign finance will be channelled in productive directions (Eichengreen, 2001[10]). Cases in point are the 1994 Mexican banking crisis, which followed the bank privatisation and financial liberalisation of the country (Graf, 1999[11]) and the 1990s banking crisis in Finland and other Nordic countries, where capital account liberalisation was accused of being one of its determinant factors (Herrala, 2020[12]). However, some cross-country empirical studies and studies that use measures of de facto integration or finer measures of de jure integration, were unable to find robust evidence that capital account liberalisation by itself increases vulnerability to financial crises (Kose et al, 2006[13]). REGIONAL INTEGRATION IN THE UNION FOR THE MEDITERRANEAN: PROGRESS REPORT © OECD 2021
66
Political risks also challenge financial integration. For instance, North African economies saw an abrupt
reversal of FDI flows as the 2008 financial crisis spread, and suffered additional pressures from the Arab
Spring and the political uncertainty that ensued.
Large capital inflows resulting from financial integration can also affect a country’s current account balance.
In Central Europe, in the years prior to the 2008 financial crisis, the surge of bank flows prompted a credit
and asset price bubble that led to worsening deficits and debt (World Bank, 2014[8]). Large capital inflows
do not automatically entail a worsening of the current account deficit, as this can be counteracted by other
variables in the balance of payments, such as capital outflows (in the form of investments abroad by
residents) or changes in foreign currency reserves. Countercyclical macroeconomic and prudential
policies, when adequately conducted, can also help an economy avoid growing deficits or debts.
This emphasises the necessity to carefully prepare and monitor financial openness policies.
Other concerns are specific to the integration of the financial markets of emerging and developing
economies with those of more-developed financial markets. As mentioned earlier, countries with less-
developed capital markets can reap new investment opportunities from integrated markets (European
Commission, 2018[14]). In studying the impact of financial development on investment capital allocation in
countries with different levels of development from 1980 to 2014, Marconi and Upper (2017) found that
less-developed financial systems allocate capital flows with less efficiency than developed ones.
Furthermore, in contexts of low financial development, fast accumulation of capital (in other words, rapidly
growing capital inflows) was found to worsen the allocative efficiency of the concerned systems.
In brief, liberalising financial markets in the absence of sound macro, prudential and regulatory policies
may not evolve towards an optimal or efficient outcome (Baele et al, 2004[1]). Currently, financial integration
and globalisation are moving at a much faster pace than global financial regulation and harmonisation. As
national legislators remain the main actors in the crafting of domestic financial regulations, it is key that
economies engage in the adoption of internationally set standards designed to foster the convergence of
frameworks and to facilitate transparency.
Monitoring financial integration
There is no standard measure of financial integration across countries, although literature in this field often
examines FDI flows. In the context of the UfM, the analysis focuses on three areas: i) indicators of financial
development; ii) investment-related indicators; and iii) data on remittances, which constitute an important
financial inflow in developing economies (their volume and frequency shed light on the availability and
quality of infrastructures allowing remittances flows). Table 2.1 shows the six indicators examined in this
chapter.
Official development assistance flows represent significant capital flows between UfM member states,
notably from the European Union to Southern Mediterranean and Western Balkan countries. ODA flows
can contribute to financial integration through the promotion of economic development (see Indicator F1
below), but they are not per se an indicator of financial development or integration, and were therefore not
considered for the monitoring exercise.
REGIONAL INTEGRATION IN THE UNION FOR THE MEDITERRANEAN: PROGRESS REPORT © OECD 2021 67
Table 2.1. Key indicators for monitoring financial integration
Indicator Description Coverage Frequency
Indicator F1. Financial It measures the depth, access and efficiency of financial All UfM member states Annual (last
market development institutions and financial markets. It is based on the except Montenegro and available year:
Financial Institutions index and Financial Markets index, the Palestinian Authority 2017)
which summarise how developed financial institutions and
financial markets are in terms of their depth, access and
efficiency.
Source: IMF Financial Development IndexDatabase
Indicator F2. FDI It measures the restrictiveness of a country's foreign direct Available for OECD, EU Annual (last
Regulatory investment rules in four areas: foreign equity restrictions, and G20 countries available year:
Restrictiveness Index discriminatory screening or approval mechanisms, 2019)
restrictions on key foreign personnel, and operational
restrictions.
Source: OECD FDI Regulatory Restrictiveness Index
Indicator F3. FDI It assesses the extent of regional financial integration by IMF database covers all IMF CDIS: Annual
positions and flows examining regional and intra-regional direct investment UfM member states (last available
positions. It estimates the amount of inward FDI stock by except Egypt, year: 2018)
investors from countries within the region and outside the Mauritania, Tunisia.
region (rest of the world). North Africa, Europe, Egypt: Last
The Central Bank of Egypt provides data on FDI inflows Near and Middle East available year
and outflows concerning the country. 2013/14
Source: IMF Coordinated Direct Investment Survey (CDIS)
database and Egypt Central Bank
Indicator F4. It measures the restrictiveness of capital controls on both Algeria, Egypt, Israel, Annual (last
Restrictions on inflows and outflows. It considers administrative restrictions Lebanon, Morocco, available year:
portfolio and bank (outright prohibitions, licensing requirements) and market- Tunisia, Turkey, and EU 2017
capital inflows based restrictions (taxes) with regard to inflows of three member states except
assets: money market, bonds and equities. Croatia, Estonia,
Source: Schindler et al. (2015), Capital Control Measures Lithuania, Luxembourg,
dataset, http://www.columbia.edu/~mu2166/fkrsu/ Slovak Republic
Indicator F5. Portfolio It measures portfolio flows to and from UfM Member states. All UfM member states, Annual and
investment flows Portfolio investments refer to ownership of financial assets although data for quarterly (last
that do not entail active management role, contrary to Mauritania are not available year:
foreign direct investment. Stocks, government bonds and complete/consistent 2019)
corporate bonds are example of assets included in portfolio
investments.
Source: IMF Balance of Payments and International
Investment Positions statistics
Indicator F6. Intra- It measures inflows and outflows of annual remittances Data on remittance flows Annual (last
regional remittance using host country and origin country incomes. Where data available for all UfM available year:
flows and costs member states. 2017)
is available, remittances are measured as the sum of: i)
Data on remittance
personal transfers, ii) compensation of employees, and iii)
costs missing for
migrants’ transfers (i.e., capital transfers between resident Albania, Algeria, Bosnia
and non-resident households). For some countries, data is and Herzegovina, Israel,
obtained from the respective country’s Central Bank and Montenegro, PA, Turkey
other relevant official sources.
Source: World Bank Bilateral Remittances Matrices
Indicator F1. Financial market development
In the 2018 European Financial Stability and Integration Review (European Commission, 2018[15]) the
European Commission discussed the state of financial integration within the European Union, noting that
developed markets may benefit more from a capital market union than less developed ones, typically in
Central, Eastern and South Eastern Europe (CESEE) countries. The review underlined the importance of
developing lagging local markets prior to the push for integration in a region with different levels of financial
development.
REGIONAL INTEGRATION IN THE UNION FOR THE MEDITERRANEAN: PROGRESS REPORT © OECD 202168
Financial market development can be defined as the capacity of markets to perform efficiently as
intermediators and stimulate growth through reduced information and transaction costs (Alomari et al,
2019[16]) (Creane et al, 2003[17]). It is driven by an increase in the demand of capital by companies and
households and the supply of capital by investors, (European Commission, 2018[14]) as well as by
macroeconomic stability through appropriate policies (Creane et al, 2003[17]).
In the UfM region, economies feature highly differing levels of economic and financial development. The
MENA countries, the Western Balkans and the CESEE countries have lower levels of financial market
depth and access than the other UfM member states, as measured by the Financial Development Index
(IMF, 2020[18]).
There is considerable heterogeneity within sub-regions as well. Among the MENA countries, Egypt, Jordan
and Morocco perform better in terms of financial access than other countries with similar (or higher, in the
case of CESEE countries) income levels see also( Box 2.1).
In general, lagging countries perform better in access than in depth, reflecting their lower degree of
integration into foreign, more developed markets, and their reliance on local markets.
Box 2.1. Islamic finance
Islamic financial institutions can be seen as a complement or an alternative to the conventional financial
sectors. Although they provide similar services and products to savers, borrowers and investors, they
respond to different rules: Islamic banks follow the precepts of Islamic law, known as sharia law. This
includes a ban on interest, games of chance and other activities considered illicit. It also includes a duty
to benefit the greater society, for instance through redistribution of profit.
Islamic finance is most commonly present in the MENA (especially in the Gulf) and Southeast Asia
regions, but enjoys a growing presence in Sub-Saharan Africa, Western Europe and Central Asia,
notably in countries with significant Muslim populations. In 2006, Islamic banks represented around
50% of banking institutions in the West Bank and Gaza Strip. Other UfM member states also have a
sizable share of Islamic banks, such as Jordan (around 20%) and Egypt and Mauritania (over 10%).
However, when assessed in terms of credit and asset shares, Islamic banking institutions are less
important.
Islamic finance can bring interesting opportunities to countries with developing financial systems.
Islamic finance has been growing in importance in the last two decades. The diffusion and deepening
of Islamic banks, notably in Muslim-majority countries and countries that trade with Muslim-majority
countries, could be beneficial for economies with limited financial development, notably in the MENA
and Western Balkan regions. (Imam and Kpoda, 2010[19]) (Imam and Kpodar, 2015[20]) found that, unlike
for conventional banks, the quality of institution in a certain country does not affect the development of
Islamic banks. Additionally, despite their lower presence in the overall financial sectors, Islamic banks
have been positively associated with overall economic growth, notably through improved financial
inclusion. As such, the development of Islamic banking represents significant opportunities for emerging
and development markets, notably in the UfM area.
Source: (Imam and Kpoda, 2010[19]), (Imam and Kpodar, 2015[20]).
REGIONAL INTEGRATION IN THE UNION FOR THE MEDITERRANEAN: PROGRESS REPORT © OECD 2021 69
Figure 2.1. Financial market depth and economic development
CESEE MENA Other EU Israel Turkey Regional averages
Financial market development index
1
SWENLD
0.9 FRA
ESP
0.8 FIN BEL
LUX
0.7 ITA DEU
PRT DNK
0.6 IRL
Eurozone
0.5 GRC AUT
CYP
0.4 UfM ISR
TUR
0.3
JOR
MAR HRV POL
0.2 LBN HUN MLT
EGY
BGR EST CZE
0.1 TUN LVA SVN
MRT BIH SVK
DZA ALB ROU LTU
0
0 20000 40000 60000 80000 100000 120000 140000
GDP per capital (PPP), 2018
Financial market
Financial market
development CESEE countries, magnifed development MENA countries, magnified
index
0.25 index
Croatia Poland 0.3
0.2 Czech Republic 0.25 Jordan
Hungary
Morocco
0.15 Estonia
0.2 Lebanon
0.15 Egypt
0.1 Bulgaria Slovenia
Slovak Republic
0.1 Tunisia
Latvia Lithuania
0.05 Bosnia and Herzegovina
Romania 0.05
Albania Mauritania Algeria
0 0
0 5000 10000 15000 20000 25000 30000 35000 40000 45000 0 5000 10000 15000 20000
GDP per capital (PPP), 2018 GDP per capital (PPP), 2018
Note: Depth refers to the size and liquidity of markets (IMF, 2020).
Source: Authors based on IMF Financial Development Index database and World Bank data. https://data.imf.org/?sk=F8032E80-B36C-43B1-
AC26-493C5B1CD33B
StatLink 2 https://stat.link/jq6348
REGIONAL INTEGRATION IN THE UNION FOR THE MEDITERRANEAN: PROGRESS REPORT © OECD 202170
Figure 2.2. Financial market access and economic development
MENA CESEE Other EU Israel Turkey Regional average
Financial market access index, 2017
1 IRL LUX
0.9
AUT
0.8
ESP
MLT
0.7 ITA
GRC
0.6 CYP
DEU
JOR HUN FIN
0.5 MAR DNK
POL Eurozone SWE
0.4 ISR
FRA NLD
EGY TUR UfM
0.3 BEL
PRT
0.2
LVA SVN
EST
0.1 CZE
BIH
MRT TUN DZA HRV SVK
LBN LTU
BGR
0 ROU
ALB
0 20000 40000 60000 80000 100000 120000 140000
GDP per capital (PPP), 2018
Financial market
access index, Financial market
2017 CESEE countries, magnified access index MENA countries, magnified
0.6
0.6
0.5 Hungary
Jordan
Poland
0.5
Morocco
0.4
0.4
Egypt
0.3
0.3
0.2 0.2
Latvia Slovenia
0.1 Bosnia and Herzegovina Estonia Czech Republic 0.1
Croatia Lithuania Lebanon
Albania Bulgaria Mauritania Tunisia
Romania Slovak Republic Algeria
0 0
0 10000 20000 30000 40000 50000 0 5000 10000 15000 20000
GDP per capital (PPP), 2018 GDP per capita l(PPP), 2018
Note: Access measures the ability of individuals and companies to access financial services (IMF,2020).
Source: Authors based on IMF Financial Development Index database and World Bank data. https://data.imf.org/?sk=F8032E80-B36C-43B1-
AC26-493C5B1CD33B
StatLink 2 https://stat.link/6ougz3
Indicator F2. FDI Regulatory Restrictiveness Index
The attractiveness of UfM economies to foreign investors depends on several factors, including market
size and geography, but also the policies and institutions that support a coherent and predictable
investment environment. For foreign investors, the rules governing their entry and operations in the host
country are also important. Some legal or regulatory restrictions on FDI in general exist in most countries,
either to protect specific domestic industries or for national security interests (OECD, 2021[21]).
The level of a country’s openness to foreign investment is reflected in the OECD FDI Regulatory
Restrictiveness Index, which measures the restrictiveness of an economy’s rules on FDI (see Box 2.2).
The Index provides an indication of a country’s investment climate, noting that a range of other factors
come into play, including how FDI rules are implemented, the existence of state ownership in key sectors,
the size of a country’s market and the extent of its integration with neighbours, and even geography. Used
in combination with measures of other aspects relevant for the investment climate (e.g. good governance),
the Index can help to explain variations among economies in attracting FDI.
REGIONAL INTEGRATION IN THE UNION FOR THE MEDITERRANEAN: PROGRESS REPORT © OECD 2021 71
For UfM countries that are members of the OECD, the source of information for measures to be scored
under the FDI Index is the list of countries’ reservations under the OECD Code of Liberalisation of Capital
Movements (Capital Movements Code) and its lists of exceptions and other measures reported for
transparency under the National Treatment instrument1, as well as regular monitoring conducted by the
OECD2. For non-OECD members, additional sources include information gathered through a review of
relevant legislation, either in the context of OECD Investment Policy Reviews or specific projects (Kalinova
et al., 2010[22]) (OECD, 2020[23]).
The Capital Movements Code provides a framework to ensure a country’s policy is not more restrictive
than necessary, and remains to date the only multilateral instrument with the primary function of promoting
transparency and openness of capital accounts. It covers a variety of transactions including direct
investment, financial credits and loans, and operations in foreign exchange. It comprises a set of mutual
rights and obligations established by governments (OECD, 2020[23]). Since 2012, it has been open for
adherence by non-OECD member states. Countries that are not ready to undertake high openness
commitments in a formal adherence process can still benefit from the Code’s framework and OECD’s
expertise to improve their financial reform agenda (Blaschke, 2019[24]).
Box 2.2. The OECD FDI Regulatory Restrictiveness Index
The OECD FDI Regulatory Restrictiveness Index (FDI index) measures statutory restrictions on FDI
across 84 economies (as of 2019), including all OECD countries and non-OECD countries that are UfM
member states: Albania, Bosnia and Herzegovina, Croatia, Egypt, Jordan, Montenegro, Morocco and
Tunisia.
The Index covers 22 sectors, including primary (agriculture, forestry, fishing, mining and quarrying),
secondary (various manufacturing, electricity and construction) and tertiary (distribution, transport,
hotels and restaurants, media, telecommunication and financial services). For each sector, the scoring
is based on four main types of FDI restrictions:
Foreign equity limits on start-ups and acquisitions, in both cases considering whether foreign
equity is allowed at all, and the existence and level of an upper limit to the share of foreign
equity.
Screening and approval mechanisms applicable only to foreign investors fulfil many functions
and vary widely in their scope. In the most restrictive case, a screening and approval mechanism
is applied to both start-ups and acquisitions in economic sectors that are considered of national
interest. In other cases, they are automatic and require only a pre-notification requirement for
investors.
Restrictions on key foreign personnel/directors: foreign key personnel not permitted; economic
needs test for employment of foreign key personnel; nationality for board of directors, e.g.
majority must be nationals or at least one must be a national.
Other types of restrictions: establishment of branches not allowed/local incorporation required;
reciprocity requirement; restrictions on profit/capital repatriation; access to local finance;
acquisition of land for business purposes; land ownership not permitted but leases possible.
The index does not measure the following: the degree of implementation or circumvention; state
monopoly or participation in a sector; special treatment accorded to a group of investors; restrictions
based on national security or prudential measures.
Source: OECD's FDI Restrictiveness Index - 2010 Update, www.oecd-ilibrary.org/finance-and-investment/oecd-s-fdi-restrictiveness-
index_5km91p02zj7g-en.
REGIONAL INTEGRATION IN THE UNION FOR THE MEDITERRANEAN: PROGRESS REPORT © OECD 202172
FDI regulatory restrictiveness varies greatly among UfM member states (Figure 2.3). Restrictiveness
scores for 2019 show greater levels of openness in the Western Balkans and EU countries than among
MENA countries. Virtually all MENA countries (except Morocco) are above the UfM average (0.075, on a
scale from 0, open, to 1, closed), but the region converged towards the UfM average between 2010 and
2019, notably due to increased openness in Tunisia, Jordan and Egypt. Algeria and the Palestinian
Authority are the two economies showing the highest levels of restrictions, with respective scores of 0.587
and 0.388, and in a specular way, they are the MENA economies with the lowest inflows of FDI (see in the
following section (Figure 2.11). Morocco and Egypt, the two most open MENA economies, receive the
largest inflows of FDI in the region.
Figure 2.3. FDI Restrictiveness Index in UfM economies
From 0 (open) to 1 (closed)
Note: 2010 data is missing for Albania, Algeria, Bosnia and Herzegovina, Jordan, Lebanon and the Palestinian Authority. Base-year data for
Jordan are from 2012. EU average does not include Cyprus and Malta. UfM average does not include Cyprus, Malta and Mauritania.
Source: Authors, from the OECD FDI Restrictiveness Index database, https://stats.oecd.org/Index.aspx?datasetcode=FDIINDEX.
StatLink 2 https://stat.link/a4tbzq
The high scores of the most restrictive economies in the UfM are largely driven by restrictions applied on
foreign equity ownership to all or most foreign investors, notably in MENA economies (Figure 2.4). MENA
countries display an extensive list of restricted sectors, notably in non-oil manufacturing sectors and
servicesFor instance, the Palestinian Authority prohibits majority foreign ownership across sectors with few
exceptions (e.g. manufacturing, banking, hotels and restaurants). Similarly, until recently, Algeria restricted
foreign ownership to less than 50% of a firm’s equity in all sectors; however, with the 2020 Finance Law
the government lifted the cap on foreign ownership (OECD, 2021[25]).
Some countries have, indeed, made notable improvements. Jordan and Tunisia have recently carried out
significant structural reforms concerning investment regulation, and show the greatest degrees of
improvement between the base year and 2019.
The overall lower restrictiveness of Tunisian markets is a result of changes in screening and approval
procedures, notably following the entry into force in April 2017 of Investment law No. 2016-71, which
REGIONAL INTEGRATION IN THE UNION FOR THE MEDITERRANEAN: PROGRESS REPORT © OECD 2021 73
repealed the 1993 Investment Code, and Law No. 2019-47 for the improvement of the investment climate.
Screening and approval procedures restrictiveness dropped from 0.073 in 2010 to 0.042 in 2019. Law No.
2016-71 removed the necessity for foreigners to obtain approval from the High Commission for investment
in 46 sectors, and Law No. 2019-47 simplified enterprise creation and approval procedures for domestic
and foreign investors.
In Jordan, throughout the 2012 to 2019 period, screening and approval procedures remained open, while
all three other sub-indices improved. The Regulation for Organising non-Jordanian Investments No. 77 of
2016, which replaced regulation No. 47 of 2000, specifically lays out the framework for economic activities
conducted in Jordan by non-Jordanians. Foreign equity restrictiveness dropped from 0.187 in the base
year to 0.165 in 2019. While Article 4 broadened the scope of activities in which foreign investors can have
a shareholding of up to 50%, Article 5 lowered the threshold of foreign ownership from 50% to 49% in
certain activities, which likely has mitigated the improvement in this sub-index.
Figure 2.4. FDI regulatory restrictiveness sub-indices, 2019
From 0 (open) to 1 (closed)
Source: Authors, from the OECD FDI Restrictiveness Index database, https://stats.oecd.org/Index.aspx?datasetcode=FDIINDEX.
StatLink 2 https://stat.link/1ulki3
In terms of economic sectors, restrictions are concentrated in the primary and tertiary sectors, with the
lowest degree of closeness being recorded in the secondary sector (Figure 2.5). This is consistent with
global trends, where the manufacturing sector is consistently more open to FDI than other sectors (Mistura
and Roulet, 2019[26]). In 2019, the average for the secondary sector for non-EU UfM member states was
0.087, compared to 0.168 for the primary sector and 0.193 for the tertiary sector. MENA countries,
especially Tunisia and Jordan, show the greatest decrease in restrictions. Western Balkan countries
perform similarly to the EU average overall, with the exception of Albania’s value for the primary sector.
An OECD survey of 60 developed and emerging economies showed that easing FDI restrictions has the
most significant impact on the services sector as compared to manufacturing and agriculture (Mistura and
Roulet, 2019[26]). As services tend to be the most restrictive sector in the UfM region, FDI liberalisation
reforms oriented towards the tertiary industry may generate significant benefits in terms of bilateral stocks.
REGIONAL INTEGRATION IN THE UNION FOR THE MEDITERRANEAN: PROGRESS REPORT © OECD 202174
Figure 2.5. Regulatory Restrictiveness Index, by industrial sector
From 0 (open) to 1 (closed)
Panel A. Primary sector
2019 2019 average 2010
0.7
0.6
0.5
0.4
0.3
0.2
0.1
0
Panel B. Secondary sector
2019 2019 average 2010
0.6
0.5
0.4
0.3
0.2
0.1
0
Panel C Tertiary sector
2019 2019 average 2010
0.7
0.6
0.5
0.4
0.3
0.2
0.1
0
Note: 2010 data are missing for Albania, Algeria, Bosnia and Herzegovina, Jordan, Lebanon and the Palestinian Authority. Base-year data for
Jordan is from 2012. EU average does not include Cyprus and Malta. UfM average does not include Cyprus, Malta and Mauritania.
Source: Authors, from the OECD FDI Restrictiveness Index database, https://stats.oecd.org/Index.aspx?datasetcode=FDIINDEX
StatLink 2 https://stat.link/sn86fi
REGIONAL INTEGRATION IN THE UNION FOR THE MEDITERRANEAN: PROGRESS REPORT © OECD 2021 75
Restrictions on FDI can also affect the development of an economy’s financial sector. For instance,
restrictions on foreign entry in the banking sector can influence the level of regionalisation or
internationalisation of the sector. The average restriction index on the banking sectors only across the UfM
region (0.029) is significantly lower than when all sectors are considered (Figure 2.6). With the exception
of Algeria, Jordan and Tunisia, non-EU UfM member states are approximately equal to or below the
region’s average. Given the relatively low levels of restrictions, there is potential for greater investments,
which can spearhead the development of foreign bank entry in regions where it remains relatively
constrained see (Box 2.3).
Figure 2.6. Regulatory Restrictiveness Index for the banking sectors, 2019
From 0 (open) to 1 (closed)
Note: The UfM average does not include Bulgaria, Cyprus, Malta and Mauritania. For Morocco, Montenegro and Palestinian Authority the value
of the index in 2019 is 0.
Source: OECD FDI Regulatory Restrictiveness Index. https://www.oecd.org/investment/fdiindex.htm
StatLink 2 https://stat.link/165fa3
Exposing the banking sector to foreign investments can lead to several potential benefits. When the
management of branches in a foreign market is closely linked to the parent bank, foreign entry can enhance
local supervisory mechanisms (OECD, 2009[27]). The presence of foreign banks can facilitate access to
foreign capital and to new financing opportunities. Foreign banks can in principle reduce cross-border
capital flight in periods of instability, by allowing foreign investors to shift their capital from domestically
owned bank to local foreign banks. A sound legal framework is a necessary precondition for the successful
integration of foreign banks into domestic markets and for the optimisation of its benefits. This includes,
but is not limited to, modernised legislation on bankruptcy, risk management, accounting, capital
requirements, and lending. Countries have taken steps to implement international standards to varying
degrees.
.
REGIONAL INTEGRATION IN THE UNION FOR THE MEDITERRANEAN: PROGRESS REPORT © OECD 202176
Box 2.3. Foreign bank penetration
Through increased competition and knowledge transfer, the entry of foreign banks can improve the
efficiency and quality of services of the domestic banking sector. When the management of branches
in a foreign market is closely linked to the parent bank, foreign entry can enhance the local supervisory
mechanisms (OECD, 2009[27]). The presence of foreign banks can also facilitate access to foreign
capital and to new financing opportunities. Lastly, foreign banks could reduce cross-border capital flight
in periods of instability, by providing foreign investors with the opportunity to shift their capital from
domestically owned bank to local foreign banks. However, regulators can limit the entry of foreign banks
into local financial sector due to specific concerns, notably the risk of transmitting financial shocks to
the host economy.
Foreign bank presence is heterogeneous across the MENA region. The Jordanian banking sector is
one of the most developed in the region – the country also ranks the best in the IMF Financial
Development index as compared with other MENA countries. Among Arab banking institutions,
Jordanian-headquartered Arab Bank has the largest international presence. There are also several
foreign banks within the country, such as Standard Chartered (United Kingdom), Egyptian Arab Land
Bank (Egypt), BLOM Bank (Lebanon), Bank Audi (Lebanon), Citibank (United States), Rafidain Bank
(Iraq) and Al-Rajhi Bank (Saudi Arabia). In the Maghreb (Algeria, Mauritania, Morocco and Tunisia),
where the banking sector is the main provider of financial services, foreign entry remains limited despite
a growing regionalisation of banking services. Regionalisation of banks is most important in Morocco
and, to a lesser extent, Tunisia (African Development Bank, 2010[5]). The following banks are an
example of successful regional penetration of Maghrebi banks:
Morocco’s Attijariwafa Bank in Tunisia and Mauritania;
Morocco’s Axis Capital in Tunisia;
Tunisian subsidiary banks and financial institutions in Algeria (Tunisia Leasing and Amen
Leasing);
Algerian investment bank in Tunisia (International Market Bank).
In 2017, the Banque maghrébine d’l’investissement et de commerce extérieure (BMICE) was
established with the aim of promoting commercial ties and capital movement between Maghreb
countries, notably by overcoming regulatory restrictions. The five countries participate equally in the
USD 500 million capital of the BMICE.
Source: (OECD, 2009[27]), (African Development Bank, 2010[5]), Banque maghrébine d’l’investissement et de commerce extérieure (BMICE)
https://www.bmice-maghreb.org/fr/accueil/, last accessed April 2021.
According to OECD research, liberalisation reforms can have a sizable and significant effect on FDI
(OECD, 2021[25]). Overall, a 10% reduction in the level of FDI restrictiveness, as measured by the Index,
could lead to a 2.1% increase in bilateral FDI inward stocks on average, all else held equal. If this average
effect were to apply equally across all countries, the more restrictive economies could expect FDI stocks
to be between 7 and 95% higher if they were to ease FDI restrictions to the OECD average level. While
the magnitude of the impact of liberalisation reforms on FDI can vary between countries, it shows how
restrictions still act as barriers to investment and that there is substantial room for FDI growth if
governments continue to advance liberalisation reforms.
Finally, it is worth mentioning that FDI restrictions analysed in this section are discriminatory measures
explicit in regulations or laws, but other de facto restrictions on foreign investors may exist (OECD,
2021[21]). These include institutional or informal barriers to investment (e.g. excessive bureaucracy or
REGIONAL INTEGRATION IN THE UNION FOR THE MEDITERRANEAN: PROGRESS REPORT © OECD 2021 77 corruption), and also inconsistent enforcement of rules, distortions caused by state ownership in key sectors, special treatment received by certain firms, insufficient competition, skills shortages, inadequate infrastructure, political instability, governance challenges, and weak regional integration. Indicator F3. FDI positions and flows The distribution of FDI stock among UfM member states is considerably uneven (Figure 2.7). Also, within the UfM region, FDI flows usually involve an EU member state, whereas intra-MENA or intra-Western Balkans flows remain limited. EU countries, especially, attract the overwhelming majority of investments due to the status as financial centres of some of the EU member states (Damgaard et al, 2019[28]). The relatively small share of investments distributed across MENA and Balkan countries reflects their low level of integration, coupled with existing restrictions to FDI in the regions. The predominance of the banking system, the limited development of financial systems, and external and internal shocks (such as financial crises) all constrain direct investment. Also, structural challenges shared by many MENA economies are hindering FDI (OECD, 2021[21]). These include insufficient competition, skills shortages, inadequate infrastructure, political instability, governance challenges, and weak regional integration. On average, 68% of investment stock in a reporting economy from the UfM comes from another UfM member state. Given the depth of formal ties that EU member states share among themselves, they roughly have the highest share of intra-UfM investment. This is especially the case concerning smaller EU economies that have weaker financial ties with developed North American and Asian economies than countries like France and Germany. With the exception of Bosnia and Herzegovina and Lebanon, MENA and Western Balkan countries – in addition to Israel, Turkey and the United Kingdom – are below the average share of intra-UfM investment. REGIONAL INTEGRATION IN THE UNION FOR THE MEDITERRANEAN: PROGRESS REPORT © OECD 2021
78
Figure 2.7. Inward FDI stock in UfM countries, 2018
Panel A. Investment stocks above 120 billion
intra ufm investment extra ufm
1200000
1000000
800000
600000
400000
200000
0
Panel B. Investment stocks below 120 billion
intra ufm investment extra ufm
120000
100000
80000
60000
40000
20000
0
Note: Inward FDI measures investment by non-resident investors in the reporting economy, whereas outward FDI measures investment by
residents of the reporting economy in partner economies. FDI stocks or positions are a measure of the total level of direct investment at a precise
point in time, usually at end year or quarter, reflecting the accumulation of investment in or by the reporting economy and show long-term links
between partner economies. FDI flows measure cross-border direct investment during a given period of time, usually a year or a quarter.
Countries are ranked in order of decreasing share of intra-UfM investment position. The Netherlands and Luxembourg do not appear on the
graph due to their significantly higher stocks; their shares of intra-UfM inward stock stand respectively at 51% and 42%. Bilateral FDI stocks in
the IMF CDIS database include resident Special Purpose Entities (SPEs), which are particularly significant in countries like Luxembourg and
the Netherlands. Data for Egypt, Jordan, Mauritania and Tunisia are unavailable.
Source: Authors, based on IMF Coordinated Direct Investment Survey, https://data.imf.org/?sk=40313609-F037-48C1-84B1-E1F1CE54D6D5.
StatLink 2 https://stat.link/wpufqc
The MENA and Western Balkans regions are net receivers of foreign investments and have a limited
presence as foreign investors (Figure 2.8). Lebanon is an exception, with USD 3.9 billion in outward stock
against USD 2.9 billion in inward stock. In addition to structural long-term ties reflected by stocks, FDI
flows reflect shorter-term changes in direct investment as influenced by global macroeconomic conditions
and internal changes, including regulatory changes.
REGIONAL INTEGRATION IN THE UNION FOR THE MEDITERRANEAN: PROGRESS REPORT © OECD 2021 79
Figure 2.8. Inward and outward stock in UfM sub-regions, 2018
Million USD
Panel A. MENA Panel B. Western Balkans
70000 70000
60000 60000
50000 50000
40000 40000
30000 30000
20000 20000
10000 10000
0 0
Inward stock Outward stock Inward stock Outward stock
Note: Inward and outward stock data for Jordan are unavailable. Outward stock data for the Palestinian Authority and Montenegro are
unavailable.
Source: Authors, from the IMF Coordinated Direct Investment Survey, https://data.imf.org/?sk=40313609-F037-48C1-84B1-E1F1CE54D6D5.
StatLink 2 https://stat.link/52ltjv
Investment outflows from the EU, whose member states are significant investors in the MENA and Western
Balkans regions, follow global trends (Figure 2.9), namely a sharp decline following the 2007-08 financial
crisis and progressive decline between 2016 and 2018, mainly due to a constriction of investment relations
with the United States (European Commission, 2018[3]).
Figure 2.9. FDI outflows, world and EU27, 2007-19
Million USD
World EU27
2500000
2000000
1500000
1000000
500000
0
2007 2008 2009 2010 2011 2012 2013 2014 2015 2016 2017 2018 2019
Source: OECD Foreign Direct Investment Statistics database, https://www.oecd.org/corporate/mne/statistics.htm.
StatLink 2 https://stat.link/sjwzk4
In the MENA region, following the 2008 financial crisis, the outbreak of political upheaval in several
countries put pressure on the recovery of FDI, including on intra-regional investment (Box 2.4)
(Figure 2.10). Egypt receives the largest amount of FDI (despite being among the most affected by the
2007-08 financial crisis and the Arab Spring), followed by Morocco.
REGIONAL INTEGRATION IN THE UNION FOR THE MEDITERRANEAN: PROGRESS REPORT © OECD 202180
Figure 2.10. FDI inflows to MENA countries
Million USD
Source: IMF Coordinated Direct Investment Survey, https://data.imf.org/?sk=40313609-F037-48C1-84B1-E1F1CE54D6D5.
StatLink 2 https://stat.link/fgut4d
Box 2.4. Intra-MENA investment flows
There is little reliable data available concerning intra-MENA investment flows. Economies in the region
tend to compete to attract capital from other region, such as the EU and the GCC, while undertaking
limited capital exchange amongst themselves. The amount of FDI flows within the region is three times
lower than in the Asia Pacific region and more than two times lower than in Latin America (Wall J,
2019[29]). Recent analysis by the OECD founds that FDI flows between MENA economies are marginal,
representing only 1% of total greenfield investment since 2003 (OECD, 2021[25]).
This is despite the existence of regional frameworks for financial integration, notably in North Africa –
such as the Agadir Agreement, a multilateral trade agreement with investment provisions established
between Egypt, Jordan, Morocco and Tunisia, and later joined by Lebanon and the Palestinian
Authority. Previous studies have linked this to a limited implementation of existing agreements (OECD,
2014[30]).
Indicator F4. Restrictions on portfolio and bank capital inflows
Moving to other types of capital flows beyond FDI, this section analyses the level of openness to portfolio
and bank cross-border flows. The capital restrictions index computed by (Schindler et al, 2015[31]) covers
controls on inflows and outflows for ten types of assets, including money market, bonds and equities.
Restrictions on capital flows are heterogeneous in the UfM region (Figure 2.11). In particular
MENA economies implement more restrictions than the European average,
Algeria, Lebanon and Tunisia show the maximum level of overall inflow restrictiveness;
Egypt is open in the three categories on portfolio and financial credit capital inflows, while Morocco
has some restrictions on equity and bond inflows.
REGIONAL INTEGRATION IN THE UNION FOR THE MEDITERRANEAN: PROGRESS REPORT © OECD 2021 81
Figure 2.11. Restrictions on portfolio and bank capital inflows, selected UfM countries, 2017
Index 0 (no restriction) to 1 (presence of a restriction)
Note: The EU average covers 22 member states, except Croatia, Estonia, Lithuania, Luxembourg and the Slovak Republic. For Egypt and Israel,
the values of restrictions indicator for the three specific type of inflows, i.e. equity, bond, financial credit, was equal to 0 in 2017
Source: Schindler et al. 2015, Capital Control Measures dataset, http://www.columbia.edu/~mu2166/fkrsu/.
StatLink 2 https://stat.link/clkya6
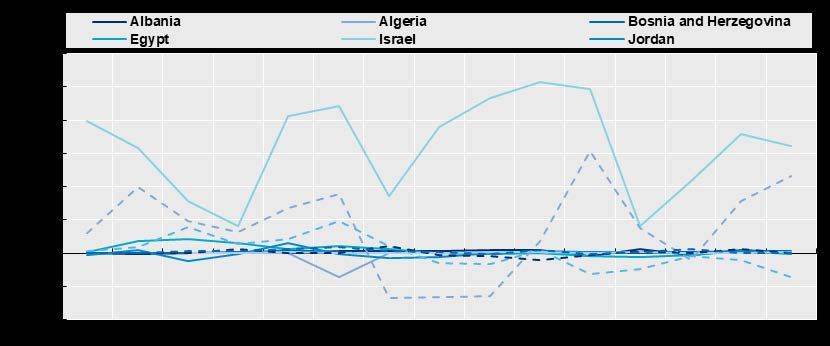
With the exception of Lebanon and, to a lesser extent, Tunisia, most countries show greater degrees of
restriction today than in 2007 (Figure 2.12). In Algeria, restrictions first increase in 2008 and follow a slow,
fluctuating growth until 2013. But not all changes have been applied following the crisis across the region.
In Israel and Turkey, the first restrictions appear in 2011, and the index continues to increase in 2012 and
2013. Lebanon experienced a slight decrease in 2016, highlighting a slightly more open market.
Figure 2.12. Overall capital inflow restrictions index
Index 0 (no restriction) to 1 (presence of a restriction)
Source: Source: Schindler et al. 2015, Capital Control Measures dataset, http://www.columbia.edu/~mu2166/fkrsu/.
StatLink 2 https://stat.link/05gelm
REGIONAL INTEGRATION IN THE UNION FOR THE MEDITERRANEAN: PROGRESS REPORT © OECD 202182
Indicator F5. Portfolio investment flows
Along with FDI flows, portfolio flows provide information on the level of financial integration from the
perspective of capital markets. Inward portfolio flows (liabilities) represent the volume of portfolio
investment coming into the MENA and Western Balkan regions from the rest of the world. Outward portfolio
flows (assets) represent the volume of portfolio investment from local investors into foreign economies.
With the exception of Turkey, which received significantly higher flows between 2009 and 2014, the focus
economies have relatively low inflows, with generally limited fluctuations. Turkey, but also Egypt and Israel
– the three economies showing the lowest levels of capital control (Indicator F4) within non-EU/UfM
member states – seem to be the most affected by external and internal shocks, notably the 2007 financial
crisis and the Arab Spring (Figure 2.4).
Figure 2.13. Portfolio capital outflows, per country, 2005-19
Million USD
Note: Negative values refer to years where disinvestments exceed investments. In the case of inflows, this refers to a situation where foreign
investors repatriated more funds than they have invested in the focus economy.
Source: Authors, from the, IMF Coordinated Direct Investment Survey, https://data.imf.org/?sk=40313609-F037-48C1-84B1-E1F1CE54D6D5
StatLink 2 https://stat.link/snk3xp
Similarly to FDI flows, MENA countries are much less present as global investors. Egypt, Israel and, to a
lesser extent, Turkey show significantly greater volumes of portfolio capital outflows, with a high propensity
to fluctuate Figure 2.14.
REGIONAL INTEGRATION IN THE UNION FOR THE MEDITERRANEAN: PROGRESS REPORT © OECD 2021 83
Figure 2.14. Portfolio capital outflows, per country, 2005-19
Note: Negative values refer to years where disinvestments exceed investments. In the case of outflows, this refers to a situation where local
investors repatriated more funds than they have invested abroad.
Source: Authors, from the IMF Coordinated Direct Investment Survey, https://data.imf.org/?sk=40313609-F037-48C1-84B1-E1F1CE54D6D5
StatLink 2 https://stat.link/fi947y
Aggregated inflows of MENA and Western Balkan economies show high heterogeneity from one year to
another. The years following the financial crisis and the Arab Spring witnessed higher disinvestments than
investments. The surge of inflows in 2017 is mostly captured by inflows to Egypt following an improved
economic outlook and monetary and fiscal reform (World Bank, 2017[32]) (Figure 2.15).
Figure 2.15. Total portfolio capital inflows, UfM MENA and Western Balkan countries
Million USD
Note: Negative values refer to years where disinvestments exceed investments. In the case of inflows, this refers to a situation where foreign
investors repatriated more funds than they have invested in the focus economy.
Source: Authors, from the IMF Coordinated Direct Investment Survey, https://data.imf.org/?sk=40313609-F037-48C1-84B1-E1F1CE54D6D5.
StatLink 2 https://stat.link/oa1vn5
REGIONAL INTEGRATION IN THE UNION FOR THE MEDITERRANEAN: PROGRESS REPORT © OECD 202184
Total portfolio outflows, after reaching a peak in 2010, experienced a downward trend, with a fluctuating
volume of outflows ever since: they are in general negative, except for 2014 and 2018 where however
outflows remain far from pre-2010 levels (Figure 2.16).
Figure 2.16. Total portfolio capital outflows, MENA and Western Balkan countries, 2005-19
Million USD
Note: Negative values refer to years where disinvestments exceed investments. In the case of outflows, this refers to a situation where local
investors repatriated more funds than they have invested abroad.
Source: Authors, from the IMF Coordinated Direct Investment Survey, https://data.imf.org/?sk=40313609-F037-48C1-84B1-E1F1CE54D6D5.
StatLink 2 https://stat.link/0io1fd
Indicator F6. Remittance flows and costs
Remittances are money transfers between different parties, usually residing in different countries.
Generally, a remittance refers to the sum of money sent by a migrant worker to family members in the
worker’s country of origin. Remittances represent a significant source of external financing in low-to-
middle–income economies, where such inflows can exceed FDI flows (IEMed, 2020[33]). In the UfM, 90%
of emigrants from North Africa and almost all emigrants from the Western Balkans lived in an EU country
in 2019. A sizable share of them migrated to seek employment opportunities, with their families continuing
to live in their countries of origin (see Chapter 4).
Through the allocation of the migrant labour force in foreign, more productive markets, countries of origin
capture gains they would not have access to otherwise. Remittance flows are the result of a cross-border
reallocation of labour, and represent the regional distribution of gains generated in the remittance sending
economy. There has been a significant increase in remittance flow since the 1980s. Inflows to developing
countries represent a large source of income, often surpassing official development assistance (ODA). In
2016, the World Bank estimated that remittances reached USD 575 billion and involved 232 million
migrants (World Bank, 2020[34]); see Box 2.5 for more information on the World Bank Remittance prices
worldwide database.
Remittance flows indicate the volumes of financial transfers, while costs and efficiency provide insights
into the structures allowing remittance flows and possible barriers to them. The World Bank estimates that
reducing remittance costs by 5% could generate, at the world level, savings of up to USD 16 billion a year
(World Bank, 2020[34]). Target 10.c of the UN Sustainable Development Goals specifically concerns the
transaction costs of remittances: “by 2030, reduce to less than 3% the transaction costs of migrant
remittances and eliminate remittance corridors with costs higher than 5%”.3
REGIONAL INTEGRATION IN THE UNION FOR THE MEDITERRANEAN: PROGRESS REPORT © OECD 2021 85
Several factors influence remittance prices, including the level of development of financial markets and
institutions, low competition, statutory constraints, and constrained access to banks by remittance-sending
migrants (World Bank, 2020[34]). Decision-making and cooperation at the national and regional levels can
affect the volume of remittances going through formal challenges. Lowering transaction costs and
strengthening the role of financial institutions in cross-border exchanges is an efficient way to capture
remittances through formal channels. This can take the form of facilitation of foreign transactions through
banks, reducing the fees of money transfer operators (MTOs), offering digital ways of transferring funds,
etc. Furthermore, when domestic banks open borranches abroad, they provide remitters with lower
transaction fees (World Bank, 2006[35]). Cost-efficient financial institutions operating at the regional level
maximise the disposable income sent by remitters and encourage the use of formal transfer channels.
Remittance flows and costs are a relevant dimension of financial integration in the UfM region as they shed
light on a form of capital exchange that is particularly significant between MENA and Balkan countries, on
the one hand, and EU countries, Israel and Turkey on the other. While the volume of remittances is
primarily determined by the presence of immigrants from a net remittance-receiving country in a net
remittance-sending country, it also depends on the existence of financial structures allowing such transfer
of money (i.e. MTOs) and on the costs imposed by such structures.
Remittances sent through formal channels can positively affect financial inclusion and literacy. Leveraging
and maximising formal remittance flows can help lift migrant workers’ families out of poverty. Encouraging
contact of remittance-receivers with banks and MTOs provides a first contact with financial institutions and
promotes inclusion in the financial system. Empirical studies conducted in five Sub-Saharan countries
(Burkina Faso, Kenya, Nigeria, Senegal and Uganda) found that receiving remittances increases the
probability that migrant workers’ families subsequently open a bank account (Aga and Peria, 2014[36]).
Due to the Covid-19 pandemic, digital payments are expected to grow fast across the region in 2021 and
beyond, which will require countries not only to develop the legal environment but also to strengthen the
regulatory framework for service providers to allow for further innovation in this area. This would boost
remittances as well as e-commerce, which is currently limited in part due to the lack of infrastructure for
digital payments. In 2017, studies reported that only 8% of SMEs in the wider MENA region had an online
presence (compared to 80% in the United States) and only 1.5% of the region’s retailers were online
(McKenna, 2017[37]).
Table 2.2. Remittance flows and cost analysis in MENA and Western Balkan countries
UfM relevance in Key Net Cost Competition Network Digital Average speed of MTOs
corridors flows (%) coverage channels
–
million
USD
Country
Albania HIGH (Greece, Italy) 1 183 n.a. n.a. n.a. n.a. n.a.
Algeria HIGH (France, Spain) 1 893 n.a. n.a. n.a. n.a. n.a.
Bosnia and MODERATE (Croatia, 1 957 n.a. n.a. n.a. n.a. n.a.
Herzegovina Serbia)
Egypt LOW (KSA, Kuwait) 19 582 3.35 High High Null from High (less than a day on
KSA average)
Jordan LOW (KSA, UAE) 1 562 6.4 High High Moderate Very High (less than one hour
from Kuwait on average)
Lebanon LOW (KSA, US) 6 787 6.87 High High Null from High
KSA
Montenegro MODERATE (Serbia, 351 n.a. n.a. n.a. Low from n.a.
Turkey) UAE
Morocco HIGH (France, Spain) 7 365 5.05 High High Null from Very high
REGIONAL INTEGRATION IN THE UNION FOR THE MEDITERRANEAN: PROGRESS REPORT © OECD 2021You can also read