INVEST IN THE CONTINENT ON THE RISE
←
→
Page content transcription
If your browser does not render page correctly, please read the page content below
INVEST
         N TIN E NT
IN THE CO
         TH E RIS E
     ON

INV ES  T IN
          G AFRICA
A RIS IN

                                                       Source: International Monetary Fund, World Economic Outlook, January 2019

Contrary to weakening global expansion,                is forecast to pick up in 2019, and in 2020. Buoyed
emerging markets and developing economies are          by a combination of higher commodity prices, a
expected to consider the advanced economies            relatively strong global economy, and supportive
and global growth trajectory.                          domestic policies, the economic outlook for sub-
                                                       Saharan Africa strengthens in 2019 and 2020, with
Global growth forecast for 2019 and 2020 reveals a     the region’s aggregate gross domestic product
downturn in recent months. In advanced economies,      (GDP) growth forecast to step-up to 3.5% in 2019
growth is forecast to slow to 2.0% in 2019 and         and 3.6% in 2020.
further to 1.7% in 2020, from 2.3% recorded in 2018.
Conversely however growth in sub-Saharan Africa
So it’s good news for sub-Saharan Africa as its                         Importantly, despite the notable improvements
recovery (albeit slow) continues and its growth in                      overall for the region, economic growth remains
the region remains stable at 2.9% in 2018. Indeed                       weak in Angola, Nigeria and South Africa, the
a number of countries on the African continent                          continent’s largest economies, with growth
recorded growth rates of above 5% in 2018 despite                       averaging under 2.5%. The significance of this
a stronger US dollar and tighter financial conditions.                  being that these three countries make up 55% of
                                                                        the region’s aggregate GDP estimated at market
                                                                        exchange rates.
                                                                                                              1 Source: International Monetary Fund,
                                                                                                              World Economic Outlook, January 2019

Figure 2.2 Top African economic performers of 2018-2019
Nine out of of the top 10 countries in 2018 will also be the top 10 economic growth performers in 2019. Tanzania will
make it into the top 10 this year, replacing Guinea. Ethiopia is predicted to top the group. In addition, these estimates
are higher than in 2018 for all countries except Cote d'Ivoire and Senegal

                                             Source: Foresight Africa. Top Priorities for the Continent in 2019. Africa Growth Initiative at BROOKINGS.

Looking at the top performers, an even brighter outlook for the region is revealed, with the World Bank
forecasting aggregate growth for the region at 5.7% in 2019, where it remains until 2023.

         GDP Sub-Saharan Africa vs Sub Saharan Africa
                                                                                               Source:
              ex Nigeria, Angola, & South Africa.
                                                                                               World Bank Global Economic Prospects,
                                                                                               Jan 2019

GDP Growth, Top 10 Fastest Growing Economies, Sub-Saharan Africa,
2016-2021

                 Ethiopia

                               Rwanda

                                        Cote d'Ivoire

                                                                Ghana

                                                                             Tanzania

                                                                                            Senegal

                                                                                                          Niger

                                                                                                                        Benin

                                                                                                                                     Burkina Faso

                                                                                                                                                    Uganda
                                                                                                          Source: World Bank Global Economic Prospects, Jan 2019

Impressively, approximately half of the world’s fastest-growing economies will be located
on the African continent, with as many as 20 economies expanding at an average rate of
5% or higher over the next five years. This is notably higher than the 3.6% rate for the global
economy.2

Figure 1.0.2: Forecasted growth rates for individual African economies

         >1.9%

         2% - 4.9%

         4% - 5.9%
                            Note:
         >6%
                            2018-2023 average.
Source: IMF

                                                        2
                                                            Source: Foresight Africa. Top Priorities for the Continent in 2019. Africa Growth Initiative at BROOKINGS.
FAST FACTS
From 2000 up until 2010, Africa’s real GDP grew at an average annual rate of 5.4%. Then in 2011
the Arab Spring hit, followed by the collapse of oil in 2014 which roadblocked momentum.
However growth on the continent has since recovered, and prospects are bright. Two key
observations are central to this prediction, both of which relate to World Bank indicators.

In the World Bank’s latest 2018 global economic review, of the 10 fastest-growing economies
in the world, six were in Africa, with Ghana topping the world ranking. Secondly, in the World
Bank’s prestigious 2019 Doing Business index, five of the ten most improved countries are
in Africa, with one third of all reforms recorded globally in sub-Saharan Africa. Central to
this acceleration in economic output, improved business environment, and transformative
economic growth, are a number of key factors:

1        AFRICA’S DEMOGRAPHIC DIVIDEND
         Africa’s 1.2 billion population is forecast to reach 1.7 billion by 2030, and while many
         other regions across the world have an ageing population, Africa’s is a youthful one.
         More than 80% of its growth over the next few decades will occur in cities, making
         it the fastest-urbanising region in the world. In parallel, incomes are rising across
         much of the continent, generating new business opportunities in the consumer
         market. In 2015 alone, 200 million Africans entered the consumer goods market.

         Annual spending by African consumers and businesses are forecast to reach
         $6.66 trillion by 2030, up from $4 trillion in 2015 according to a recent Brookings
         Institutions’ Africa Growth Initiative Report. This provides massive prospects for
         growing markets in a range of sectors where Africans have unmet needs.

2        AFRICA IS INDUSTRIALISING
         An industrial revolution is underway across the continent, with manufacturers
         ramping up production of a wide variety of wares from processed foods to
         automobiles, both in a bid to meet burgeoning local demand, as well as to substitute
         imports. This also potentially provides a platform to grow manufacturing exports in
         a time when industries are shifting from China to lower-cost regions.
3   AFRICA’S ONGOING DRIVE
    TO CLOSE ITS INFRASTRUCTURE GAP
    The continent’s infrastructure gap is significant - at an estimated $130 -170 billion per
    year with a financing gap in the range of $68–$108 billion, according to the African
    Development Bank (AfDB), there is still much work to do. But Africa has shown
    its commitment to closing this gap with an annual investment into infrastructure
    doubling to around $80 billion per annum since 2000.

    In order to accelerate this investment into infrastructure, African countries need to
    find new avenues to fund it. By attracting foreign investment and firms, even the
    poorest African countries can improve their trade logistics, increase the knowledge
    and skills of local entrepreneurs, gain the confidence of international buyers, and
    gradually make local firms competitive. This strategy is already being used with
    great success in Bangladesh, Cambodia, Ethiopia, Mauritius, Rwanda, and Vietnam.

    Infrastructure is of course critical for sustainable growth and inclusive development.

4   INNOVATIONS TO UNLEASH
    AGRICULTURAL AND RESOURCE WEALTH
    Africa has been blessed with an abundance of natural resources (both minerals
    and agriculture), and although this hasn’t always translated into shared wealth and
    sustainable economic development for many countries on the continent, there are
    many factors that are cause for optimism.

    The resources space will continue to play a leading role when it comes to investment,
    particularly in the hydrocarbon, base and precious metals fields. The agricultural
    sector also holds much potential, as agro-processing on the continent increases in
    response to rising global food demand (Africa hosts 60% of the world’s uncultivated
    arable land). Africa’s large deposits of natural resources promise a bright future
    for developing value chains. Actively investing in these commodities, among other
    extractive activities, will shape global economic activities over the next five decades.
5   POTENTIAL ASSOCIATED WITH BOOMING
    MOBILE AND DIGITAL ACCESS
    Sub-Saharan Africa saw the world’s fastest rate of new broadband connections
    between 2008 and 2015, and mobile data traffic is expected to increase sevenfold
    between 2017 and 2022. Africa has more than 120 million active mobile money
    accounts, which is over 50% of the global total, and means many people are
    shunning traditional banking products. This trend is expected to continue, and will
    enable companies to speed up transactions and access wider markets. This stands
    to add significant value to the continent’s GDP.

6   POLITICAL DEVELOPMENTS
    In 2019, general elections will be held in many African countries, offering them an
    opportunity to deepen, consolidate, and institutionalise democracy and strengthen
    their governance systems. Key elections to watch in 2019 are those in Nigeria and
    South Africa.

                                                                   Source:
                                                                   Foresight Africa.
                                                                   Top Priorities for the
                                                                   Continent in 2019.
                                                                   Africa Growth Initiative
                                                                   at BROOKINGS.
INVEST IN
       A FRICA
SOUTH
South Africa offers a combination of developed first world economic infrastructure and an
ever-growing emerging market. Its investment potential lies in its diversity of sectors and
industries. Celebrated as the most diversified African economy, South Africa has a host of
unique comparative advantages as an investment destination and trade partner. Our country
offers a diversified export sector with a wide global reach, a safe investment destination
offering solid returns, world-class infrastructure, access to affordable capital, industrial
policy support and a strong foreign investor presence and track record.

The following data was sourced from the “Case for Investing in South Africa" launched at
President Cyril Ramaphosa’s Inaugural Investment Summit in Johannesburg.
                                                                                                      (https://sainvestmentconference.co.za/)

THE ECONOMY: SOUTH AFRICA’S ECONOMY
OFFERS A STRONG VALUE PROPOSITION
SECTORAL COMPOSITION OF GDP IN 2017                               South Africa's value proposition.
                                                                  • Africa's most industrialised economy. It is the region's principal
                                                                    manufacturing hub and a leading service destination.
                                                                  • Highly diversified economic structure in terms of sectoral
                                                                     composition.
                                                                  • One of the most open economies in the world (ratio of exports
                                                                     and imports to GDP EXCEEDS 58%). Preferential access to
                                                                     numerous global markets.
                                                                  • Endowed with an abundance of natural resources.
                                                                  • An extensive and modern infrastructure network.
                                                                  • Sophisticated banking sector with a major footprint in Africa.
                                                                     It is the continent's financial hub.
                                                                  • Offers a supportive and growing ecosystem as a hub for
                                                                     innovation, technology and fintech.

                     Source: The Case for Investing in South Africa: Executive Summary. Accelerating Economic Growth by Building Partnerships.
                                                                                          South Africa Investment Conference 2018. INVESTSA.
THE ECONOMY: A LONG-TERM STRATEGIC
PLAN FOCUSED ON INCLUSIVE GROWTH
• The National Development Plan: Vision 2030 (NDP), which was launched in 2012, constitutes South Africa’s overarching policy framework.
• The NDP’s comprehensive framework seeks to drive and entrench an inclusive economic growth agenda for South Africa.
Source:
The Case for Investing in
South Africa: Executive
Summary. Accelerating
Economic Growth by Building
Partnerships.
South Africa Investment
Conference 2018. INVESTSA.
THE ECONOMY: DIVERSIFIED EXPORT
SECTOR AND WIDE GLOBAL REACH
South Africa’s access to global markets is enhanced by its trade agreements (e.g. SADC Free Trade Area, EU-SADC Economic
Partnership Agreement, preferential access to the US market under the African Growth and Opportunity Act (AGOA)).
LEADING MARKETS FOR SOUTH AFRICAN EXPORTS, COMPOSITION OF SOUTH AFRICA’S
2017 (ZAR1 187.5-BN) EXPORT BASKET IN 2017
Source: The Case for Investing in South Africa: Executive Summary. Accelerating Economic Growth by Building Partnerships.
South Africa Investment Conference 2018. INVESTSA.THE ECONOMY:
POISED FOR FASTER GROWTH
Largest and most advanced economy on the African Continent...
• South Africa offers a unique combination of developed-world infrastructure and logistics networks, and a diversified emerging
market (EMI) economy offering low sectoral concentration risks.
• Its gross domestic product (GDP) of ZAR 4,65 trillion (USD349,4 billion at the average USD/ZAR exchange rate for 2017) represents
circa 16% of the African continent's overall GDP.
• The composition of South Africa's GDP is similar to those of developed countries diversified and positioned to generate returns
on invested capital.
• While economic growth has been slow in recent years, the economy's growth potential can be enhanced through policy certainty
and consistency, as well as structural reforms, leading to higher levels of investment activity.
POTENTIAL UPSIDE IN SOUTH AFRICA’S ECONOMIC GROWTH FORECASTS PAGE
Source:
The Case for Investing in
South Africa: Executive
Summary. Accelerating
Economic Growth by Building
Partnerships.
South Africa Investment
Conference 2018. INVESTSA.
INVESTMENT ENVIRONMENT:
SAFE INVESTMENT DESTINATION OFFERING
SOLID RETURNS
A responsible participant in the global economy... RELATIVE EQUITIES PERFORMANCE SINCE 2000
• Ranked number one in Africa with regard to Strength of Investor
Protection (21st globally) and Protection of Minority
Shareholders' Interests (30th globally)
• Ranked 31st in the world in terms of Efficiency of Legal
Framework in Settling Disputes*
• Progressive Constitution and sound governance framework.
• Independent judiciary provides respect for the rule of law.
• Actively addressing corruption.
• Meaningful contributor to global governance.
Superior long-term investment returns...
• South Africa has produced solid financial returns for portfolio investors.
• The Johannesburg Securities Exchange All Share Index has outperformed
other emerging market indexes since the start of the new millennium. Sources: National Treasury analysis using Bloomberg data
Source: The Case for Investing in South Africa: Executive Summary. Accelerating Economic Growth by Building Partnerships.
South Africa Investment Conference 2018. INVESTSA.INVESTMENT ENVIRONMENT:
STRONG FOREIGN INVESTOR PRESENCE
AND TRACK RECORD
• The overall stock of foreign direct investment (FDI) in the economy represented 42.8% of GDP in 2016, up from 5.8% in 1994.
• Inward FDI traditionally dominated by European investors, particularly from the United Kingdom.
• Fast-growing presence of Asian investors in recent years, predominantly from China.
COMPOSITION OF, AND TRENDS IN, TOTAL FDI STOCK FOR SELECT YEARS
(AT CONSTANT 2016 PRICES)
Source:
The Case for Investing in
South Africa: Executive
Summary. Accelerating
Economic Growth by Building
Partnerships.
South Africa Investment
Conference 2018. INVESTSA.
PLATFORM TO SUPPORT GROWTH:
WORLD-CLASS INFRASTRUCTURE IS A
COMPETITIVE ADVANTAGE
Ranked number one in Africa on the World Bank's Logistics Performance Index...
- 158 952km of paved roads (10th globally). South Africa is ranked 50th globally for quality roads.
- 20 986km of railways (13th globally for length of railways).
Road, rail and
- Eight seaports:
port facilities
• Two of the world's top container ports (Durban and Cape Town).
• Two of the world's largest dry bulk ports (Richard Bay and Saldanha Bay).
Beneficiation/ - Installed generation capacity of 47.3KM, with significant excess capacity coming on stream.
energy capacity
Most advanced - Internet and personal computer penetration are the highest in the region, with 54% of the individuals using the Internet.
infrastructure - Upload and download speeds are significantly higher than other regional economies.
- 144 airports with paved runways.
Ease of air travel - Ranked 25th globally for Quality of Air Transport Infrastructure.
Source: The Case for Investing in South Africa: Executive Summary. Accelerating Economic Growth by Building Partnerships.
South Africa Investment Conference 2018. INVESTSA.PLATFORM TO SUPPORT GROWTH:
LARGE MARKETS THAT COULD BE ACCESSED
Domestic market... Gateway to Africa...
- A population of 56.5-million people and a growing middle class. - Location of choice for multinationals in Africa, underpinned by factors such as
South Africa ranks 27th globally for its domestic market size. a skilled labour force, established infrastructure and a world-class banking and
financial services sector, among others.
- A total of 37.7-million people in the working-age category. - The cost of doing business in South Africa is a major pull factor, underpinned by
the supportive environment and relative competitive advantages on the continent.
- Young population, as 66% are under the age of 35.
- Provides access to the continent, with a population of over one billion and a GDP
of USD 2.2-trillion.
- Young, vibrant population presents major opportunities for
investors. - Regional partnerships, including participation in SADC, the Southern African
Customs Union (SACU) and in the new Africa Continental Free Trade Area, provide
platforms for growth across several sectors.
Source: The Case for Investing in South Africa: Executive Summary. Accelerating Economic Growth by Building Partnerships.
South Africa Investment Conference 2018. INVESTSA.
PLATFORM TO SUPPORT GROWTH:
PREFERENTIAL ACCESS TO KEY WORLD MARKETS
• South Africa is a member of the World Trade Organisation.
• Access to global markets has been enhanced through bilateral agreements with most of South Africa’s major trading partners.
Preferential access to key export markets has been secured through various agreements and by participating in regional
economic communities.
The African Continental Free Trade Area will boost intra-African trade and create a large market of over one billion people and a combined
GDP of USD2.2-trillion that will unlock industrial development.
Source: The Case for Investing in South Africa: Executive Summary. Accelerating Economic Growth by Building Partnerships.
South Africa Investment Conference 2018. INVESTSA.PLATFORM TO SUPPORT GROWTH:
ACCESS TO AFFORDABLE CAPITAL
World-class capital markets... ...reflected in capital-raising statistics*
Source: The Case for Investing in South Africa: Executive Summary. Accelerating Economic Growth by Building Partnerships.
South Africa Investment Conference 2018. INVESTSA.
POLICY FRAMEWORK INCENTIVISES
INVESTMENT TO STIMULATE GROWTH:
INDUSTRIAL POLICY SUPPORT
South Africa is actively seeking to enhance investment levels Industrial policy framework
Comprehensive suite of financial grants,
- South Africa provides active support for investors by providing a wide
range of incentives, including a compressive suite of tax incentives tax incentives and other forms of
for investment in special economic zones (SEZs). business support for investors.
- Incentives offered by SEZs include:
Policy and administrative reforms to
• Preferential 15% corporate tax;
• Value-added tax (VAT) and customs duty suspension in stimulate investment.
South Africa's customs-controlled areas;
• Employment incentives;
catalytic approach • Building allowance; and
for investment • Preferential land rental and utility rates. Incentives for investment in special
economic zones.
- Investment in labour-absorbing industries is encouraged through
various mechanisms.
- Financial assistance is provided by state-owned development finance Attractive support and incentive system
institutions (DFIs) such as the Industrial Development Corporation and financing by state-owned DFIs for
(IDC), the Development Bank of Southern Africa (DBSA) industrial development and investment
and the Land Bank.
promotion.
Source: The Case for Investing in South Africa: Executive Summary. Accelerating Economic Growth by Building Partnerships.
South Africa Investment Conference 2018. INVESTSA.POLICY FRAMEWORK INCENTIVISES
INVESTMENT TO STIMULATE GROWTH:
INTERVENTIONS TO ENSURE SOCIAL STABILITY
Government inteventions are yielding positive results.
Source: The Case for Investing in South Africa: Executive Summary. Accelerating Economic Growth by Building Partnerships.
South Africa Investment Conference 2018. INVESTSA.
POLICY FRAMEWORK INCENTIVISES
INVESTMENT TO STIMULATE GROWTH:
ECONOMIC TRANSFORMATION AND REFORM
Source: The Case for Investing in South Africa: Executive Summary. Accelerating Economic Growth by Building Partnerships.
South Africa Investment Conference 2018. INVESTSA.POLICY FRAMEWORK INCENTIVISES
INVESTMENT TO STIMULATE GROWTH:
REFORMS TO ADDRESS OBSTACLES TO INVESTMENT
Source:
The Case for
Investing in South
Africa: Executive
Summary.
Accelerating
Economic Growth
by Building
Partnerships.
South Africa
Investment
Conference 2018.
INVESTSA.
POLICY FRAMEWORK INCENTIVISES
INVESTMENT TO STIMULATE GROWTH:
IMPROVING THE EASE OF BUSINESS
South Africa offers an attractive proposition on the African continent, with an operating environment that is conductive to,
and supportive of business development.
Source: The Case for Investing in South Africa: Executive Summary. Accelerating Economic Growth by Building Partnerships.
South Africa Investment Conference 2018. INVESTSA.SECTORAL STRENGTHS
OF SOUTH AFRICA’S PROVINCES
Source: The Case for Investing in South Africa: Executive Summary. Accelerating Economic Growth by Building Partnerships.
South Africa Investment Conference 2018. INVESTSA.SELECT EXTRACTS FROM THE STATE OF THE NATION ADDRESS 0 7 F E B R UA RY 2 0 1 9
INVESTING IN SOUTH AFRICA
• R1.2 trillion - the amount of investment earmarked for South Africa over five years.
• R300 billion - the amount of investment pledges from South Africa and international companies attracted from
 the Investment Conference.
• R17 billion - the amount of investment recorded in 2017.
• R70 billion - the inflow of investment into South Africa in the first three quarters of 2018.
• R187 billion - the value of projects that are being implemented following the investment conference that was held in 2018.
• R26 billion - the value of projects that are in pre-implementation phase following the investment conference that
 was held in 2018.
                                                         Source: State of the Nation Address (SoNA). 07 February 2019.South African Government

TOURISM
• 10 million - the number of tourists that visited South Africa in the past year.
• 21 million - the target number for visitors coming to South Africa by 2030.
• 2 million - the number of jobs that the export industry can create in food and agriculture construction, transport, retail,
 and the creative and cultural industries by 2030.
• 3 000 km - the size of South Africa's coastlines. South Africa has one of the world's longest coastlines.
                                                         Source: State of the Nation Address (SoNA). 07 February 2019.South African Government

OCEANS ECONOMY
• R30 billion - the estimated value of investments created through Operation Phakisa on the Oceans Economy.
• Over 7 000 direct jobs have been created through Operation Phakisa.
• R3,8 billion - the expected investment in the Oceans Economy over the next five years by government.
• R65 billion - the expected investment in the Oceans Economy over the next five years by the private sector.
• 100 000 - the number of direct jobs expected to be created through investments in the Oceans Economy.
• 250 000 - the number of indirect jobs expected to be created through investments in the Oceans Economy.
                                                         Source: State of the Nation Address (SoNA). 07 February 2019.South African Government

INFRASTRUCTURE DEVELOPMENT
• More than R1,3 trillion - the amount that has been invested to build, among others, hundreds of schools and
 two new universities.
• R100 billion - the amount committed by Government into the Infrastructure Fund over a 10-year period.
                                                         Source: State of the Nation Address (SoNA). 07 February 2019.South African Government
STREAMLINED
INVESTMENT SERV
STREAMLINED
INVESTMENT SERVICES
Welcome to the Investment facilitation services •
InvestSA One Stop Shop The OSS acts as your investment home away
from home by facilitating meetings with
Welcome to the
•
Investment facilitation services
Thanks to the InvestSA One Stop Shop (OSS)
• Information on trade and investment in the
governmental stakeholders and providing
it’s never been easier or faster to invest in Western Cape, South Africa and Africa.
InvestSA One Stop Shop The OSS acts as your investment home away
Cape by
from home Town, the Western
facilitating Capewith
meetings and South
access to investor resources. Further to this
Thanks to the InvestSA One Stop Shop (OSS) it also offers: system to ensure that
• A lead-tracking
Africa. stakeholders and providing
governmental
it’s never been easier or faster to invest in prospective investors
• The provision ofreceive quality
facilities and
access to investor resources. Further to this services until their respective projects •
Cape Town, the Western Cape and South The OSS cuts through red tape and departmental representatives to assist
it also offers: reach investors
the point with
of commercialisation.
Africa. streamlines the investment value chain for business registration
• The provision of facilities and •
medium to large sized companies looking • An •entry point forproperty
Intellectual investorsprotection,
in need
The OSS cuts through red tape and departmental representatives to assist
to invest in South Africa. of regulatory compliance.
applications for national and local
streamlines the investment value chain for investors with business registration
incentives,
• The provision applications for
of pre-approval work visas
information
Making business a pleasure to investors
medium to large sized companies looking • Intellectual property protection,
to invest in South Africa. • Temporary (i.e. market data, costs,
and permanent residence,
in South Africa
applications for national and local •
incentives, projectfor
registration approval, visits, local
tax purposes, and any
incentives, applications for work visas
Making business a pleasure For the ease and convenience of doing partners, etc.)
other regulatory requirements (licenses,
• Temporary and permanent residence,
business, the OSS is located in one building.
in South Africa
authorisations,
• The provision registrations,
of facilitation servicesetc.)
to to do
registration
Which means for tax
wepurposes,
act as your and any
centralised business in Southapprovals,
Africa andimport
the
investors (i.e. permits,
For the ease and convenience of doing other regulatory requirements (licenses,
contact point, as opposed to you dealing Western
equipment & rawCape.
materials, work •
business, the OSS is located in one building. authorisations,
with a multituderegistrations, etc.) todepartments
of government do
permits, etc.) desk, centre manager and office
• A front •
Which means we act as your centralised business in South Africa and the
in different locations. The OSS has made
contact point, as opposed to you dealing Western Cape. in fostering a better business • Incentive management
facilitation.service.
great strides •
with a multitude of government departments environment in Cape Townand andoffice
the Western• Participation
• High-end, accessiblereform.
facilities where
• A front desk, centre manager in regulatory
in different locations. The OSS has made Cape, helping to make the investment investors can meet relevant stakeholders
management service.
great strides in fostering a better business process here as seamless as possible. • A collaborative interface between
to discuss investment opportunities senior- and
environment in Cape Town and the Western • High-end, accessible facilities where level government
plans. agents and investors.
Cape, helping to make the investment investors can meet relevant stakeholders
process here as seamless as possible. to discuss investment opportunities and
plans.
Contact Us
For more seamless investment help, contact:
Contact Us oss@wesgro.co.za • 021 023 0900
For more seamless investment help, contact: 46 Street Georges Mall, Cape Sun Corner, Strand Street 8001
oss@wesgro.co.za • 021 023 0900
46 Street Georges Mall, Cape Sun Corner, Strand Street 8001
Yunus Hoosen Salman Kajie
2701 InvestSA AD.indd 1
2701 InvestSA AD.indd 1 Head: Head: 2019/02/19 2:17 PM
InvestSA InvestSA One Stop Shop Western Cape
yhoosen@thedti.gov.za salman@wesgro.co.zaINVEST IN
O W N &
CAPE T APE
ES TE RN C
THE W
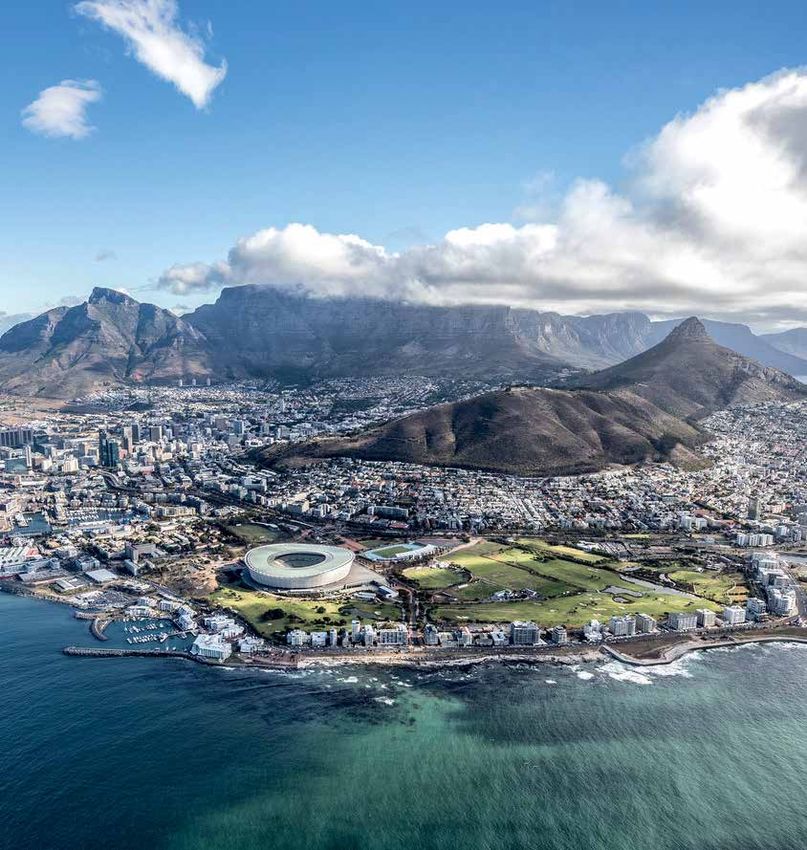
We’re a gateway to the rest of the continent, with Africa’s population expected to grow from
1.1 billion to 2.4 billion by 2050. Our region has also welcomed 299 direct investments,
attracting over US$7.6 billion worth of FDI in just under nine years.
From our agricultural innovations and world-class infrastructure to our growing and resilient
economy. Cape Town and the Western Cape boast a long list of opportunities in a variety of
sectors. Here are even more reasons to invest in our growing city and province.1 THE WESTERN CAPE IS ONE OF THE
BIGGEST ECONOMIES ON THE AFRICAN
CONTINENT.
RELATIVE SIZE OF SOUTH AFRICA,
WESTERN CAPE & CAPE TOWN TO AFRICAN MARKETS, 2016
(USD BN: ADJUSTED AT
RELATIVE SIZE OF2010
SOUTH PRICES & FORCAPE
AFRICA, WESTERN EXCHANGE RATES)
& CAPE TOWN TO AFRICAN MARKETS,
2016 (USD bn: ADJUSTED AT 2010 PRICES & FOR EXCHANGE RATES)
Namibia
Senegal
Botswana
Gabon
Mozambique
Libya
Uganda
Zambia
Cameroon
Congo (DRC)
Cote d`Ivoire
Cape Town
Tanzania
Ethiopia
Ghana
Tunisia
Kenya
Western Cape
Sudan
Angola
Morocco
Algeria
Egypt
South Africa
Nigeria
0,0 50,0 100,0 150,0 200,0 250,0 300,0 350,0 400,0 450,0 500,0AFRICAN COMPARISONS:
PER CAPITA GDP AT CURRENT USD PRICES, 2016
Seychelles 15217
Mauritius 9679
Equatorial Guinea 8742
Gabon 7002
Botswana 6917
Libya 6826
Western Cape 6298
South Africa 5274
Namibia 4415
Algeria 3917
Angola 3711
Tunisia 3657
Cabo Verde 3038
Swaziland 2983
Morocco 2937
Egypt 2823
Nigeria 2176
Sudan 2094
Djibouti 2007
Africa 1752
0 2000 4000 6000 8000 10000 12000 14000 16000
SOUTH AFRICA’S AVERAGE
SOUTH AFRICA'S ANNUAL GDP GROWTH,
AVERAGE ANNUAL 2013-2017
GDP GROWTH, 2013-2017
2,0%
1,8%
1,6%
1,4%
1,2%
% growth
1,0%
0,8%
0,6%
0,4%
0,2%
0,0%
Western Eastern Northern Free KwaZulu- North Mpumala
Gauteng Limpopo
Cape Cape Cape State Natal West nga
Provinces 1,7% 0,9% 1,6% 1,0% 1,7% 0,7% 1,8% 1,2% 1,3%
South Africa 1,5% 1,5% 1,5% 1,5% 1,5% 1,5% 1,5% 1,5% 1,5%2 THE WESTERN CAPE HAS A HIGHLY
DIVERSIFIED ECONOMY, DOMINATED BY
THE SERVICES SECTOR.
THIS IS COMPARABLE TO HIGHLY
DEVELOPED ECONOMIES.
WESTERN CAPE GDP BY SECTOR, 2004 - 2016
Source: Quantec, 20183 THE WESTERN CAPE IS AN AGRICULTURAL
POWERHOUSE.JOB
CREATION
The Western Cape is the 8th largest
economy in Africa.
Over 500 000 jobs (Real GDP using constant 2010 USD
have been added to the region since 2010. for 2016 GDP figures (Fitch))
GROWING ECONOMY
Sub-Saharan Africa is forecast to be the
2nd fastest growing global region
between 2018 and 2023, with an average growth rate of 3.8%.
Source: Source:
IMF, 2018 UNICEF
3.8
Its market is expected to grow from
1.1 billion to 2.4 billion
Cape Town and the Western Cape is a gateway to Africa. by 2050.WORLD-CLASS
INFRASTRUCTURE
The Western Cape Government spent close on
US$1.6 billion on road infrastructure since 2009.
Cape Town has 848kms of fibre-optic cables and 25 switching
facilities.
Fibre-optic cables and microwave links connect 346 Cape Town
city buildings at speeds of up to 1Gbps.
INVESTMENT
HEALTH
The Western Cape has spent over US$400 million
on health-care capital infrastructure in the last 10 years.
20 FDI projects were recorded into South Africa’s
medical devices and pharmaceuticals sector with a total capital
investment of US$600 million between January 2008
and December 2017. Source:
FDI Markets,
2018SKILLS
& EDUCATION
The Western Cape has the
highest mathematics pass rate.
The province’s four major universities attract thousands
of foreign students.
70% of international students attending the universities
are from other African countries.
Source: CHEC
KNOWLEDGE ECONOMY
The Western Cape has the largest library
network in South Africa.
385
The Department of Cultural Affairs and Sport will provide
library service points with free public Wi-Fi by 2020,
making it easier for residents to access information in the growing
knowledge economy.
ACCESS TO SERVICES
Local Governments in the Western Cape have the highest
rate of clean audits in South Africa.
Close to 100% access to basic services
for residents, and reliable water, electricity and sewerage for industry.
StatsSA Non-Financial Census of Municipalities 2018.RESILIENT
ECONOMY
The City has budgeted over US$1 billion for alternative
water supplies over the next 5 years, making it
a leader in climate change resilience,
and future proofing it for investment.
Cape Town is the first city in the world to decrease
water usage by 50% in three years, as recognised
by the International Water Association. The city is also a member of “100 Resilient Cities”,
an initiative pioneered by the Rockefeller Foundation.
GLOBALLY 1
CONNECTED
Cape Town International Airport is the
best in Africa, winning the sought after
Skytrax award for three years running.
Over 10 million total passengers in 2017, connected to over 21 countries, with 750 000
international inbound seats and 13 new routes added in the last three years.
Source: ACSA
AIR
ACCESS 9.6
International passenger numbers at the Cape Town International **The Air Access initiative is a
partnership between City of Cape Town,
Airport terminal grew by9.6% in 2018 after an already impressive
Western Cape Government, Airports
Company South Africa, South African
Tourism, Cape Town Tourism, Wesgro
16% growth in 2017, driven by the Air Access initiative**. and private sector partners.ACCESS TO AFRICA Cape Town and the Western Cape connects you to the rest of Africa. Total exports from the Cape to the rest of the continent were valued at US$3.2 billion in 2017 alone.
THE CAPE IS A GATEWAY TO THE REST OF AFRICA, WITH R45 BILLION
EXPORTED TO THE CONTINENT
                                                                     WESTERN CAPE
                                                                        WESTERN CAPEREGIONAL   EXPORTS,
                                                                                     REGIONAL EXPORTS, 2017 2017
                                                         35%
Growth of the Western Cape Exports, 2014-2017

                                                                                                                                  Africa R45bn
                                                         30%

                                                         25%                          Americas R12bn

                                                         20%

                                                         15%
                                                                                                                   Asia R23bn                         Europe R36bn
                                                                        Oceania R2bn
                                                         10%

                                                           5%

                                                           0%
                        -10%                         -5%        0%          5%          10%          15%          20%          25%           30%          35%          40%          45%
                                                                     2017 SHARE  OF WESTERN CAPE EXPORTS
                                                                            2017 Share of Western Cape Exports
                                                                                                                                                   Source: Quantec and own calculations, 2017
                                                                Size of bubble depicts valueNote the growth rate are in Rands. Therefore exchange rate fluctuations have not been accounted for

                                                                WESTERN CAPE TRADE, EXCLUDING PETROLEUM
                                                        140

                                                        120

                                                        100

                                                         80
                 Value (ZARbn)

                                                         60

                                                         40

                                                         20

                                                           0

                                                        -20

                                                        -40
                                                                 2008        2009        2010         2011         2012        2013         2014        2015         2016        2017
                                                Exports          51,4        44,3        48,8         50,8         57,2        68,6         83,8        101,5        109,8       111,3
                                                Imports          55,0        49,5        47,7         57,5         70,8        86,9         95,0        111,2        115,5       109,4
                                                Trade balance    -3,5        -5,2         1,1         -6,8       -13,6 -18,3 -11,2                       -9,7        -5,7         1,9
TOP 10 IMPORT
PRODUCTS, 2017
TOP 10 EXPORT
PRODUCTS, 2017
Source:
Quantec, 2018
FOREIGN
DIRECT INVESTMENT
The Western Cape welcomed
299 direct investments, Source:
attracting over US$7.6 billion worth of FDI (in the last ten years) FDI markets, 2018
This facilitated close to 20,000 employment opportunitiesEASE OF
DOING BUSINESS
The InvestSA “One Stop Shop” in Cape Town is a multi-faceted
collaboration between National, Provincial and Local Government
alleviate ‘red tape’ issues
helping to
experienced by investors.
Key governmental departments and agencies
are located under one roof, servicing investors.
WESTERN CAPE - FDI BREAKDOWN
BREAKDOWN OF OF
BREAKDOWN FDIFDI
BYBYSOURCE
SOURCE MARKETS, 2003-2017
MARKETS, 2003-2017
30% BREAKDOWN OF FDI BY SOURCE MARKETS, 2003-2017
30%
25%
25%
20%
% Share
20%
15%
% Share
15%
10%
10%
5%
5%
0%
UK United States Germany Netherlands France China Italy Spain Switzerland Denmark
0%
% Projects 25,50% 22,38% 7,37% 5,38% 4,82% 3,97% 3,12% 2,27% 2,27% 1,98%
UK United States Germany Netherlands France China Italy Spain Switzerland Denmark
% Projects
% Capex 12,94%
25,50% 20,84%
22,38% 7,30%
7,37% 5,94%
5,38% 6,13%
4,82% 1,34%
3,97% 8,38%
3,12% 2,47%
2,27% 0,79%
2,27% 0,52%
1,98%
% Capex 12,94% 20,84% 7,30% 5,94% 6,13% 1,34% 8,38% 2,47% 0,79% 0,52%
FDI BREAKDOWN BY SECTOR, JAN 2003-SEP 2017
25% FDI BREAKDOWN BY SECTOR,
FDI BREAKDOWN JANJAN
BY SECTOR, 2003-SEP 2017
2003-SEP 2017
25%
20%
20%
15%
% Share
15%
10%
% Share
10%
5%
5%
0%
Industrial
Alternative/R
0% Business Software & IT Financial Communicati Transportatio Machinery, Electronic
Industrial & Components enewable Chemicals Textiles
Services services Services ons n Equipment Alternative/R
Business Software & IT Financial Communicati Transportatio Machinery, Electronic energy
Tools enewable Chemicals Textiles
Services services Services ons n Equipment & Components
% Projects 19,55% 18,13% 7,93% 7,08% 4,82% 4,53% 3,97% energy
3,68% 3,12% 3,12%
Tools
% Projects
% Capex 4,40%
19,55% 5,23%
18,13% 3,02%
7,93% 15,16%
7,08% 4,17%
4,82% 1,00%
4,53% 0,86%
3,97% 17,42%
3,68% 0,76%
3,12% 1,33%
3,12%
% Capex 4,40% 5,23% 3,02% 15,16% 4,17% 1,00% 0,86% 17,42% 0,76% 1,33%GLOBAL
BUSINESS
Cape Town is home to Amazon, employing more than 2000 people.
Broad-based multinational internet and media giant Naspers was born in
Cape Town, and chooses to have headquarters here, offering services in
more than 130 countries.
SELECTED COMPANIES THAT HAVE INVESTED IN CAPE TOWN
OVER THE PAST 10 YEARS:
Amazon has Hisense opened a GlaxoSmithKline Kimberly-Clark of IBM opened three
expanded its new headquarters (GSK) investments South Africa has satellite locations in
customer contact facility in Cape Town opened a plant in expanded its paper, Africa, including
centre in to coordinate the Cape Town to printing & packaging Cape Town.
Cape Town company's presence increase production manufacturing
across Africa. facility in Cape Town
Harvard University Airbus invested in Oracle opened a Juwi opened a Cape Wind Prospect's
opened a centre for upgrading its software and IT Town office in Cape Town office
African Studies office servicing and services sector in response to rapid will serve the entire
in Cape Town. maintenance facility a design regional growth and African continent.
in Cape Town. development and as part of its
testing project. international growth
Source: Invest Cape Town 2017/18. City of Cape Town.LEADING SECTORS HEADQUARTERED IN THE CAPE
Sectoral Pockets of Excellence
1 BUSINESS SERVICES
The business service sector, including Business Process Outsourcing (BPO) and Information
Technology (IT) has been the largest contributor to employment growth in Cape Town over the
last 10 years. In 2016, Cape Town accounted for 82% of the Western Cape and 13% of South
Africa’s business services sector.
The City has attracted a number of foreign companies into its business services sector, with
61 investment projects being funded over the period between 2006 and 2016. The top two
business service subsectors attracting FDI during this time were professional services (31
projects) and creative industries (17 projects) (FDI Intelligence).
Source: Invest Cape Town 2017/18. City of Cape Town.1 .1 BUSINESS PROCESS OUTSOURCING
The Western Cape is home to 61% of South Africa’s international BPO clients. The industry
continues to attract business from top firms across Europe, the United States and Australia.
The BPO sector is a major economic driver in Cape Town, accounting for 54 864 jobs and
contributing about R12 billion to the region’s annual GDP.
BUSINESS PROCESS OUTSOURCING
In 2016, South Africa was named Offshoring destination of the Year at the 2016 Global Sourcing
Association (GSA) awards in London (Business Process Enabling South Africa (BPESA), 2016:6).
South Africa also received the National Outsourcing Association's (NQA) Skills Development Project
of the Year award in 2014, the European Outsourcing Association (EQA) Offshoring Destination of
the Year award in 2013 and the NQA's Offshoring Destination of the Year award in 2012.
The South African government has identified Business Process Outsourcing (BPO) / contact centres
as a key sector for job creation for the large population of unemployed South African youth. in 2016
the Western Cape BPO industry contributed 51,300 jobs to the total BPO industry in the country, 30
800 of which were domestic and 20,500 of which were offshore. In the same year, the Western Cape
BPO Industry was dominated by the telecoms (30,6%) and financial services (25,7%) industries
(BPESA, 2016). Of the industry's operations in the Western Cape, 57,7% are of an outsourcer nature
and 42,3% are captive. The predominant markets it serviced in 2016 were the United Kingdom and
Australia. In 2016, inbound customer services and inbound sales dominated (BPESA, 2016).
Cape Town plays host to the majority of the Western Cape's BPO industry companies. The city is
particularly viewed as an offshore outsourcing hub, having won two awards in the 2013 Offshoring
Destination of the Year Awards. Its popularity as a BPO business destination has grown steadily.
Source: Invest Cape Town 2017/18. City of Cape Town.
Lufthansa Global Telesales
Inbound customer service
MPC Recruitment Group
TutorABC Inbound sales
CSC
Teleperformance South Africa Debt collection
Global Media Services Other back office processing
Collinsons Group (document processing, research, etc.)
Bloomberg
Outbound sales
Shell
AskOsca Legal Process Outsourcing
SERVICE FUNCTIONS JTC Group
PERFORMED BY Cognia Law Other
THE BPO INDUSTRY
Exigent
IN THE WESTERN
CAPE Wonga
SimplyTalk
Ipreo Source: Invest Cape Town
Datacash 2017/18. City of Cape Town.
Ambition 24 Hour Group
Bwanglarno
Pixelfaerie1 .2
INFORMATION COMMUNICATION
TECHNOLOGY
Western Cape is the digitech hub of Africa and a leading location for technology start-ups and
venture capital deals.
Between 2008 and 2017, a total of 54 FDI projects were recorded into the Western Cape’s
software and IT services sector, representing a total capital investment of ZAR5.24bn
(FDI Intelligence, 2018).
AFRICA’S
TECH HUB
Cape Town is the Tech Capital of Africa.
The Cape Town-Stellenbosch tech ecosystem in the Western Cape is the most productive in
Africa, employing over 40,000 people. More than Lagos and Nairobi combined.
Cape Town is the leading location in the country for technology start-ups and venture capital
deals (Price Waterhouse Coopers (PWC), South African Venture Capital and Private Equity
Association (SAVCA), 2015). The City has also been a technology leader in the domains of
mobile software, revenue management and payment processes. The value of FDI over the last
10 years in the Software and IT services is R4 0704 million (7,1% of total FDI into Cape Town
over that period).
According to PWC (2015) 56% of the 742 emerging tech or tech-enabled companies they
surveyed as part of their 2015 study, were headquartered in the Western Cape, of which the
majority can be assumed to be based in Cape Town. Similarly, the 2015 Ventureburn Survey
found that 59% of start-ups are based in the Western Cape. The concentration of these
companies in Cape Town is reflected in the fact that the Western Cape hosted 75% of venture
capital deals in 2015, a 40% increase from 2012 (SAVCA, 2015).
Source: Invest Cape Town 2017/18. City of Cape Town.THE E-COMMERCE ECOSYSTEM IN CAPE TOWN
Software and app development Payment Gateways Pay U, Online traffic marketing Quirk,
Fontera, Alacity, Peruzal, Refresh, Payfast, PayGate, Peach Glow, Liquorice, IncuBeta
Creative Media, Realm Digital Payments
TRADITIONAL RETAILERS E-TAILERS LOGISTICS
C2C
E-COMMERCE B2C AND B2B E-COMMERCE In-house
Companies in Cape
Town with a strong • MrDelivery /
Online classifieds General retail Niche retail
e-commerce presence (Takealot)
• Gumtree (1) • Takealot (486)+ • Yuppiechef (7)
• Woolworths • Netflorist Outsourced:
• OLX (2)
• Pick n Pay Clothing and • Seeds for Africa • On the dot
accessories • RAM
• Zando (8) Travel and Hospitality: • ARAMEX
• Spree (7) • SafariNow
• Superbalist (9) • TravelGround
• Rubybox • Lekkerslaap
E-goods: Price comparison:
• Quicket • Price Check (5)
• Travelstart
INDUSTRIES BODIES
E-COMMERCE AWARDS 2016
• Cape IT initiative (Capaciti, Bandwidth Barn)
Takealot
• Silicon Cape
SA's favourite e-commerce website, best mobile store
• Ecommerce Forum Africa
Yuppiechef
• CodeX
Best e-commerce store, best shopping process
• Launch lab
* Numbers in brackets indicate the company's ranking among the most-visited e-commerce websites in South Africa.
+ Prior to the Takealot / Kalahari merger, Kalahari's website was ranked 4th, and Takealot's 6th.
Source: Invest Cape Town 2017/18. City of Cape Town.
2 FINANCIAL SERVICES
The Western Cape’s financial services sector was the largest contributor to GDP in 2017,
contributing ZAR48 billion, and having experienced relatively consistent growth of 4.1%, on
average, over the period 2013 to 2017.
A large proportion of private investment and asset management services, as well as insur-
ance and personal service companies are located in Cape Town. Cape Town is also emerging
as a significant financial services hub in the country.FINANCIAL SERVICES
Cape Town's financial services sector was the largest contribution to GDP in 2016, contributing R43
billion, having experienced relatively consistent growth of 3,8% on average, over the period 2011 to
2016. A large proportion of private investment and asset management services, as well as insurance
and personal service companies are located in Cape Town. Cape Town is emerging as a significant
services hub in the country.
Top insurance companies such as Old Mutual Africa, Santam, Direct Axis, Metropolitan, and Sanlam
are headquartered in Cape Town and renowned investment and financial advisors such as Allan Gray,
Price Waterhouse Coopers and Investec are also based in the city. Five major South African banks
(First National Bank, ABSA, Standard Bank, Nedbank and Capitec) have offices within the city, and
have extensive services located throughout the metropolitan.
Source:
CAPE TOWN FINANCIAL INDUSTRY INDICATORS Invest Cape Town
2017/18. City of
Cape Town.
1
3 FILM AND MULTIMEDIA
Cape Town Film Studios is the the first world-class,
custom built, Hollywood style film studio complex in
Sub-Saharan Africa. Feature films include Tomb Raider and Mad Max: Fury Road.
New-media hub of South Africa: home to more than half
of the nationally registered gaming companies and the Over 5000
largest animation studio in Africa. official City of Cape Town
- and countless privately
- owned locations.
A popular commercial production destination, with
62% of national shoot days located in the province.
Source: CT & Western Cape Film and Media Sector Study 20174 TOURISM
TOURISM
ECONOMY
                                                                   Source:
                                                                   DEDAT 2018

The Western Cape generated over
US$2.9 billion in
tourist expenditure
in 2017, and supported over 300 000 jobs.

BUSINESS TOURISM
Cape Town is the    Meetings Capital of Africa
hosting the largest number of international association meetings
on the continent.
                                                                   Source: ICCA 2017

Meetings aligned to key economic sectors:
        • Medical sciences,
        • Technology,
        • Economics and
        • Education.

34 400 international
delegates attended conferences
in the Western Cape.

                                                                             Source:

160 000 participants              attended
                                                                          ICCA 2017

conferences in the Western Cape in the last five years.
5 RENEWABLE ENERGY
The Western Cape is fast becoming the manufacturing and knowledge hub for the green
economy.
The designation of the Atlantis Green Technology SEZ, in particular has made the region even
more appealing for investors in the renewables manufacturing industry.
GREEN
ECONOMY
The Cape has already attracted US$1.2 billion
investments in renewable energy projects.
Source:
GreenCape
South Africa has the fastest growing green economy.
70% of renewable energy
manufacturing takes place in the Western Cape.6 AGRICULTURE AND AGRI-PROCESSING
Agri-business is critically important for Africa’s future economic growth.
In the Western Cape, the agriculture and agribusiness sector is one of the most important
components of the economy. It leads regional exports, and lies at the heart of the region’s
ability to drive economic development, contributing billions to the regional GDP.
AGRICULTURAL 5
INNOVATION
The Western Cape is the 5th largest global exporter
in Africa of agricultural goods. Exports valued at US$4.6 billion in 2017.
The region is home to leading international
brands like Burger King, Parmalat and GC Rieber,
proving that the Western Cape has a globally
competitive Agribusiness sector.
Farmers in the Western Cape are
leaders of agricultural innovation, Source:
Quantec
using drones to improve farming.WINE Source: SAWIS
INDUSTRY
One million bottles
of South African wine are sold per day. 1 million
South Africa is ranked 8th in the world in terms of volume producing 4% of the world’s wine.
21 out of the 23
South African wine routes are
located in the Western Cape.
Source: Vinpro7 ELECTRONICS
Cape Town’s strong skills base enables it to be flexible, agile and innovative in response to ever-
shifting technology possibility frontiers, and rapidly evolving consumer tastes and preferences (City
of Cape Town 2014). The electronics sector, although relatively small is an important contributor
to foreign exchange earnings through both exports and FDI. In 2016, the sector contributed R884
million to the Cape Town economy. Cape Town has a strong company representation across the
following clusters: satellite technology; circuit board and contract manufacturing; audio-visual
product manufacturing (including televisions); telecommunications (excluding cellphones) and
medical technology (City of Cape Town 2014).
Source: Invest Cape Town 2017/18. City of Cape Town.8 FOOD AND BEVERAGES
The Western Cape has a well-established food and beverage manufacturing sector, boasting
some of the country’s largest companies in the sector.
The region’s vast and productive agricultural land with distinctive agricultural yields (including
grapes, deciduous fruits and ostriches), large international port, growing consumer population
and relatively strong skills base, makes it a very competitive location in which to base food
and beverage manufacturing operations.
IN CAPE TOWN
The industry is one of the few manufacturing industries Food and beverage manufacturing is the largest of Cape
in which Cape Town has a positive trade balance Town's manufacturing industries, contributing 3,6% of
and is a very important earner of foreign exchange Cape Town's GVA and 4,1% of its formal employment.
for the City. Recent growth in food and beverage The industry has a metro location quotient of 1,3,
exports provides reason to believe that the sector is meaning that it is relatively more important to Cape
well placed to realise the opportunities presented by Town's economy than it is to other metros and can thus
growing demand for food and beverage products on be considered a comparative advantage industry for
the African continent. Cape Town hosts competitive the city.
clusters in terms of the manufacture of spice and
saucing products, the processing of fish products, the
manufacture of grain mill products (especially cereals),
beer brewing and soft drink production.
Source: Invest Cape Town 2017/18. City of Cape Town.HALAL
BUSINESS
The Western Cape’s halal-relevant exports accounted for 37% of its total exports in 2017,
of which 22% was to Muslim consumers.
92% growth in food
preparation exports from
the Western Cape to the world.
(DEDAT and Wesgro calculations)
9 OIL AND GAS SECTOR POTENTIAL
There are there three major ports in the Western Cape, and the Cape of Good Hope is a
major trade route. In 2016 alone, 5.8 million barrels per day (bpd) of petroleum transited
through the region, representing the third largest trade route. Port of Cape Town is a
key maritime hub with extensive service offerings, in fact it’s home to Africa’s largest
refrigerated container facility
Saldanha Bay is South Africa’s largest and deepest port (quayside draft of 23 m) and
offers servicing of oil rigs en-route around the Horn of Africa. The Saldanha Bay Industrial
Development Zone is a massive boon for development of the oil and gas sector, and the
investor offerings are extensive.KEY
INCENTIVES
Cape Town aims to position itself as a globally competitive city, and considering that numerous
cities across the globe utilise incentives to attract investment, the City of Cape Town also
offers a suite of incentives to attract investment into its key industries and spatial nodes.
Incentive schemes Focus of scheme Nature of Incentives
To encourage private sector-led residential and The Urban Development Zone (UDZ) is a tax incentive
Urban Development commercial development in inner-city areas with administered by SARS. The UDZ allows businesses
Zone (UDZ) tax developed public transport facilities. which fall within its area (the demarcations of which
Incentive are determined by the City) to benefit from significant
tax savings for building development.
To stimulate job creating investment in either the NON-FINANCIAL INCENTIVES INCLUDE:
manufacturing sector or prioritized tertiary sector 1. Fast-tracked development applications
industries in Cape Town. 2. A dedicated investment facilitation service
City of Cape
Eligibility for the City's investment incentives FINANCIAL INCENTIVES INCLUDE:
Town Investment depends on investors meeting certain pre-defined 1. Development application fee waivers
Incentives criteria as spelt out in the Investment Incentives 2. Reduced development charges
Policy. 3. Electricity tariff reductions
4. Broadband line rental holidays
Source: Invest Cape Town 2017/18. City of Cape Town.LET US HELP YOU DO BUSINESS
IN AN INSPIRING PLACE.
The dedicated team in the Enterprise and Investment Department in the City of Cape Town are
on standby to assist you with your investment related queries.
LANCE GREYLING TIM HADINGHAM
Director Investment Facilitation
info@investcapetown.com timothy.hadingham@capetown.gov.za
THEMBINKOSI SIGANDA FAITH KOLALA
Enterprise Development Catalytic Sectors
thembinkosi.siganda faith.kolala@capetown.gov.za
@investcapetown.com
DENVER VAN SCHALKWYK LEAN MULLER
International Relations Investment Promotion
DenverChristopher.VanSchalkwyk lean.muller@capetown.gov.za
@capetown.gov.za
www.investcapetown.comWesgro's dedicated Investment Promotion Team have years of private
sector experience and cover all key-sectors in the Western Cape economy.
We are on standby to make your investment in the Western Cape as seamless as possible.
JAMES MILNE AMANDA TSHAYA
Head of Investment Promotion Head of Agribusiness
james@wesgro.co.za amanda@wesgro.co.za
FRANCES GREEN NONELELA MTWANA
Executive Assistant Agribusiness Administrator
frances@wesgro.co.za nonelela@wesgro.co.za
JARROD LYONS TOWFIQ HENDRICKS
Renewables/GreenCape Agribusiness Portfolio Manager
jarrod@wesgro.co.za towfiq@wesgro.co.za
DINESH HARRY ZAHEER HENDRICKS
Portfolio Manager for Business Growth Service
Manufacturing, Oil and Gas zaheer@wesgro.co.za
dinesh@wesgro.co.za
REHANA BOOLAY RORI TABANE
Investment Promotion Manager Portfolio Manager for
for Special Projects Tech and Manufacturing
rehana@wesgro.co.za rori@wesgro.co.za
www.investwesterncape.comT H A N K
YOUYou can also read