Economic Trends: Key trends in the South African economy - IDC

Page created by Everett Morris
 
CONTINUE READING
Economic Trends: Key trends in the South African economy - IDC
Economic Trends:
Key trends in the South African economy
                                      29
                                      31 March
                                         March 2019
                                                2015
               Department of Research and Information
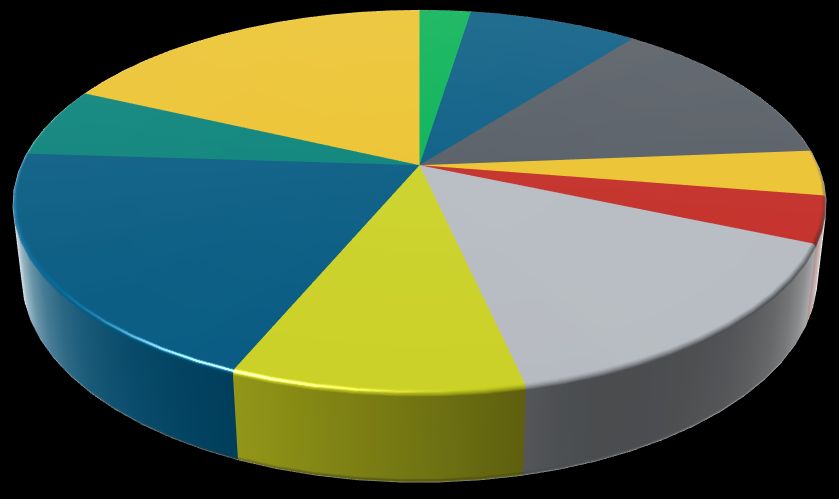
Economic Trends: Key trends in the South African economy - IDC
Contents

Overview                                                    3          Exchange rates                                                17
                                                                       The rand versus the US dollar and the euro
Gross domestic product                                      4          The rand versus other foreign currencies
Gross domestic product                                                 Effective exchange rates of the rand
GDP growth at sectoral level
Sectoral composition of the South African economy                      Balance of payments                                           18
Real GDP growth by economic sub-sector                                 Trade balance
                                                                       Trade performance per sector
Domestic expenditure                                        6          Current account of the balance of payments
Gross domestic expenditure                                             Balance on financial account
Final consumption expenditure by households                            Total reserves and import cover
Final consumption expenditure by government                            Composition of the export basket
Gross fixed capital formation                                          Imports according to broad category
Fixed investment by type of organisation
                                                                       Key export destinations
Inventories
                                                                       Commodities                                                   21
Employment                                                  8
                                                                       Commodity prices
Formal and informal sector employment
                                                                       Gold and platinum
Productivity and unit labour costs
                                                                       Brent crude oil
Unemployment

                                                                       Business cycle indicators                                     22
Manufacturing sector                                      10
Manufacturing GDP and volume of production                             SARB business cycle indicators
Physical volume of production per sub-sector of manufacturing          BER business confidence indicators
Fixed investment and capacity utilisation                              BER/FNB confidence indicators
Utilisation of production capacity per sub-sector
Expectations regarding employment creation                             Miscellaneous indicators                                      23
Expectations regarding employment creation per sub-sector              Retail trade sales
                                                                       New vehicles sales and exports
Inflation and monetary aggregates                           13         Building plans passed and buildings completed
Consumer price inflation                                               Foreign direct investment
Producer price inflation                                               Liquidations of companies
Credit extension to the private sector                                 Petrol price and crude oil prices

Interest rates and yields                                   14         International indicators                                        25
Repo and prime overdraft rates                                         World Gross
                                                                              economicDomestic
                                                                                           climate index Product
Inflation and interest rates                                           GDP growth in advanced economies
Long- and short-term yields                                                   • Conditions
                                                                       GDP growth    in emergingin economies
                                                                                                       the South African economy remain
                                                                                   unsatisfactory.
                                                                       Equity market   performance
Capital markets                                             15                • The
                                                                       Consumer    pricerate  of decline in consumer spending deteriorated to
                                                                                          inflation
Johannesburg Securities Exchange performance                                       5.8%
                                                                       Interest rates    in   Q2  of 2009, its worst performance in almost 25
Shares traded on the JSE                                                          years.
Net portfolio purchases/sales by non-residents                              • of
                                                                       Glossary Factors
                                                                                  termscontributing to poor consumer spending include
                                                                                                                              27
                                                                                  :
Government finance                                          16                             –   Increased job losses
Budget balance
                                                                                           –   Falling real disposable incomes
Government debt
Government savings

Note: An   * in a specific graph indicates % change at constant prices, at a seasonally adjusted and annualised rate.
                                                                                                                                                2
Economic Trends: Key trends in the South African economy - IDC
Overview

The world economy has been facing strong headwinds. These include            Of particular concern is the fact that, already five years into the
increased tension in the global trading arena as a result of US              downturn, business confidence levels in the South African economy are
protectionism and retaliatory measures from the affected trade partners;     not only low, but have declined in certain sectors. In the first quarter of
unfavorable developments in key European economies and continued             2019, confidence levels fell in four out of the five broad sectors
uncertainty surrounding Brexit; decelerating growth in China; the impact     surveyed.
of monetary policy normalisation in some advanced economies; and,
among other factors, geo-political risks. Consequently, its expansion        Overall fixed investment spending contracted by 1.4% in 2018. Difficult
momentum is decelerating.                                                    operating conditions and surplus production capacity saw the quantum
                                                                             of investment outlays in the manufacturing sector fall over time, with the
World GDP growth eased marginally to 3.7% in 2018, from 3.8% in 2017,        2018 levels being 10% lower than in 2011. Consequently, the ratio of
and the International Monetary Fund is now forecasting growth of 3.5%        fixed investment expenditure to overall GDP fell to 18.2% in 2018, the
and 3.6% for 2019 and 2020, respectively.                                    lowest in 13 years.
The United States economy recorded growth of 2.9% in 2018 and is             Nevertheless, employment levels have been rising gradually in recent
working at close to full employment. Activity levels were raised by higher   years, with the South African economy having added 358 000 new jobs
household consumption and fixed investment expenditure, which were           in 2018. However, the unemployment rate remains very high at 27.1%,
fueled by substantial tax reductions and higher fiscal spending.             with more than 6.1 million people unable to find a job.
In the Eurozone, industrial production in Germany slowed as revised          A downward trending leading business cycle indicator confirms the
emissions standards took a toll on its automotive industry. Weakening        weak economic conditions, pointing to subdued growth in the months
consumer spending and export demand also affected the economy’s              ahead. This, along with low confidence levels, does not bode well for a
performance in 2018. Italy’s large fiscal deficit and very high gross debt   swift economic recovery.
ratios have raised sovereign and financial risks, leading to concerns of
potential spill-over effects to the remainder of the monetary bloc.          Consumer spending is expected to remain subdued in 2019, but as
Domestic demand also slowed, with the Italian economy falling back into      confidence levels improve and disposable incomes rise, household
recession in the final quarter of 2018.                                      consumption expenditure should gain some momentum in subsequent
                                                                             years. A fairly favourable inflation trajectory and relatively low interest
The pace of economic expansion in China continued to slow, but               rates should also support gradually higher rates of increase in
remained robust at 6.6% in 2018, compared to 6.9% in 2017. The               household spending.
structural changes under way in the Chinese economy contributed to the
growth moderation. In addition, softer global demand, the impact of          The economy’s weak performance and challenges in tax collection are
higher US tariffs on the country’s exports, coupled with deleveraging        impacting on government revenue and constraining its fiscal space.
efforts, weakening domestic demand and lower growth in industrial            With limited room for a meaningful reduction in government spending,
output also affected economic activity in 2018.                         And  the budget deficit will remain high as a ratio of GDP. The government
                                                                             debt-to-GDP ratio, in turn, is projected by National Treasury to reach
Global equity markets were under pressure during 2018, with many             the 60% mark by fiscal year 2023/24.
closing the year at lower levels. However, several have since rebounded,
stimulated by the US Federal Reserve’s more dovish monetary policy           The credit ratings agencies have expressed concerns regarding the
stance and expectations of a negotiated trade settlement between the US      unfavourable fiscal developments, the financial difficulties faced by key
and China.                                                                   state-owned-enterprises and, among other factors, the economy’s
                                                                             weak growth prospects. The latter have recently taken a heavy blow
The US Federal Reserve is expected to pause its monetary policy              from resumed and widespread load-shedding due to technical and
tightening for a while in order to assess the impact of policy rate hikes,   other operational challenges at Eskom.
which totaled 100 basis points in 2018. Cognisant of fragile economic
growth in the Eurozone, the European Central Bank has adopted a very         It is hoped that various presidential initiatives such as the Economic
cautious monetary policy normalisation process. Although it terminated       Stimulus and Recovery Plan, the Presidential Jobs Summit, the South
its net asset purchases in December 2018, it has refrained from starting     Africa Investment Conference 2018 and other confidence-building
an interest rate hiking cycle.                                                       Gross
                                                                             commitments     made Domestic           Productin his State of the Nation
                                                                                                    by President Ramaphosa
                                                                             Address will bolster private sector investment going forward. These
Foreign direct investment (FDI) flows across the world fell by 19% in        commitments     include greater
                                                                                      • Conditions              policySouth
                                                                                                           in the       certainty and coherence,
                                                                                                                                African   economya stern
                                                                                                                                                       remain
2018 to an estimated USD1.2 trillion, according to UNCTAD. Flows to          fight against unsatisfactory.
                                                                                            corruption and major reforms in the state-owned-enterprise
developed economies dropped by 40%, mainly due to a sharp 73%                sector. If the outcomes become increasingly visible, this will lead to a
decline in Europe. In contrast, FDI flows to developing economies                          The rateand
                                                                                      • business
                                                                             revival in               of decline
                                                                                                           investorinconfidence,
                                                                                                                      consumer spending      deteriorated
                                                                                                                                   in turn translating  into to
increased by 3.1%, with a 5.8% rise for Africa. According to UNCTAD,         increased investment
                                                                                           5.8% in Q2 activity and employment
                                                                                                          of 2009,                creation.
                                                                                                                     its worst performance      in almost 25
Africa could see a rise in FDI inflows in 2019, underpinned by greenfield                  years.
projects targeting the manufacturing sector, commodity price stabilisation   Political developments in the first half of 2019 will be a key determinant
and regional integration efforts.                                            of the economy’s
                                                                                      • Factors  trajectory. Based to
                                                                                                     contributing    on poor
                                                                                                                         the assumption
                                                                                                                               consumerofspending
                                                                                                                                            an investment-
                                                                                                                                                      include
                                                                             and growth-supportive
                                                                                           :            outcome of the national elections, GDP growth
The South African economy was under considerable strain in 2018, as          is forecast to rise to 1.6% in 2019. However, the downside risks to this
evidenced by the 0.8% increase in its GDP in real terms. The generalised     growth outlook are– onIncreased        job losses the negative impacts of
                                                                                                         the rise, considering
weakness was clear across all of its broad sectors and among the             widespread and continued interruptions in electricity supply, fiscal
various drivers of domestic demand.                                                                – Falling
                                                                             challenges and a slowing      worldreal  disposable incomes
                                                                                                                 economy.

                                                                                                                                                                  3
Gross domestic product

                                                                                                                                                           Gross domestic product
                                                Gross Domestic Product (GDP)                                              • South Africa’s economy entered a technical recession in the
                     8                                                                                                      first half of 2018 and, despite a rebound in the subsequent two
                                                                                                                            quarters, GDP growth came to just 0.8% for 2018 as a whole.
                     6
                                                                                                                          • Economic activity was characterised by general weakness
                     4                                                                                                      across all broad sectors. Negative growth in agricultural
                                                                                                                            output in 2018 was mainly due to the high base set in 2017,
% Change (q-o-q) *

                     2
                                                                                                                            when the maize crop was one of the largest on record.
                     0
                                                                                                                          • Mining output fell by 1.7% in 2018, with policy uncertainty,
                     -2
                                                                                                                            weaker global demand and lower commodity prices having
                                                                                                                            been a drag on the sectors’ performance. Excluding gold,
                     -4                                                                                                     mining output would have recorded modest growth.

                     -6                                                                                                   • Although manufacturing output rose marginally (+1%) in 2018,
                                                                                                                            the sector continues to face a difficult operating environment.
                     -8
                          Q2   Q4     Q2   Q4   Q2   Q4    Q2   Q4   Q2   Q4   Q2   Q4   Q2   Q4   Q2   Q4   Q2   Q4
                                                                                                                            This is characterised by weak domestic demand, import
                          2010 |      2011 |    2012 |     2013 |    2014 |    2015 |    2016 |    2017 |    2018 |         penetration, trying conditions in the global trading arena, and
Source: IDC, compiled using Stas SA data
                                                                                                                            other operational challenges such as cost pressures.

                                                                                                                                                    GDP growth at sectoral level

                                                                           Real GDP growth by main economic sector

                                          Total GDP
                                                                                                                                                 2018      2017
                          Personal services (6.0)

                              Government (16.7)

                                                                                                                                           Total GDP (at market prices) in
                                     Finance (22.4)                                                                                             2018 = R4 874 billion

                                     Transport (9.6)

                                        Trade (15.1)

                               Construction (3.8)

                                     Electricity (2.3)
                                                                                                                          Gross Domestic Product
                            Manufacturing (13.5)
                                                                                                                          •   Conditions in the South African economy remain
                                                                                                                              unsatisfactory.
                                        Mining (8.1)
                                                                                                                          •   The rate of decline in consumer spending deteriorated to
                                    Agriculture (2.6)                                                                         5.8% in Q2 of 2009, its worst performance in almost 25
                                                                                                                              years.
                                                         -10              -5                  0                  5                10                15               20           25
                                                                                                                          •   Factors contributing to poor consumer spending include
                                                                                                                       % Change
         Source: IDC, compiled using Stats SA data                                                                            :
                                                                                                                                       –   Increased job losses
           Notes:
           (i) Figures in brackets in the above graph refer to the sector’s percentage share of total GDP at basic prices (constant 2010 real
                                                                                                                            – Falling    prices) in 2018 incomes
                                                                                                                                              disposable

                                                                                                                                                                                              4
Gross domestic product (cont.)
                                                                                    Sectoral composition of the South African economy in 2018
                                                                                                                                                     Agriculture,
                                                                                                                                                     forestry and
                                                                                                                                                        fishing   Mining and
                                                                                         General government                                               2.4%    quarrying
                                                                                              services                                                               8.1%
                                                                                               18.1%
                                                                                                                                                                                                                       Manufacturing
                                                                        Personal                                                                                                                                          13.2%
                                                                        services
                                                                          5.9%                                                                                                                                                      Electricity,
                                                                                                                                                                                                                                  gas and water
                                                                                                                                                                                                                                       3.8%
                                                                                                                                                                                                                                  Construction
                                                                                                                                                                                                                                       3.9%

                                                            Finance, real estate
                                                               and business                                                                                                                                          Trade, catering and
                                                                 services                                                                                                                                              accommodation
                                                                  19.7%                                                                                                                                                     15.0%
                                                                                                                            Transport, storage
                                                                                                                           and communication
                                                                                                                                  9.8%
                                                           Source: IDC, compiled using Stats SA data                                                       Note: Sector share according to GDP at basic prices (current prices)

                                                   Real GDP growth in service-related sectors                                                                                                        Real GDP growth in the manufacturing sector
                    6                                                                                                                                                                15
                                                                                                                  Services sectors include:
                                                                                                                  Electricity, Construction, Trade,
                    5                                                                                             Transport, Finance, Government
                                                                                                                  and Other services.
                                                                                                                                                                                     10
                    4
% Change (q-o-q)*

                                                                                                                                                                 % Change (q-o-q)*

                    3
                                                                                                                                                                                      5

                    2

                                                                                                                                                                                      0
                    1

                    0
                                                                                                                                                                                      -5
                    -1

                    -2                                                                                                                                                               -10
                             Q4        Q2     Q4    Q2      Q4   Q2     Q4   Q2     Q4    Q2     Q4   Q2     Q4     Q2     Q4   Q2     Q4     Q2      Q4                                   Q4    Q2   Q4   Q2   Q4    Q2   Q4   Q2   Q4   Q2   Q4   Q2   Q4   Q2   Q4   Q2   Q4   Q2   Q4
                              |        2010    |    2011     |   2012    |   2013    |    2014    |   2015    |     2016    |   2017    |     2018     |                                    |    2010 |    2011 |     2012 |    2013 |    2014 |    2015 |    2016 |    2017 |    2018 |

Source: IDC, compiled using Stats SA data                                                                                                                        Source: IDC, compiled using Stats SA data

                                                                                                                                                                                                   Real GDP growth in the agricultural sector
                     40
                                                           Real GDP growth in the mining sector
                                                                                                                                                                                     60         Gross Domestic Product
                                                                                                                                                                                     50
                     30                                                                                                                                                                         •    Conditions in the South African economy remain
                                                                                                                                                                                     40
                                                                                                                                                                                                     unsatisfactory.
                     20                                                                                                                                                              30
                                                                                                                                                                                                •    The rate of decline in consumer spending deteriorated to
                                                                                                                                                                 % Change (q-o-q)*
% Change (q-o-q)*

                                                                                                                                                                                     20
                                                                                                                                                                                                     5.8% in Q2 of 2009, its worst performance in almost 25
                     10                                                                                                                                                              10              years.
                                                                                                                                                                                      0
                         0                                                                                                                                                                      •    Factors contributing to poor consumer spending include
                                                                                                                                                                                     -10
                                                                                                                                                                                                     :
                    -10                                                                                                                                                              -20
                                                                                                                                                                                                               –      Increased job losses
                                                                                                                                                                                     -30
                    -20
                                                                                                                                                                                     -40                       –      Falling real disposable incomes
                    -30                                                                                                                                                              -50
                                  Q4     Q2   Q4     Q2   Q4      Q2   Q4     Q2   Q4      Q2   Q4    Q2   Q4       Q2   Q4     Q2   Q4       Q2   Q4                                      Q4    Q2   Q4   Q2   Q4    Q2   Q4   Q2   Q4   Q2   Q4   Q2   Q4   Q2   Q4   Q2   Q4   Q2   Q4
                                   |     2010 |      2011 |       2012 |      2013 |       2014 |     2015 |        2016 |      2017 |        2018 |                                        |    2010 |    2011 |     2012 |    2013 |    2014 |    2015 |    2016 |    2017 |    2018 |

 Source: IDC, compiled using Stats SA data                                                                                                                       Source: IDC, compiled using Stats SA data

                                                                                                                                                                                                                                                                                            5
Domestic expenditure

                                                                                                                                                                                                           Gross domestic expenditure
                                                                                                                                                                                   • Domestic expenditure was under pressure during 2018, with
                                             Gross Domestic Expenditure (GDE)
                     10                                                                                                                     34                                       all components having recorded subdued rates of growth.
                                                                                                                                                                                     For the year as a whole, gross domestic expenditure (GDE)
                     8                                                                                                                      33
                                                                                                                                                                                     increased by only 1%, down from 1.9% in 2017.
                     6                                                                                                                      32
                                                                                                                                                                                   • Inventory levels fell sharply in Q4 of 2018, thus contributing
                     4                                                                                                                      31
                                                                                                                                                                                     to the economy’s poor growth performance not only in the
% Change (q-o-q) *

                                                                                                                                                  Imports: % of GDE
                     2                                                                                                                      30                                       last quarter, but also for the entire year.
                     0                                                                                                                      29                                     • Despite deteriorating economic conditions, import demand
                     -2                                                                                                                     28                                       remained very strong as reflected by the increase in its
                                                                                                                                                                                     import intensity (i.e. real imports of goods and services as a
                     -4                                                                                                                     27
                                                                                                                                                                                     % of GDE). By the third quarter of 2018, this ratio stood at
                     -6                                                                                                                     26                                       31.4%, the highest in ten years.
                                       GDE (% change)
                     -8
                                       Imports as % of GDE
                                                                                                                                            25                                     • A gradual recovery in domestic expenditure is, however,
             -10                                                                                                                            24                                       expected in 2019, potentially underpinned by modestly higher
                          Q2
                          2010
                                 Q4
                                  |
                                      Q2
                                      2011
                                             Q4
                                              |
                                                  Q2
                                                  2012
                                                         Q4
                                                          |
                                                              Q2
                                                              2013
                                                                     Q4
                                                                      |
                                                                          Q2
                                                                          2014
                                                                                 Q4
                                                                                  |
                                                                                       Q2
                                                                                       2015
                                                                                              Q4
                                                                                               |
                                                                                                    Q2
                                                                                                    2016
                                                                                                           Q4
                                                                                                            |
                                                                                                                 Q2
                                                                                                                 2017
                                                                                                                        Q4
                                                                                                                         |
                                                                                                                               Q2
                                                                                                                               2018
                                                                                                                                       Q4
                                                                                                                                        |                                            rates of increase in household consumption and a recovery
  Source: IDC, compiled using SARB, Stats SA data                                                                                                                                    in fixed investment spending.

                                                                                                                                                                                  Final consumption expenditure by households

                                   Final consumption expenditure by households
                                                                                                                                                                                   • Households remained under strain during the course of 2018.
                     10                                                                                                                     90                                       Consequently, growth in household consumption spending
                                                                                                                                                                                     slowed to 1.8%, from 2.1% in 2017.
                      8                                                                                                                     86
                                                                                                                                                  Debt-to-disposable income (%)

                                                                                                                                                                                   • Consumer spending was affected by rising inflation, a steep
                      6                                                                                                                     82                                       rise in fuel prices to a new record high of R16.85 per litre by
                                                                                                                                                                                     October 2018 (although these declined in subsequent
% Change (q-o-q) *

                      4                                                                                                                     78                                       months), a one percentage point increase in the VAT rate,
                                                                                                                                                                                     higher excise duties, subdued demand for new credit, as well
                      2                                                                                                                     74                                       as lower growth in real disposable incomes.
                                                                                                                                                                                   • Although consumer spending on durable goods in general did
                      0                                                                                                                     70
                                                                                                                                                                                     increase, expenditure on motor vehicles declined. This was
                                 Consumer spending (Lhs)                                                                                                                             reflected by the 0.8% drop, year-on-year, in the number of
                     -2                                                                                                                     66
                                 Household debt as % of disposable income (Rhs)
                                                                                                                                                                                     new passenger vehicles sold in 2018.
                     -4
                          Q2     Q4   Q2     Q4   Q2     Q4   Q2     Q4   Q2     Q4   Q2      Q4   Q2      Q4   Q2      Q4    Q2      Q4
                                                                                                                                            62                                     • Factors in support of an expected gradual recovery in
                          2010    |   2011    |   2012    |   2013    |   2014    |   2015     |   2016     |   2017     |    2018     |
                                                                                                                                                                                     household spending include a relatively low interest rate
 Source: IDC, compiled using SARB, Stats SA data
                                                                                                                                                                                     environment and a fairly favourable inflation trajectory.

                                                                                                                                                                                  Final consumption expenditure by government
                          Final consumption expenditure by government (FCEG)                                                                                                       • Despite the limited fiscal space, real consumption expenditure
                     10                                                                                                                    22.0                                      by general government expanded by 1.9% in 2018, compared
                                                                                                                                                                                     to the marginal 0.2% rise recorded in 2017. Consequently, the
                      8                                                                                                                    21.5                                      share claimed by government in national GDP rose to 21.3%
                                                                                                                                                                                     in 2018, the highest on record.
                      6                                                                                                                    21.0
% Change (q-o-q) *

                                                                                                                                                                                   • Government’s current expenditure is mostly directed towards
                                                                                                                                                        % Share of GDP

                      4                                                                                                                    20.5                                      basic education, health, social protection and community
                                                                                                                                                                                     development.
                      2                                                                                                                    20.0
                                                                                                                                                                                   • The public sector wage bill represented 35.1% of total
                                                                                                                                                                                     consolidated expenditure in the 2018/19 fiscal year and is
                      0                                                                                                                    19.5
                                                                                                                                                                                     forecast to grow by 6.8% per year, on average, over the next
                                                                                                                                                                                     three years, thus outpacing the expected consumer price
                     -2           Government spending (Lhs)                                                                                19.0
                                                                                                                                                                                     inflation by quite a margin.
                                  FCEG as % of GDP (Rhs)

                     -4
                          Q2   Q4     Q2   Q4     Q2   Q4     Q2   Q4     Q2   Q4     Q2   Q4      Q2   Q4      Q2   Q4      Q2   Q4
                                                                                                                                           18.5                                    • Government remains committed to fiscal consolidation and
                          2010 |      2011 |      2012 |      2013 |      2014 |      2015 |       2016 |       2017 |       2018 |
                                                                                                                                                                                     debt sustainability, with the principal credit rating agencies
                                                                                                                                                                                     keeping a close eye on the fiscal metrics.
 Source: IDC, compiled using SARB, Stats SA data
                                                                                                                                                                                                                                                       6
Domestic expenditure (cont.)

                                                                                                                                                                                                    Gross fixed capital formation
                                                  Gross fixed capital formation (GFCF)                                                                                       • Fixed investment declined by 1.4% in real terms in 2018.
                      20                                                                                                                         21.5                          Weak demand conditions in the domestic market, spare
                      16                                                                                                                         21.0                          production capacity, infrastructure-related challenges, as well
                                                                                                                                                                               as policy uncertainty in key sectors of the economy, affected
                      12                                                                                                                         20.5                          business confidence and investment decisions.
% Change (q-o-q) *

                                                                                                                                                                             • Investment activity in the manufacturing sector has been

                                                                                                                                                            % Share of GDP
                      8                                                                                                                          20.0

                      4                                                                                                                          19.5                          particularly weak in recent years, registering average annual
                                                                                                                                                                               growth of -1.4% over the period 2012 to 2018. The overall
                      0                                                                                                                          19.0                          quantum of fixed investment in manufacturing in 2018 was, in
                      -4                                                                                                                         18.5
                                                                                                                                                                               real terms, 9.8% lower than in 2011 (the post-global financial
                                                                                                                                                                               crisis high). In contrast, investment spending in the mining
                      -8                                                                                                                         18.0                          sector increased by 13.2% in 2018, following a sharp
               -12
                                               GFCF (% change)
                                                                                                                                                 17.5
                                                                                                                                                                               rebound of 39.1% in 2017.
                                               GFCF as % of GDP
               -16                                                                                                                               17.0
                                                                                                                                                                             • Weak rates of expansion in fixed investment expenditure
                             Q2   Q4
                             2010 |
                                               Q2   Q4
                                               2011 |
                                                          Q2   Q4
                                                          2012 |
                                                                        Q2   Q4
                                                                        2013 |
                                                                                    Q2   Q4
                                                                                    2014 |
                                                                                                 Q2   Q4
                                                                                                 2015 |
                                                                                                             Q2   Q4
                                                                                                             2016 |
                                                                                                                          Q2   Q4
                                                                                                                          2017 |
                                                                                                                                     Q2   Q4
                                                                                                                                     2018 |
                                                                                                                                                                               over recent years saw its relative share in overall GDP
 Source: IDC, compiled using SARB, Stats SA data                                                                                                                               declining to a ratio of 18.2% in 2018, a 13-year low.

                                                                                                                                                                                   Fixed investment by type of organisation
                                                              Gross fixed capital formation                                                                                  • Fixed investment spending by the private sector increased by
                      40                                                                                                                                                       2.1% in 2018. This was largely due to robust growth in
                                                                                                                                                                               investment activity in the mining sector and, to a much lesser
                      30
                                                                                                                                                                               extent, in the finance and business services sector. All other
                      20
                                                                                                                                                                               broad sectors recorded lower investment outlays.
 % Change (q-o-q) *

                                                                                                                                                                             • Investment spending by public corporations fell by 12.5% in
                      10
                                                                                                                                                                               2018, largely due to financial difficulties experienced by
                       0                                                                                                                                                       several state-owned enterprises and reduced demand for
                                                                                                                                                                               utility services such as electricity, transport and logistics.
                      -10                                                                                                                                                      Fiscal constraints are limiting government’s ability to invest in
                                                                                                                                                                               much needed economic and social infrastructure. Investment
                      -20
                                                                                                                                                                               spending by government decreased by 4.4% in 2018 to
                      -30
                                        Government                    Public corporations                                                                                      R98.7 billion (in real terms), the lowest level in four years.
                                        Private sector                Total investment
                                                                                                                                                                             • A revival of business and investor confidence in the
                      -40
                                 Q2
                                 2010
                                          Q4
                                           |
                                                 Q2
                                                 2011
                                                         Q4
                                                          |
                                                              Q2
                                                              2012
                                                                     Q4
                                                                      |
                                                                           Q2
                                                                           2013
                                                                                  Q4
                                                                                   |
                                                                                         Q2
                                                                                         2014
                                                                                                 Q4
                                                                                                  |
                                                                                                      Q2
                                                                                                      2015
                                                                                                              Q4
                                                                                                               |
                                                                                                                   Q2
                                                                                                                   2016
                                                                                                                           Q4
                                                                                                                            |
                                                                                                                                Q2
                                                                                                                                2017
                                                                                                                                        Q4
                                                                                                                                         |
                                                                                                                                               Q2
                                                                                                                                               2018
                                                                                                                                                      Q4
                                                                                                                                                       |
                                                                                                                                                                               economy’s prospects and visible improvements in the
  Source: IDC, compiled using SARB, Stats SA data
                                                                                                                                                                               operating environment are prerequisites for a recovery in
                                                                                                                                                                               fixed investment activity.

                                                                                                                                                                                                                               Inventories
                                                              Change in inventory levels                                                                                     • Inventory levels dropped sharply by R53.9 billion in the final
                      18
                                        Change in inventories (RHS)
                                                                                                                                                  100                          quarter of 2018, one of the largest reductions on record. This
                      17                                                                                                                          80                           was caused by difficult operating conditions, with many
                                        Industrial & commercial
                                        inventories as % of GDP                                                                                                                businesses having been forced to reduce sock levels.
                      16                                                                                                                          60
                                                                                                                                                                             • For the year as a whole, inventory levels were R5.4 billion
                      15                                                                                                                          40
                                                                                                                                                                               lower at constant 2010 prices. Key contributors were the
                                                                                                                                                           Rand Billion

                      14                                                                                                                          20                           mining sector, with a reduction of R16.9 billion, as well as the
% of GDP

                      13                                                                                                                          0                            transport, storage and communication sector (-R2.9 billion).
                      12                                                                                                                          -20                        • The trade, catering and accommodation sector, in turn,
                                                                                                                                                                               reported an inventory accumulation amounting to R9.5 billion
                      11                                                                                                                          -40
                                                                                                                                                                               during 2018, whereas the manufacturing sector increased its
                      10                                                                                                                          -60                          stock levels by R5.1 billion.
                       9                                                                                                                          -80
                                                                                                                                                                             • Industrial and commercial inventories, as a ratio of GDP,
                       8                                                                                                                          -100                         declined to 10.2% in 2018, well below the 15.8% recorded in
                                                                                                                                                                               2017.
                            Q4    Q2   Q4        Q2   Q4      Q2   Q4     Q2   Q4      Q2   Q4    Q2   Q4     Q2   Q4      Q2   Q4     Q2   Q4
                             |    2010 |         2011 |       2012 |      2013 |       2014 |     2015 |      2016 |       2017 |      2018 |
 Source: IDC, compiled using SARB, Stats SA data
                                                                                                                                                                                                                                                   7
Employment

                                                                                                                                                                       Formal and informal sector employment
                                                        Employment in the formal and informal sector                                                             • Despite the challenging economic climate and the modest
                                   800                                                                                                                             GDP growth recorded in 2018, some 358 000 additional jobs
                                   600                                                                                                                             were collectively created in the formal and informal sectors of
                                                                                                                                                                   the economy.
Change in number (y-o-y) in '000

                                   400
                                                                                                                                                                 • The bulk of the additional jobs were in the finance & business
                                   200                                                                                                                             services sector (+238 000), followed by the construction
                                        0
                                                                                                                                                                   (+91 000), trade (+79 000) and mining (+27 000) sectors. On
                                                                                                                                                                   the other hand, substantial job losses were recorded in the
                                   -200                                                                                                                            community services sector (which includes government-
                                   -400
                                                                                                                                                                   related employment), followed by transport services and the
                                                                                                                                                                   manufacturing sector.
                                   -600
                                                                                                                                                                 • Of concern is the declining employment intensity (i.e. number
                                   -800                                                                                                                            of jobs per R1 million of real GDP) of the economy over time.
                                                                                                                                                                   Thus, a much faster pace of economic expansion would be
                           -1000
                                                 Q2   Q4     Q2   Q4      Q2   Q4      Q2   Q4    Q2   Q4     Q2   Q4     Q2   Q4      Q2   Q4      Q2   Q4        required in order to create more jobs, considering the large
                                                 2010 |      2011 |       2012 |       2013 |     2014 |      2015 |      2016 |       2017 |       2018 |
  Source: IDC, compiled using Stats SA data                                                                                                                        number of new entrants into the labour market.

                                                                                                                                                                                 Productivity and unit labour costs
                                                           Labour productivity and unit labour costs                                                             • Labour productivity in the formal non-agricultural sectors of
                                   12                                                                                                                              the economy increased by only 0.7%, year-on-year, over the
                                                                                                                              Labour productivity
                                                                                                                                                                   period January to September 2018. In contrast, nominal unit
                                   10                                                                                         Nominal unit labour costs
                                                                                                                                                                   labour costs expanded at a much faster pace of 4.1% over
                                    8                                                                                                                              this period.
                                                                                                                                                                 • Having increased at rates well above inflation for quite some
% Change (y-o-y)

                                    6
                                                                                                                                                                   time, growth in overall remuneration of employees slowed to
                                    4                                                                                                                              4.2% in 2018, from 7.4% in 2017.

                                    2
                                                                                                                                                                 • Compensation of employees within government increased by
                                                                                                                                                                   7% in 2018, followed by the 4.8% for personal services.
                                    0
                                                                                                                                                                 • After increasing at a robust rate of 4.4% in real terms in 2017,
                                   -2                                                                                                                              average remuneration per employee in the public sector rose
                                                                                                                                                                   by 1.6% in 2018. Similarly, the average growth in real
                                   -4
                                            Q1    Q3    Q1     Q3    Q1     Q3    Q1     Q3      Q1    Q3    Q1    Q3    Q1      Q3    Q1    Q3     Q1     Q3
                                                                                                                                                                   remuneration per employee in the private sector came in at
                                                 2010         2011         2012         2013          2014        2015          2016        2017          2018     1.6% for 2018, following declines in real terms both in 2016
                                                                                                                                                                   and 2017.
 Source: IDC, compiled using SARB data

                                                                                                                                                                                                            Unemployment
                                                                              Unemployment rate                                                                  • South Africa’s unemployment rate measured 27.1% by the
                                   30
                                                                                                                                                                   final quarter of 2018, with more than 6.1 million people unable
                                            Latest data: Q4 2018
                                                                                                                                                                   to find a job. Including discouraged job-seekers, the
                                   28                                                                                                                              unemployment rate stood at 37%, or 9.7 million unemployed
                                                                                                                                                                   people.
                                   26
                                                                                                                                                                 • Amongst the youth, the unemployment rate stood at 54.7%
Percentage

                                                                                                                                                                   for those in the age group 15 to 24 years, and at 33% for
                                   24                                                                                                                              those between the ages of 25 and 34 years.
                                                                                                                                                                 • Government initiatives such as the extension of the
                                   22                                                                                                                              Employment Tax Incentive and the Youth Employment
                                                                                                                                                                   Service scheme aim to address the unemployment challenge
                                   20                                                                                                                              amongst the youth. Other initiatives, such as the Presidential
                                                                                                                                                                   Jobs Summit, the Economic Stimulus and Recovery package,
                                   18
                                                                                                                                                                   as well as the confidence-building South Africa Investment
                                             Q2   Q4
                                             2010 |
                                                           Q2   Q4
                                                           2011 |
                                                                       Q2   Q4
                                                                       2012 |
                                                                                    Q2   Q4
                                                                                    2013 |
                                                                                                  Q2   Q4
                                                                                                  2014 |
                                                                                                              Q2   Q4
                                                                                                              2015 |
                                                                                                                          Q2   Q4
                                                                                                                          2016 |
                                                                                                                                         Q2   Q4
                                                                                                                                         2017 |
                                                                                                                                                     Q2   Q4
                                                                                                                                                     2018 |
                                                                                                                                                                   Conference should also contribute to job creation going
      Source: IDC, compiled using Stats SA data                                                                                                                    forward.
                                                                                                                                                                                                                                      8
Employment (cont.)
                                                        Sectoral composition of employment in South Africa in 2018
                                                                                               Agriculture, forestry
                                                                                  Private
                                                                                households   Other & fishing
                                                                                                       5.2% Mining
                                                                                   7.9%      0.06%
                                                                                                               2.6%        Manufacturing
                                       Community, social &                                                                    10.8%
                                        personal services                                                                                           Electricity,
                                             22.5%                                                                                                 gas & water
                                                                                                                                                       0.9%
                                                                                                                                                         Construction
                                                                                                                                                            9.0%

                                                                                                                                                  Trade, catering &
                                                                                                                                                  accommodation
                                             Finance & business                                                                                        20.0%
                                                  services                        Transport, storage &
                                                   15.1%                            communication
                                                                                         6.0%                  Note: Data is for the formal and informal sector as per data from the
                                    Source: IDC, compiled using Stats SA data                                  Quarterly Labour Force Survey (QLFS).

                                                                                                     Employment according to main economic sector

                                                                                       Change in employment : Q4 2018 vs Q4 2017

                                 Total employment

                  Finance & business services

                                        Construction

          Trade, catering & accommodation

                               Private households

                                                 Mining

                                      Other industry

                Agriculture, forestry & fishing

                          Electricity, gas & water

                                      Manufacturing

      Transport, storage & communication

   Community, social & personal services

                                                          -100            -50      0         50          100       150               200               250              300            350   400

                                                                                                    Change in number ('000)
Source: IDC, compiled using Stats SA data

                                                                                                                                                                                                   9
Manufacturing sector

                                                                                                                            Manufacturing GDP and volume of production
                                         Manufacturing GDP and volume of production                                          • The difficult economic environment domestically, rising
                     12                                                                                                        operational costs and increasingly challenging conditions in the
                     10
                                                                                      Volume of production (monthly)
                                                                                                                               global trading arena underscored the weak 1% growth in real
                                                                                      Manufacturing GDP (quarterly)
                                                                                                                               manufacturing GDP in 2018.
                          8

                          6                                                                                                  • Production volumes fell in several sub-sectors, including those
% Change (y-o-y)

                                                                                                                               producing TVs & radios (-9.8%), electrical machinery (-7.3%),
                          4
                                                                                                                               as well as textiles, clothing, leather and footwear (-2.6%).
                          2
                                                                                                                             • On the other hand, output levels increased by 4.6% in the
                          0
                                                                                                                               transport equipment sub-sector, followed by food and
                          -2                                                                                                   beverages (+4.6%), among others.
                          -4                                                                                                 • The manufacturing sector’s poor performance resulted in its
                          -6                                                                                                   relative share of overall GDP dropping to 13.2% in 2018.
                          -8                                                                                                 • Factors such as continued load-shedding, higher electricity
                               12 3 6 9 12 3 6 9 12 3 6 9 12 3 6 9 12 3 6 9 12 3 6 9 12 3 6 9 12 3 6 9 12 3 6 9 12
                                                                                                                               tariffs, weak domestic demand and rising global risks are likely
                                | 2010   | 2011
 Source: IDC, compiled using Stats SA data
                                                  | 2012   | 2013   | 2014   | 2015   | 2016      | 2017      | 2018   |
                                                                                                                               to constrain manufacturing activity, especially in the short-term.

                                                                                            Physical volume of production per sub-sector of manufacturing
                                                                                   Volume of production by sub-sector
                               6

                                                                      2017        2018
                               4

                               2

                               0
       % Change (y-o-y)

                               -2

                               -4

                               -6

                                                                                                                             Gross Domestic Product
                               -8

                           -10                                                                                               •    Conditions in the South African economy remain
                                                                                                                                  unsatisfactory.
                           -12                                                                                               •    The rate of decline in consumer spending deteriorated to
                                      Total  Food &  Textiles,               Wood &        Chemicals           Non-        Metals & Electrical    Radio      Transport    Furniture
                                    Manufac-
                                          beverages clothing,                 paper         (23.8%)          metallic
                                                                                                                                 5.8% in Q2 of 2009,
                                                                                                                           machinery machinery and TV
                                                                                                                                                      its worst  performance
                                                                                                                                                               equip.
                                                                                                                                                                              in almost
                                                                                                                                                                          & other
                                                                                                                                                                                        25
                                     turing  (25.8%) leather &               (11.3%)                          mineral            years. (1.6%)
                                                                                                                            (18.7%)               (1.6%)       (7.2%)   industries
                                                     footwear                                                products                                                     (3.2%)
          Source: IDC, compiled using Stats SA data    (3.2%)                                                 (3.5%)         •    Factors contributing to poor consumer spending include
                                                                                                                                  :
Note: Figures in brackets refer to the sub-sector’s percentage share of total manufacturing production in 2018. –                            Increased job losses
                                                                                                                                         –   Falling real disposable incomes

                                                                                                                                                                                                    10
Manufacturing sector (cont.)

                                                                                                                                                                 Fixed investment and capacity utilisation
                                        Fixed investment*and capacity utilisation                                                                           • Weak demand conditions affected negatively production
                    14                                                                                                      88
                                                                                                                                                              activity in several manufacturing sub-sectors, leading to
                    12                                                                                                                                        spare production capacity and reducing the need for new
                                                                                                                            86
                    10                                                                                                                                        investment in its expansion.
                                                                                                                            84
                                                                                                                                                            • Many sub-sectors of manufacturing are operating below

                                                                                                                                 Capacity utilisation (%)
                     8
                                                                                                                                                              design capacity, or recorded declines in the utilisation of their
% Change (y-o-y)

                     6                                                                                                      82
                                                                                                                                                              production capacity during the course of 2018.
                     4
                                                                                                                            80
                     2                                                                                                                                      • According to the RMB/BER’s latest manufacturing survey (Q1
                                                                                                                            78
                                                                                                                                                              2019), 76% of respondents indicated they were operating
                     0
                                                                                                                                                              below capacity. Although high, this was an improvement from
                    -2
                                                                                                                            76                                the 82% recorded in the preceding quarter.
                    -4                                                                 Fixed investment (% change)
                                                                                                                            74                              • Fixed investment in the manufacturing sector could remain
                    -6                                                                 Capacity utilisation
                                                                                                                                                              under pressure in 2019, as a net majority of manufacturers
                    -8                                                                                                      72                                have indicated that investment in machinery and equipment
                            Q2 Q4      Q2 Q4       Q2 Q4       Q2 Q4      Q2 Q4    Q2 Q4     Q2 Q4     Q2 Q4       Q2 Q4
                            2010 |     2011 |      2012 |      2013 |     2014 |   2015 |    2016 |    2017 |      2018 |                                     in 12 months’ time may be reduced further.
 Source: IDC, compiled using Stats SA data

Note: * Fixed investment data for the manufacturing sector is only available on an annual basis. Hence, the y-o-y growth for the particular year is shown in Q4 of that year.

                                                                                               Utilisation of production capacity per sub-sector of manufacturing
                                                                                            Absolute change in sub-sectoral utilisation of production capacity
                                                                                                                      (Q4 of 2018 vs Q4 of 2017)
                                      Total Manufacturing (83.1)
                                     Other manufacturing (84.9)
                                                  Footwear (88.6)
                                           Glass products (88.6)
                      Motor vehicles, parts & accessories (86.5)
                                     Printing & publishing (78.8)
                                        Rubber products (85.2)
                                                   Textiles (68.2)
                                      Petroleum products (87.1)
                                       Non-ferrous metals (80.9)
                                                Beverages (88.5)
                           Non-metallic mineral products (81.2)
                                            Other chemicals (87)
                                          Basic chemicals (89.4)
                                                        Food (83)
                                                  Furniture (87.3)
                                 Paper & paper products (87.2)
                                          Plastic products (84.9)
                                                   Clothing (75.3)
                                               Iron & steel (78.1)
                                                                                                                                                            Gross Domestic Product
                               Fabricated metal products (73.7)
                                                                                                                                                            •   Conditions in the South African economy remain
                            Radio, TV & communication (83.6)
                                 Machinery & equipment (79.1)
                                                                                                                                                                unsatisfactory.
                                     Electrical machinery (77.9)                                                                                            •   The rate of decline in consumer spending deteriorated to
                                           Wood products (80.2)                                                                                                 5.8% in Q2 of 2009, its worst performance in almost 25
                              Other transport equipment (75.9)
                                                                                                                                                                years.
                                 Professional equipment (82.7)
                                                   Leather (68.1)                                                                                           •   Factors contributing to poor consumer spending include
                                                                     -7               -5                      -3                    -1                          :     1             3             5           7
                                                                                                                                            – Increased job losses
                                                                                                                     Absolute change (%-points)
                   Source: IDC, compiled using Stats SA data
                                                                                                                                                                       –   Falling real disposable incomes
            Note: Figures in brackets refer to the sub-sector’s percentage utilisation of production capacity in the fourth quarter of 2018.

                                                                                                                                                                                                                                  11
Manufacturing sector (cont.)

                                                                                                                  Expectations regarding employment creation
                           Employment trend - number of factory workers                                           • Manufacturing sector employment has declined over time.
               0                                                                                                    This has been attributable to various factors, including
                                                                                                                    insufficient demand, largely as a result of subdued economic
               -5                                                                                                   conditions, but also due to competition from foreign producers
                                                                                                                    in the local market as well as in export markets; operational
                                                                                                                    challenges; declining employment intensity as players
              -10
                                                                                                                    transformed production processes through mechanisation to
Net balance

                                                                                                                    enhance competitiveness; and, among others, generally low
              -15                                                                                                   confidence levels among manufacturers.
                                                                                                                  • By the final quarter of 2018, formal employment in the sector
              -20
                                                                                                                    stood at 1.21 million people, or 8.9% lower than the pre-crisis
                                                                                                                    high recorded in 2006. Nonetheless, the sector still accounts
              -25                                                                                                   for about 10% of all formal sector jobs in the economy.
                                                                                                                  • Since the sector’s growth prospects are anticipated to remain
              -30
                     Q2   Q4    Q2   Q4   Q2   Q4   Q2   Q4   Q2   Q4   Q2   Q4   Q2   Q4   Q2   Q4    Q2   Q4      generally unsatisfactory in the near- to short-term, a
                     2010 |     2011 |    2012 |    2013 |    2014 |    2015 |    2016 |    2017 |     2018 |
Source: IDC, compiled using BER data                                                                                meaningful recovery in manufacturing employment is unlikely.

                                                          Expectations regarding employment creation per sub-sector of manufacturing

                                                                                                            Employment creation by sub-sector

                                          Manufacturing total
                                                                            Q4 2018         Q4 2017

                                 Furniture & other industries

        Motor vehicles, parts & transport equipment

                     Textiles, clothing, leather & footwear

                       Wood, paper, printing & publishing

                                            Food & beverages

                    Glass & non-metallic mineral products
                                                                                                                 Gross Domestic Product
                     Chemicals, rubber & plastic products
                                                                                                                  •     Conditions in the South African economy remain
                                                                                                                        unsatisfactory.
              Basic metals, metal products & machinery
                                                                                                                  •      The rate of decline in consumer spending deteriorated to
                                                                -100              -80                 -60             -40
                                                                                                                         5.8% in Q2-20
                                                                                                                                     of 2009, its worst
                                                                                                                                                  0
                                                                                                                                                        performance
                                                                                                                                                              20
                                                                                                                                                                    in almost
                                                                                                                                                                          40
                                                                                                                                                                               25
                                                                                                                         years.
     Source: IDC, compiled using BER data
                                                                        Pessimistic                               •     Factors contributingNeutral
                                                                                                                                             to poor consumer spending
                                                                                                                                                              Optimisticinclude
                                                                                                                        :
                                                                                                                              –   Increased job losses
                                                                                                                              –   Falling real disposable incomes

                                                                                                                                                                                      12
Inflation and monetary aggregates

                                                                                                                                                                        Consumer price inflation
                                                             Consumer price inflation                                                     • Consumer price inflation rose steadily during 2018, from a low
                       10
                                       CPI : Targeted inflation
                                                                                                                                            of 3.8% in March to a peak of 5.2% by November. It
                           9           Goods                                                                                                subsequently slowed to 4.1% in February 2019. Inflation
                           8
                                       Services                                                                                             averaged 4.6% in 2018, compared to 5.3% in 2017.
                           7                                                                                                              • Local fuel prices increased sharply on the back of a
                                                                                                                                            depreciating Rand and rising international crude oil prices
   % Change (y-o-y)

                           6
                                                                                                                                            during 2018, although oil prices declined again towards the
                           5
                                                                                                                                            latter part of the year. Excluding petrol, consumer price
                           4                                                                                                                inflation would have averaged 4.1% in 2018.
                           3
                                                                                                                                          • Food inflation decelerated further to 3.3% in 2018, from 7% in
                           2                                                                                                                2017, on the back of the bumper maize crop in the 2017/18
                           1                                                                                                                season, as well as a return to more normal weather patterns
                                                                                                                                            in several parts of the country.
                           0
                                3 6 9 12 3 6 9 12 3 6 9 12 3 6 9 12 3 6 9 12 3 6 9 12 3 6 9 12 3 6 9 12 3 6 9 12 3
                                                                                                                                          • Looking ahead, the recently announced increases in electricity
                                 2010      | 2011      | 2012      | 2013    | 2014    | 2015    | 2016   | 2017    | 2018        |
                                                                                                                                            tariffs, which are well above current inflation expectations, are
   Source: IDC, compiled using Stats SA data
                                                                                                                                            likely to apply upward pressure on consumer price inflation.

                                                                                                                                                                          Producer price inflation
                                                            Producer price inflation                                                      • Inflation as measured by the producer price index (PPI for
                      12                                                                                                                    final manufactured goods), increased to a peak of 6.9% in
                                                                                                                                            October 2018 and averaged 5.5% for the year as a whole, up
                      10                                                                                                                    from 4.9% in 2017.
                                                                                                                                          • Key contributors to the higher PPI included diesel and petrol,
% Change (y-o-y)

                      8
                                                                                                                                            with price hikes of 18.7% and 14.4% in 2018, respectively,
                                                                                                                                            while motor vehicle prices rose by 14.3%. The prices of
                      6
                                                                                                                                            chemical products increased by 8.1%, while those of paper &
                                                                                                                                            printed products was 6.6% higher. Collectively, these products
                      4
                                                                                                                                            represent 28.9% of the entire PPI basket and contributed 3.3
                                                                                                                                            percentage points to inflation at the factory gate during 2018.
                      2
                                                                                                                                          • The rates of increase in electricity prices have been on a
                      0
                                                                                                                                            declining trend in recent years, averaging 4.6% in 2018,
                               3 6 9 12 3 6 9 12 3 6 9 12 3 6 9 12 3 6 9 12 3 6 9 12 3 6 9 12 3 6 9 12 3 6 9 12 3                           compared to 11.8% in 2015. The opposite has occurred with
                               2010      | 2011       | 2012      | 2013    | 2014    | 2015    | 2016    | 2017    | 2018    |             regard to water price increases, which averaged 10.4% in
 Source: IDC, compiled using Stats SA data                                                                                                  2018, up from 6.8% in 2015.

                                                                                                                                                      Credit extension to the private sector
                                                       Private sector credit extension                                                    • Demand for new debt by households gained some momentum
                      20
                                                                                                                                            during the course of 2018.
                                   Households            Corporate sector

                      15                                                                                                                  • Nominal growth in household demand for credit averaged
                                                                                                                                            4.6% last year, compared to 2.6% in 2017. This means that
                                                                                                                                            credit demand remained unchanged in real terms, as CPI
% Change (y-o-y)

                      10
                                                                                                                                            inflation also measured 4.6% in 2018.
                       5                                                                                                                  • In contrast, corporate demand for credit slowed substantially
                                                                                                                                            in light of worsening economic conditions and poor growth
                       0                                                                                                                    prospects, especially over the short-term. In 2018, growth in
                                                                                                                                            credit extension to corporates measured 6.9%, down from
                      -5
                                                                                                                                            8.2% in 2017 and 13.1% in 2016.
                                                                                                                                          • The recent decline in business confidence and rising risks to
                   -10                                                                                                                      the growth outlook are likely to weigh on demand for credit by
                               3 6 9 12 3 6 9 12 3 6 9 12 3 6 9 12 3 6 9 12 3 6 9 12 3 6 9 12 3 6 9 12 3 6 9 12 3
                                                                                                                                            the corporate sector, whilst consumers may also decide to
                                2010      | 2011       | 2012     | 2013    | 2014     | 2015    | 2016    | 2017    | 2018           |
                                                                                                                                            refrain from incurring too much debt in an uncertain economic
                                                                                                                                            environment.
Source: IDC, compiled using SARB data
                                                                                                                                                                                                           13
Interest rates and yields

                                                                                                                                                                                                         Repo and prime overdraft rates
                                                           Repo and Prime overdraft rates                                                                                            • After having lowered the repurchase (repo) rate by 25 basis
                            12
                                                                  Repo rate
                                                                                                                                                                                       points (bps) in March 2018, the Monetary Policy Committee
                                                                  Prime overdraft rate
                                                                                                                                                                                       (MPC) of the South African Reserve Bank (SARB) saw it
                            10                                                                                                                                                         prudent to reverse this decision at its November 2018
                                                                                                                                                                                       meeting, when it raised the repo rate by 25 bps to 6.75%, on
   Percentage (month-end)

                                8                                                                                                                                                      the back of rising domestic inflation and higher interest rates
                                                                                                                                                                                       in the US.
                                6
                                                                                                                                                                                     • At its 28 March 2019 meeting, the MPC left the repo rate
                                                                                                                                                                                       unchanged, noting the recent easing in inflation, but also a
                                4                                                                                                                                                      number of risk factors than could underpin upside pressure on
                                                                                                                                                                                       the price trajectory going forward.
                                2
                                                                                                                                                                                     • In light of the economy’s weak performance at present and a
                                                                                                                                                                                       fragile recovery, the MPC is expected to leave the repo rate
                                0
                                    12 3 6 9 12 3 6 9 12 3 6 9 12 3 6 9 12 3 6 9 12 3 6 9 12 3 6 9 12 3 6 9 12 3 6 9 12 3                                                              unchanged throughout the remainder of this year.
                                     | 2010    | 2011      | 2012        | 2013      | 2014       | 2015      | 2016       | 2017        | 2018       |
    Source: IDC, compiled using SARB data

                                                                                                                                                                                                                Inflation and interest rates
                                        Inflation developments and the interest rate environment                                                                                     • Although the MPC only hiked the repo rate by 25 basis points
                            10                                                                                                                        10                               (bps) at its November 2018 meeting, the repo rate rose quite
                                              Nominal Repo rate (Rhs)            Real Repo rate (Rhs)          CPI: Headline inflation
                                                                                                                                                                                       sharply in real terms (i.e. after adjusting for inflation),
                            8                                                                                                                         8                                specifically by 128 bps between October 2018 and February
                                                                                                                                                                                       2019. In this regard it should be noted that inflation surprised
                                                                                                                                                           Repo rates : Percentage
   CPI : % Change (y-o-y)

                            6                                                                                                                         6                                on the downside, having fallen from 5.09% to 4.06% over the
                                                                                                                                                                                       same period, a drop of 103 bps.
                            4                                                                                                                         4
                                                                                                                                                                                     • Thus, monetary policy has in fact been tightened in recent
                                                                                                                                                                                       months, as the real repo rate averaged 2.57% over the three
                            2                                                                                                                         2                                months to February 2019.

                            0                                                                                                                         0
                                                                                                                                                                                     • Even though inflation outcomes may tick higher in coming
                                                                                                                                                                                       months on the back of a weaker Rand, higher crude oil prices
                                                                                                                                                                                       and the hike in domestic electricity tariffs, there should be no
                            -2                                                                                                                        -2
                                      3 6 9 12 3 6 9 12 3 6 9 12 3 6 9 12 3 6 9 12 3 6 9 12 3 6 9 12 3 6 9 12 3 6 9 12 3                                                               need to raise interest rates as demand-pull factors are
                                      2010    | 2011     | 2012         | 2013    | 2014      | 2015      | 2016      | 2017       | 2018     |
                                                                                                                                                                                       basically not at play, and economic growth may come under
  Source: IDC, compiled using Stats SA and SARB data                                                                                                                                   renewed pressure in light of electricity supply challenges and
                                                                                                                                                                                       rising global risks, among other factors.

                                                                                                                                                                                                              Long- and short-term yields
                                                              Long- and short-term yields                                                                                            • The yield on long-term government bonds trended higher over
                       12
                                                                                                        Yield on long-term government bonds
                                                                                                                                                                                       the period March to October 2018 and was closely aligned to
                       11                                                                               91-Day Treasury bills
                                                                                                                                                                                       developments in global bond markets (e.g. US 10-year bond
                                                                                                                                                                                       yields).
                       10
                                                                                                                                                                                     • Moreover, a close correlation also exists with the movement of
                            9                                                                                                                                                          the Rand-USD exchange rate, whilst inflation expectations are
Percentage

                                                                                                                                                                                       also influencing the direction of the yield curve.
                            8
                                                                                                                                                                                     • From November 2018, a modest declining trend was observed
                            7                                                                                                                                                          in both the long- and short-term yields, on the back of an
                            6
                                                                                                                                                                                       appreciating Rand and a slowdown in domestic inflation.
                                                                                                                                                                                     • Concerns over the outlook for the South African economy in
                            5
                                                                                                                                                                                       2019, upside risks to inflation, the run-up to the May 2019
                            4                                                                                                                                                          general elections, as well as the risk of downgrades to South
                                     3 6 9 12 3 6 9 12 3 6 9 12 3 6 9 12 3 6 9 12 3 6 9 12 3 6 9 12 3 6 9 12 3 6 9 12 3
                                                                                                                                                                                       Africa’s sovereign credit ratings could exert upward pressure
                                      2010    | 2011     | 2012         | 2013     | 2014        | 2015     | 2016        | 2017         | 2018   |                                    on bond yields in the months ahead.
 Source: IDC, compiled using SARB data
                                                                                                                                                                                                                                                          14
Capital markets

                                                                                                                                     Johannesburg Securities Exchange (JSE) performance
                                                                              JSE performance                                                                          • The downward trending FTSE/JSE All Share Index (Alsi) has
                        100 000
                                                 All Share Index
                                                                                                                                                                         reflected, in part, the poor performance of the South African
                              90 000
                                                 Industrials
                                                                                                                                                                         economy. Over the 12 months to 31 December 2018, the Alsi
                              80 000             Resources - Top 20
                                                                                                                                                                         dropped by 11.4%, although many key global equity markets
                                                                                                                                                                         also ended the year at lower levels.
                              70 000
                                                                                                                                                                       • Despite operational challenges and declining commodity
                              60 000
                                                                                                                                                                         prices, resources ended the year 13.1% higher. Industrials, in
Index

                              50 000                                                                                                                                     turn, came under severe pressure, as the index fell by 19.2%.
                              40 000                                                                                                                                     Construction sector weakness contributed to the 14.2%
                              30 000
                                                                                                                                                                         decline in the corresponding index during 2018.

                              20 000                                                                                                                                   • The equity market rebounded strongly over the first three
                                                                                                                                                                         months of 2019, with the Alsi having risen by 6.3% by 28
                              10 000
                                             Monthly averages
                                                                                                                                                                         March 2019. This was mainly supported by solid
                                    0
                                           3 6 9 12 3 6 9 12 3 6 9 12 3 6 9 12 3 6 9 12 3 6 9 12 3 6 9 12 3 6 9 12 3 6 9 12 3
                                                                                                                                                                         performances from resources (Top 20, +14.5%) and
                                                                                                                                                                         industrials (+5.9%), whereas the financial and construction
                                           2010     | 2011         | 2012     | 2013     | 2014   | 2015    | 2016       | 2017     | 2018   |
Source: IDC, compiled using Bloomberg data                                                                                                                               indices fell further.

                                                                                                                                                                                                    Shares traded on the JSE
                                                                     Shares traded on the JSE                                                                          • Although the volume of shares traded on the Johannesburg
                              700                                                                                                              35
                                                                                                                                                                         Securities Exchange (JSE) increased by 6.7%, the value of
                                                                                                                                                                         shares traded only increased by 1.1% in 2018. The relatively
                              600                                                                                                              30
                                                                                                                                                                         subdued activity in the local share market is perhaps reflective
 Value of shares: R Billion

                              500                                                                                                              25
                                                                                                                                                                         of the difficult economic climate, low business confidence and
                                                                                                                                                                         risk aversion towards emerging market assets.
                                                                                                                                                    Volatility index

                              400                                                                                                              20
                                                                                                                                                                       • These developments were illustrated by the sharp rise in the
                                                                                                                                                                         South African Volatility Index (SAVI), with foreigners having
                              300                                                                                                              15
                                                                                                                                                                         been substantial net sellers of local shares and bonds during
                              200                                                                                                              10
                                                                                                                                                                         the course of last year.
                                                                                                                                                                       • The total value of share capital raised on the JSE fell sharply to
                              100
                                                                                                                                                                         R55.6 billion in 2018, from R100.5 billion in 2017 - a 44.7% drop
                                             Value of shares traded (Lhs)                                                                      5
                                             SA volatility index (SAVI) (Rhs)
                                                                                                                                                                         to a 14-year low.
                                0                                                                                                              0
                                    12 3 6 9 12 3 6 9 12 3 6 9 12 3 6 9 12 3 6 9 12 3 6 9 12 3 6 9 12 3 6 9 12 3 6 9 12 3
                                                                                                                                                                       • The overall market capitalisation of shares listed on the JSE
                                        | 2010    | 2011       | 2012       | 2013     | 2014   | 2015   | 2016     | 2017    | 2018     |
                                                                                                                                                                         dropped significantly (-18%) during 2018 to R12.7 trillion.
       Source: IDC, compiled using SARB and JSE data

                                                                                                                                                                Net portfolio purchases/sales by non-residents
                                                 Net portfolio purchases / sales by non-residents                                                                      • In general terms, the past six years witnessed rather dismal
                              100                                                                                                                                        outcomes, on a net basis, of investment activity by non-
                              75                                                                                                                                         residents in the domestic equity and bond markets.
                              50                                                                                                                                       • After starting 2018 on a solid footing, based on expectations
                              25
                                                                                                                                                                         of an improved economic performance following leadership
                                                                                                                                                                         change in the African National Congress and Mr Cyril
 Rand Billions

                                0
                                                                                                                                                                         Ramaphosa becoming South Africa’s President, international
                              -25                                                                                                                                        investor perceptions turned negative from May onwards.
                              -50                                                                                                                                      • Consequently, foreigners were substantial net sellers of local
                              -75                                                                                                                                        equities and bonds during 2018 as a whole, amounting to R53
                                                                                                                                                                         billion and R88.5 billion, respectively.
                         -100

                         -125                                                                                                                                          • Concerns over economic developments resulted in further net
                                            Net purchases of Shares              Net purchases of Bonds                                                                  sales of local shares by non-residents amounting to R15.2
                         -150
                                         2010        2011           2012        2013       2014      2015         2016       2017       2018                             billion over the first two months of 2019.
     Source: IDC, compiled using SARB data

                                                                                                                                                                                                                                              15
Government finance

                                                                                                                                                                    Budget balance
                                                  Budget balance as a % of GDP                                           • The main budget deficit as a ratio of GDP fell to 3.9% in 2018,
              0.0                                                                                                          an improvement from the 4.4% recorded in 2017.
           -1.0
                                                                                                                         • The economy’s weak performance and challenges in tax
           -2.0                                                                                                            collection have been impacting on government revenue. For
                                                                                                                           the 2018/19 fiscal year, the tax revenue shortfall relative to
           -3.0
                                                                                                                           the 2018 Budget is estimated at R42.8 billion. This is mainly
           -4.0                                                                                                            the result of the R22.2 billion decline in revenue generated
% of GDP

           -5.0
                                                                                                                           through Value-Added Tax (VAT). The shortfalls with regard to
                                                                                                                           both corporate and personal income tax are estimated at
           -6.0                                                                                                            R12.8 billion and R8.4 billion, respectively.
           -7.0
                                                                                                                         • It should be noted, however, that the shortfall in VAT revenue
           -8.0                                                                                                            was largely due to the accelerated VAT refunds in order to
                                                                                                                           clear the backlog.
           -9.0

      -10.0                                                                                                              • Looking ahead, the main budget deficit is forecast to widen to
                        Q4
                         |
                              Q2 Q4
                              2010 |
                                         Q2 Q4
                                         2011 |
                                                   Q2 Q4
                                                   2012 |
                                                            Q2 Q4
                                                            2013 |
                                                                      Q2 Q4
                                                                      2014 |
                                                                                Q2 Q4
                                                                                2015 |
                                                                                          Q2 Q4
                                                                                          2016 |
                                                                                                    Q2 Q4
                                                                                                    2017 |
                                                                                                              Q2 Q4
                                                                                                              2018 |
                                                                                                                           4.7% of GDP in 2019/20, before tapering off to 4.3% by
     Source: IDC, compiled using SARB data
                                                                                                                           2021/22.

                                                                                                                                                                 Government debt
                                   Government's gross loan debt as a % of GDP                                            • Government debt is a key fiscal metric closely monitored by
              60                                                                                                           international credit ratings agencies. These have continuously
                                                                                                                           expressed concern over the debt trajectory, particularly its
              50                                                                                                           sustainability .
                                                                                                                         • By the end of 2018, the total gross loan debt of government
              40
                                                                                                                           represented 56.7% of GDP - a record high. Total debt
% of GDP

                                                                                                                           amounted to R2.76 trillion, 12% higher than in 2017.
              30
                                                                                                                         • Furthermore, the gross loan debt of government is projected
                                                                                                                           to rise by 31% from its 2018/19 level to R3.68 trillion in three
              20
                                                                                                                           years’ time. Hence, the debt-to-GDP ratio could rise to an
                                                                                                                           estimated 58.9% by 2021/22.
              10
                                                                                                                         • Debt-servicing costs have been the fastest-growing
                                                                                                                           expenditure item in recent years, and are projected to account
               0
                   Q4        Q2   Q4    Q2   Q4   Q2   Q4   Q2   Q4   Q2   Q4   Q2   Q4   Q2   Q4   Q2   Q4    Q2   Q4     for 12.6% of overall Main Budget expenditure, on an average
                    |        2010 |     2011 |    2012 |    2013 |    2014 |    2015 |    2016 |    2017 |     2018 |
                                                                                                                           annual basis, over the next three years, measuring R247.4
Source: IDC, compiled using SARB data
                                                                                                                           billion by 2021/22.

                                                                                                                                                            Government savings
                                              Government savings as a % of GDP                                           • Fiscal challenges are affecting government’s ability to save.
              0.5
                                                                                                                         • In 2018, dissavings by government increased to R94.9 billion,
              0.0
                                                                                                                           from R80.8 billion in 2017.
              -0.5
                                                                                                                         • The situation is unlikely to improve meaningfully in the
              -1.0                                                                                                         medium-term, considering the fiscal challenges ahead.
                                                                                                                           Nonetheless, should the budget deficit-to-GDP ratio narrow,
   % of GDP

              -1.5
                                                                                                                           as projected over the next three years, dissavings by
              -2.0                                                                                                         government could also be reduced.
              -2.5                                                                                                       • Since government remains committed to fiscal consolidation,
                                                                                                                           taking measures to improve its financial position, this should
              -3.0
                                                                                                                           ultimately bear fruit on its savings propensity and reduce the
              -3.5                                                                                                         drag imposed on the country’s overall savings pool.
              -4.0
                        Q4     Q2 Q4     Q2 Q4     Q2 Q4     Q2 Q4    Q2 Q4     Q2 Q4     Q2 Q4     Q2 Q4     Q2 Q4
                         |     2010 |    2011 |    2012 |    2013 |   2014 |    2015 |    2016 |    2017 |    2018 |

 Source: IDC, compiled using SARB data
                                                                                                                                                                                              16
Exchange rates

                                                                                                                                                  The rand vs. the US dollar and the Euro
                                         Exchange rate movements of the rand                                                           • The rand came under severe pressure in 2018. Having started
                       20                                                                                                                the year relatively strong vis-à-vis the US dollar, averaging
                       18
                                Rand per euro
                                                                                                                                         ZAR/USD11.95 in Q1 2018, it subsequently depreciated sharply
                                Rand per US dollar
                                                                                                                                         towards an average of ZAR/USD14.25 in Q4 2018.
                       16
                                                                                                                                       • The sharp depreciation occurred mainly in the second half of
Rand per USD or Euro

                       14                                                                                                                the year, triggered by the Turkish and Argentinian crises.
                                                                                                                                         Although a recovery ensued, the rand has been under renewed
                       12                                                                                                                pressure in recent weeks
                       10                                                                                                              • Several factors have underpinned the weakening bias. On the
                                                                                                                                         external front, these included monetary policy tightening in the
                        8                                                                                                                US during the course of 2018; dollar strength; and escalating
                                                                                                                                         tension in the global trading arena due to US protectionist
                        6
                                                                                                                                         measures. Domestically, these included uncertainty regarding
                        4                                                                                                                the land reform process; Eskom’s financial and operational
                             3 6 9 12 3 6 9 12 3 6 9 12 3 6 9 12 3 6 9 12 3 6 9 12 3 6 9 12 3 6 9 12 3 6 9 12 3                          challenges, including the resumption of load-shedding; the
                              2010   | 2011      | 2012     | 2013         | 2014       | 2015   | 2016    | 2017     | 2018       |     issue of nationalising the SA Reserve Bank; the run-up to the
Source: IDC, compiled using SARB and Bloomberg data
                                                                                                                                         national elections; and the economy’s weak growth prospects.

                                                                                                                                               The rand versus other foreign currencies

                                          Exchange rate movements of the rand                                                          • The following depict the extent of appreciation (+) or
                       26                                                                                                                depreciation (-) of the rand against selected currencies over
                       24                                                                                                                the period March 2018 to March 2019*:
                       22
                                                                                                                                             – Australian dollar :        -9,9%
                       20
Rand per GBP or Yen

                       18                                                                                                                    – Brazilian real :           -3.7%
                       16
                                                                                                                                             – British pound :           -12,8%
                       14
                                                                                                                                             – Chinese renminbi :        -12.6%
                       12
                       10                                                                                                                    – Eurozone euro :           -10.2%
                        8
                                                                                                                                             – Indian rupee :            -12.1%
                        6                                                                          Rand per British pound

                        4                                                                          Rand per Japanese Yen (X 100)             – Japanese yen :            -13,7%

                        2                                                                                                                    – US dollar :               -17.8%
                             3 6 9 12 3 6 9 12 3 6 9 12 3 6 9 12 3 6 9 12 3 6 9 12 3 6 9 12 3 6 9 12 3 6 9 12 3

                             2010    | 2011     | 2012      | 2013        | 2014        | 2015   | 2016    | 2017     | 2018       |
Source: IDC, compiled using SARB and Bloomberg data
                                                                                                                                         *   The % changes are all based on monthly average exchange rates.

                                                                                                                                                       Effective* exchange rates of the rand
                                       Real and nominal effective exchange rates                                                       • On a trade-weighted basis*, the rand weakened by 3.6% in
                       140
                                                                                                                                         nominal terms (NEER) over the year to December 2018.
                                 Nominal effective exchange rate
                       130
                                 Real effective exchange rate                                          Appreciation                    • Excluding inflation, however, the real effective exchange rate
                       120                                                                                                               (REER) was marginally stronger, having appreciated by 0.2%
                       110                                                                                                               over the twelve months to December 2018, with the final
   Index: 2010 = 100

                                                                                                                                         quarter of the year witnessing a slightly stronger appreciation
                       100
                                                                                                                                         trend.
                       90

                       80

                       70

                       60
                                                                         Depreciation
                       50

                       40
                             3 6 9 12 3 6 9 12 3 6 9 12 3 6 9 12 3 6 9 12 3 6 9 12 3 6 9 12 3 6 9 12 3 6 9 12 3
                                                                                                                                       * Basket of currencies: Euro (29.3% weight), US dollar (13.7%),
                              2010   | 2011      | 2012         | 2013     | 2014       | 2015   | 2016    | 2017     | 2018       |
                                                                                                                                       Chinese renminbi (20.5%), British pound (5.8%) and Japanese yen
Source: IDC, compiled using SARB data
                                                                                                                                       (6.0%), among others.
                                                                                                                                                                                                              17
Balance of payments

                                                                                                                                                                                   Trade balance
                                             Movements in the trade balance                                                      • The South African Reserve Bank reported that South Africa’s
            100                                                                                                                    trade balance recorded a surplus of R24 billion in 2018,
            75
                                                                                                                                   substantially lower than the R65 billion registered in 2017.

            50
                                                                                                                                 • The sharp reduction in the surplus on the trade balance was
                                                                                                                                   largely due to the substantially higher value of oil imports,
            25                                                                                                                     resulting from the rising trend in global oil prices during the first
                                                                                                                                   three quarters of 2018, alongside rand weakness. In turn,
R billion

             0
                                                                                                                                   export demand slowed as key global markets such as China
            -25                                                                                                                    and the Eurozone experienced a slowing growth momentum.
            -50                                                                                                                  • Despite weak economic conditions domestically, imports
                                                                                                                                   increased considerably in 2018, even after taking into
            -75
                                                                                                                                   consideration the rising cost of oil and fuel imports.
        -100
                       Seasonally adjusted and annualised data                                                                   • The narrowing of the trade deficit in manufactured goods was
        -125                                                                                                                       supported by a 3.9% increase in the number of motor vehicles
                  Q4     Q2   Q4       Q2   Q4      Q2   Q4      Q2   Q4   Q2   Q4   Q2   Q4   Q2   Q4   Q2   Q4   Q2   Q4
                   |     2010 |        2011 |       2012 |       2013 |    2014 |    2015 |    2016 |    2017 |    2018 |          exported in 2018.
Source: IDC, compiled using SARB data

                                                                                                                                                          Trade performance per sector

                                                                                Change in export and import values : 2018 vs 2017
                 Agriculture
                                                                                                                                                                                      R64 495
                      Mining                                                                                                                                                           million
            Processed food
                  Beverages
                     Textiles
                    Clothing
                                                                                                                                                                    Imports     Exports
                     Leather
                   Footwear
            Wood products
            Paper products
   Printing and publishing
                 Petroleum
       Industrial chemicals
           Other chemicals
          Rubber products
           Plastic products
                       Glass
    Non-metallic minerals                                                                                                        Gross Domestic Product
             Iron and steel
                                                                                                                                  •     Conditions in the South African economy remain
        Non-ferrous metals
                                                                                                                                        unsatisfactory.
         Fabricated metals
  Machinery & equipment                                                                                                           •     The rate of decline in consumer spending deteriorated to
       Electrical machinery                                                                                                             5.8% in Q2 of 2009, its worst performance in almost 25
                 Radio & TV                                                                                                             years.
  Professional equipment                                                                                                          •     Factors contributing to poor consumer spending include
    Motor vehicles & parts                                                                                                              :
Other transport equipment
                   Furniture                                                                                                                    –   Increased job losses
      Other manufacturing                                                                                                                       –   Falling real disposable incomes
                                            -10 000                   -5 000                   0                   5 000               10 000           15 000            20 000            25 000
                                                                                                                           R Million
      Source: IDC, compiled using SARS data

                                                                                                                                                                                                           18
Balance of payments (cont.)

                                                                                                                                                           Current account of the balance of payments
                                       Current account of the balance of payments
                                                                                                                                                          • The deficit in the current account of the balance of payments
                                             and its respective components                                                                                  widened by R55 billion, from R118 billion in 2017 to R173
                       4                                                                                                                                    billion in 2018. This was largely due to the smaller surplus
                                                                    Transfers
                                                                    Income                                                                                  recorded on the balance of trade.
                       2                                            Services
                                                                    Trade
                                                                                                                                                          • The income account (dividends and interest received from
                                                                    Overall current account                                                                 foreigners less those paid by South Africans to external
                       0                                                                                                                                    parties) recorded a larger deficit in 2018, at R154 billion,
                                                                                                                                                            compared to a deficit of R140 billion in 2017.
     % of GDP

                      -2                                                                                                                                  • The deficit on the services account of the balance of
                                                                                                                                                            payments increased to R7.5 billion in 2018, from R5.3 billion
                      -4                                                                                                                                    in 2017. Tourism receipts played a role in this regard, with the
                                                                                                                                                            number of tourists from Europe having declined.
                      -6                                                                                                                                  • Transfer payments (on a net basis), including transfers to
                                                                                                                                                            SACU countries, fell to R35.7 billion in 2018, from R38.3
                      -8                                                                                                                                    billion in 2017.
                            Q4   Q2   Q4   Q2   Q4      Q2   Q4     Q2   Q4      Q2   Q4        Q2   Q4   Q2   Q4   Q2   Q4   Q2   Q4
                             |   2010 |    2011 |       2012 |      2013 |       2014 |         2015 |    2016 |    2017 |    2018 |
      Source: IDC, compiled using SARB data

     Note: Seasonally adjusted and annualised data

                                                                                                                                                                                 Balance on financial account
                                               Balance on the financial account                                                                           • South Africa attracted R142 billion worth of investments, as
                       90                                                                                                                                   recorded in the financial account, during 2018. This compares
                       80                                                                                                                                   to R110 billion in 2017. This account captures flows of direct
                       70
                                                                                                                                                            investment (generally of a longer-term nature), portfolio
                                                                                                                                                            investment (generally of a shorter-term nature), as well as
                       60
                                                                                                                                                            other (smaller) financial transactions.
                       50
                                                                                                                                                          • Political developments in South Africa early in the year were
      R Billion

                       40
                                                                                                                                                            viewed positively by the international investor community. This
                       30                                                                                                                                   was reflected by substantial portfolio inflows during Q1 2018
                       20                                                                                                                                   and increased foreign direct investment (FDI) activity in Q2
                                                                                                                                                            and Q3 of 2018. However, as it became increasingly clear that
                       10
                                                                                                                                                            South Africa’s challenges will take time to be resolved,
                        0                                                                                                                                   investor sentiment soured, leading to both portfolio and direct
                      -10                                                                                                                                   investment outflows in Q4 2018.
                      -20
                            Q4   Q2 Q4      Q2 Q4       Q2 Q4       Q2 Q4        Q2 Q4         Q2 Q4      Q2 Q4     Q2 Q4     Q2 Q4                       • Similarly, outward investment by South Africans slowed in Q2
                             |   2010 |
      Source: IDC, compiled using SARB data
                                            2011 |      2012 |      2013 |       2014 |        2015 |     2016 |    2017 |    2018 |
                                                                                                                                                            and Q3, but their offshore investment activity increased
                                                                                                                                                            substantially in Q4 2018.

                                                                                                                                                                             Total reserves and import cover
                                              Total reserves and the import cover                                                                         • The strengthening of the rand during Q4 2017 and in Q1 2018
                      800                                                                                                         8
                                   Total reserves (gold & foreign exchange): (LHS)                                                                          resulted in the value of South Africa’s reserves declining over
                      700          Import cover (months)                                                                          7                         this period.

                      600                                                                                                         6
                                                                                                                                                          • During the subsequent three quarters of 2018, however, their
                                                                                                                                                            value increased in line with the steadily weakening currency,
Reserves: R Billion

                                                                                                                                       Number of months

                      500                                                                                                         5                         which offset the falling gold price in dollar terms.

                      400                                                                                                         4
                                                                                                                                                          • The total value of reserves ended 2018 at R742 billion,
                                                                                                                                                            exceeding the previous nominal peak recorded in Q4 2015.
                      300                                                                                                         3
                                                                                                                                                          • At this level, South Africa’s reserves cover around 5 months’
                      200                                                                                                         2
                                                                                                                                                            worth of imports. This import cover ratio remains above its
                                                                                                                                                            long-term average.
                      100                                                                                                         1

                       0                                                                                                          0
                            Q4   Q2 Q4     Q2 Q4       Q2 Q4       Q2 Q4       Q2 Q4          Q2 Q4    Q2 Q4    Q2 Q4    Q2 Q4
                             |   2010 |    2011 |      2012 |      2013 |      2014 |         2015 |   2016 |   2017 |   2018 |
Source: IDC, compiled using SARB data
                                                                                                                                                                                                                               19
Balance of payments (cont.)

                                                                                                                            Composition of the export basket
                                         Composition of the export basket                                  • Total exports increased by 5.4% in 2018, assisted by higher
          100                                                                                                commodity prices, on average, relative to 2017, as well as by
               90
                                            Manufactured products                                            the rand’s depreciation during the year. The relative shares of
                                            Agriculture, forestry & fishing                                  the major components of the export basket remained largely
               80                           Gold                                                             unchanged.
                                            Other mining products
               70                                                                                          • Agricultural exports increased by 7.8%, propelled by the
                                                                                                             recovery in horticultural exports, as climatic conditions
% of Exports

               60
                                                                                                             improved in the winter rainfall areas.
               50
                                                                                                           • Mining sector exports, in turn, rose by 4.4%. Gold and
               40                                                                                            platinum exports increased in value terms, while challenges
               30
                                                                                                             on the iron ore rail line resulted in a significant decline in iron
                                                                                                             ore exports, despite an increase in iron ore prices.
               20
                                                                                                           • The total value of manufactured exports increased by 5.7% in
               10                                                                                            2018, with the largest contributions made by motor vehicles,
                                                                                                             parts and accessories (+R14.3 billion); non-electrical
                0
                                                                                                             machinery and equipment (+R5.8 billion); basic non-ferrous
 Source: IDC, compiled using SARS data                                                                       metals (+R5.5 billion); and basic chemicals (+R5.4 billion).

                                                                                                                       Imports according to broad category
                          Composition of the merchandise import basket                                     • Despite the weak economic environment domestically, the
               60                                                                                            total value of imports increased by 11.6% in 2018, largely as
                                                                                                             a result of the significantly higher value of crude oil imports
               50
                                                                                                             (which grew by R60 billion) and, to a lesser extent, printing
                                                                 Intermediate goods                          and publishing (+R12.7 billion, most likely attributable to
                                                                                                             imports of bank notes), as well as motor vehicles, parts and
               40                                                                                            accessories (+R9.7 billion).
                                                                                                           • Higher raw material imports, mainly crude oil, were the result
% Share

               30
                                                                                      Consumption goods
                                                                                                             of a weakening rand in conjunction with rising oil prices
                                                   Capital goods
                                                                                                             during the first three quarters of 2018.
               20
                                                                                                           • The subdued levels of fixed investment activity were reflected
                                                                                                             in the decline in capital goods’ imports during 2018.
               10
                                                                   Raw materials                           • With household spending relatively resilient, the trend in
                                                                  (incl. Crude oil)                          imports of consumption goods remained somewhat stable.
                0

 Source: IDC, compiled using SARS data

                                                                                                                                           Key export destinations
                                 Export performance by key destination                                     • China remained South Africa’s largest trading partner, at the
               140
                                                                                           2017     2018     individual country level, in 2018. However, the value of
               120                                                                                           exports to the world’s 2nd largest economy decreased, year-
                                                                                                             on-year, in 2018. This may be attributed to a slowing Chinese
               100
                                                                                                             economy and to challenges faced by iron ore producers in
               80
                                                                                                             exporting their product on the Sishen-Saldanha railway line.
R Billion

                                                                                                           • Germany overtook the US as South Africa’s 2nd largest
               60
                                                                                                             trading partner in 2018. Whereas motor vehicle exports to the
               40                                                                                            US declined, vehicle exports to Germany and the United
                                                                                                             Kingdom (UK) increased significantly.
               20
                                                                                                           • Higher platinum exports further contributed to the improved
                0                                                                                            trade performance with the UK.
                                                                                                           • Exports to South Africa’s main African trading partners
                                                                                                             generally increased as higher commodity prices supported
                                                                                                             increased economic activity in these markets.
 Source: IDC, compiled using SARS data

                                                                                                                                                                                   20
You can also read