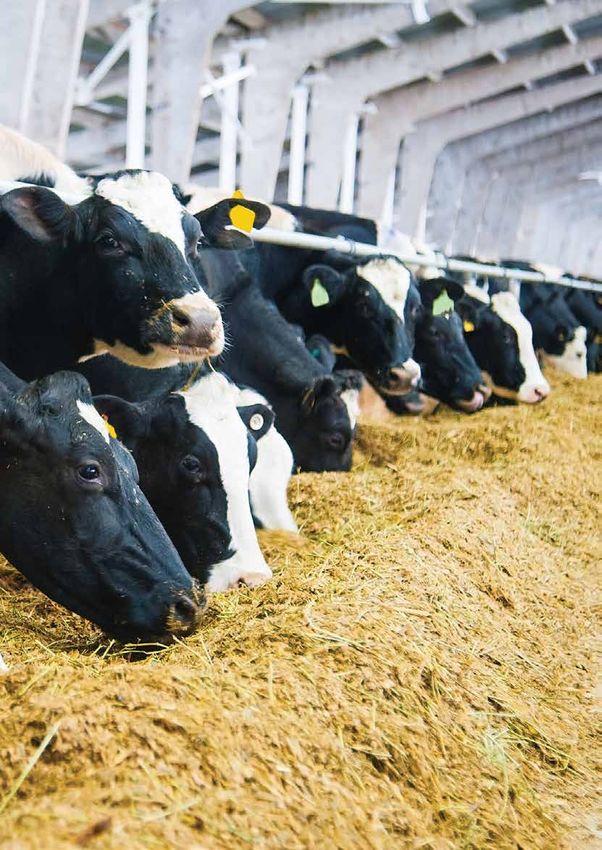
CLIMATE CHANGE AND THE GLOBAL DAIRY CATTLE SECTOR - The role of the dairy sector in a low-carbon future - FAO
←
→
Page content transcription
If your browser does not render page correctly, please read the page content below
CLIMATE CHANGE
AND THE GLOBAL
DAIRY CATTLE SECTOR
                                                      ©FAO/Giuseppe Bizzarri

The role of the dairy sector in a low-carbon future
22
©FAO/ Sergei Gapon

                     ACKNOWLEDGEMENTS
                     This document is a product of the collaborative effort between the Food and Agriculture Organization of the United Nations (FAO); the Global Dairy
                     Platform (GDP) and the Global Agenda for Sustainable Livestock (GASL).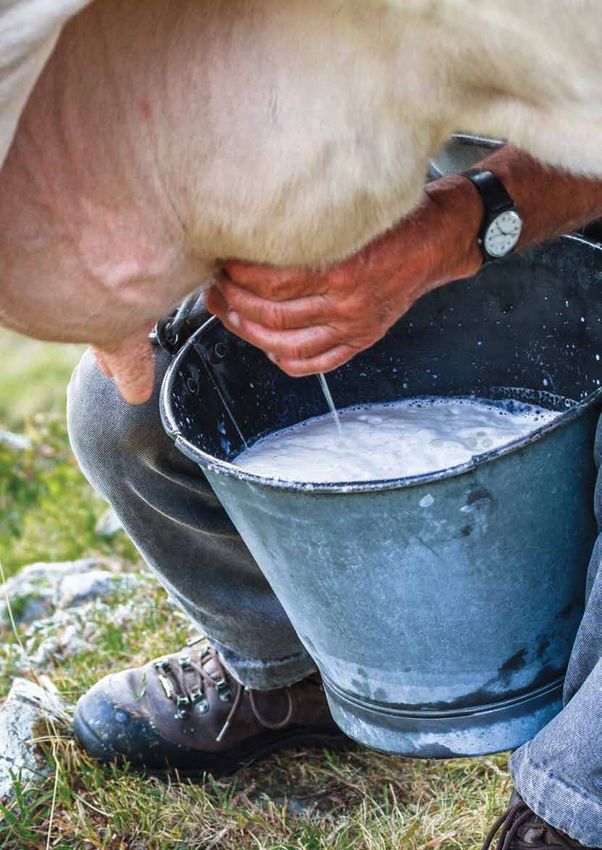
Climate change and the global
dairy cattle sector
The role of the dairy sector in a low-carbon future

                                                              3

Published by
the Food and Agriculture Organization of the United Nations
and
Global Dairy Platform Inc.
Rome, 2019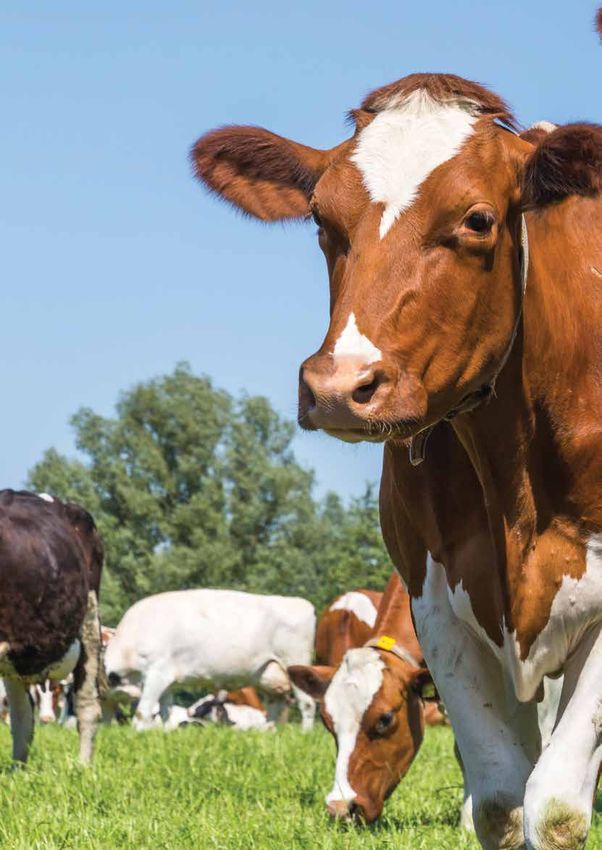
Required citation:
FAO and GDP. 2018. Climate change and the global dairy cattle sector – The role of the dairy sector in a low-carbon
future. Rome. 36 pp. Licence: CC BY-NC-SA- 3.0 IGO
The designations employed and the presentation of material in this information product do not imply the
expression of any opinion whatsoever on the part of the Food and Agriculture Organization of the United Nations
(FAO) or Global Dairy Platform Inc. (GDP) concerning the legal or development status of any country, territory, city
or area or of its authorities, or concerning the delimitation of its frontiers or boundaries. The mention of specific
companies or products of manufacturers, whether or not these have been patented, does not imply that these
have been endorsed or recommended by FAO or GDP in preference to others of a similar nature that are not
mentioned.
The views expressed in this information product are those of the author(s) and do not necessarily reflect the views
44 or policies of FAO or GDP.
ISBN 978-92-5-131232-2 (FAO)
© FAO, 2019
Some rights reserved. This work is made available under the Creative Commons
Attribution-NonCommercial-ShareAlike 3.0 IGO licence
(CC BY-NC-SA 3.0 IGO; https://creativecommons.org/licenses/by-nc-sa/3.0/igo/legalcode).
Under the terms of this licence, this work may be copied, redistributed and adapted for non-commercial
purposes, provided that the work is appropriately cited. In any use of this work, there should be no suggestion that
FAO endorses any specific organization, products or services. The use of the FAO logo is not permitted. If the work
is adapted, then it must be licensed under the same or equivalent Creative Commons license. If a translation of
this work is created, it must include the following disclaimer along with the required citation: “This translation was
not created by the Food and Agriculture Organization of the United Nations (FAO). FAO is not responsible for the
content or accuracy of this translation. The original English edition shall be the authoritative edition.”
Disputes arising under the licence that cannot be settled amicably will be resolved by mediation and arbitration
as described in Article 8 of the licence except as otherwise provided herein. The applicable mediation rules will
be the mediation rules of the World Intellectual Property Organization http://www.wipo.int/amc/en/mediation/
rules and any arbitration will be in accordance with the Arbitration Rules of the United Nations Commission on
International Trade Law (UNCITRAL).
Third-party materials. Users wishing to reuse material from this work that is attributed to a third party, such as
tables, figures or images, are responsible for determining whether permission is needed for that reuse and for
obtaining permission from the copyright holder. The risk of claims resulting from infringement of any third-party-
owned component in the work rests solely with the user.
Sales, rights and licensing. FAO information products are available on the FAO website (www.fao.org/publications)
and can be purchased through publications-sales@fao.org. Requests for commercial use should be submitted
via: www.fao.org/contact-us/licence-request. Queries regarding rights and licensing should be submitted to:
copyright@fao.org.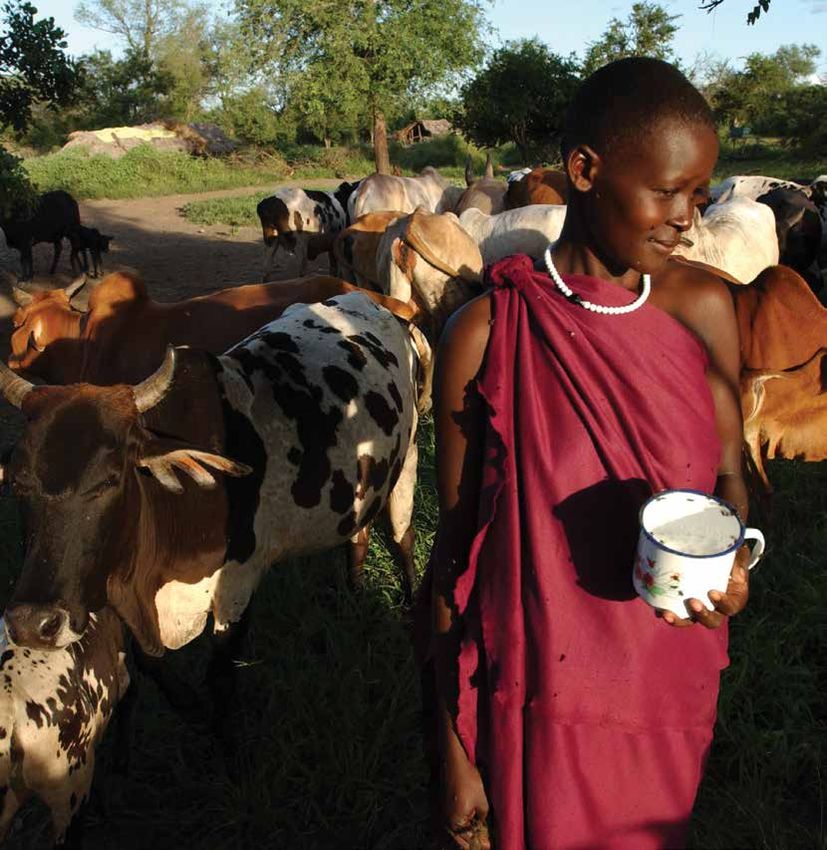
Executive Summary                   6

1. Setting the scene	              11

2. The Approach                    14

3. Trends in milk production and
production efficiency              16
                                                  5
                                                  5
4. Trends in emissions from
the dairy cattle sector            20

5. How can the dairy sector
play its part?                     28

ANNEX	34

                                        © HildaWeges - stock.adobe.com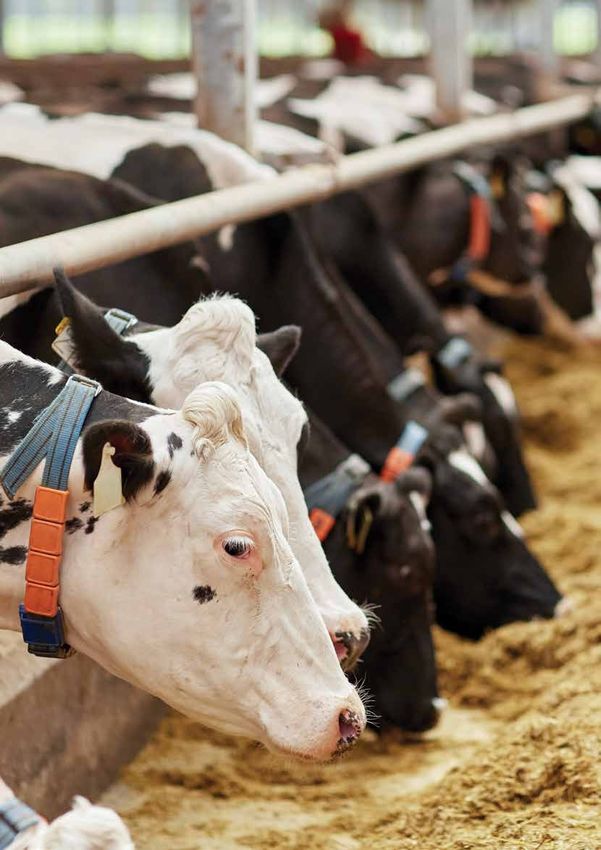
Executive Summary

                                                     The challenge for policy-makers – and for the dairy
     Climate change along with population            sector – is how to reduce environmental impacts while
     growth, poverty alleviation, environmental      continuing to meet society’s needs. Dairy products
     degradation and global food insecurity          are a rich source of essential nutrients that contribute
     is one of the defining challenges of the        to a healthy and nutritious diet. With demand for
     21st century. From shifting weather patterns    high-quality animal sourced protein increasing
     that threaten food production, to rising sea    globally, the dairy sector is well placed to contribute
66   levels that increase the risk of catastrophic   to global food security and poverty reduction through
     flooding, the impact of climate change is       the supply of dairy products. In so doing, it is essential
     global in scope and unprecedented in scale.     that sector growth is sustainable in terms of the
     What is clear is that if we do not produce      environment, public and animal health and welfare
     win-win solutions then climate change will      and in terms of development, poverty alleviation and
     make all other challenges worse.                social progress.

                                                     The Climate Agreement adopted at the UN Climate
                                                     Change Conference of Parties in Paris in December
                                                     2015, and supported by 195 countries, provided a
                                                     timely reminder that all sectors and stakeholders need
                                                     to undertake immediate actions on climate change.

                                                     The world is already experiencing, for example, more
                                                     frequent floods, storms and droughts, forest fires
                                                     causing damage to the environment and people’s
                                                     livelihoods. The dairy sector must contribute
                                                     effectively to the global effort to avoid dangerous
                                                     climate change, become more resilient and prepare
                                                     for and adapt to a changing climate.

                                                     In order to limit temperature rise, the dairy sector
                                                     must reduce its greenhouse gas (GHG) emissions and
                                                     work towards a low-carbon future. The good news is
                                                     that there are many opportunities within the sector
                                                     to limit climate change by reducing emissions. While
                                                     there is some uncertainty about the size and timing
                                                     of changes, it is certain that it is happening and acting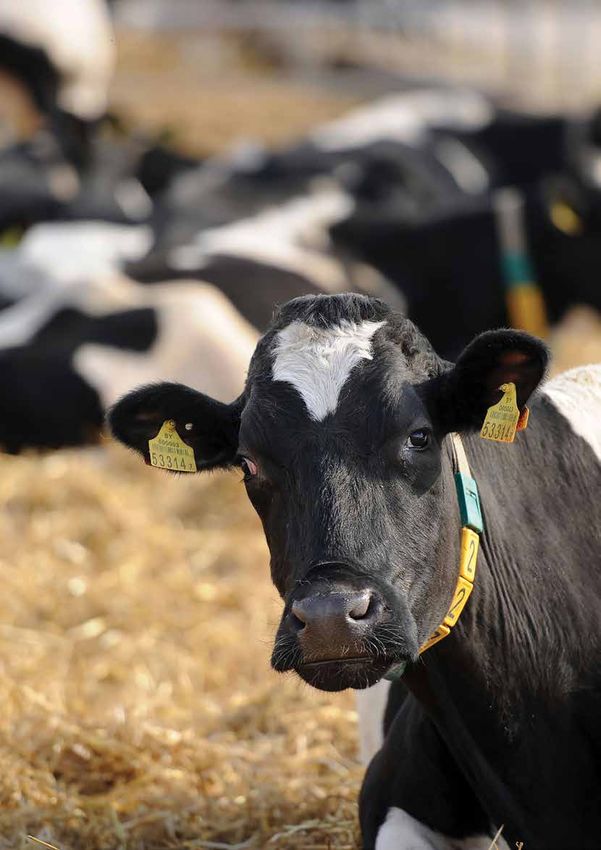
©FAO/Chedly Kayouli
now to protect our environment, economy and culture     So while total emissions have increased, dairy
will always be worthwhile.                              farming has become more efficient resulting in
                                                        declining emission intensities per unit of product.
To consider how to deal with climate change,
the dairy sector needs to have evidence at hand,        Emission intensities, GHG per kilogram of milk,
presented in a clear and comprehensible way,            have declined by almost 11 percent over the period
so stakeholders can see how they can and must           2005-2015. These declines are recorded in all regions
contribute.                                             reflecting continued improvements to on-farm                    7
                                                                                                                        7
                                                        efficiency achieved via improved animal productivity
This report is an attempt to understand the             and better management. There is however a distinct
contribution of the dairy sector to global emissions    difference in emission intensities between regions:
between 2005 and 2015 as a further step towards         generally, emission intensity of milk production is
addressing the challenge of climate change and          lowest in developed dairy regions (ranging between
defining a low-carbon pathway for the sector.           1.3 to 1.4 kg CO₂ eq. kg fat-and-protein corrected milk
                                                        in 2015) while developing dairy regions such as South
                                                        Asia, Sub-Saharan Africa, West Asia and North Africa
Emissions from the                                      having higher emission intensities (ranging between
dairy sector                                            4.1 to 6.7 kg CO₂ eq. per kg fat-and-protein corrected
                                                        milk in 2015).
This study shows that the sector’s GHG emissions
have increased by 18 percent between 2005 and           Large variations in emission intensity was also found
2015 because overall milk production has grown          within the same regions. This variation is explained
substantially by 30 percent, in response to increased   by differences in management practices and implies
consumer demand. The trends in absolute emissions       that potential exists to reduce GHG emissions in
reflect changes in animal numbers as well as            all regions.
changes in the production efficiency within the
sector. Between 2005 and 2015, the global dairy herd
increased 11 percent. At the same time, average         More ambitious action
global milk yield increased by 15 percent. Increased    needed now
production efficiency is typically associated with a
higher level of absolute emissions (unless animal       There is a clear case for immediate and more
numbers are decreasing). Yet without efficiency         ambitious action. Dairy farmers are already part of
improvements, total GHG emissions from the dairy        the solution to limit climate change, but there is an
sector would have increased by 38 percent.              urgent need to accelerate and intensify the sector’s
                                                        response to avoid climate tipping points. While
                                                        new research and technologies will continue to be
developed, many mitigation options are already            in soils and identifying key strategies to promote
     available and their adoption can be accelerated.          circular economy opportunities to reduce greenhouse
     Further delaying adoption will result in a greater        gas emissions. For example, implementing improved
     amount of emissions overall, given that CO₂ emissions     grassland management practices that increase
     accumulate in the atmosphere for hundreds to              carbon uptake by increasing productivity or reducing
     thousands of years. Even with implementation              carbon losses can lead to net accumulation of
     of best practice and technologies, it is likely that      carbon in grassland soils – sequestering atmospheric
     some residual emissions will remain in the future.        carbon dioxide. Furthermore, making the sector
     The dairy industry will therefore need to also consider   more circular would not only lead to more efficient
     how these residual emissions will be offset. Achieving    resource use, but also help address climate change.
     substantial net reductions in GHG emissions from          Minimizing the production of new resources, wastage
     the dairy sector will require action in the three broad   of resources, closing of nutrient loops and extending
     areas of 1) improving efficiencies; 2) capturing and      the lifetime of those already in circulation can have a
     sequestering carbon; and 3) better linking dairy          significant impact on climate.
     production to the circular bio-economy.
                                                               Strategies can involve, for example, `nutrient recovery
     These three pathways result in the reduction of:          technologies’ like anaerobic digestion, breaking
     • emission intensity, the emissions required to           down manure to produce nutrient-rich products that
       produce a kilogram of milk; and                         can be used to replace synthetic fertilizers, which
     • absolute emissions from dairy production.               have increased significantly over the past decade
                                                               and contribute heavily to CO₂ and N₂O emissions. In
                                                               addition, leveraging possibilities of technology can
     Reducing emission                                         advance modernization of agriculture by moving to
     intensity of dairy                                        precision farming, for example, including measures
     productION                                                for irrigation, fertilization and precision feeding.
                                                               Closing agricultural product and nutrient cycles also
     Accelerating the adoption of existing best practices      helps maintain soil quality and prevent land-use
     and technologies to further improve production            change elsewhere.
     efficiency can help reduce emission intensity. While
88   the largest gains in emission intensity reduction have
     occurred in low-and-middle income regions with            Supporting low-carbon
     low productivity, the results also show that there        pathways
     still exists a large gap between producers in these
     regions. This gap provides room to further mitigate       There is no single pathway to a low carbon future.
     emissions within existing systems. In low-and-middle      The dairy sector has the potential to make the
     income countries, the concept of emission intensity       transition to a low-carbon economy by taking
     remains the most attractive mitigation route because      mitigation actions. While this will have costs, it will
     it allows for the harnessing of synergies between food    also bring benefits and opportunities that need to be
     security, development objectives and climate change       considered. This study is a further step to enable an
     mitigation and adaptation goals.                          open dialogue around options, choices and impacts.

                                                               Research, policies, regulations, infrastructure, and
     Reducing absolute                                         incentives will all be required to systematically
     emissions from dairy                                      support low-carbon choices. Investment in data
     production                                                gathering and further in-depth analysis will help
                                                               identify and refine mitigation options, actions and
     Absolute emissions reduction will become an               support a transparent debate about longer-term
     imperative as the world moves towards carbon              desirable and feasible mitigation pathways.
     neutrality by 2050. While recognizing the
     responsibility of the dairy sector to develop in a
     sustainable manner, the mitigation potential of the
     sector is limited because, as a biological process,
     emissions will always be generated. This raises the
     question of using additional levers to compensate
     for residual emissions. Some solutions to address the
     dilemma of increasing emissions are for the sector
     to focus on enhancing carbon capture and storage
©FAO/Mohammad Rakibul Hasan
                              99
10
                                10
©FedevPhoto - stock.adobe.com
1. Setting the scene
The global demand for food is expected to double by 2050. The UN estimates that the world
population is expected to increase from 7.6 billion today, to reach 8.6 billion in 2030, 9.8 billion
in 2050 and surpass 11.2 billion in 2100. Agricultural systems throughout the world will have to
provide extra food to feed this growing population. This growth will provide opportunities and
challenges for the dairy sector. The challenge is to feed the global population with food that is
both healthy, nutritious and sustainably produced.
11
More than 80 percent of the world’s population, or often keep mixed herds with more than one species of
about 6 billion people, regularly consume liquid dairy animal. Cows are by far the most common dairy
milk or other dairy products. In 2014, the global animal, with farmers in developing countries usually
dairy market was estimated at US $330 billion keeping them in herds of two or three animals
(FAOSTAT, 2014). (FAO, 2016).
People benefit from consuming milk and dairy In about 25 percent of cattle-keeping households,
products. They are nutrient-dense foods that supply or in about 35 million farms, dairy cows are directly
energy and significant amounts of protein and owned and/or managed by women (FAO, 2016).
micronutrients, including calcium, magnesium, Dairy often serves as a platform for rural women to
selenium, riboflavin, and vitamins B5 and B12. consolidate a better place for themselves in their
They are the fifth largest provider of energy and the society. As about 22 percent of the world’s women of
third largest provider of protein and fat for human working age are employed in agriculture and about
beings and an important source of affordable one-fourth of agricultural holdings, headed by both
nutrition to meet recommended levels. men and women, keep milk animals, about 80 million
women are to some extent engaged in dairy farming
More than one-quarter of 570 million farm-holdings (FAO, 2016).
worldwide, or more than 150 million farmers, are
estimated to keep at least one milk animal, including The challenges for the dairy sector include bringing
cows, buffaloes, goats, and sheep. There are estimated milk to the consumer at competitive prices when
to be 133 million holdings keeping dairy cattle, 28.5 dairy production is subject to changing weather
million with buffaloes, and 41 and 19 million with patterns, changing market dynamics and dairy
goats and sheep, respectively (FAO, 2016). Farmers prices. At the same time, there is a growing emphasis
on sustainability. People are concerned about the
environment, animal welfare and the quality of
their food.Dairy is essential in the endeavor towards ending emissions. It sets a global aim to limit warming to
hunger, achieving food security and improving the below 2°C and to pursue efforts to limit it to 1.5°C.
nutritional value of diets in a sustainable manner. To achieve this aim, the Agreement sets a target for
The UN Sustainable Development Goals includes a ‘balance between anthropogenic emissions by
several priority areas relevant to agriculture and food sources and removals by sinks of greenhouse gases
production including the zero hunger target by 2030, in the second half of this century’. In looking to meet
the sustainable use of natural resources and climate these goals, countries are expected to continue to
action. By 2050, the planet will need to produce more take the lead in reducing emissions, reflecting the
food, while conserving available land, water and principle of equity and common but differentiated
energy resources and reducing GHG emissions. This responsibilities and respective capabilities (UNFCCC,
challenge is exacerbated by the reality that one-third 2015)3. To support the transition to these pathways,
of food produced for human consumption is wasted the Paris Agreement invites countries to develop, by
(FAO, 2011)1. Consequently, effective climate change 2020, ‘mid-century, long-term low greenhouse gas
policy measures must address both demand and emission development strategies’.
supply related factors.
Under the Paris Agreement, 92 countries have
The evidence that our planet is warming due to included the livestock sector in their nationally
human activity is unequivocal. Global temperature determined commitments (NDCs) as a means to
has increased by 0.85 degrees since 1880 (IPCC, 2014)2. achieve their national reduction targets (Wilkes,
Global warming is caused by increasing levels of 2017)4. The sector is thus part of the response to
greenhouse gases (GHGs) in the atmosphere. Climate address the impacts of climate change and to limit
change influences dairy farming in multiple ways the rise in global temperature, requiring a transition
(directly, e.g. the performance and well-being of cows, of the sector to one consistent with a sustainable low
or indirectly, e.g. via impacts on quantity and quality carbon and climate resilient development pathway.
of fodder production).
This report is an effort to support the dairy sector to
At the same time, livestock products are responsible chart possible low-emission pathways. It presents
for more GHG emissions than most other food findings on emissions and emission intensities of
sources. In dairy production, emissions are the result milk production with the aim of assessing whether
12 of various complex biological processes. For example the sector's performance is consistent with the global
methane from enteric fermentation where methane reduction needed to realize the Paris Agreement
is produced as a by-product of the digestion process. aspirations. These emission trends are analyzed using
Additional methane and nitrous oxide emissions FAO’s Global Livestock Environmental Assessment
occur throughout the whole process of managing model (GLEAM); a spatially explicit biophysical
manure from livestock: in pastures and in buildings, model that estimates the impact of the livestock sector
during storage and when spreading manure. They on emissions using a life cycle assessment (LCA)
are the result of physical, chemical and biological approach.
processes which vary in time and space depending on
the ambient conditions (e.g. temperature, wind), the The objective of this work is two-fold:
surroundings (e.g. soil, type of building) and livestock • First, it seeks to assess the performance of the
characteristics (e.g. physiological stage) and farming dairy sector, understand the sector’s contribution
practices. Other emissions include carbon dioxide to global GHG emissions over time and identify
largely associated with energy use, production and emission reduction opportunities that are available
transport of inputs and land use and land use change. to the dairy sector.
• Secondly, to provide information that can
The Paris Agreement marked a turning point in the support the sector in taking steps towards further
international climate negotiations and signifies addressing emissions from the dairy production as
an intensification of global efforts towards a low part of its contribution towards the achieving global
emissions future. In November 2016, the Paris goals enshrined in the Paris Agreement and 2030
Agreement entered into force, having been ratified Agenda for Sustainable Development.
by nations representing over 55 percent of total GHG
1
FAO. 2011. Global food losses and food waste – Extent, causes and prevention. Rome. http://www.fao.org/3/a-i2697e.pdf
2
IPCC. 2014. Fifth Assessment Report (AR5) - Summary for policy makers. https://www.ipcc.ch/pdf/assessment-report/ar5/syr/AR5_SYR_FINAL_SPM.pdf
3 UNFCCC. 2015. The Paris Agreement. https://unfccc.int/process-and-meetings/the-paris-agreement/the-paris-agreement
4 Wilkes, A. 2017. Measurement, reporting and verification of greenhouse gas emissions from livestock: current practices and opportunities for
improvement. https://cgspace.cgiar.org/bitstream/handle/10568/80890/Livestock%20MRV%20Info%20Note%20May%203%202017.pdf© Syda Productions - stock.adobe.com
132. The Approach
How do we measure for mitigation, is a management decision taken at
the farm level. It thus reduces the menu of options
emissions?
available to the sector industry to reduce GHG
Understanding the contribution of the dairy sector to emissions and doesn’t provide the right incentives for
emissions is a first step towards defining low-carbon mitigation to happen.
pathways. Livestock produce GHG emissions in a
14
14 Furthermore, the IPCC method quantifies GHG
number of ways: direct emissions by livestock (from
emissions using a national sector-based approach.
manure and enteric fermentation), and indirect
The approach estimates emissions from the
emissions from the production of livestock feed,
production of products within defined national
energy use in fertilizer manufacture, farm operations
boundaries and emissions from the production of
such as milking, refrigeration, housing, storage
goods exported from a nation, but does not consider
and transport, and post-production transportation,
emissions from the production of goods imported into
processing and retailing.
a country.
As part of their international commitments under the
Approaches that can be used to examine the
Kyoto Agreement, countries are required to report
agricultural sector as a whole, evaluate trade-offs
annually on their emissions. The Intergovernmental
between the production of agriculture commodities
Panel on Climate Change (IPCC) has defined the
such as milk and meat are needed in order to
guidelines for the reporting of national inventories
evaluate policies and practices designed to reduce
of GHG emissions. For the agricultural sector, the
the environmental impact of agriculture. One
IPCC defines four groups of activities. For livestock,
such approach is the life cycle assessment (LCA)
this comprises of methane emissions from enteric
that accounts for all GHG emissions associated
fermentation and methane and nitrous oxide
with the production of a commodity. For livestock,
emissions from manure management. Other
this includes not only the direct emissions from
emissions associated with livestock production are
animals but also indirect emissions arising from the
reported elsewhere. For example, in the current
production of inputs such as nitrogenous fertilizer
accounting procedures, indirect carbon dioxide or
and feed, even if the emissions associated with
nitrous oxide emissions due to production, transport
the production of these imported products were
and use of synthetic fertilizer and other production
generated in other jurisdictions. The LCA approach
inputs are reported under industry, energy generation
supports the sector in understanding the source of
and transport sectors. However, the responsibility
impacts, identifying areas for improvements and
for resource utilization, and the possible options
assessing the impacts of best practices on GHG
emission. The approach provides a baseline against
which to measure improvements over time.Accounting for emissions Emissions are reported as CO₂ equivalent emissions,
based on 100-year Global Warming Potential
in this study
(GWP100) conversion factors. To estimate the impact
This study uses the FAO’s Global Livestock of climate change, GLEAM 2.0 uses the latest GWP
Environmental Assessment Model (GLEAM)5, a values from IPCC (2014): GWP100 CH₄ = 34 and
biophysical model to assess emissions from the GWP100 N₂O = 298.
dairy cattle sector. The current report provides an
Emission intensities are expressed per kilogram of fat-
assessment of the emissions from the dairy cattle
and-protein corrected milk (FPCM) at the farm gate.
sector for the reference years 2005, 2010 and 2015
Dairy systems generate several saleable products, so
analyzing the trends in emissions and emission
the GHG emissions should ideally be allocated across
intensities from milk production. GLEAM 2.0 is a
the co-products. Meat from male calves, female calves
model using a life cycle assessment (LCA) method for
in excess of replacement requirements, and culled
the identification of all main emission sources along
cows is an inevitable and valuable co-product of dairy
livestock supply chains; starting from land use and
production. Different allocation methods can be used
the production of feed through to animal production
e.g. mass, biophysical, economic, or system expansion
on farm and finally processing and transportation of
approaches for allocating the total emissions among
products to the retail point.
co-products. This study utilizes a biophysical
This study focuses on major GHG emissions up to the approach based on protein content to apportion
farm-gate that make up the bulk of the emissions in emissions to products (milk and meat).
livestock systems (Gerber et al., 2013).
There are a few caveats to this work. Most importantly,
The three major GHGs emitted from agri-food the 2015 analysis of GHG emissions from milk
systems are covered – namely methane (CH₄), nitrous production only considers changes in the dairy herd
oxide (N₂O) and carbon dioxide (CO₂). and milk yield. In the 2015 analysis, it is assumed
that production factors such as feed composition,
The emission sources considered include: manure management systems are similar to those
(i) on-farm livestock rearing including enteric modeled in 2010. In addition, the analysis does not
fermentation, manure deposition by grazing consider emissions after the farm-gate and emissions
associated with the production of meat from the 15
animals, manure management and application
of manure to agricultural land; dairy herd. In some regions, beef is closely linked
(ii) fodder and feed production including to milk production. The results from this analysis
application of mineral fertilizer, the cultivation cannot be compared to FAO’s previous analysis
of organic soils, crop residue decomposition and on GHG emissions because it is based on a revised
related upstream industrial processes (fertilizer methodology and dataset captured in the GLEAM 2.0
production); version.
(iii) on-farm energy consumption related to livestock
and feed production and energy consumption The objective of this analysis is to assess the GHG
for the transport and processing of feed; contribution of the global dairy sector over time
(iv) land use changes (LUC) induced by the and to better understand where further mitigation
production of feed (excluding grassland and potential is for the sector. Whilst the methodology
grazing); and used in this study is scientifically robust, care should
(v) indirect energy related to the construction of be taken if trying to compare these outcomes to
animal housing and farm equipment. individual country or regional studies that may only
assess parts of the dairy chain, or have had access to
Emissions from post-farm gate emissions (transport, more specific primary data, utilized a smaller sample
processing and distribution to retail) and meat from size or are even reporting for different purposes
the dairy sector are excluded. and as such applying different methodological
approaches.
The vital output from this analysis for the dairy sector
is the trend over the 10-year period and the knowledge
of where to target mitigation actions.
5 FAO. 2018. GLEAM Model description. Rome, http://www.fao.org/fileadmin/user_upload/gleam/docs/GLEAM_2.0_Model_description.pdf3. Trends in milk production
and production efficiency
Almost 666.5 billion kg of milk was produced globally in 2015, 30 percent more than in 2005.
Growth in global cow milk production during the decade (2005-2015) averaged 2.8 percent
per annum (p.a.). Growth between 2005 and 2010 averaged 2.5 percent p.a., slower than the
3.1 percent p.a. observed during the period 2010-2015. The number of milking cows and milk
production per cow (milk yield) also changed. Over the decade, average global milk yield per
cow has increased from 2,180 litres in 2005 to 2,514 litres in 2015 (a 15 percent increase) while the
16
16 number of milking cows increased by 14 percent.
Regional milk supplies of dairy farms. Factors such as varying climate and
landscape characteristics, production practices and
Figure 1 illustrates the milk production of 10 regions milk price, etc.
for 2005, 2010, 20156. Western Europe and North
America, (generally considered the traditional dairy
cattle regions) in 2015 produced the bulk of milk from Growth in milk production
the dairy cattle sector; 22 percent and 15 percent,
respectively. Despite this, their production shares During the decade, highest annual growth in milk
in global milk production have declined (Figure 2). production occurred in WANA (4.5 percent p.a.),
The share of global milk production has increased South Asia (4.0 percent p.a.) and SSA (3.6 percent
in other regions such as South Asia, Sub-Saharan p.a.). Compared to other regions, in SSA, growth in
Africa (SSA), West Asia and North Africa (WANA) – not productivity remains small given that it starts from
surprising since these are currently some of the fastest a very low base. In Oceania, Eastern Europe, Central
growing milk-producing regions (Figure 3). In East & South America, and the Russian Federation milk
Asia and Central and South America, production production grew at 3.8, 3.2, 2.9 and 2.3 percent p.a.
shares tended to increase between 2005 and 2010 between 2005 and 2015. Milk production in Western
and decline in 2015. While in the Russian Federation Europe and North America, on the other hand, grew
and Eastern Europe, the share declined in 2010, only at 1.5 and 1.6 percent per annum, respectively –
followed by increases in 2015. These shifts ultimately which is slower than the 2.8 percent p.a. observed at
reflect differences in a range of factors across the global level (Figure 3).
regions that affect the profitability and productivity
6 Regions included in this study: Central & South America (CSA) , East Asia (EA), Eastern Europe (EE), North America (NA), Oceania (O), Russian
Federation (RF), South Asia (SA), Sub-Saharan Africa (SSA), West Asia & Northern Africa (WANA) and Western Europe (WE). See Annex for countries
included in each region.2005 2010
2005 2010 20152015
160
30.0
140
25.0
milk milk production (%)
120
20.0
15.0
100
Billionofkgglobal
10.0
80
Share
5.0
60
0.0
40
Central & East Asia Eastern North America Oceania Russian South Asia Sub-Saharan West Asia & Western
South America Europe Federation Africa Northern Africa Europe
20
0
Central & East Asia Eastern North America Oceania Russian South Asia Sub-Saharan West Asia & Western
South America Europe Federation Africa Northern Africa Europe
Figure 1: Milk production by region in 2005, 2010 and 2015
2005 2010 2015
30.0
25.0
Share of global milk production (%)
20.0
15.0
17
10.0
5.0
0.0
Central & East Asia Eastern North America Oceania Russian South Asia Sub-Saharan West Asia & Western
South America Europe Federation Africa Northern Africa Europe
Figure 2: Regional share of global milk production in 2005, 2010 and 2015
25%
Western Europe
Share of global cattle milk production (2015)
20%
North America
15%
CSA South Asia
10%
East Asia
WANA
Eastern Europe
Oceania
5%
Russian Federation SSA
0%
0.0% 0.5% 1.0% 1.5% 2.0% 2.5% 3.0% 3.5% 4.0% 4.5% 5.0%
Annual growth rate in milk production (2005–2015)
Figure 3: Growth in milk production by region in 2005-2015Sources of productivity • Regions where milk yield expanded faster than
the increase in milking cows:
growth
In some regions, the surge in milk production has
In the dairy industry, productivity is often considered been driven more by the increase in individual cow
in terms of milk production relative to a single factor. milk yield than the increase in milking animals.
Commonly used measures include milk production • South Asia: increase in yield of 3.6 percent p.a.
per cow per year (yield), or feed conversion efficiency and an increase in milking cows of 1.5 percent
(milk produced relative to herd feed consumption). p.a.
While productivity growth has occurred in all • Eastern Europe: increase in yield of 2.5 percent
regions (Figure 4), this outcome has been achieved in p.a. and an increase in milking cows of 0.6
different ways. percent p.a.
• Central and South America: increase in yield of
The growth in milk production over the decade 1.6 percent p.a. and an increase in milking cows
(2005-2015) has been achieved either through higher of 0.8 percent p.a.
yield growth per milking cow, increased number of • Western Europe and North America: milk yield
milking cows or combination of both. Between 2005 grew at 1.0 percent p.a. over the decade, while the
and 2015, the global dairy herd7 increased 11 percent number of milking cows increased at 0.3 and 0.4
driven mainly by East Asia, SSA, South Asia and CSA percent p.a., respectively.
where the dairy herd grew by 31, 25, 11 and 10 percent,
respectively. In 2015, dairy animals in these four • Regions where the increase in milking animals
regions accounted for 76 percent of the global dairy expanded faster than milk yield:
cattle herd. A stagnant trend in the dairy herd was In East Asia and Oceania and Sub-Saharan Africa
observed for Western Europe (+0.1 percent) during much of the gain in productivity growth has been
this period. associated with an increasing number of milking
cows.
During 2005-2015, growth in regional milk production • Oceania: increase in milking cows of 1.5 percent
has been achieved through the following trends p.a. and a yield increase of 0.9 percent p.a.
(Figure 5): • East Asia: increase in milking cows of 2.2 percent
p.a. and a zero annual growth in milk yield.
18
18 • Regions with shrinking herds (combined
• SSA: increase in milking cows of 3.8 percent p.a.
reduction in milking animals and dairy herd) and
and a slight decrease in yield of 2.5 percent p.a.
increases in milk yield:
Over the 2005-2015 period, a reduction in the dairy These differences in productivity growth rates by
herd was recorded for WANA (-1.4 percent), and region reflect changes in regional industry structure,
Russian Federation (-11.4 percent). At the same the extent of uptake of new technologies among farms
time, the number of milking cows also decreased within a region, and the unique characteristics of
in the Russian Federation (-2.5 percent), and WANA each region that affect the types of dairy farming
(-4.6 percent). Despite a shrinking number of systems.
milking cows and dairy herd, the net effect of the
changes in these regions was a significant growth of
total milk production, driven largely by changes in
milk yield.
• WANA: increase in milk yield of 4 percent p.a. and
a decrease in milking cows of 0.5 percent p.a.
• Russia Federation: increase in yield of
3.3 percent p.a. and a decrease in milking cows
of 0.2 percent p.a.
7 The dairy herd includes milking cows and replacement stock.2005 2010 2015
12,000
Average Milk Yield - kg per cow per year
10,000
8,000
6,000
4,000
2,000
0
Central & South East Asia Eastern Europe North America Oceania Russian South Asia Sub-Saharan We st Asia & N. We stern Europe
America Federation Africa Africa
Figure 4: Trends in milk yield by region in 2005, 2010 and 2015
5
Annual rate of change in milking cows (2005-2015)
SSA, 3.6%
4
East Asia, 3.3%
3 Oceania, 3.8% South Asia, 4.0%
CSA, 2.9%
2 19
19
Eastern Europe, 3.2%
1
North America, 1.6%
0
-1 0 1 2 3 4 5
Western Europe, 1.5%
-1 Russian Federation, 2.3%
-2
WANA, 4.5%
Annual rate of change in milk yield (2005-2015)
Figure 5: Annual rates of change in milking cows and milk yields (2005-2015, % p.a.)
Note: Size of bubble represents annual growth rate milk production 2005-20154. Trends in emissions from
the dairy cattle sector
Dairy farming is becoming more efficient as a result emissions per unit of product are falling.
The emission intensity of milk has declined by about 1 percent per year since 2005. However, this
reduction in emission intensity has been more than offset by the increased overall growth in milk
output. As a result, absolute emissions are above the 2005 levels.
Dairy production systems are complex sources of Without gains in productivity (and assuming
20
20 greenhouse gas (GHG) emissions, notably of methane production grew at the same rate), to deliver the
(CH₄), nitrous oxide (N₂O) and carbon dioxide (CO₂). same amount of product, total emissions would have
Using a global life cycle assessment approach, in 2015 increased by approximately 38 percent rather than
the sector is estimated to have emitted 1,711.8 million 18 percent between 2005 and 2015. As presented in the
tonnes of CO₂ equivalent (CO₂-eq.) (Figure 6). previous section, these changes in overall production
and efficiency have not occurred homogeneously
Total emissions have increased, by about 18 percent across the regions.
in 2015 relative to 2005 levels, because overall
production has grown substantially in response to
international demand. In 2015, emissions increased
by 256 million tonnes CO₂ eq. (18 percent) above
2005 levels. Of this, 169 and 52 million tonnes CO₂
eq. are related to increase in CH₄ and N₂O emissions,
respectively. This is not surprising when one considers
the increase in cow numbers and average milk yield
growth over the same period. The increased livestock
productivity (milk yield per head) achieved since
2005 results in increased individual cow feed intake
to meet higher energy demands which in turn results
in higher emission rates per cow and increased CH₄
(Table 1) and N₂O emissions per animal.©FAO/Vasily Maximov
1,800 1,711.8
1,600 1,571.9
1,455.8
1,400
Million metric tonnes CO2 eq.
1,200
1,000 CO2
N 2O
800
CH4 21
600
400
200
0
2005 2010 2015
Figure 6: Absolute emissions from dairy cattle sector in 2005, 2010 and 2015 (million metric tonnes, CO₂ eq.)
Average milk yield
kg of CH4 per animal per year
(kg per animal/year)
Region
2005 2015 2005 2015
North America 111.0 116.6 8,899 9,867
Russian Federation 64.2 71.8 3,000 4,146
Western Europe 76.3 80.9 6,287 6,957
Eastern Europe 71.2 81.7 3,921 5,005
West Asia & Northern Africa 68.2 72.8 1,240 1,830
East Asia 69.5 69.1 2,915 2,907
Oceania 72.3 81.4 4,274 4,659
South Asia 60.8 62.1 979 1,388
Central & South America 82.2 84.6 1,668 1,947
Sub-Saharan Africa 46.1 46.4 464 457
Table 1: Enteric methane emissions per animal and milk yieldWhere do the emissions in industrial processes e.g. mineral fertilizer and feed
production and in transport and processing of dairy
come from?
products.
Dairy farms are a source of GHG emissions, mainly
Figure 7 shows the percentage contribution that each
from enteric fermentation (methane) and manure
source of emissions makes to the overall emissions
management (methane and nitrous oxide) and feed
calculated for 2005 through to 2015. The largest three
production, transport and processing (carbon dioxide
22
22 contributing sources account for the bulk of total
and nitrous oxide). Methane is produced as a by-
emissions from milk production in 2015 and their
product of the digestive process in animals through
individual contributions are as follows:
a microbial fermentation process. The quantity of
• Methane from enteric fermentation emissions (58.5
methane emissions from enteric fermentation is
percent of total emissions).
determined by the animal’s digestive system, diet
• Emissions (CO₂ and N₂O) from feed production,
and management practices. Livestock manure
processing and transport (29.4 percent).
management produces both CH₄ and N₂O emissions.
• Emissions (CH₄ and N₂O) from manure
Methane is produced when manure decomposes
management (9.5 percent).
under anaerobic conditions. The quantity of manure
CH₄ emissions is determined by the type of treatment
These same sources contributed the bulk of emissions
or storage facility, the ambient climate and the
in 2005.
composition of the manure.
Since enteric fermentation contributes more than half
Nitrous oxide on dairy farms also comes from
the total of emissions, this area represents a potential
nitrogen inputs mostly dung, urine, and nitrogen
opportunity for mitigation. Emissions associated
based fertilizers. N₂O is 298 times more potent than
with feed production point to a potentially applicable
CO₂. A large contribution to N₂O emissions is the
strategy for reducing GHG emission intensity of milk,
excess dietary nitrogen that is excreted in manure
i.e. improving feed conversion efficiency defined
and urine. Emissions from fertilizer application occur
as the amount of feed input for producing a given
when nitrogen applied is converted to N₂O either
quantity of milk. Improving feed conversion is an
directly through the process of nitrification and
attractive strategy that will not only contribute to
denitrification, or indirectly via ammonia gas which is
reducing emission intensity but also improving farm
redeposited on to soil and leached.
profitability given that feed costs form a large share of
overall farm costs.
Carbon dioxide is emitted when various types of fossil
fuels are combusted for energy purposes. Energy is
used in various processes/activities on the farm e.g.
milking, grain drying and field operations, as well as©FAO/Giulio Napolitano
Figure 7: Sources of emissions from 2005
the global dairy cattle systems Direct energy and
indirect, CO2
in 2005 and 2015 Manure 2.1%
management, N2O Feed, CO2
4.5% 8.6%
Manure
management, CH4
LEGEND: 5.4%
Feed, N2O
LUC, emissions from the expansion of
20.8% 23
23
cropland for feed production;
Feed CO₂, emissions from the production,
processing and transport of feed;
Feed N₂O: direct and indirect emissions LUC: soy & palm,
CO2
from fertilizer application, applied and Enteric fermentation, 1.3%
deposited manure, and decomposition of CH4
57.3%
crop residues;
Direct energy CO₂, emissions from energy
use on-farm (milking, heating, ventilation
2015
etc.);
Direct energy
Indirect energy CO₂, emissions related to Manure management, and indirect,
N 2O CO2
the construction of on-farm buildings and 4.5% 2.3%
machinery; Feed, CO2
Manure 8.9%
Manure management, CH₄ and N₂O
management, CH4
emissions from manure storage and 4.8%
processing.
Feed, N2O
20.0%
LUC: soy &
palm, CO2
Enteric 1.0%
fermentation, CH4
58.5%© sara_winter - stock.adobe.com
Gains in productivity can The global trend of declining emission intensities
is also reflected at regional level (Figure 10).
continue to limit the rise
Emissions intensities have declined for all regions
in emission intensity reflecting continued improvements to on-farm
efficiency achieved via improved individual animal
The analysis shows that between 2005 and 2015,
productivity. There is however a distinct difference
emission intensity of milk has decreased from 2.8 to
in emission intensities between regions: generally,
24 2.5 kg CO₂ eq. per kg FPCM, an 11 percent decrease
24 emission intensities of milk production is lowest
over the ten-year period (Figure 8).
in more developed dairy regions (below the global
Emissions per unit of product have decreased, average) while regions like South Asia, SSA and WANA
because production has become more efficient. have higher emission intensities (ranging between
Improved animal genetics and management, 4.1 to 6.7 kg CO₂ eq. per kg FPCM in 2015).
combined with better grassland management and
feeding practices mean that farmers are adapting
3.00
resources more efficiently to increase their outputs. 2.8
For example, the analysis shows that more of the feed 2.7
consumed by animals is used for production than 2.5
2.50
for animal maintenance; higher milk production
(largely driven by increasing milk yields per
cow) has contributed towards lowering emission
2.00
intensities. Higher milk yields imply a shift of the
cow’s metabolism in favor of milk production and
Kg CO2 eq./Kg FPCM
reproduction rather than maintenance, contributing
1.50
to lower emission intensities. A high-producing
dairy cow requires more nutrients per day than a low
producing dairy cow; the cow with a daily milk output
1.00
of 14 kg milk/day uses 47 percent of consumed energy
for maintenance whereas a low producing cow (1.4
kg milk/day) uses 75 percent of energy intake for the
0.50
maintenance. Figure 9 illustrates the percentage of
dietary intake required to meet maintenance energy
requirements in milking cows given an average 0.00
regional milk yield. 2005 2010 2015
Figure 8: Average emission intensity of milk in 2005,
2010 and 2015150 10,000
9,000
Kg milk per cow per year (2005)
125
MJ per animal per day (2005)
8,000
7,000
100
6,000
75 5,000
4,000
50
3,000
42% 2,000
25 44%
56% 53% 56% 45% 66%
66% 69% 73% 1,000
0 0
North Russian Western Eastern West Asia & East Asia Oceania South Asia Central & Sub-Saharan
America Federation Europe Europe Northern South Africa
Africa America
Maintenance Milk production Activity Reproduction Milk yield
150 11,000
10,000
Kg milk per cow per year (2015)
125 9,000
8,000
MJ per animal per day (2015)
100
7,000
6,000
75
5,000
4,000
50
3,000
25 39% 42%
2,000 25
25
50% 47% 43% 63%
62% 53% 65% 75% 1,000
0 0
North Russian Western Eastern West Asia & East Asia Oceania South Asia Central & Sub-Saharan
America Federation Europe Europe Northern South Africa
Africa America
Maintenance Milk production Activity Reproduction Milk yield
Figure 9: Distribution of feed energy use of milking cows (2005 and 2015)
Note: As a cow eats more and produces more milk, her total energy use, especially milk energy output, increases and the energy
needed for maintenance is diluted. This “dilution of maintenance” is the primary reason that efficiency of nutrient use has
increased in the dairy industry.
8.0
7.17
6.81
6.67
7.0
6.0
5.19
Kg CO2 eq. per kg FPCM
5.07
5.02
4.75
5.0
4.41
4.10
3.94
4.0
3.41
3.36
2.58
2.56
3.0
2.43
1.70
1.67
1.65
1.61
1.56
1.54
1.50
1.48
1.49
1.47
2.0
1.39
1.37
1.34
1.31
1.29
1.0
0.0
SSA WA NA South Asia CSA East Asia Russian Fed. Oceania E. Europe N. America W. E urope
2005 2010 2015
Figure 10: Trends in emission intensity of milk by region (2005, 2010 and 2015)© SGr - stock.adobe.com
Within each region, there is a wide variation in systems with milk yield above 5,000 kg milk per cow
emission intensity which is closely related to diversity per year. The inflection point for this relationship
in the production and management practices is approximately 1,200 kg FPCM per cow per year;
(Figure 11). The highest variability in emission this is the milk yield that should be the minimum
intensity is observed in the low-and-middle income performance targeted for sector-wide maximum
regions. The existence of a wide variability suggests reduction of intensity globally.
that opportunities exist for reductions in GHG
26
26 intensity of milk through the adoption of practices The largest reduction potential for increased milk
associated improvements in efficiency. yield is therefore in systems that yield below 2000 kg
FPCM per cow per year. In an extreme case of a very
highly productive animal, where almost all emissions
Trends in efficiency gains arise from the production of milk and animal
in milk production and maintenance becomes negligible, further increasing
emission intensity the amount of production per animal will result
in only minor additional reductions in emissions
The dairy sector has seen a continued increase in intensity.
productivity and reductions in emissions intensities
driven by efficiency gains in production. These
changes are the cumulative benefits resulting from
improvements in nutrition, genetics, reproductive
performance, disease control, and improved
fertilizer practices and enhanced management at
herd and animal level. Figure 12 illustrates how
the emission intensity of milk follows a non-linear
trend: as milk production increases, the contribution
of maintenance emissions decreases relative to
production-related emissions. The figure also shows
a downward shift of the curve in 2015 which is a
reflection of further efficiency gains and lowering
of emission intensities. Most of these gains have
been achieved in low productivity countries as
demonstrated by the gap between the two curves
(Figure 13). Gains in saved GHG emissions through
increased milk yield is marginal for milk production20 Figure 11. Box plots of the
2005 2015
18 emission intensity of milk
(kg of CO₂-equivalent/kg of
16
FPCM)
14
Note: The shaded area
kg CO2 eq. per kg FPCM
12 represents 90% of the
distribution of the emission
10
intensity of milk within each
8
region
6
4
2
0
OECD countries Central & East Asia South Asia Sub-Saharan West Asia &
South America Africa N. Africa
2005 2015
25
20
y = 509.56x 0.677 y = 438.06x 0.663
kg CO2eq. per kg FPCM
R = 0.9081 R = 0.9198
15 - -
10
5 27
27
0
0 750 1,500 2,250 3,000 3,750 4,500 5,250 6,000 6,750 7,500 8,250 9,000 9,750 10,500 11,250
kg FPCM per cow year
Figure 12: Emission intensity and milk yield
Note: Each dot represents a country. The fitted line clearly indicates an inverse relationship between milk yield per cow and
emission intensity, i.e. as milk yield increases there is more milk to spread the emissions over.
2005 2015
16
14
12
kg CO2eq. per kg FPCM
10 R = 0.8532 R = 0.8865
8
6
4
2
0
0 500 1,000 1,500 2,000 2,500 3,000 3,500 4,000 4,500
kg FPCM per cow year
Figure 13: Emission intensity and milk yield (for milk yield levels lower than 4500 kg of milk per cow per year)
Note: Each dot represents a country.5. How can the dairy sector
play its part?
The dairy sector is already part of the solution to address climate change. However, the sector
needs to accelerate its current efforts by: 1) Continuing to improve production efficiency,
the sector will also continue to reduce emission intensity of milk. To achieve this, the sector
needs to urgently act to realize the existing potentials for GHG emission reduction through
technological and farm best practices interventions and solutions; 2) Fostering changes in
production practices that protect carbon sinks (grasslands and forest) by targeting drivers
28
28 linked to degradation of natural ecosystems, agricultural expansion and deforestation;
and 3) Reducing its demand for resources by better integrating livestock into the circular
bio-economy. This can be achieved by recycling and recovering nutrients and energy from
animal waste, or closer integration of livestock with crops and agro-industries at various scales
to make use of low value and low-emission biomass.
While there has been a general trend in emission that have been achieved in narrowing the emission
intensity reductions across the regions, reductions in intensity gap between 2005 and 2015 for two regions.
emission intensity have not translated into reductions The figures show that narrowing the gap between
in absolute emissions. With the exception of the North producers will lower the average emission intensity by
America, where emission intensity decreased 2.2 bringing the emission intensity of the majority closer
percent p.a. while milk production increased by 2.1 to the most efficient. In this context, the dairy sector
percent since 2005 and absolute emissions decreased can positively address climate change in a number
by 5 percent. The other regions all recorded increases of ways. This includes reducing emissions through
in absolute emissions (Figure 14). For reductions in the adoption of cost effective mitigation measures.
absolute emissions to occur, the rate at which milk However, the mitigation potential of agriculture and
production increases has to be lower than the rate food production is challenging compared to other
at which emission intensity decreases. Increasing economic sectors. This is because emissions from the
animal productivity usually increases emissions per agri-food sector stem from biological processes.
cow (due to higher feed intake), thus reductions are
only achieved if product output is capped. A particular challenge in the transfer of technologies
and best practices to farmers is the diversity of the
Earlier sections have described the high variability production systems, as well as the diversity of the
in emission intensity at global and regional level, physical environments in which farmers operate
highlighting a wide gap between producers. This – exemplified by the wide distribution in emission
gap provides room to mitigate emissions within intensity observed.
existing systems. Figure 15 a and b illustrate the gains©FAO/J. Thompson
0 0.5 1 1.5 2 2.5 3 3.5 4 4.5 5
0
East Asia, 30%
-0.5
Rate of change in emission intensity p.a (2005-2015)
Sub-Saharan Africa , 33%
Western Europe , 7%
-1
West Asia & Northern Africa ,
32%
Central & South America , 14%
29
29
-1.5
Russian Federation , 3%
-2
Eastern Europe, 11% South Asia , 20%
North America , -5%
-2.5
Oceania , 16%
-3
Annual rate of change in milk production (2005-2015)
Figure 14: Trends in emission intensity and production by region (%)
Note: Size of bubble represents the percentage change in absolute emissions (2005-2015).
Eastern Europe South Asia
2005 2015 2005 2015
0.25
2.0
0.20
1.5
Frequency
Frequency
0.15
1.0
0.10
0.5
0.05
0.0 0.00
1.0 1.5 2.0 2.5 0 2 4 6 8 10
Emission intensity (kg CO2 eq./kg FPCM) Emission intensity (kg CO2 eq./kg FPCM)
Figure 15 (a, b): Illustration of emission intensity gap in 2005 and 2015 for Eastern Europe and South AsiaBox 1
Options for reducing GHG
emissions from the dairy sector
The mitigation options outlined below are consistent with improving the
efficiency and profitability of the dairy farm. Enhancing animal productivity has
several dimensions including feeding, reproduction, health, genetics and overall
management of the animal operation. In many parts of the world, particularly in
low-and-middle income regions, the single most effective GHG mitigation strategy
is to increase animal productivity. Adopting these practices and technologies could
significantly reduce the emission intensity of milk.
Feed and feeding • Use commercial fertilizer produced in
management an environmentally friendly way with a
low carbon footprint.
• Increase feed efficiency by optimizing
the energy and protein content in • Spread fertilizer at the optimum time
feed. and with the best technology.
• Use of precision feeding techniques
to match animal requirements with Energy use at the farm
dietary nutrient supply. • Reduce fossil fuel energy use (e.g.
• Use more locally produced feed and electricity and diesel).
source low-emissions feeds such as • Increase the use of sustainable energy,
by-products. e.g. wind energy and biofuel to replace
• Store more carbon in the soil fossil energy sources.
30
30 by means of better grassland
management. Animal health and
husbandry
Manure management
• Management of herd structures to
• Improve manure collection, storage reduce the number of non-productive
and utilization. animals through improved animal
• By using cow manure in biogas and herd fertility and reproduction
systems it is possible to: reduce is an effective approach to reduce
emissions of GHGs associated with emissions per unit of milk and increase
the storage of manure; improve the dairy profitability.
quality of fertilizer and replace fossil • Reducing the prevalence of diseases
energy sources and parasites would generally reduce
• A switch from raw to composted emissions intensity as healthier
© SGr - stock.adobe.com
manures can greatly reduce emissions. animals are more productive, and thus
produce lower emissions per unit of
output.
Fertilizer management
(manure and commercial • Improving the genetic potential
fertilizer) of animals through planned cross-
breeding or selection within breeds,
• Optimize consumption relative and achieving this genetic potential
to need. through proper nutrition.
• Lower manure application rates and
the incorporation of manure into
soils can reduce emissions while
maintaining farm productivity.You can also read