TPI State of Transition Report 2019 - Simon Dietz, Rhoda Byrne, Dan Gardiner, Valentin Jahn, Michal Nachmany, Jolien Noels and Rory Sullivan - LSE
←
→
Page content transcription
If your browser does not render page correctly, please read the page content below
TPI State of Transition
Report 2019

Simon Dietz, Rhoda Byrne, Dan Gardiner,
Valentin Jahn, Michal Nachmany,
Jolien Noels and Rory Sullivan

The Transition
Pathway Initiative
The Transition Pathway Initiative (TPI) is a
                                                            Disclaimer
global initiative led by asset owners and supported
                                                            1. All information contained in this report and on the TPI
by asset managers, established in January 2017.             website is derived from publicly available sources and is
Aimed at investors, it assesses companies’ progress         for general information use only. Information can change
on the transition to a low-carbon economy,                  without notice and The Transition Pathway Initiative does
                                                            not guarantee the accuracy of information on the website,
supporting efforts to address climate change. Over          including information provided by third parties, at any
45 investors globally have already pledged support          particular time.
for the TPI; jointly they represent over US$14 trillion     2. Neither this report nor the TPI website provides investment
combined Assets Under Management and Advice.                advice and nothing in the report or on the site should be
                                                            construed as being personalised investment advice for your
Using companies’ publicly disclosed data, TPI:              particular circumstances. Neither this report nor the website
• Assesses the quality of companies’ management           takes account of individual investment objectives or the
                                                            financial position or specific needs of individual users. You must
   of their carbon emissions and of risks and               not rely on this report or the website to make a financial or
   opportunities related to the low-carbon                  investment decision. Before making any financial or investment
   transition, in line with the recommendations             decisions, we recommend you consult a financial planner
                                                            to take into account your personal investment objectives,
   of the Task Force on Climate-related Financial           financial situation and individual needs.
   Disclosures (TCFD).                                      3. This report and the TPI website contain information
                                                            derived from publicly available third party websites. It is the
• Assesses how companies’ planned or expected             responsibility of these respective third parties to ensure this
   future Carbon Performance compares with                  information is reliable and accurate. The Transition Pathway
   international targets and national pledges               Initiative does not warrant or represent that the data or other
                                                            information provided in this report or on the TPI website is
   made as part of the 2015 Paris Agreement on              accurate, complete or up-to-date, and make no warranties or
   climate change.                                          representations as to the quality or availability of this data or
                                                            other information.
• Publishes the results via an open-access
                                                            4. The Transition Pathway Initiative is not obliged to update or
   online tool:                                             keep up-to-date the information that is made available in this
   www.transitionpathwayinitiative.org.                     report or on the TPI website.
                                                            5. If you are a company referenced in this report or on the
TPI partners                                                TPI website and would like further information about the
                                                            methodology used in our publications, or have any concerns
The Grantham Research Institute on Climate                  about published information, then please contact us. An
Change and the Environment at the London School             overview of the methodology used is available on the TPI
                                                            website.
of Economics and Political Science (LSE) is TPI’s
                                                            6. Please read the Terms and Conditions which apply to use of
academic partner. It has developed the assessment           the TPI website.
framework, provides company assessments, and                For the avoidance of doubt, clause 3.3 of the LSE Terms and
hosts the online tool. FTSE Russell is TPI’s data           Conditions shall be varied and replaced by the following clause:
partner. FTSE Russell is a leading global provider          3.3. You may download information from the Website for
of benchmarking, analytics solutions and indices.           personal or commercial use. In the event of any copying,
                                                            redistribution or publication of copyright material, no changes
The Principles for Responsible Investment (PRI)             in or deletion of author attribution, trademark legend or
provides a secretariat to TPI. PRI is an international      copyright notice shall be made. You acknowledge that you do
network of investors implementing the six Principles        not acquire any ownership rights by downloading copyright
                                                            material.
for Responsible Investment.

Research funding partners

We would like to thank our research funding partners for their ongoing support to TPI and for enabling
the research behind this report and its publication.

This report was first published in July 2019. Published under a Creative Commons CC BY licence.
Editing, design and production by Georgina Kyriacou.
Foreword                                                            Contents
                                                                    Summary                       3

                                                                    1. Introduction                7

                                                                    2. State of Transition 2019   9

                                                                    Management Quality level 10

Adam C.T. Matthews and Faith Ward, Co-chairs,                       Management Quality:           12
Transition Pathway Initiative (TPI)                                 indicator by indicator

                                                                    Trends in Management          14
Following last year’s Special Report on Global Warming of 1.5
degrees from the Intergovernmental Panel on Climate Change,
                                                                    Quality
which warned we have only 12 years left to avoid catastrophic
climate change, a climate emergency has been declared by            Carbon Performance:           16
more than 600 jurisdictions in 13 countries.1 Social, political     alignment with the Paris
and shareholder pressure is mounting for the corporate sector       Agreement benchmarks
to align its activities with the Paris Agreement’s ambitions to
make greenhouse gas emissions ‘net-zero’ – that is, balancing
emissions with removal – by 2050.2                                  Does Management               18
                                                                    Quality predict Carbon
But what is the progress of the corporate sector to date? How
far is there to go?                                                 Performance?
These are the questions that this State of Transition Report
from the Transition Pathway Initiative (TPI) seeks to answer.       3. Sector focus
The report spotlights the actions, and inactions, of the most       Airlines                      20
carbon-intensive companies in public markets.
                                                                    Oil and gas                   22
Signs of progress
The report shows that 30 per cent of the companies assessed         4. Implications for         25
are, or will be, aligned with the Paris Pledges benchmark in           investors
2030 – that is, 30 per cent have strategies consistent with the
emissions reductions pledged by Paris Agreement signatories
in the form of ‘Nationally Determined Contributions’. This          References                    28
demonstrates that progress is being made, although those
pledges alone are widely recognised as insufficient for putting     Appendix:                     29
the world on track to meet the overall Paris Agreement target       TPI Management
of keeping temperature rise well below 2°C above pre-industrial
                                                                    Quality indicators
levels and to pursue efforts to limit it to 1.5°C by the end of
this century.
The report also clearly demonstrates that there can be huge
differences within sectors in how companies are responding
to the climate challenge. The emergence of clear leaders and
laggards in each sector makes this an investment-relevant
discussion for the global investors who must inject the trillions
of dollars required for the transition to a low-carbon economy.
TPI STATE OF TRANSITION REPORT 2019

       A tool to equip investors                             and enabled TPI, in collaboration with the
       This report offers a significant new tool in TPI’s    London School of Economics, to create peer
       mission to empower and equip investors to             comparisons and sector benchmarks for the oil
       navigate the complexities of the transition to a      and gas sector. TPI was also referenced within
       low-carbon economy.                                   the Joint Statement between Shell and Climate
                                                             Action 100+ investors.
       Cutting through the noise, TPI distils
       what corporates have actually done, and               We continue to develop our capacity to assess
       what they have said they will do. Perhaps             the forward-looking carbon performance
       most importantly it analyses what carbon              of mining and other high-emitting sectors.
       performance outcome current corporate action          TPI’s Management Quality and Carbon
       leads to, and how sector peers compare.               Performance assessments are already used
                                                             by many investors to inform action, whether
       The large majority of assessed companies now          that be adjusting the long-term investment
       acknowledge climate change in their public            case, seeking to engage, creating investment
       disclosures. However, a small minority do not,        products or expressing dissatisfaction through
       and these tend to be ‘large cap’ companies in         the use of the vote at the next AGM.
       sectors significantly exposed to transition risk.
       There is a clear message for those companies          We know TPI can do more and indeed there
       from investors: it is not acceptable to be a          is demand for it to do so. We have developed
       listed company highly exposed to climate risk         a 2020–2025 Strategic Plan that will enable
       and to fail to provide this future business-          TPI to assess companies that together emit
       critical information to investors.                    around 80 per cent of the emissions from listed
                                                             markets, as well as looking to other investment
       Through our partnership with the Climate              areas such as sovereign bonds.
       Action 100+ investors’ initiative, TPI has directly
       supported asset owners and funds in their             We know that companies can do more too.
       engagements with companies to help them               As this report sets out, the transition to a
       meet the challenge of improving disclosure on         low-carbon economy in the private sector is
       climate. One example is the ground-breaking           happening, but we remain a long way from
       announcement by Royal Dutch Shell in 2018             where we need to be. TPI is committed to
       that not only will it set long-term emissions         play the role it can in bringing to the fore the
       reduction targets, including Scope 3 emissions        academic insight of LSE’s Grantham Research
       (indirect emissions in the value chain), but          Institute together with FTSE Russell’s data to
       also that it will link these to executive pay for     equip asset owners to better inform decision-
       over a thousand employees. Shell’s disclosures,       making and corresponding action.
       alongside those of Total, have completely
       shifted the debate in the oil and gas sector          July 2019

       “Cutting through the noise, TPI distils
       what corporates have actually done,
       and what they have said they will do”

2
Summary
This report by the Transition Pathway Initiative                                           TPI publishes the results of its analysis through
(TPI) assesses the state of transition of the                                              an open access online tool, available at:
world’s largest and highest-emitting public                                                www.transitionpathwayinitiative.org.
companies towards a low-carbon economy.
                                                                                           This report synthesises those results to date.
To do this, we have analysed TPI’s database
of corporate climate action in its entirety.
                                                                                           Most companies have built
Currently this comprises 274 companies in 14
sectors of the economy, accounting for around                                              basic capacity to manage the
41 per cent of emissions from the universe of                                              low-carbon transition
publicly listed companies worldwide.                                                       As Figure S1 shows, only nine out of the 274
                                                                                           companies assessed on Management Quality
TPI’s assessment is divided into two parts:
                                                                                           (3 per cent) are unaware of (or are not
1. M
    anagement Quality covers companies’                                                   acknowledging) climate change as a business
   management/governance of greenhouse                                                     issue (TPI Level 0), and we expect at least some
   gas emissions and the risks and                                                         of these to move off the bottom step of the
   opportunities arising from the low-carbon                                               staircase this year.
   transition.
                                                                                           This means that the vast majority of companies
2. C
    arbon Performance involves quantitative                                               now at least acknowledge climate change as a
   benchmarking of companies’ emissions                                                    business issue (TPI Level 1 and above).
   pathways against the international targets
                                                                                           Further, the majority of companies are now
   and national pledges made as part of
                                                                                           integrating climate change into operational
   the 2015 UN Paris Agreement on climate
                                                                                           decision-making (Level 3) or, as well as this,
   change, for example limiting global warming
                                                                                           making strategic assessment of climate
   to below 2°C.
                                                                                           change risk (Level 4). The average company is
The framework is aligned with the                                                          positioned roughly halfway between building
recommendations of the Financial Stability                                                 capacity on climate change (Level 2), and
Board’s Taskforce on Climate-related Financial                                             Level 3. Thirty-five of the 130 companies (27
Disclosures (TCFD), tracking companies in                                                  per cent) that were assessed more than once
relation to TCFD’s four recommendation areas:                                              on Management Quality moved up at least one
governance, strategy, risk management, and                                                 level between 2017 and 2018.
metrics and targets.

Figure S1. Management Quality level of all TPI companies
Level 0                               Level 1                                Level 2                                Level 3                                Level 4
Unaware                               Awareness                              Building capacity                      Integrated into                        Strategic assessment
                                                                                                                    operational
                                                                                                                    decision-making                        77 companies: 28%
                                                                                                                                                           25 Manufacturing and basic materials
                                                                                                                                                           34 Energy (including eight 4*)
                                                                                                                                                           9 Transport
                                                                                                                    71 companies: 26%                      9 Consumer goods and services
                                                                                                                    26 Manufacturing and basic materials
                                                                                                                    25 Energy
                                                                                                                    15 Transport
                                                                             57 companies: 21%                      5 Consumer goods and services

                                                                             17 Manufacturing and basic materials
                                                                             35 Energy
                                                                             5 Transport
                                      60 companies: 22%                      0 Consumer goods and services
                                      29 Manufacturing and basic materials
                                      21 Energy
                                      9 Transport
9 companies: 3%                       1   Consumer goods and services
5 Manufacturing and basic materials
1 Energy
3 Transport
0 Consumer goods and services

                                                                                                                                                                                             3
TPI STATE OF TRANSITION REPORT 2019

       Too many big emitters are yet to                    that investors cannot assess whether or not
       integrate climate change into                       such companies are aligned with the goals of
       their operations, let alone take a                  the Paris Agreement.
       strategic approach
                                                           Few companies are aligned with the
       In spite of this progress, no fewer than
                                                           Paris Agreement but the leaders show
       126 companies remain on Levels 0–2. Such
       companies are yet to disclose that they have        what is possible
       implemented at least one of the following basic     Figure S2 shows the results of our assessment
       practices:                                          of 160 of the 274 companies in the TPI
                                                           database on Carbon Performance. Only 30
       • Explicitly recognising climate change as a       per cent of these 160 companies are, or will
         relevant business risk or opportunity             be, aligned with the Paris Pledges benchmark
       • Having a policy commitment to act on             in 2030 – the benchmark that reflects the
         climate change                                    emissions reductions pledged in the Nationally
                                                           Determined Contributions (NDCs) offered by
       • Disclosing operational emissions
                                                           countries as part of the Paris Agreement. These
       • Setting a quantitative (or, if not, a            NDCs are widely regarded as insufficient to
         qualitative) target to reduce emissions           limit global warming to 2°C or below.
       These limitations are confirmed when we look        Just 16 per cent of companies will be aligned
       into the specifics of company performance           with the 2°C benchmark in 2030 and, when
       against the TCFD requirements. For example:         the benchmark is tightened to keeping
                                                           temperature rise below 2°C, the share of
       • On strategy, 84 per cent of companies do
                                                           companies aligned falls to 13 per cent.
         not disclose an internal carbon price, and 86
                                                           Nonetheless, the 20 companies that are
         per cent are yet to undertake and disclose
                                                           aligned with below 2°C, or that will be on the
         climate scenario planning.
                                                           basis of the emissions reduction targets they
       • On metrics and targets, 55 per cent of           have set, show what is possible.
         companies do not have a long-term,
         quantified target to reduce their emissions,      Management Quality and Carbon
         and 58 per cent of companies in the autos,        Performance are correlated, but
         coal, and oil and gas sectors fail to disclose
                                                           investors need to engage directly on
         their critical Scope 3 emissions (indirect
         emissions in the value chain) from use of
                                                           emissions targets
         sold products.                                    We find that companies doing well on
                                                           Management Quality are also likely to be doing
       These findings reinforce the need for               well on Carbon Performance. On average,
       investor engagement to encourage greater            companies that are aligned with the 2030 Paris
       climate disclosure.                                 Agreement benchmarks satisfy two-thirds
                                                           of our Management Quality indicators, while
       Significant disclosure gaps remain on               those that are not aligned satisfy less than half.
       corporate emissions
                                                           Comparing these results with previous research
       There is limited availability of emissions data     suggests that this positive association is
       and availability falls markedly as we look to the   particularly true for future Carbon Performance
       future. Seventy-one of the 274 companies in         as opposed to historical emissions.
       the TPI database (26 per cent) do not provide
       any emissions disclosures at all.                   Nonetheless, the correlation between
                                                           Management Quality and Carbon Performance
       About 20 per cent of the 160 companies              is far from perfect. Since what ultimately
       assessed on Carbon Performance do                   matters for the climate is emissions, it is
       not disclose their historical emissions or          extremely important that investors engage
       their activity in a form that enables us to         companies directly on their emissions and
       make meaningful assessments of Carbon               targets to reduce them. Management practices
       Performance, and this proportion rises steadily     then provide the means to deliver.
       to 80 per cent in 2030. These data gaps mean

4
Summary

Figure S2. Carbon Performance alignment with the Paris Agreement benchmarks (number and
percentage of companies)

                                20
                 33                                                 No disclosure
                               12%       6
                21%
                                        4%
                                                                    Not aligned
                                           22
                                          14%
                                                                    Paris

                                                                    2 Degrees
                       79
                      49%
                                                                    Below 2 Degrees

“The 20 companies that are aligned with
below 2°C, or that will be on the basis of the
emissions reduction targets they have set,
show what is possible”

                                                                                            5
6
1 Introduction
 This report surveys the progress that is being                      with more than US$14 trillion in Assets Under
 made by the world’s largest, highest emitting                       Management and Advice.
 public companies in the transition to a low-
                                                                     The TPI database currently covers 274
 carbon economy.
                                                                     corporations worldwide in 14 business sectors of
 The analysis draws on the entire database                           critical importance to climate change (see Table
 maintained by the Transition Pathway Initiative                     1.1). In total, we estimate that these companies
 (TPI), a global initiative led by asset owners                      account for 41 per cent of the global greenhouse
 and supported by asset managers, which                              gas emissions from publicly listed companies.a
 assesses the progress of large corporations
                                                                     In each sector, TPI selects the largest public
 on the transition to a low-carbon economy,
                                                                     companies globally, on the basis of market
 supporting efforts to address climate change.3
                                                                     capitalisation. These companies usually
 Established in January 2017, TPI is now
                                                                     constitute the largest holdings in investor
 supported by more than 45 investors globally

 Table 1.1. TPI sectoral coverage and Carbon Performance measures
  Sector                   No. of companies                  No. of companies              Carbon Performance
                           currently assessed on             currently assessed on         measure
                           Management Quality                Carbon Performance
  Oil and gas              45                                10*                           Carbon intensity of
                                                                                           primary energy supply
  Electricity utilities    46                                37                            Carbon intensity of
                                                                                           electricity generation
  Coal mining              19                                -                             -
  Automobiles              21                                21                            New vehicle carbon
                                                                                           emissions per kilometre
  Airlines                 20                                20                            Carbon emissions per
                                                                                           passenger kilometre
  Cement                   22                                22                            Carbon intensity of
                                                                                           cementitious product
  Steel                    23                                23                            Carbon intensity of crude
                                                                                           steel production
  Aluminium                12                                8                             Carbon intensity of
                                                                                           aluminium production
  Paper                    19                                19                            Carbon intensity of pulp,
                                                                                           paper and paperboard
                                                                                           production
  Oil and gas              6                                 -                             -
  distribution
  Services                 7                                 -                             -
  Consumer goods           9                                 -                             -
  Other basic              9                                 -                             -
  materials
  Other industrials        18                                -                             -
  Total                    274                               160
 *TPI published an assessment of oil and gas companies in November 2018.4 A wider assessment of the Carbon
 Performance of 50 oil and gas producers will be published later in summer 2019.

 a. Based on cross-referencing TPI and S&P Global – Trucost data.5

                                                                                                                       7
TPI STATE OF TRANSITION REPORT 2019
portfolios, as well as usually being the highest as ‘Yes’ on all Level 4 questions (and thus all
emitters of greenhouse gases. We also cover questions in the framework) are described as
a number of additional companies that ‘4* companies’. The data underpinning the
have been selected for engagement by the indicators are provided by FTSE Russell on the
Climate Action 100+ investors’ initiative.6 These basis of publicly available information.
additional companies are large within their
sector, often regional if not global, and have Carbon Performance
high lifecycle greenhouse gas emissions. TPI’s Carbon Performance assessment
The majority of the data presented in this translates emissions targets made at the
report are from 2017 and 2018. The whole TPI international level under the 2015 UN Paris
database will be updated during 2019. Agreement into benchmarks against which
the performance of individual companies can
Overview of methodologyb be compared. We take a sector-by-sector
approach, recognising that different sectors of
Using public disclosures, TPI assesses
the economy face different challenges arising
companies on their Management Quality
from the low-carbon transition, including
and Carbon Performance, two quite different
where emissions are concentrated in the value
elements of how companies are approaching
chain and how costly it is to reduce emissions.
the low-carbon transition. The former focuses
See Table 1.1 above for the Carbon Performance
on inputs and processes, the latter on
measures used in each sector we cover.
outcomes. The assessments are intended to
provide a holistic view of companies’ progress, We benchmark emissions in most sectors
both backward and forward-looking. against three scenarios, derived from
modelling by the International Energy Agency:
Management Quality • P
aris Pledges, consistent with the emissions
TPI’s Management Quality framework is reductions pledged by countries as part of
currently based on 17 indicators, each of the Paris Agreement in the form of Nationally
which tests if a company has implemented a Determined Contributions (NDCs).
particular carbon management practice (Yes/
No), such as formalising a policy commitment • 2 Degrees, consistent with the overall aim of
to action on climate change, disclosing the Paris Agreement to hold “the increase in
its emissions, or setting emissions targets. the global average temperature to well below
These 17 indicators (described in detail in the 2°C above pre-industrial levels and to pursue
Appendix) are then used to map companies efforts to limit the temperature increase to
on to five levels, shown in Box 1.1. Companies 1.5°C above pre-industrial levels”, albeit at
need to be assessed as ‘Yes’ on all of the the low end of the range of ambition.
questions pertaining to a level before they can • B
elow 2 Degrees, consistent with a more
advance to the next, with the exception of ambitious interpretation of the Paris
Level 0. Companies that have been assessed Agreement’s overall aim.
Box 1.1. TPI levels of Management Quality
• Level 0 – Unaware of (or not acknowledging) climate change as a business issue.
• Level 1 – Acknowledging climate change as a business issue: The company acknowledges
that climate change presents business risks and/or opportunities, and that the company
has a responsibility to manage its greenhouse gas emissions. This is the point at which
companies adopt a climate change policy.
• L evel 2 – Building capacity: The company develops its basic capacity, its management
systems and its processes, and starts to report on practice and performance.
• Level 3 – Integrating into operational decision-making: The company improves its
operational practices, assigns senior management or board responsibility for climate change
and provides comprehensive disclosures on its carbon practices and performance.
• Level 4 – Strategic assessment: The company develops a more strategic and holistic
understanding of risks and opportunities related to the low-carbon transition and integrates
this into its business strategy decisions.
b. Further details of our methodology can be found on the TPI website at www.transitionpathwayinitiative.org/methodology/
and in Carbon Performance methodology notes for each sector, available from the Publications menu on the website.
82 State of Transition 2019
In this section we summarise TPI’s findings on Management Quality and
Carbon Performance, based on company assessments since 2017.
For Management Quality, we outline the current state of affairs and
the trends emerging from companies’ practices in corporate climate
governance. We also map the different TPI indicators onto the main
themes in the TCFD recommendations.
On Carbon Performance, we evaluate companies’ alignment with the
Paris Agreement benchmarks.
Finally, we examine the relationship between the two assessment
metrics, asking if Management Quality scores can predict a company’s
Carbon Performance.
9TPI STATE OF TRANSITION REPORT 2019
Management Quality level
We begin by presenting the number of between building capacity on climate change
companies in the TPI database on each of (Level 2) and integrating it into operational
the five Management Quality levels (Figure decision-making (Level 3). More than half of all
2.1). The data are also broken down into four companies are now on either Level 3 or 4.
clusters of sectors (Figure 2.2):
Reaching Level 3 requires both disclosure of
• Consumer goods and services operational greenhouse gas emissions and
setting quantitative or qualitative emissions
• Energy (which comprises coal, electricity
reduction targets. Reaching Level 4 requires
utilities, oil and gas distribution, and oil and
the implementation of a variety of carbon
gas production)
management practices, including, among
• Manufacturing and other basic materials others, assigning board responsibility for
(aluminium, cement, paper, steel, other climate change, disclosing some Scope
basic materials, and other manufacturing) 3 emissions,c supporting domestic and
• Transport (airlines and autos) international climate policy, and setting
quantified emissions reduction targets.
Only nine out of the 274 companies assessed
(3 per cent) are on Level 0 and, based on High performance
an initial look at their latest disclosures, we
At present there are eight 4* companies:
expect at least some of these to move off the
that is, companies that satisfy all of the TPI
bottom step of the staircase this year. This
Management Quality criteria. These are all in
means that the vast majority of companies
the energy sector cluster – see Table 2.1.
now acknowledge climate change as a business
issue, meaning that they are at least on Level Companies in the consumer goods and
1. At a minimum, Level 1 companies explicitly services sectors perform particularly well
recognise climate change as a business risk or on Management Quality, with an average
opportunity, have a policy commitment to act level-score of 3.5, but this is a small sector
on climate change, disclose their operational comprised of very large companies selected for
greenhouse gas emissions, or have set an inclusion in the Climate Action 100+ initiative.
emissions reduction target. Two large sectors that perform relatively well
on Management Quality are electricity utilities,
The average level-score of all companies in
with an average level-score of 2.9, and autos,
the database is currently 2.5, putting the
with an average of 2.5.
average company assessed by TPI halfway
Table 2.1. List of 4* companies (satisfying all TPI Management Quality criteria)
Company TPI sector Country
AGL Energy Electricity Australia
Anglo American Coal mining (general mining) UK
BHP Billiton Coal mining (general mining) UK
Centrica Oil and gas distribution UK
Equinor Oil and gas Norway
Gas Natural Oil and gas distribution Spain
National Grid Electricity UK
Repsol Oil and gas Spain
c. Under the Greenhouse Gas Protocol, “Scope 1 emissions are direct emissions from owned or controlled sources. Scope 2 emissions
are indirect emissions from the generation of purchased energy. Scope 3 emissions are all indirect emissions (not included in scope
2) that occur in the value chain of the reporting company, including both upstream and downstream emissions.”7
10State of Transition 2019: Management Quality level
Figure 2.1. Management Quality level of all TPI companies
Level 0 Level 1 Level 2 Level 3 Level 4
Unaware Awareness Building capacity Integrated into Strategic assessment
operational
decision-making 77 companies: 28%
25 Manufacturing and basic materials
34 Energy (including eight 4*)
9 Transport
71 companies: 26% 9 Consumer goods and services
26 Manufacturing and basic materials
25 Energy
15 Transport
57 companies: 21% 5 Consumer goods and services
17 Manufacturing and basic materials
35 Energy
5 Transport
60 companies: 22% 0 Consumer goods and services
29 Manufacturing and basic materials
21 Energy
9 Transport
9 companies: 3% 1 Consumer goods and services
5 Manufacturing and basic materials
1 Energy
3 Transport
0 Consumer goods and services
Figure 2.2. Management Quality level by sector cluster
90%
80%
70%
60%
50%
40%
30%
20%
10%
0
Level 0 Level 1 Level 2 Level 3 Level 4 (incl. 4*)
Manufacturing and basic materials Energy Transport Consumer goods and services
Note: The data underpinning this assessment mostly date from 2018 and are not always reflective of the latest company disclosures.
The TPI database is updated once a year for each company.
Room for improvement Quality. The average level-score in the steel sector is
There remains much room for improvement. No fractionally below two, making it the only sector to
fewer than 126 companies remain on Levels 0–2. fall below this mark.
These companies are yet to implement at least one In fact, four out of the five worst-performing sectors
of the following four basic carbon management on Management Quality are in the manufacturing
practices: explicitly recognising climate change as a and other basic materials cluster. After steel, they
relevant business risk or opportunity; having a policy are, in order of increasing average Management
commitment to act on climate change; disclosing Quality: paper, cement and aluminium. Companies
operational emissions; having in place a target to in these sectors tend to be especially weak at
reduce emissions (even a qualitative target). acknowledging climate change as a business risk/
Beneath the aggregates, we see significant opportunity, at board oversight and responsibility,
differences at the sectoral level. Steel is currently and at incorporating environmental, social and
the worst performing TPI sector on Management governance factors into executive remuneration.
11TPI STATE OF TRANSITION REPORT 2019
Management Quality:
indicator by indicator
As well as analysing companies’ overall internal carbon price (16 per cent), and even
Management Quality, it is useful to break down fewer undertake and disclose climate scenario
the data indicator by indicator. Here we do this planning (only 14 per cent), one of the most
by organising the indicators according to the distinctive recommendations of the TCFD.
main themes in the TCFD recommendations:
About one-third of companies incorporate
1. G
overnance – “Companies’ governance climate change risks and opportunities in their
around climate-related risks and strategy, an indicator that is relevant for both
opportunities” the strategy and risk management TCFD areas.
On the other hand, two-thirds of companies
2. S
trategy – “The actual and potential
have a process to manage climate-related risks.
impacts of climate-related risks and
opportunities on the organization’s
businesses, strategy, and financial planning” Metrics and targets
Emissions measurement and targeting is
3. R
isk management – “The processes used relatively widespread among TPI companies.
by the organization to identify, assess, and About three-quarters of companies publish
manage climate-related risks” information on their operational greenhouse
4. Metrics and targets – “The metrics and gas emissions (Scope 1 and 2), and 61 per cent
targets used to assess and manage relevant of companies have some form of emissions
climate-related risks and opportunities” reduction target in place. But only 45 per cent
of companies have a long-term quantified
This enables us to see the progress companies
target – that is, of more than five years in
have made towards implementing the
duration – to reduce their emissions, and only
recommendations of the TCFD, bearing in mind
41 per cent of companies for whom Scope
that our Management Quality data are from
3 emissions from use of sold products are
2018. This is likely to be a fast-changing area.
significant (autos, coal, and oil and gas),
disclose these emissions. Therefore there is still
Governance significant scope for companies to improve
Figure 2.3 shows that TPI companies are their disclosure of emissions and for more
relatively strong on governance, especially the companies to target reducing their emissions,
basics. The vast majority of companies explicitly especially in the long term.
recognise climate change as a relevant
business risk and/or opportunity, and have a Disclosure
policy (or equivalent) commitment to action on
Finally, disclosure varies substantially across
climate change. However, only 54 per cent of
sectors, except for the governance theme,
companies have nominated a board member
where it is broadly comparable. The energy
or board committee with explicit responsibility
sector cluster outperforms both manufacturing
for oversight of climate change policy, and only
and basic materials, and transport, on strategy.
55 per cent have incorporated environmental,
Twenty-eight per cent of electricity utilities
social and governance issues into executive
undertake climate scenario planning, and 24
remuneration. For many companies, then,
per cent disclose an internal carbon price.
climate change is still not a c-suite issue.
The transport sector is particularly good at
disclosing metrics and targets. For example,
Strategy and risk management four out of five automobile manufacturers have
We see that companies are weak in the set a quantified emissions reduction target.
strategy area of the TCFD recommendations. The manufacturing and other basic materials
Although 52 per cent of companies can sector cluster consistently performs worst on
demonstrate support for domestic and every theme. In fact, steel makers are in the
international efforts to mitigate climate bottom 10 per cent for every Management
change, very few companies disclose an Quality criterion.
12State of Transition 2019: Management Quality – indicator by indicator
Figure 2.3. Management Quality, indicator by indicator
Yes
0% 10% 20% 30% 40% 50% 60% 70% 80% 90% 100%
Governance
Q1
97%
Q2
Governance 78%
Q3
Governance 93%
Q11 Q15 Q17 Q16 Q10 Q14 Q6
Governance 54%
Governance 55%
Strategy 52%
Strategy 14%
Strategy 16%
Strategy/Risk Mgt 34%
Risk Management 66%
Q4
Metrics and Targets 61%
Q5
Metrics and Targets 74%
Q7
Metrics and Targets 59%
Q8
Metrics and Targets 57%
Q13 Q12 Q9
Metrics and Targets 56%
Metrics and Targets 41%
Metrics and Targets 45%
“There is still significant scope for companies
to improve their disclosure of emissions and
for more companies to target reducing their
emissions, especially in the long term”
13
13TPI STATE OF TRANSITION REPORT 2019
Trends in Management Quality
When TPI was established in January 2017, opportunity for the first time (70 per cent
it covered the top 20 electricity utilities and of the cases we assessed for progress), or
the top 20 oil and gas producers (in terms of introduce a policy commitment to action on
market capitalisation). Two-and-a-half years climate change (15 per cent of cases), or do
on, we are now in a position to track progress both of these things (15 per cent of cases).
on Management Quality for many of the These can be regarded as basic steps.
companies in the TPI database: we now have
Seven companies have moved up from Level
trend data for 130 companies across the
2 to Level 3 or 4. At a minimum this requires
seven sectors of autos, cement, coal,
a company to begin disclosing its operational
electricity utilities, oil and gas production,
greenhouse gas emissions, or to introduce
paper, and steel.
a target to reduce emissions (which can be
Figure 2.4 shows the number of companies out qualitative). Four of these seven companies are
of these 130 that had moved up, moved down in the oil and gas sector. Oil and gas producers
or stayed at the same Management Quality were particularly apt to make progress
level at the point at which we most recently between 2017 and 2018, which is reflected in a
updated our assessments. The remaining tangible improvement in the sector’s average
companies were introduced to the database Management Quality level-score from 2 to 2.4.
during 2018 and have only been assessed once
Companies that jumped from Level 1 to 3 in
so far (thus we cannot yet track progress).
their most recent assessments include auto
Out of the 130 companies for which we have maker Subaru and electricity utility FirstEnergy.
trend data, 82 have stayed on the same level Both companies were able to make this jump
since their last assessment, 35 have moved up by satisfying multiple TPI indicators for the
at least one level, but 13 have moved down at first time. Subaru not only explicitly recognised
least one level. Thus, some progress is being climate change as a relevant business
made. However, in the majority of cases risk/opportunity, but also assigned board
companies are standing still, and the progress responsibility for climate change. FirstEnergy is
being made by some is being partly offset by now only one indicator short of reaching Level
other companies falling back. 4, having explicitly recognised climate change
as a relevant business risk/opportunity and
Of the 82 companies standing still, 25 are on
disclosed its operational emissions. Oil and gas
Level 4 and so cannot move up a level as such.
producer BP and Brazilian paper producer Fibria
Nonetheless, those companies can still progress
both advanced from Level 2 to 4 by setting
to achieve a 4* rating by satisfying all the TPI
quantitative emissions reduction targets.
Management Quality criteria. Only two of the
25 companies that stood on Level 4 in their
previous assessment have since met the 4* Some companies have fallen
rating criteria. backwards
Six companies dropped from Level 2 to Level
Progress at all levels 1 (for companies falling backwards, it was
As Figure 2.4 shows, the most commonly most commonly between these two levels).
observed direction of movement is upwards, We assessed all six of these companies to
from Level 1 to Level 2 or 3. A total of 13 have fallen backwards because they no
companies moved up from Level 1 to Level 2 or longer explicitly recognise climate change
3 in their last assessment; five of these are in as a relevant business risk or opportunity.
the oil and gas sector. We tightened the criteria for satisfying this
indicator in 2018 – from explicit recognition of
To make the move from Level 1 to 2 or 3 a the issue to a specific risk framing in line with
company must explicitly recognise climate TCFD – which could be the main explanation for
change as a relevant business risk and/or these backwards moves.
14State of Transition 2019: Trends in Management Quality
Figure 2.4. Company movements between Management Quality levels
Management Quality level
0 1 2 3 4
8 13 17
19 25
4
1
9
4
5
2
10
2
6
1
4
No Moved Moved 4 No. of
movement forwards backwards companies
“Out of the 130 companies for which we have trend
data, 82 have stayed on the same level since their
last assessment, 35 have moved up at least one level,
but 13 have moved down at least one level. Thus,
some progress is being made”
15
15TPI STATE OF TRANSITION REPORT 2019
Carbon Performance: alignment
with the Paris Agreement benchmarks
TPI’s assessment of companies on their • Of these 48, 26 companies are aligned with
Carbon Performance consists of a quantitative the 2°C benchmark. Of those, 20 companies
benchmarking of companies’ emissions are aligned with the most ambitious below
pathways against the international targets and 2°C benchmark.
national pledges made as part of the 2015 UN
• 79 companies are not aligned with any of the
Paris Agreement on climate change. The key
benchmarks.
question we ask is: are companies aligned with
the Paris Agreement goals, and if not, will they • 33 companies do not provide sufficient
be in the future? disclosure for TPI to calculate their Carbon
Performance. Most companies are not
Figures 2.5 and 2.6 summarise the TPI
aligned.
Carbon Performance data across all sectors
by classifying whether a company is aligned Alignment is most frequently seen in the
with the Paris Pledges, with a pathway to electricity and paper sectors. In electricity,
limit global warming to 2°C, or with a more 54 per cent of utilities assessed are aligned
ambitious pathway to limit global warming to with the Paris Pledges benchmark and
below 2°C. almost one-third are aligned with the
below 2°C benchmark. However, this partly
To summarise these data, we compare a
reflects a comparison of European electricity
company’s emissions intensity in the last year
utilities, which typically have a low emissions
for which we have data with the benchmarks in
intensity and ambitious targets, with global
2030. The group of companies considered to be
benchmarks. In the paper sector, slightly under
aligned by 2030 comprise:
half of companies are aligned with the Paris
(a) T hose with explicit 2030 emissions Pledges benchmark.
reduction targets that are below the
There is, as yet, little alignment evident in
relevant benchmark in 2030
the airlines, aluminium, cement, or oil and
(b) T hose with explicit targets expiring before gas sectors. None of the top 10 oil and gas
2030, but which would bring them below producers, in terms of the emissions intensity
the 2030 benchmark of primary energy supplied, is aligned with
the benchmarks, reflecting the fundamental
(c) T hose whose current performance is
decarbonisation challenges facing the sector
already below the 2030 benchmark
(see Section 3 below). If we extend the
In cases (b) and (c), we therefore assume transition horizon to 2050, we find that two
companies’ carbon intensity does not increase companies – Shell and Total – are eventually
after the last year for which we have data. aligned with the Paris Pledges benchmark by
2040. However, neither is doing enough to
Carbon Performance results align with TPI’s 2°C benchmark.
To date we have assessed 160 companies on Out of the 160 assessed companies, only 32
Carbon Performance in eight sectors: airlines; (20 per cent) have set a quantified emissions
aluminium; autos; cement; electricity; oil and reduction target extending to 2030, which we
gas (top 10 companies only); paper; and steel. could use to assess Carbon Performance. Of
Our assessment shows that in 2030: the 32 targets, 18 are aligned with the Paris
Pledges, 11 are aligned with the 2°C benchmark
• 48 companies would be aligned with the and eight with the below 2°C benchmark. The
least ambitious Paris Pledges (NDCs) share of companies with 2030 targets that
benchmark. This means they have either align with the Paris goals is higher than we
already achieved the 2030 Paris Pledges found in our analysis of the database in 2018.8
benchmark emissions intensity for their Fourteen companies have set a target for 2030
sector, or they will do so by 2030 based on that is not aligned with the Paris Agreement.
emissions reduction targets they have set.
16State of Transition 2019: Carbon Performance – alignment with the Paris Agreement benchmarks
Figure 2.5. Carbon Performance alignment with the Paris Agreement benchmarks (number and
percentage of companies)
20
33 No disclosure
12% 6
21%
4%
Not aligned
22
14%
Paris
2 Degrees
79
49%
Below 2 Degrees
Figure 2.6. Carbon Performance alignment with the Paris Agreement benchmarks by sector and
cluster (number and percentage of companies)
100% 1
1
2 1
90%
3 7 8
80%
10 16
70%
60% 14
14 3
50%
9 9
8
40%
4 4
30% 10
20% 2
4
12
3 5 2
10%
1 1
1 1 2 2
0%
Airlines Autos Aluminium Cement Paper Steel Electricity Oil & Gas
Transport Manufacturing and basic materials Energy
Below 2 Degrees 2 Degrees Paris Not aligned No disclosure
17TPI STATE OF TRANSITION REPORT 2019
Does Management Quality
predict Carbon Performance?
As we have seen, TPI assessments are divided than half. Therefore, companies doing well
into two elements: Management Quality on Management Quality are also likely to be
and Carbon Performance. Management companies doing well on Carbon Performance.
Quality describes companies’ governance of This association is statistically significant and
greenhouse gas emissions and the risks and it is robust to controlling for any systematic
opportunities arising from the low-carbon differences between aligned and non-aligned
transition. Carbon Performance describes companies in terms of industry, region of
what emissions pathway a company is on headquartering and market capitalisation.
and how it compares to the international
Breaking down the Management Quality data
targets and national pledges made as part
into the four TCFD areas, we find that Carbon
of the Paris Agreement on climate change.
Performance is most strongly associated with
Therefore Management Quality focuses on
Management Quality indicators in the area of
processes, while Carbon Performance focuses
strategy. Aligned companies perform almost
on outcomes.
twice as well on strategy as non-aligned
In this section we analyse the relationship companies. We might infer that strategic
between Management Quality and Carbon carbon management practices are a leading
Performance across the full TPI database indicator of Carbon Performance.
(see Figure 2.7). To do so, we compare the
Indicators grouped into the other three TCFD
proportion of Management Quality criteria
categories – governance, risk management,
satisfied by companies aligned with any
and metrics and targets – have no statistically
of the three Paris Agreement benchmarks
significant association with alignment,
in 2030, with the proportion satisfied by
although it is true that in all three cases aligned
companies not aligned (either due to having
companies score higher than non-aligned
an emissions intensity that is too high, or due
companies.
to not disclosing the necessary information).
We make this comparison for the full set of 17 These results assume companies’ carbon
Management Quality criteria, as well as when intensity does not increase or worsen after the
the criteria are grouped into each of the four last year for which we have data. To test the
TCFD areas.d robustness of these findings if we relax this
assumption, we repeat the analysis, this time
Our principal measure of alignment is the same
only classifying as aligned those companies
as in the previous section: that is, we compare
with a 2030 emissions target that would see
a company’s emissions intensity in the last year
their carbon intensity below the Paris Pledges
for which we have data with the benchmarks
benchmark. Companies without a 2030
for 2030.
emissions target are not aligned by default.
A positive association On this basis, we find that companies aligned
We find that Management Quality and Carbon with the Paris Pledges satisfy 75 per cent of
Performance are positively associated. On Management Quality criteria, while companies
average, companies that are aligned with not aligned only satisfy 51 per cent. This
the Paris Agreement benchmarks satisfy difference is also statistically significant and
two-thirds of Management Quality criteria, robust to controlling for industry, region of
while those that are not aligned satisfy less headquartering and market capitalisation.
d. Some companies are not assessed on Management Quality question 12 “Does the company disclose materially important
Scope 3 emissions?” Such companies can therefore only score on a maximum of 16 questions.
18State of Transition 2019: Does Management Quality predict Carbon Performance?
Figure 2.7. Proportion of Management Quality indicators satisfied by companies aligned or not aligned
with any of the Paris Agreement benchmarks
Aligned companies Non-aligned companies
34%:
“NO” 51%:
“NO”
66%:
“YES” 49%:
“YES”
Governance
100
80 Aligned
60 Not aligned
40
20
Metrics and
0 Strategy
targets
Risk management
Note: See Appendix for list of Management Quality indicators
19TPI STATE OF TRANSITION REPORT 2019
3 Sector focus: Airlines
Long-term questions about
offsetting and non-CO2 effects
In March 2019 TPI published its first assessment have a carbon intensity that is aligned with the
of the airlines sector. The sector makes a current sector benchmarks, no airline has a
significant contribution to climate change, 2030 target that can be said to be aligned with
currently accounting for 2 per cent of global the benchmarks. The sector is therefore falling
carbon dioxide (CO2) emissions and 12 per short of the ambition required to meet the goal
cent of transport-related CO2 emissions.9 This of the Paris Agreement to limit global warming
contribution is likely to grow, as increasing to below 2°C.
air passenger traffic outpaces technological
improvements in aviation, at the same time Use of offsetting
as other sectors such as electricity become One of the principal reasons why we judge
increasingly decarbonised.10, 11 that no airline has a 2030 target aligned
The impact of aviation on climate change with the benchmarks is that none of the 20
is not limited to its CO2 emissions. Non-CO2 airlines in our database has set a target that
impacts, such as the formation of contrails clearly specifies how it will reduce its own flight
and clouds caused by aircraft flying at altitude, emissions after 2025. Some airlines are yet to
are also likely to be significant, although these set any long-term target. Most others have
effects are currently highly uncertain.12 formally adopted industry-wide targets, which
are based on net emissions reductions. This
Management Quality approach includes the use of carbon
offsets, purchased from other sectors, to
Compared with other sectors in the TPI
augment emissions reductions within the
database, airlines are about mid-table on
airline sector itself.
Management Quality, with an average level-
score of 2.4. As in other sectors, most airlines In principle, offsetting can be a cost-effective
do the basics, but fewer take the more method of reducing emissions. The problem
advanced steps (see Figure 3.1). A notably is that it is unclear from such net targets how
large share of airlines has set quantified much the airlines plan to reduce their own
emissions reduction targets and still more flight emissions. Research by the International
have set fuel efficiency targets. However, Energy Agency and others shows that the
a particularly small number of airlines airline industry needs to reduce its
have aligned executive remuneration with own emissions significantly in
environmental, social and governance order to limit warming to
(ESG) issues, incorporated climate risks and below 2°C, and should
opportunities in their strategy, or undertaken not be relying too
and disclosed climate scenario planning. heavily on
offsets.10, 13
Carbon Performance
TPI assessed the Carbon Performance of
airlines based on their CO2 emissions intensity
from flight operations: that is, the
“Most
average amount of CO2 emitted
by an airline in transporting
airlines
one passenger for one
kilometre. We found
do the basics
that, while most but fewer take the
of the airlines
surveyed more advanced steps”
20Sector focus: Airlines
Figure 3.1. Airlines’ Carbon Performance versus the benchmarks
Company Emissions intensity of flight operations (gCO2/passenger kilometre)
2014 2015 2016 2017 2020 2022 2025
Air China 111 112 111 107 108
Alaska Air 94 93 91 91 87
American Airlines 119 116 116 115
ANA Group 137 134 132 128 133
China Southern 114 112 112 108
Delta 118 116 115 113 104
Easyjet 82 81 80 79 75 72
IAG 125 119 116 112 112
IndiGo No data
Japan Airlines 140 132 134 134 125
Jetblue 101 101 100 101 98
Korean Air 188 181 175 171 172
LATAM 108 104 100 96 102
Lufthansa 127 126 126 120 107
Qantas 104 101 101 98 89
Singapore Airlines 138 138 141 136
Southwest 102 99 98 97 98
Turkish Airlines 109 119 110 107 106 104
United 107 106 104 104 92
Wizz Air No data
2°C (High efficiency) 129 125 121 118 106 99 88
2°C (Shift-improve) 129 126 123 120 111 105 96
International pledges 129 126 124 122 115 110 104
Aligned with 2°C Aligned with 2°C Aligned with
Key Not aligned
(High efficiency) (Shift-improve) international pledges
TPI conclusions on airlines
Our analysis concluded that there is a need for more ambitious target-setting at both an
industry and airline level. Specifically, TPI is calling for:
1. Greater transparency in the use of offsetting. There needs to be more visibility of airlines’
intended reliance on offsetting compared with their own emissions reductions. This is an
important piece of information investors need in order to evaluate companies’ ambitions and
the investment risks they present.
2. A credible level of offsetting. The airline sector needs to demonstrate that the amount of
emissions reductions to be delivered from offsetting is both realistic, in terms of the availability
of offsets from other sectors in an increasingly carbon-constrained world, and reasonable, in
terms of the role airlines need to play in meeting the Paris Agreement temperature goals.
3. Non-CO₂ impacts. TPI’s assessment does not yet include the non-CO2 effects of aviation on
climate change, notably via contrails and clouds. Due to the uncertainty in quantifying them,
these effects are not currently incorporated in company disclosures, or in the models used to
benchmark the sector. However, non-CO2 effects are thought to be significant and therefore
we are calling for further progress to be made in understanding airlines’ overall impact on the
climate. If these effects were taken into account, the TPI benchmarks would almost certainly
be tighter.
21TPI STATE OF TRANSITION REPORT 2019
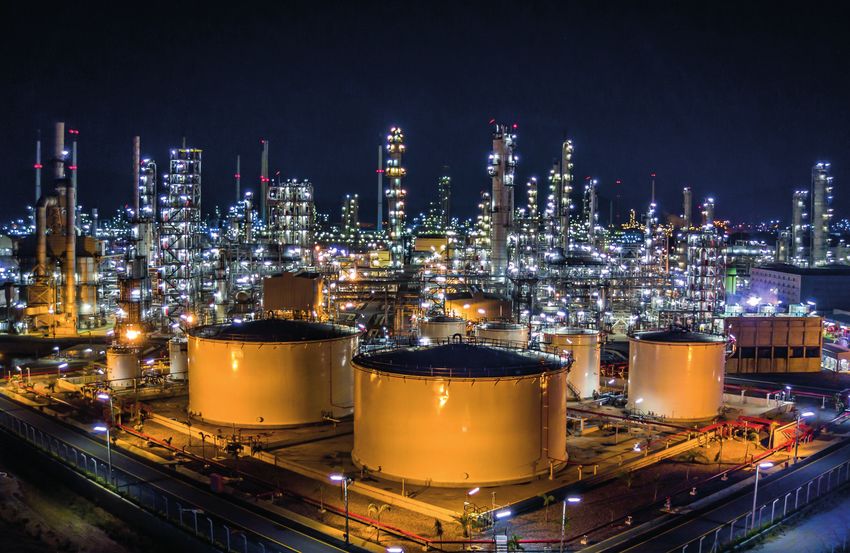
Sector focus: Oil and gas
Making the energy transition
The oil and gas sector is pivotal in the companies that have set long-term emissions
transition to a low-carbon economy. targets. By contrast, out of the 17 US oil and
Including downstream (i.e. Scope 3) emissions gas producers in our sample, none is on Level
from burning oil and gas, it is estimated 4 and only three are on Level 3. There is much
that the sector accounts for 33 per cent of room for improvement, although we do indeed
global greenhouse gas emissions.14, 15 The see US companies improving: out of the six
International Energy Agency estimates that US oil and gas companies that were still on
global oil production has to fall by around 30 Level 1 in 2017, for instance, five moved on to
per cent by 2040 in order to align with a below Level 2 in 2018.
2°C scenario.16
The sector is also of great significance to Carbon Performance
investors. Publicly listed oil and gas companies In November 2018, TPI published a discussion
have a combined equity valuation of over paper4 setting out our proposed Carbon
US$3.3 trillion, 5 per cent of global market Performance methodology for the oil and
capitalisation.e By encouraging publicly listed gas sector and provided a provisional Carbon
oil and gas companies to reduce operational Performance assessment of the 10 largest
emissions and, where it makes sense, to companies in the sector: see Figure 3.2.
produce low-carbon energy, investors can play The results suggest that the emissions
a huge role in accelerating the transition to a intensity of these 10 oil and gas majors is
low-carbon economy. currently substantially above the sector’s Paris
Agreement benchmarks, defined in terms
Management Quality of the carbon intensity of energy supply.
TPI has assessed the oil and gas sector on Significant reductions will be needed for any of
Management Quality since early 2017. On these companies to align with the benchmarks
average, oil and gas producers’ Management in the future. Alignment ultimately means
Quality level-score increased from 2.1 to 2.4 these companies making the transition from
between 2017 and 2018, making it a notable being oil and gas producers to low-carbon
improver. However, the sector still remains energy suppliers.
below the TPI average of 2.5.
We found that only five companies had set
Oil and gas companies tend to perform better long-term emissions reduction targets or
than average on incorporating environmental, ambitions, and only two of these targets/
social and governance (ESG) issues into ambitions (from Royal Dutch Shell and Total)
executive pay: 69 per cent of oil and gas took into account the all-important Scope 3
companies do, which is 14 percentage points emissions from use of sold products. These
above the TPI average. However, just 36 emissions typically account for 90 per cent of
per cent of companies have set quantified total emissions for an oil and gas company,14
emissions reduction targets (25 percentage and it is very difficult to significantly reduce
points below the TPI average), and only 42 emissions without addressing them.
per cent can demonstrate that they support
Since publication of our discussion paper,
domestic and international efforts to mitigate
Total has revised its long-term targets and
climate change (10 percentage points below
Royal Dutch Shell, EOG Resources, Exxon
the TPI average).
Mobil and Eni have added new climate-related
The companies scoring highest on targets/ambitions in some form. Whether
Management Quality are predominantly these changes will bring these companies
European: six out of the eight oil and gas into alignment with the benchmarks will be
producers on Level 4, and four out of the five assessed by TPI later this year.
e. Calculated based on the 140 largest oil and gas companies by market cap in the FTSE Russell universe and World Bank data.17
22You can also read