Avoided Deforestation - A CLIMATE MITIGATION OPPORTUNITY IN NEW ENGLAND AND NEW YORK - The Nature Conservancy
←
→
Page content transcription
If your browser does not render page correctly, please read the page content below
Avoided Deforestation
  A CLIMATE MITIGATION OPPORTUNITY
    IN NEW ENGLAND AND NEW YORK

                                Avoided Deforestation 1
This report was prepared by the research group of Dr. Christopher A. Williams at Clark
University for the United States Climate Alliance Grant Program for Natural and Working
Lands Research, and for The Nature Conservancy in Massachusetts.

Dr. Christopher A. Williams
Dr. Natalia Hasler
Li Xi (doctoral student)

Graduate School of Geography
Clark University
950 Main Street
Worcester, MA 01610 USA

HOW TO CITE: Williams CA, Hasler N, Xi L (2021) “Avoided Deforestation: A Climate
Mitigation Opportunity in New England and New York”, a report prepared for the United
States Climate Alliance Natural and Working Lands Research Program, pp. 1 – 42.

COVER: © Lauren Owens Lambert
THIS PAGE: © Harold E. Malde                                                              Avoided Deforestation 2
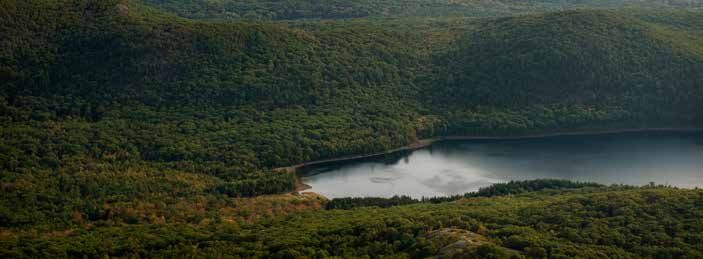
EXECUTIVE SUMMARY

   WE ARE IN THE MIDST OF A CLIMATE CRISIS. A steadily increasing
   excess of carbon dioxide and other greenhouse gases in the
   Earth’s atmosphere, predominantly from fossil fuel use by
   humans, is driving rapid changes in the global climate system.
   To avoid catastrophic climate change, it is imperative that we
   bring atmospheric carbon dioxide levels back down to below
   350 parts per million (ppm), yet in 2021, the amount of carbon
   dioxide in the atmosphere topped 420 ppm.

   The most important way to address this climate crisis is
   to reduce greenhouse gas emissions to zero, principally by
   switching from fossil fuels to low-carbon alternatives such
   as renewable energies. Avoiding carbon emissions from
   deforestation is important as well. However emissions
   reductions alone will not be enough. We also need to remove
   excess carbon dioxide from the atmosphere with negative
   emissions technologies, several of which are provided by nature. Protecting and expanding the carbon stored
   in forests belongs to a suite of “natural climate solutions” — defined as protecting, restoring, and better
   managing forests, grasslands, farms and wetlands to reduce and remove carbon emissions and safeguard the
   climate system.

   Deforestation — primarily for residential, commercial and infrastructural development — is a major threat to
   forests in the northeastern United States. Unlike many other threats to our forests, deforestation is almost
   always permanent. Deforestation is a direct source of carbon emissions, releasing the carbon stored in trees
   and roots into the atmosphere as carbon dioxide. It also negates one of the best tools we have for drawing
   carbon dioxide back out of the atmosphere (forest carbon sequestration). Thus, slowing the pace of forest
   loss (avoiding deforestation) is an important instrument in the fight against climate change.

   The size of the avoided deforestation opportunity and its spatial distribution had previously been poorly
   quantified. This study fills that gap with detailed spatial analysis (30 m resolution) that shows where forests
   have been lost in recent decades, and the carbon impacts of that loss. We found that the states of New
   England and New York are releasing 4.9 million metric tons of CO2 equivalent into the atmosphere
   each year due to forest loss. And they are losing out on 1.2 million metric tons of CO2 equivalent in
   carbon sequestration each year due to that loss. This reduces the region’s intact forest carbon sink by about
   10%, or amounts to about 2% of the region’s CO2e emissions from fossil fuel combustion across all sectors in
   2018 (EPA 2020).

   In this report you will find detailed descriptions of the methods used, regional maps, and tables and
   summaries at the state level (informed by multiple meetings with state agency staff throughout the study).
   The data are free and available on the web (see links in the report) or by contacting the study’s authors. Our
   intent is to deliver actionable information that can assist states with greenhouse gas emissions and removals
   inventories, as well as with actions that avoid deforestation as a possible component of climate mitigation.
   The details of forest carbon stocks and sequestration and of forest loss vary by state, but the necessary
   conclusions do not. Every state stands to gain by reducing their rate of deforestation, and those
   benefits compound over time.

   THIS PAGE: © Eric Aldrich/TNC                                                                         Avoided Deforestation 3
TABLE OF CONTENTS

EXECUTIVE SUMMARY....................................................................................................................3

INTRODUCTION.....................................................................................................................................5

METHODOLOGY....................................................................................................................................6
   2.1 Forest Carbon Stocks..............................................................................................................................7
   2.2 Emissions from Forest to Non-Forest Conversion............................................................................8
   2.3 Emissions from Wood Harvested During Conversion.....................................................................8
   2.4 Foregone Carbon Sequestration......................................................................................................... 11
   2.5 Mapping of Forest Conversions..........................................................................................................12
   2.6 Cost per Tonne of Mitigation...............................................................................................................12

RESULTS AND DISCUSSION.........................................................................................................13
   3.1 Findings in This Study............................................................................................................................13
   3.2 Comparisons to Other Estimates...................................................................................................... 22
   3.3 Additional Considerations Regarding Scope, Use and Reliability............................................... 24

SOURCE DATA SETS........................................................................................................................... 26

FUNDING SOURCES & OTHER ACKNOWLEDGMENTS....................................... 26

REFERENCES............................................................................................................................................. 27

APPENDIX A: STATE-SPECIFIC SUMMARY SHEETS................................................ 29

THIS PAGE: © Meredyth Babcock                                                                                                                                 Avoided Deforestation 4
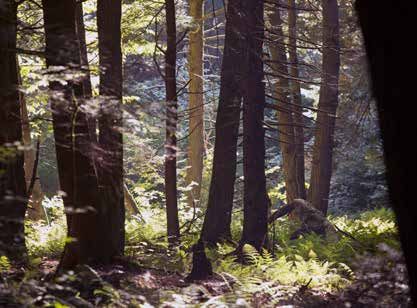
INTRODUCTION

INTRODUCTION
This study quantifies the climate mitigation that could be achieved by avoiding
deforestation in seven states across the northeastern US. Forest losses to development,
agriculture and other land uses release carbon to the atmosphere, contributing to
greenhouse gas emissions and associated climate change. These forest to non-forest
conversions also halt carbon sequestration that would have occurred if the forests had
remained intact. Slowing the rate of forest loss presents a climate mitigation opportunity
that is of interest to states in the region, and states are interested in more detailed
quantification of this opportunity. This study aims to fill that gap by documenting the
locations of forest loss in recent decades, assessing the associated carbon emissions and
foregone carbon sequestration, and providing summaries at state and county levels along
with statewide maps at a 30 m resolution. The intent is to provide actionable information
that can inform the general public, and assist states with greenhouse gas emissions and
removals inventories as well as with plans to explore avoided deforestation as a possible
component of climate mitigation initiatives.

THIS PAGE: © Mark Godfrey, TNC                                                               Avoided Deforestation 5
METHODOLOGY

METHODOLOGY
In this study we estimate the potential emissions that would occur if areas of present-day
forest were to be converted to non-forest, as well as the actual emissions associated with
forested areas that were converted to non-forest during the 1990s and the 2000s. Also,
we estimate the potential foregone carbon sequestration that would be lost if forestlands
were to be converted in the future, as well as the actual foregone carbon sequestration
associated with areas of deforestation in the 1990s and 2000s. The combination of
greenhouse gas emissions that are avoided, and potential foregone carbon sequestration
that is maintained, when deforestation is prevented is referred to here as the climate
mitigation opportunity.

A number of spatially explicit datasets of land cover and forest carbon were
developed for this study. Methods are described in detail below. Section 2.1 explains
the combination of satellite and field plot data sets used to map forest cover, and to
estimate forest carbon stocks. Section 2.2 details the equations that estimate the
carbon emissions caused by conversion of a given forest. Section 2.3 explains how wood
products were considered since some of the wood from land clearing for conversion is
used in long-lived wood products. Section 2.4 covers the amount of potential carbon
sequestration, or the carbon stock added each year that the forest remains forest and
continues to grow without a natural disturbance or harvest. Section 2.5 shows how
actual forest conversion was mapped using satellite data from two different points in
time to look for forested areas that were converted to non-forest and stayed non-forest
for at least a decade. Finally, Section 2.6 details the cost per metric ton of carbon dioxide
if avoided deforestation is used as a climate mitigation strategy.

THIS PAGE: © Lauren Owens Lambert                                                               Avoided Deforestation 6

2.1 Forest Carbon Stocks

We use our National Forest Carbon Monitoring System (NFCMS) 30-m resolution dataset, published on Oak Ridge National
Laboratory DAAC (https://doi.org/10.3334/ORNLDAAC/1829) (Williams et al. 2012, Williams et al. 2014, Gu et al. 2016,
Gu et al. 2019a, Gu et al. 2019b, Williams et al. 2021b), as a base for estimating forest carbon stocks in 2010, and for any
specific year from 1990 to 2010 for which a particular forest tract was marked as having been converted to non-forest. The
NFCMS is a comprehensive dataset of pixel-level carbon stocks and fluxes derived from a combination of an inventory-
constrained carbon cycle model, satellite-based aboveground biomass, satellite-based forest disturbance mapping, and a set
of ancillary datasets characterizing additional forest attributes.

The essence of the NFCMS methodology involves training an ecosystem carbon cycle model, the Carnegie-Ames-Stanford
Approach model (CASA, (Potter et al. 1993, Randerson et al. 1996)), to match forest biomass yield curves sampled from the
Forest Inventory and Analysis (FIA) database to produce a suite of curves characterizing forest carbon stocks and fluxes with
stand age that are uniquely defined for a range of forest type group and site productivity conditions. We then apply these
curves to assign forest carbon values for each 30m pixel based on the pixel’s attributes, most importantly forest type and
stand age. An illustrative example of resulting curves is provided in Figure 1.

FIGURE 1. Carbon stocks with stand age shown for high productivity stands of the Maple / Beech / Birch forest type group in
the northeastern U.S. shown with: (a) individual curves of stand-level aboveground biomass from the NFCMS trained to match
statistical samples of FIA data (red plus signs); (b) cumulative carbon storage from 40 to 90 years; (c) carbon stock changes from
40 to 90 years for aboveground biomass (AGB), belowground biomass (BGB), coarse woody debris (CWD), and total soil carbon
(SoilC); and (d) annual net ecosystem productivity (NEP) from 40 to 90 years with positive values representing net uptake of
carbon from the atmosphere.

We assign forest type to pixels with a USFS dataset (Ruefenacht et al. 2008). We determine each pixel’s stand age in the
year 2000 with a look-up of the pixel’s biomass indexed into the biomass versus stand age yield curve for the pixel’s forest
type and site productivity class. We define the pixel’s biomass in 2000 with the National Biomass Carbon Dataset (NBCD)
of Kellndorfer et al. (2013). We increment stand age backwards or forwards in time to represent any year from 1990 to
2010. We reset stand age to one year for all pixels identified as experiencing a stand-replacing disturbance in a given year
from 1986 to 2010 according to the North American Forest Dynamics dataset (NAFD, (Goward et al. 2015b), (Zhao et al.
2018)). We also use NAFD to define forest areal extent at the 30 m pixel level. The forest conversion losses described in
this work, as well as the results from our grow-only scenarios that are described in section 2.4, provide extensions to our
published NFCMS datasets. Forest carbon stocks of present-day forests, as well as stocks expected by 2050 under a grow-
only scenario, can be explored at the 30 m resolution in the interactive web-mapping interface of The Nature Conservancy’s
Resilient Land Mapping Tool (http://maps.tnc.org/resilientland/).

                                                                                                                     Avoided Deforestation 7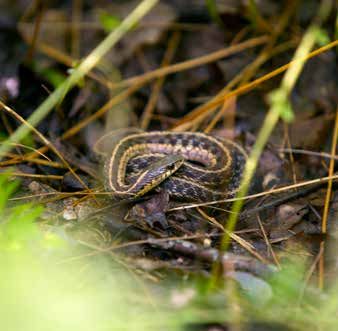
2.2 Emissions from Forest to Non-Forest Conversion

We estimate total carbon emissions that resulted from forest conversions that occurred from 1990 to 2010 conversion
events, and the emissions that would result from conversion of lands that were forested in 2010 with the following procedure.
Put into words, the amount of carbon emitted from forest conversion is composed of (1) a portion of the aboveground
biomass carbon in the forest, which varies based on what percentage of the wood from land clearing is turned into wood
products (and how long those products last) and what percentage of the wood is immediately emitted through decay or
burning, plus (2) an estimate of the remaining carbon pools (belowground wood, coarse woody debris (downed trees), fine
roots, and leaves and leaf litter), which are assumed to decay entirely within 20 years of forest loss. Estimates account for
emissions from aboveground woody biomass carbon (AGB) removed from a forest stand as wood products (“removals”),
emissions from all other AGB and belowground woody biomass carbon (BGB) that is not part of the wood product removals,
and emissions from decomposition (or burning) of coarse woody debris (CWD – both above and below ground), fine roots
(FR), and foliar plus litter carbon (L) within forestlands according to the following equation:

FCO2e= AGB * fr * EFwp + [AGB * (1-fr ) + BGB + CWD + FR + L] * EFnon-wp                    (1)

We assume that all of the biomass carbon not removed for wood products, plus all of the site’s coarse woody debris, root and
litter carbon is emitted to the atmosphere as CO2 within 20 years of conversion (EFnon-wp = 100%). We assume that mineral
soil carbon is not vulnerable to prompt emission as a result of forest to non-forest conversion, consistent with reports of
equivocal findings for conversions to residential lands (Milesi et al. 2005, Campbell et al. 2014). We estimate the fraction of
woody biomass removed for wood products (fr averaging 72% for hardwoods to about 74% for softwoods) for each specific
forest type group using data from the USFS Timber Product Output (TPO) online database (USDA 2012).

We estimate the proportion (EFwp) of biomass removals that is emitted from the wood products stream over time with
methods detailed below (see section 2.3). This proportion varies by forest type as described in the timber products
output tables of the US Forest Service combined with the WOODCARB2 model of the US Forest Service. We estimate the
fraction emitted within 40 years as CO2e, including accounting for the chemical nature of the emissions as either CO2 or
CH4, and using a 100-year global warming potential (GWP-100) for CH4 equal to 28 times that of CO2 (Myhre et al. 2013).
This corresponds to the timeframe of committed emissions commonly used in studies of the carbon consequences of
land conversion.

Using equation 1 as above, emissions from forestlands are calculated for each pixel individually according to the
ecosystem’s pre-conversion carbon pools (i.e. carbon stocks). For actual conversions detected with satellite data
products, emissions from all pixels converted in the same decade are reported in a single map, i.e. emissions from
forestlands converted from 1990 to 1999 are reported on the 1990s maps, emissions from forestlands converted from
2000 to 2009 are reported on the 2000s map, etc., regardless of the year of conversion within the decade. This
approach estimates the actual emissions for each pixel accumulated for 40 years post-conversion, as described below,
regardless of when that conversion occurred within the decadal interval. For emissions from potential future conversions,
year 2010 carbon stocks are used as the baseline.

2.3 Emissions from Wood Harvested During Conversion

To calculate carbon emissions from biomass removals during conversion, we use the NFCMS-adapted version of the US
Forest Service WOODCARB2 model (Skog 2008). This model tracks the fate of harvest removals with associated emissions
for a range of wood products and including emissions that occur when wood products are discarded and enter the waste
stream. A detailed description of the adapted version can be found in supplements of both Zhou et al. (2021) and Gu et al.
(2019a). Briefly, we use data from the USDA Forest Service Timber Product Output (TPO) online database (USDA 2012)
to estimate the forest-type-specific proportion of wood entering each Harvested Wood Product (HWP) category. For each
year after harvest, the model uses exponential decay functions, with half-lifes specific to each HWP category, to calculate
the proportion of wood that remains in use. Portions no longer in use are either burned, composted or discarded in Solid
Waste Disposal Sites (SWDS). Some of the carbon entering SWDS is stored indefinitely and some is decomposed and
released to the atmosphere as either carbon dioxide (CO2) or methane (CH4). To account for methane, we use CO2e units
with a standard 100-years global warming potential of 28 (Myhre et al. 2013). We use WOODCARB2’s default assumption

                                                                                                                 Avoided Deforestation 8
that half of landfill emissions are released as methane. The disposition and fate of harvest removals varies by forest type
as seen in Table 1, unfolds over time as seen in Table 2, and yields carbon storage distributions and cumulative emissions as
characterized in Table 3.
Table 1. Percent of all NAFD disturbances in the northeast by forest type, as well as the initial
Table 1. Percent of all NAFD disturbances in the northeast by forest type, as well as the initial
(year 1.1)Percent
TABLE 1)
disposition of harvest
of all NAFD
removals
disturbances
into harvested
in the northeast
wood
by forest type,
products
as well
of various
as the initial
types, or of harvest
(year 1) types,
disposition
(year disposition of harvest removals into harvested wood products of various or
emitted into
removals to the atmosphere
harvested from ofdifferent
wood products processes
various types, as toreported
or emitted by thefrom
the atmosphere USFS Timber
different Products
processes as reported by
emitted to the Products
atmosphere from different processes as reported by the USFS Timber Products
Output.
the USFS Timber Output.
Output.
Maple /
Maple
Beech // Oak / Spruce /
All Forests Beech /
Birch Oak /
Hickory SpruceFir
/
All Forests Birch Hickory Fir
Percent of all disturbance by forest type 100 47 35 10
Percent of all disturbance by forest type 100 47 35 10
Removals stored in HWPs (%)
Removals stored in HWPs (%)
Construction 29 22 36 40
Construction 29 22 36 40
Other wood uses 14 11 16 17
Other wood uses 14 11 16 17
Paper 19 24 7 28
Paper 19 24 7 28
Wood in SWDS 1 1 1 1
Wood in SWDS 1 1 1 1
Paper in SWDS 4 5 1 5
Paper in SWDS 4 5 1 5
Total removals stored in HWPs (%) 66 62 61 91
Total removals stored in HWPs (%) 66 62 61 91
Removals emitted to the atmosphere (%)
Removals emitted to the atmosphere (%)
Burning 33.5 36.9 38.5 7.8
Burning 33.5 36.9 38.5 7.8
Composting 0.7 0.9 0.4 1.1
Composting 0.7 0.9 0.4 1.1
CO2 from Solid Waste Disposal Sites 0.1 0.1 0.0 0.1
CO2 from Solid Waste Disposal Sites 0.1 0.1 0.0 0.1
CH4 from Solid Waste Disposal Sites 0.0 0.1 0.0 0.1
CH4 from Solid Waste Disposal Sites 0.0 0.1 0.0 0.1
Total removals emitted to the atmosphere (%) 34 38 39 9
Total removals emitted to the atmosphere (%) 34 38 39 9
Table 2. Fate of harvest removals over time including storage in harvested wood products
Table
TABLE 2.2. Fate of harvest removals
over timeover timestorage
including storage inproducts
harvested wood andproducts
(HWPs)Fate and of harvest
emissionsremovals
to the including
atmosphere expressedin harvested
asare wood
percent ofaverage (HWPs)
total across
harvest emissions to the
removals. Results
(HWPs) and emissions to the atmosphere expressed as percent of total harvest removals.
atmosphere expressed as percent of total harvest removals. Results from the all forest Resultsby their
types weighted
are from the average across
respective material contributions. all forest types weighted by their respective material contributions.
are from the average across all forest types weighted by their respective material contributions.
Years after harvest
Years after harvest
1 10 30 50 100
1 10 30 50 100
Percent of removals stored in HWPs
Percent of removals stored in HWPs
Construction 29 25 19 15 9
Construction 29 25 19 15 9
Other wood uses 14 8 3 2 0
Other wood uses 14 8 3 2 0
Paper 19 2 0 0 0
Paper 19 2 0 0 0
Wood in SWDS 1 8 15 18 21
Wood in SWDS 1 8 15 18 21
Paper in SWDS 4 12 9 7 7
Paper in SWDS 4 12 9 7 7
Total of all HWPs 66 54 46 42 37
Total of all HWPs 66 54 46 42 37
Percent of removals released in accumulated flux
Percent of removals released in accumulated flux
Burning & Composting 34 43 46 48 50
Burning & Composting 34 43 46 48 50
C fluxes from SWDS 0 3 8 10 14
C fluxes from SWDS 0 3 8 10 14
Cumulative release of carbon to the atmosphere 34 46 54 58 63
Cumulative release of carbon to the atmosphere 34 46 54 58 63
5
5
Avoided Deforestation 9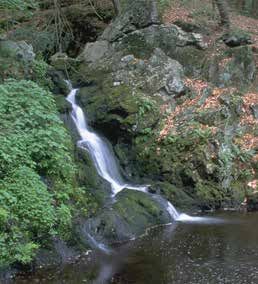
Table 3. Illustrative example of pre- and post-conversion carbon stocks and cumulative
   emissions to the atmosphere for a representative case in the northeastern U.S., including stocks
   and3.emissions
TABLE                  within offorests
         Illustrative example     pre- andand  within the carbon
                                           post-conversion  woodstocks
                                                                   products   sector and
                                                                         and cumulative      reporting
                                                                                         emissions to theemissions
                                                                                                          atmosphere in
                                                                                                                     for a
representative case in the northeastern U.S., including stocks and emissions within forests and within the wood products sector and
   units of carbon mass and in CO equivalents. The example assumes that 72% of aboveground
reporting emissions in units of carbon mass2 and in CO2 equivalents. The example assumes that 72% of aboveground biomass is
removed from is
   biomass     theremoved
                   forest and from   thetoforest
                              delivered           and
                                           the wood    delivered
                                                    products       to the wood products stream.
                                                             stream.
                                                                          pre-
                                                                    conversion       Year 1      Year 30    Year 100

    Forest Stocks [kg C m-2]
    Aboveground Biomass Carbon (AGB)                                       8.00
    Other Forest Carbon (BGB + CWD + FR + L)                               7.92

    Forest Cumulative Emissions [kg C m-2]
    Aboveground Biomass Carbon (AGB)                                                                2.24        2.24
    Other Forest Carbon (BGB + CWD + FR + L)                                                        7.92        7.92

    HWP Stocks [kg C m-2]
    AGB Removals                                                                       5.76
    Removals stored in HWPs [kg C m-2]
    Construction                                                                       1.67         1.09        0.50
    Other wood uses                                                                    0.81         0.17        0.02
    Paper                                                                              1.09         0.00        0.00
    Wood in SWDS                                                                       0.06         0.86        1.22
    Paper in SWDS                                                                      0.23         0.52        0.38
    Total removals stored in HWPs                                                      3.80         2.65        2.12

    HWP Cumulative Emissions
    Removals emitted to the atmosphere C units [kg C m-2]
    Burning & Composting                                                               1.97         2.67        2.86
    C as CO2 from Solid Waste Disposal Sites                                           0.01         0.22        0.39
    C as CH4 from Solid Waste Disposal Sites                                           0.00         0.22        0.39
    Total removals emitted to the atmosphere                                           1.98         3.12        3.64
    Removals emitted to the atmosphere CO2e units [kg CO2e m-2]
    Burning & Composting                                                               7.22         9.80       10.49
    CO2 from Solid Waste Disposal Sites                                                0.02         0.81        1.43
    CH4 from Solid Waste Disposal Sites                                                0.00         8.27       14.58
    Total removals emitted to the atmosphere                                           7.24        18.88       26.50

    Total Emissions
    Total Cumulative Emissions C units [kg C m-2]                                                  13.25       13.80
    Total Cumulative Emissions CO2e units [kg CO2e m-2]                                            28.96       36.66

Though forest conversions are year-specific events, the resulting committed emissions legacy occurs over decades to
centuries. We report the accumulated emission occurring within 40 years after conversion to represent the emissions impact
                                                                                                                         6
of a conversion event that occurred within a given decade. This 40 year time horizon is long enough to capture the majority
of emissions while being short enough to be relevant for climate and land use policies. When summarizing emissions over
areas larger than a single pixel, we report the accumulated emissions over 40 years from conversions that occurred within a
given decade, and averaged over years within that decade. Materially, the accumulated emissions represent the difference
between the forest carbon in aboveground biomass that was removed as harvest during conversion and the proportion that
remains stored either in long-term use as a wood product (e.g. in construction) or in solid waste disposal sites, while also
accounting for the chemical nature of emissions as CO2 or CH4 and reported as CO2e.

                                                                                                                    Avoided Deforestation 10
2.4 Foregone Carbon Sequestration We estimate the carbon sequestration that would occur within 40 years in the absence of forest conversion assuming sustained forest growth and maturation consistent with the FIA yield curves. This “grow-only” scenario represents forest maturation in the absence of a stand-replacing disturbance during the 40 year timeframe, thus being free of forest harvest, forest conversion or a major natural disturbance from severe pest or pathogen attack. We base this on our group’s prior work that quantified the net ecosystem productivity and associated carbon storage for forestlands as they vary with a range of stand-level attributes, principally forest type group, site productivity class, and stand age. As described above, the technique first identifies carbon release or uptake as a function of stand age for a wide range of forest types unique to different regions of the US based on forest inventory and analysis (FIA) data combined with a carbon cycle model. We then map carbon stocks to forestlands at a 30 m resolution based on maps of forest type, and stand- level biomass and disturbance histories which are used together to approximate stand age. This well-published method (Williams et al. 2012, Gu et al. 2016, Williams et al. 2016, Gu et al. 2019a, Zhou et al. 2021) is applied here to estimate forest carbon stock accumulation with ensuing forest growth and maturation at an average rate representative for each forest type group and productivity class setting. We estimate the potential foregone carbon sequestration for all present-day forestlands (forested in 2010) by calculating the difference between the current forest carbon stocks and the carbon stocks expected after 40 years. This quantifies the carbon uptake that would be lost, or foregone, if present-day forestland was to be converted accumulated over 40 years. Results of grow-only sequestration can be explored at the 30 m resolution in the interactive web-mapping interface of the TNC Resilient Land Mapping Tool (http://maps.tnc.org/resilientland/). We estimate the foregone carbon sequestration for each location of actual forest to non-forest conversion during the 1990s and 2000s by calculating the difference between the total ecosystem carbon stocks prior to conversion and the total ecosystem carbon that the forest would have had 40 years later if the forest conversion had not occurred. The difference between the stocks 40 years after conversion and those pre-conversion quantifies the potential carbon sequestration that would occur with sustained forest growth and maturation. For sites of actual forest conversion, results for all pixels converted in the same decade are reported in a single dataset. THIS PAGE: © Darrell Bodnar Avoided Deforestation 11
2.5 Mapping of Forest Conversions

We mapped areas of actual forest conversion with a forest
disturbance data product filtered to retain only those pixels that
persist as non-forest according to the 2016 NLCD (Homer et al.
2020), and restricted to select non-forest land cover classes that
most confidently represent lasting forest loss (deforestation).
We adopted the widely-used North American Forest Dynamics
(NAFD, (Goward et al. 2015a, Zhao et al. 2018)) forest
disturbance dataset to identify forested pixels that experienced
a stand-replacing disturbance in a given year. The NAFD dataset
reports annual forest disturbance and regrowth dynamics from
1986 to 2010 for the conterminous US at a 30 m resolution. It
is based on a vegetation change detection algorithm applied to
Landsat spectral data (Huang et al. 2009a, Huang et al. 2009b,
Huang et al. 2010).

For forest pixels marked with a disturbance in NAFD either in
the 1990s (1990 to 1999) or in the 2000s (2000 to 2009), we
found the corresponding land cover class in the 2016 NLCD. We
considered deforested pixels to be those with a NLCD land cover
class of “developed” (NLCD classes 21-24) or “cultivated crops” (NLCD class 82). Restricting the deforestation mapping
to only those areas classified as developed or agricultural leads to a conservative, and more confident mapping of forest
conversions resulting from human action with a persistent, non-forest land cover. Results for other non-forest classes were
recorded as well, such as pasture, grassland, shrubland, wetland, water or bare land, however we did not consider such cases
to involve permanent conversion because they often involve either land cover class confusion (e.g. classification algorithms
trained on Landsat spectral data often confuse forests with wetlands or woody wetlands) or ensuing forest regrowth (e.g. the
land cover mapped for post-harvest forest regrowth often appears as pasture, grassland, savanna or shrubland for several
years after harvest). Excluding apparent forest losses to these other classes is important in areas with an active forest
harvest industry where disturbed forests often return to forest with ensuing regrowth over decades but that may appear in a
satellite-based land cover classification dataset as a non-forest class for the intervening years. Careful filtering in this way is
especially important for the most recent disturbances in the record because even when forests regrow after harvest clearing,
it can take several years to even a decade for a land cover classification dataset to mark it as returning to forest.

2.6 Cost per Tonne of Mitigation
We estimate the cost of per tonne (metric ton) of CO2e mitigation with a ratio of land values and the potential climate
mitigation (emissions plus foregone sequestration) of avoided deforestation. We adopt the land values dataset of Nolte
(2020), representing the cost of purchasing land for conservation interventions based upon the fair market value for all
lands determined from analysis of 6 million actual land sales of properties greater than 1 acre from 2000 to 2019 across the
contiguous United States. The computation is simply land cost per area divided by potential climate mitigation per area. We
note that this analysis was outside the original grant scope and is presented as a courtesy to states, at their request, but may
benefit from additional analysis and refinement.

THIS PAGE: © Darrell Bodnar                                                                                         Avoided Deforestation 12
RESULTS AND DISCUSSION
3.1 Findings in This Study

States in the region saw a combined forest loss averaging about 9,500 hectares (23,500 acres) per year in the early 2000s,
committing 6 million metric tons of CO2e to the atmosphere each year (Table 4). Foregone sequestration contributed about
20% of the total carbon burden from avoided deforestation, with the remainder (80%) contributed by carbon emissions.
We emphasize in this section the results for the 2000s, being the more recent of the two decadal intervals that are studied,
but note that results from the 1990s are very similar in magnitude.

Forest losses are most densely concentrated around urban centers and their suburban sprawl fronts (Figure 2). However,
losses are widely spread, including across exurban landscapes where forests tend to have higher biomass (Figure 3) leading
to larger CO2e emissions impacts (Figure 4). Foregone sequestration is larger in areas with younger, lower biomass forests
(Figure 5). However, the largest CO2e mitigation opportunities are in areas with higher, present-day biomass (Figures 6 and
7). Carbon stocks are generally higher in older forests, while the amount of carbon stock added in a given year is higher in
younger forests (see growth curves in Figure 1).

The CO2e impact of forest conversions equates to 3% to 28% of the statewide carbon sequestration occurring within
forestlands remaining forestlands (Table 5). Variation across states is related more to the proportion of forestland being
converted than to the magnitude of carbon sequestration within forestlands.

The CO2e impact of forest conversions equates to 9% to 151% of the harvested wood products emissions resulting from
state-wide forest harvesting (Table 5). Variation across states is related to both the amount of forest harvesting in each state
and the amount of forest conversion. We note that the emissions from harvest removals extracted in a particular state do
not necessarily occur within that state given the way harvested materials and wood products cross state lines in response to
the locations of mills, markets, and even landfills.

The CO2e impact of forest conversions equates to about 2% of region-wide fossil fuel emissions across all sectors (Table 5),
but is as high as 7% in Maine and 5% in New Hampshire.

The cost per ton of CO2e associated with purchasing forestland to avoid deforestation varies widely (Figure 8), and is largely
driven by the cost of land.

We note that our maps of potential emissions, potential foregone sequestration, and the cost of mitigation show results for
the entire landscape, and that they do not account for things like protected lands or other lands that may not be at risk of
deforestation.

State-specific summaries are provided in Appendix A.

THIS PAGE: © Mark Godfrey/TNC                                                                                    Avoided Deforestation 13
Table 4. Carbon emissions, foregone carbon sequestration, and total carbon opportunity from
avoided
TABLE   4. deforestation  as well
           Carbon emissions,       as the
                              foregone     areasequestration,
                                        carbon  of forest converted
                                                                and totaltocarbon
                                                                            developed   or agricultural
                                                                                  opportunity           lands
                                                                                              from avoided     by
                                                                                                           deforestation as well as the
area of forest converted to developed  or agricultural lands by state in the  1990s and
state in the 1990s and 2000s. Emissions and foregone sequestration include 40 years of  2000s.  Emissions and foregone sequestration
include 40 years of committed emissions or lost removals resulting from a single year of forestland conversion, including emissions
committed emissions or lost removals resulting from a single year of forestland conversion,
from solid waste disposal sites.
including emissions from solid waste disposal sites.

          Carbon Emissions          Foregone Sequestration             Total Opportunity           Area Converted
         [MMT CO2e per year]          [MMT CO2e per year]             [MMT CO2e per year]           [ha per year]
          1990s     2000s              1990s        2000s              1990s      2000s            1990s      2000s
 ME        0.80      0.91               0.19         0.20               0.99        1.11           1,700      1,873
 NH        0.46      0.59               0.10         0.12               0.56        0.71            825       1,041
 VT        0.14      0.15               0.03         0.03               0.16        0.18            237        252
 NY        1.67      1.70               0.42         0.42               2.09        2.12           3,180      3,227
 MA        0.99      1.05               0.26         0.26               1.25        1.31           2,023      2,074
 CT        0.35      0.42               0.08         0.09               0.43        0.51            675        782
 RI        0.11      0.11               0.03         0.03               0.14        0.15            229        239
 All       4.52      4.94               1.11         1.15               5.62        6.08           8,869      9,490

Table   5. State-level assessment of forest area, annual average disturbed or converted area, carbon stocks and carbon fluxes
 TABLE 5. State-level assessment of forest area, annual average disturbed or converted area, carbon stocks and carbon fluxes
representative
 representative ofofthe
                      the2000s.
                           2000s.Estimates
                                    Estimates  are drawn
                                           are drawn       from
                                                     from the    the NFCMS
                                                              NFCMS    platform platform   which
                                                                                which serves      serves
                                                                                             as the       as this
                                                                                                    base for the study,
                                                                                                                  base for  this study,
                                                                                                                         augmented    by augmented b
this  study’sestimation
 this study’s  estimation    of the
                          of the areaarea
                                      and and emissions
                                          emissions       associated
                                                    associated         withtoforest
                                                               with forest          to non-forest
                                                                              non-forest           conversions.
                                                                                         conversions.              Cumulative
                                                                                                      Cumulative HWP     emissionsHWP
                                                                                                                                    from emissions fro
 total harvest
total  harvestand
                andfrom
                     from conversion-derived harvest
                            conversion-derived       have the
                                                  harvest     same
                                                            have  theassumptions  regardingregarding
                                                                      same assumptions      wood products
                                                                                                       woodfates  and include
                                                                                                              products    fatesthe same
                                                                                                                                 and include the same
 40 year time horizon.
year time horizon.
                                                     ME         NH          VT        NY        MA          CT         RI              All
 Area [thousands of hectares]
 Forestland*                                     7,469.9 2,141.8 2,004.1 8,825.0 1,631.0 1,005.5                   199.2       23,276.5
 Annual Disturbed Forest*                          808.0   144.3    55.9   307.1    75.4    36.7                     1.0        1,428.4
 Annual Conversion to Agri. or Devel. #              1.9     1.0     0.2     3.2     2.1     0.8                     0.2            9.4

 C Stocks in Forests [MMT C]
 Live Biomass†                                       558        215       201        851        164        103         18          2,110
 Forest Carbon†                                    1,399        496       477      2,030        361        220         39          5,022

 C Fluxes [MMT CO2e per year]
 Carbon Sequestration in Forestlands†              -16.0       -5.2       -5.3     -25.0       -4.6       -3.1       -0.7          -59.9
 Harvest Removals from Forests†                     11.0        2.4        0.9       4.4        0.9        0.5        0.1           20.2
 Harvest HWP Cumulative Emissions†                  11.8        2.5        1.0       4.7        0.9        0.4        0.1           21.4
 Conversion Cumulative Burden#                       1.1        0.7        0.2       2.1        1.3        0.511      0.2            6.1
 Fossil Fuel Emissions All Sectors§                 15.3       14.5        6.2     172.2       64.7       38.2       11.7          322.8

 C Flux Ratios
 Conversion Burden / C Sequestration                  7%       14%         3%         8%       28%        16%       22%             10%
 Conversion Burden / Harvest Emissions                9%       28%        18%        45%      151%       116%      136%             10%
 Conversion Burden / Fossil Fuel Emissions            7%        5%         3%         1%        2%         1%        1%             28%
Sources: *NAFD; †NFCMS; #this study; §EPA (2020) for the year 2018

                                                                                                                        Avoided Deforestation 14
Forest loss to agriculture & development
% converted from 2000 to 2009
0%
0.1% - 2.5%
2.6% - 5%
5.1% - 7.5%
7.6% - 10%
Greater than 10%
0 25 50 100
Miles °
FIGURE 2. Forest loss to agriculture and development from 2000 to 2009 within 990 m x 990 m pixels as percent of total forest
in 1999.
Avoided Deforestation 15Aboveground carbon stock
Metric tons of CO2e per acre
Less than 35
35-55
55-75
75-95
95-115
115-135
Greater than 135
0 25 50 100
Miles °
FIGURE 3. Above ground carbon stocks, expressed in metric tons of CO2e per acre, smoothed from the original dataset with focal
statistics that average over a 1 km x 1 km block. The highest value in the original, 30 m resolution map is 210 metric tons of CO2e
per acre.
Avoided Deforestation 16Potential carbon emissions
Metric tons of CO2e per acre over 40 years
33 - 170
171 - 200
201 - 230
231 - 260
261 - 290
291 - 354
0 25 50 100
Miles °
FIGURE 4. Potential CO2e emissions from forest to non-forest conversion of present-day forestland.
Avoided Deforestation 17Potential foregone carbon sequestration
Metric tons of CO2e per acre over 40 years
0 - 12.5
12.6 - 25
25.1 - 50
50.1 - 98.3
0 25 50 100
Miles °
FIGURE 5. Potential foregone carbon sequestration from forest to non-forest conversion accumulated over 40 years from
present-day conditions with a grow-only scenario, smoothed from the original dataset with focal statistics that average over
a 1 km x 1 km block.
Avoided Deforestation 18Potential carbon emissions
Metric tons of CO2e per acre over 40 years
33 - 170
171 - 200
201 - 230
231 - 260
261 - 290
291 - 354
0 25 50 100
Miles °
FIGURE 6. Total CO2e burden from emissions and foregone sequestration that would result from forest to non-forest conversion and
accumulated over 40 years.
Avoided Deforestation 19Adirondack Mountains, New York Kennebec Valley, Maine
Aboveground carbon stock
Metric tons of C02e
per acre
Less than 35
35-55
55-75
75-95
95-115
115-135
Greater than 135
Potential carbon emissions
Metric tons of C02e
per acre over 40 years
33 - 170
171 - 200
201 - 230
231 - 260
261 - 290
291 - 354
carbon sequestration
Potential foregone
Metric tons of C02e
per acre over 40 years
0.95 - 12.5
12.51 - 25
25.01 - 50
50.01 - 121.6
0 2.5 5
Miles
°
ME
^
VT
NY
^ NH
MA
RI
CT
FIGURE 7. Example regions of interest displaying fine-scale detail and correspondences of carbon stocks, potential carbon emissions,
and potential foregone sequestration.
Avoided Deforestation 20Cost of climate mitigation from avoided deforestation
$ per metric ton of CO2e
Under $10
$10-25
$25-50
$50-100
$100-500
Over $500
0 25 50 100
Miles °
FIGURE 8. Cost of mitigation, in US Dollars per metric ton of CO2e, that could be achieved by avoiding deforestation of present-day
forestland. The cost per acre is derived from the detailed conservation land values described by Nolte (2020).
Avoided Deforestation 213.2 Comparisons to Other Estimates
The state-level forest conversion rates we estimate agree well with those obtained from the NLCD (Table 6), both on an area
basis and as a percent of initial forested area. Disagreement is largest for Maine where active forest harvesting and, in some
cases, slower forest regrowth, can make it challenging to confidently map forest losses. Conversion rates also agree well
with the Losing Ground 6 (LG6) dataset for Massachusetts (Pasquarella and Holden 2019), a dataset that offers a powerful
point of comparison because it has involved a sophisticated land cover change detection algorithm (Zhu and Woodcock
2014) as well as detailed training and validation. The LG6 dataset was obtained through our correspondences with the New
England Landscape Futures (NELF) team centered at the Harvard Forest, who have provided valuable points of comparison
throughout this study.
State-level forest area, forest carbon stocks, net CO2 exchange with the atmosphere, harvest removals, and forest to non-
forest conversion rates compare favorably between this report’s results and those reported by the US Forest Service (Table
7). Our NFCMS estimates tended to be higher than for the USFS for forest area (5% to 37%), aboveground biomass (12%
to 29%) and total ecosystem carbon (0% to 18%), but were generally lower for carbon sequestration (i.e. net CO2 exchange
with the atmosphere), though not for ME. Harvest removals are generally close in magnitude but somewhat higher than
those reported by the USFS. Conversion emissions are also generally close in magnitude with a slight tendency for larger
emissions estimated by the USFS. This high degree of agreement overall is almost surprising given widely differing methods,
and we think this lends a certain degree of credibility to both.
TABLE 6. Average annual forest loss per year in the 1990s and 2000s by state, with estimates from a range of data products.
Table 6. Average annual forest loss per year in the 1990s and 2000s by state, with estimates from a range of data products.
ME NH VT NY MA CT RI
Forestland [1000s of ha] 7,469.9 2,141.8 2,004.1 8,825.0 1,631.0 1,005.5 199.2
1990 to 1999
hectares per year
NAFD 1,701 825 237 3,180 2,023 675 229
LG6 -- -- -- -- 1,388 -- --
percent per year
NAFD 0.02 0.04 0.01 0.04 0.13 0.07 0.12
LG6 -- -- -- -- 0.10 -- --
2000 to 2009
hectares per year
NAFD 1,873 1,041 252 3,227 2,074 783 239
NLCD 371 716 110 2,093 2,132 1,011 242
LG6 -- -- -- -- 1,880 -- --
percent per year
NAFD 0.03 0.05 0.01 0.04 0.14 0.08 0.13
NLCD 0.01 0.04 0.01 0.03 0.19 0.13 0.17
LG6 -- -- -- -- 0.14 -- --
Sources: NAFD is for this study, NLCD is estimated from conversion of any forest to the same agriculture and developed classes a
Sources: NAFD is for this study, NLCD is estimated from conversion of any forest to the same agriculture
used to filter and screen NAFD disturbances to select those involving conversion as described in the methods section.
and developed classes as used to filter and screen NAFD disturbances to select those involving conversion as
described in the methods section.
Avoided Deforestation 22TABLE 7. Comparison of NFCMS and USFS reported forest areas, carbon stocks, harvest removals, and conversion emissions by
state and representative of 2010.
Table 7. Comparison of NFCMS and USFS reported forest areas, carbon stocks, harvest removals, and conversion emissions by
and representative of 2010.
ME NH VT NY MA CT RI
Forested Area [1000s of hectares]
This Report 7,470 2,142 2,004 8,825 1,631 1,006 199
USFS RU FS-227 7,114 1,925 1,826 7,643 1,224 732 150
Live Biomass [MMT C]
This Report 563 216 209 891 170 107 19
USFS RU FS-227 407 162 159 636 121 71 14
Aboveground Biomass [MMT C]
This Report 383 151 149 640 121 77 13
USFS RU FS-227 339 135 133 533 101 60 12
Total Carbon [MMT C]
This Report 1,405 502 488 2,081 370 226 40
USFS RU FS-227 1,399 468 460 1,853 313 183 37
Carbon Sequestration [MMT CO2e y-1]
This Report 15.3 4.6 4.9 23.9 4.3 2.8 0.7
USFS RU FS-227 11.7 5.5 5.9 24.2 4.8 2.9 0.4
Harvest Removals during the 2000s [MMT CO2e y-1]
This Report 11.0 2.4 0.9 4.4 0.9 0.5 0.1
USFS RPA 2001, 2006, 2011 average 10.0 1.8 1.4 3.4 0.3 0.2 0.04
Conversion Emissions during the 2000s [MMT CO2e y ]
-1
This Report 1.1 0.7 0.2 2.1 1.3 0.5 0.2
USFS RU FS-227 1.5 0.8 0.9 3.1 0.7 0.4 0.1
Sources: USFS RU FS-2227 (Domke et al. 2020)
Avoided Deforestation 233.3 Additional Considerations Regarding Scope, Use and Reliability This study did not consider the additional climate impacts caused by changes in surface albedo imposed by forest to non-forest conversion. The surface albedo effect tends to cause a net cooling that opposes the net warming effect from carbon emissions and foregone sequestration (Williams et al. 2021a). The magnitude of this cooling varies geographically depending on the local climate and the specific land cover conversion that occurred, but in the northeastern U.S. it typically amounts to about one quarter to one third of the net warming effect from the carbon burden ((Williams et al. 2021a) see supplement Figure S12). This study does not explore how states, NGOs, or other agents might design policy, market or regulatory mechanisms to facilitate avoidance of forest loss in the region. The map we provide displaying the cost per tonne of CO2 mitigation may provide useful information as context. We note, however, that there may be several additional considerations important to such a cost assessment. For example, it is conceivable that there would be costs associated with buying out land uses foregone due to land conservation. Also, there is the challenge of “leakage” whereby conservation in one area displaces property development or use to another area. Furthermore, there could be financial value associated with additional ecosystem service benefits of preserving forestland and its natural capital, including enhanced biodiversity, clean air, clean water, healthy soils, and others. These and other considerations are beyond the scope of the current study but surely relevant to associated decision making, land management, and policy design. This study does not predict the locations of future forest conversions but rather uses the recent past as an indicator of the expected size of the climate mitigation opportunity from avoiding forest losses. The forest losses we detected for the 1990s and 2000s provide an initial baseline which serves as a useful reference point. While forests today are facing new threats from novel and expanding pests and pathogens (e.g. Williams et al. 2016), new centers of urban to exurban development, and new land uses such as solar farms, the baseline results presented in this study still provide a valuable benchmark for the size of the opportunity which seems poised to grow rather than shrink with these new threats. Users are encouraged to apply other sources of information about threats to forestland as available, for example from permitting and zoning databases. Our maps of the potential CO2e emissions and foregone sequestration readily enable users to explore the climate impacts of future forest losses wherever they may occur. As a simplified example, our datasets and findings could be used as a look-up table for non-spatial accounting of potential emissions and foregone sequestration associated with deforestation in the region. This study’s grow-only scenario estimates the potential sequestration within forests if they are able to continue to mature with tree-level but not stand-clearing disturbance events. While forests are of course vulnerable to a wide range of natural disturbances, such as windthrow and insect outbreaks, the impacts of these disturbances on stand-level biomass are partially embedded within the FIA yield curves used in this study to train the forest carbon cycle model. A trend of increasing natural disturbances would jeopardize not only the future sequestration but even the current carbon stocks contained within forests. This study did not attempt to assess the impacts of such a trend. Instead we simply underscore that this is an additional pathway by which contemporary carbon stocks and future carbon uptake could be impaired. This study reports potential CO2e emissions from biomass removed during forest conversion as it enters the harvested wood products stream, which we understand to be the typical fate. Some of the associated emissions will occur in other accounting sectors such as energy or waste, and users should think carefully about attribution to avoid double counting. We cannot make a general recommendation for how to address this because the design of a seamless solution will vary by application and accounting system. If desired, it should be possible to use the information provided in this report to parse the total emissions into portions occurring within forestlands, as fuelwood at wood processing facilities or elsewhere, and from landfills. THIS PAGE: © Lauren Owens Lambert Avoided Deforestation 24
We note that our analysis is based on satellite imagery (such as NAFD, NBCD, NLCD) and field plot data (USFS FIA) that
are updated consistently over time. The datasets and conclusions reported here can be validated and extended over time
as more recent data on land use and cover change and on forest growth and carbon stocks become available. Similarly, for
individual states or regions that have LiDAR or other satellite datasets, a new forest carbon stock (biomass) base layer can
be substituted for our biomass layer to generate additional estimates.

Map outputs from this study may include pixels that are presently not forested, and users should consider filtering our
datasets to remove such areas. This is particularly important in areas with significant recent development, as well as on
forest edges adjacent to non-forest land cover types. Our NAFD-derived forest extent tends to over-estimate forested area,
as we have shown in the report. This is partly because we include all 30 m pixels marked as forest in the year 1986 of the
NAFD dataset as forested in 2010 without removal of forests that may have been lost. We recommend screening of our
datasets with the NLCD 2016 or more recent land cover dataset for a more conservative filtering and removal of areas that
may presently be non-forest.

Application of this study’s maps represent an average expectation within strata of a given forest type group, site productivity
class, and stand age. While the maps were initialized with information derived from satellite remote sensing with methodical
training on in situ field data, there is inevitably a smoothing to the mean in such applications. Individual tracts of land
may have more or less forest carbon or growth potential than can be captured with state-of-the-science methods applied
over large areas such as in this study. Users are encouraged, whenever possible, to blend our data with local information,
whether from the field, aerial photography, higher resolution remote sensing, or another source to spot-check and correct the
estimates provided here.

While we hope that our data are useful to a range of audiences, the focus of the US Climate Alliance is on providing technical
assistance and resources to states, and our primary audience in this work was state agency staff and decision-makers.
We worked closely with staff from various states’ natural resources and environmental agencies throughout the course of
this grant, including by receiving support letters from six of the seven New England and New York states at the time of the
grant application. States expressed a need for more accessible and customized presentations of forest carbon stock and
sequestration data, and shared their frustration with the difficultly in comparing across data sets from different sources. We
have included in Appendix A paraphrased excepts from the support letters each state provided for this grant, as a starting
point for how states might use the products of this report.

The questions from New England and New York echo those we have heard in work across the country, compiled into the
six questions below. While this project does not provide answers to all of these questions, bold text indicates maps or data
provided here that can provide partial answers.

1. What is the current carbon stock, how much is protected, and where would additional protection be most effective?

2. What is the current rate of C sequestration, how big is the unfilled C stock potential, and will it be sustained?

3. What is the baseline rate of forest loss and associated carbon emission?

4. What is the cost of implementation and are there significant savings from co-benefits?

5. How big are the risks from natural disturbances, leakage, etc.?

6. Can we measure policy success over time? How exactly?

We appreciate the time and thoughtful questions and suggestions from all of the New England and New York states,
especially through meetings at the US Climate Alliance Regional Learning Lab in Rhode Island in 2019 and through the New
England Landscape Futures Working Group meeting in 2020. The final maps, data tables, incorporation of a subset of our
data into The Nature Conservancy Resilient Land Mapping Tool, and associated communications tools are better because
of this collaboration, and we’ve worked to make them useable in informing future land use and climate change actions and
programs. There will likely be continued needs for technical assistance, and we are looking forward to continuing to work to
refine, update, and communicate our results as states’ needs change over time.

                                                                                                                Avoided Deforestation 25
SOURCE DATA SETS
FIA Forest Inventory and Analysis
https://apps.fs.usda.gov/Evalidator/evalidator.jsp
NAFD North American Forest Dynamics Project: Forest Disturbance and Regrowth Data
http://dx.doi.org/10.3334/ORNLDAAC/1077
NFCMS National Forests Carbon Monitoring System
https://doi.org/10.3334/ORNLDAAC/1829
NLCD National Land Cover Database
https://www.mrlc.gov/
TPO Timber Product Output
http://srsfia2.fs.fed.us/php/tpo_2009/tpo_rpa_int1.php
FUNDING SOURCES
AND OTHER ACKNOWLEDGMENTS
This work was funded by the Doris Duke Charitable Foundation through the United States Climate Alliance Grant
Program for Natural and Working Lands Research, and by The Nature Conservancy in Massachusetts. The mission of the
Doris Duke Charitable Foundation is to improve the quality of people's lives through grants supporting the performing
arts, environmental conservation, medical research and child well-being, and through preservation of the cultural and
environmental legacy of Doris Duke's properties. The US Climate Alliance grant program was developed to assist states
in obtaining data and other tools to quantify and act on the opportunity presented by natural and working lands to reduce
and remove greenhouse gas emissions. We appreciate the state agency staff who asked questions and provided feedback
throughout the grant term. The authors acknowledge Harvard Forest’s New England Landscape Futures Program for
funding a Working Group of state agency staff to discuss shared goals and data and communication needs around avoided
deforestation. A Working Group summary is available here: https://tnc.box.com/s/0ee6x62kwccbdmyjguiwtze7vr50ev0l.
We acknowledge Dr. Laura Marx of The Nature Conservancy for major contributions throughout the project as the lead grant
coordinator, the lead coordinator of communications outreach and extension, as well as for intellectual input to the scientific
and technical aspects of the work. We also acknowledge the help of The Nature Conservancy’s Stephen Lloyd and Kevin
Ruddock for creating the maps included in this report.
Avoided Deforestation 26REFERENCES
Campbell, C., J. Seiler, P. Wiseman, B. Strahm, and
J. Munsell. 2014. Soil Carbon Dynamics in
Residential Lawns Converted from Appalachian
Mixed Oak Stands. Forests 5:425.
Domke, G. M., B. F. Walters, D. J. Nowak, J. E. Smith,
S. M. Ogle, J. W. Coulston, and T. C. Wirth. 2020.
Greenhouse gas emissions and removals from forest
land, woodlands, and urban trees in the United
States, 1990-2018. Resource Update FS-227. U.S.
Department of Agriculture, Forest Service, Northern
Research Station, Madison, WI,
https://doi.org/10.2737/FS-RU-227.
EPA. 2020. Inventory of U.S. Greenhouse Gas
Emissions and Sinks 1990-2018. U.S. Environmental
Protection Agency, Washington, D.C. April 2019.
EPA 430-R-18-003.
Goward, S. N., C. Huang, F. Zhao, K. Schleeweis, K.
Rishmawi, M. Lindsey, J. L. Dungan, and A.
Michaelis. 2015a. NACP NAFD Project: Forest
Disturbance History from Landsat, 1986-2010.
ORNL DAAC, Oak Ridge, Tennessee, USA. http://dx.doi.org/10.3334/ORNLDAAC/1290.
Goward, S. N., C. Huang, F. Zhao, K. Schleeweis, K. Rishmawi, M. Lindsey, J. L. Dungan, and A. R. Michaelis. 2015b. NACP
NAFD Project: Forest Disturbance History from
Landsat, 1986-2010. ORNL Distributed Active Archive Center.
Gu, H., C. A. Williams, B. Ghimire, F. Zhao, and C. Huang. 2016. High-resolution mapping of time since disturbance and forest
carbon flux from remote sensing and inventory data to assess harvest, fire, and beetle disturbance legacies in the
Pacific Northwest. Biogeosciences 13:6321-6337.
Gu, H., C. A. Williams, N. Hasler, and Y. Zhou. 2019a. The Carbon Balance of the Southeastern U.S. Forest Sector as Driven by
Recent Disturbance Trends. Journal of Geophysical Research: Biogeosciences 124:2786-2803.
Gu, H., C. A. Williams, N. Hasler, and Y. Zhou. 2019b. Forest Carbon Stocks and Fluxes After Disturbance, Southeastern USA,
1990-2010. ORNL Distributed Active Archive Center.
Homer, C., J. Dewitz, S. Jin, G. Xian, C. Costello, P. Danielson, L. Gass, M. Funk, J. Wickham, S. Stehman, R. Auch, and K.
Riitters. 2020. Conterminous United States land cover change patterns 2001–2016 from the 2016 National Land
Cover Database. ISPRS Journal of Photogrammetry and Remote Sensing 162:184-199.
Huang, C., S. N. Goward, J. G. Masek, F. Gao, Vermote, E.F., N. Thomas, K. Schleeweis, R. E. Kennedy, Z. Zhu, J. C. Eidenshink,
and J. R. G. Townshend. 2009a. Development of time series stacks of Landsat images for reconstructing forest
disturbance history. International Journal of Digital Earth 2:195-218.
Huang, C., S. N. Goward, J. G. Masek, N. Thomas, Z. Zhu, and J. E. Vogelmann. 2010. An automated approach for
reconstructing recent forest disturbance history using dense Landsat time series stacks. Remote Sensing and the
Environment 114:183-198.
Huang, C., S. N. Goward, K. Schleeweis, N. Thomas, J. G. Masek, and Z. Zhu. 2009b. Dynamics of national forests assessed
using the Landsat record: Case studies in eastern U.S. Remote Sensing and the Environment 113:1430-1442.
Kellndorfer, J., W. Walker, K. Kirsch, G. Fiske, J. Bishop, L. LaPoint, M. Hoppus, and J. Westfall. 2013. NACP Aboveground
Biomass and Carbon Baseline Data, V. 2 (NBCD 2000), U.S.A., 2000. Dataset Available on-line [http://daac.ornl.gov]
from ORNL DAAC, Oak Ridge, Tennessee, U.S.A. http://dx.doi.org/10.3334/ORNLDAAC/1161.
Milesi, C., S. W. Running, C. D. Elvidge, J. B. Dietz, B. T. Tuttle, and R. R. Nemani. 2005. Mapping and Modeling the
Biogeochemical Cycling of Turf Grasses in the United States. Environmental Management 36:426-438.
Myhre, G., D. Shindell, F.-M. Bréon, W. Collins, J. Fuglestvedt, J. Huang, D. Koch, J.-F. Lamarque, D. Lee, B. Mendoza, T.
THIS PAGE: © Lauren Owens Lambert Avoided Deforestation 27You can also read