Local Communities' Attitudes and Support Towards the Kgalagadi Transfrontier Park in Southwest Botswana - MDPI

Page created by Marshall Juarez
 
CONTINUE READING
Local Communities' Attitudes and Support Towards the Kgalagadi Transfrontier Park in Southwest Botswana - MDPI
sustainability

Article
Local Communities’ Attitudes and Support Towards
the Kgalagadi Transfrontier Park in
Southwest Botswana
Naomi Moswete 1 , Brijesh Thapa 2, *                    and William K. Darley 3
 1    Department of Environmental Science, University of Botswana, Gaborone 00704, Botswana;
      MOATSHEN@mopipi.ub.bw
 2    Department of Tourism, Hospitality and Event Management, University of Florida, Gainesville, FL 32611,
      USA
 3    College of Business and Innovation, University of Toledo, Toledo, OH 43606, USA; wd4361@gmail.com
 *    Correspondence: bthapa@hhp.ufl.edu; Tel.: +1-352-294-1656
                                                                                                            
 Received: 16 January 2020; Accepted: 12 February 2020; Published: 18 February 2020                         

 Abstract: Protected areas are of national importance and have developed into sources of benefits
 while in other situations have sparked conflicts among stakeholders, including residents from
 adjacent local communities, and park authorities. In this study, we examined community residents’
 attitudes towards the Kgalagadi Transfrontier Park (KTP) in the Kalahari region (SW Botswana).
 This study assessed factors that influence support for, or opposition to, the KTP. A questionnaire
 with semi-structured questions was used to gather information from head of households (N = 746)
 in nine villages in the Kalahari region. Overall, positive attitudes and support for the KTP as
 a transfrontier park were documented, though tangible benefits were limited. Further based on
 analyses, literacy, proximity, and employment status were key variables that influenced support.
 In addition, any increase in residents’ perceived benefits, land ownership, conservation awareness,
 and local benefits resulted in increased support for KTP. The implications indicated that communities
 near the KTP (Botswana side) need to be consulted, while further communications between the
 KTP management and authorities and adjacent villages are required to initiate effective community
 conservation programs. Additional programs and community outreach initiatives would also enable
 positive attitudes and support of KTP.

 Keywords: conservation; Transboundary Park; residents; attitudes; Kalahari; southern Africa

1. Introduction
     Parks and protected areas are generally associated with benefits and related values (monetary,
pride) by local residents due to improved quality of the environment, and other social and economic
benefits including employment [1–10]. However, local residents’ attitudes towards protected areas
in the developing world have been mixed [1,3,11–17]. Research has identified various factors that
influence negative attitudes such as, human-wildlife conflict [14,18–22], land claims [23–25], restrictive
policies and access regulations to collect non-timber forest products (e.g., nuts, wild mushrooms,
berries, seeds, medicinal plants and herbs, etc.), and livestock grazing [18,24,26–30]. Conversely,
positive attitudes have been influenced by community and personal economic benefits largely derived
from tourism [4,22,31–37]. As evident, there are challenges faced by stakeholders (i.e., local residents,
resource managers, park authorities, tourism planners, developers, and conservation organizations)
with respect to the balance of conservation priorities and livelihood needs [7,38–42].
     In general, rural people in developing countries experience hardships and have had difficulties
with minimal resources due to climate change, limited agricultural production as a result of

Sustainability 2020, 12, 1524; doi:10.3390/su12041524                             www.mdpi.com/journal/sustainability
Local Communities' Attitudes and Support Towards the Kgalagadi Transfrontier Park in Southwest Botswana - MDPI
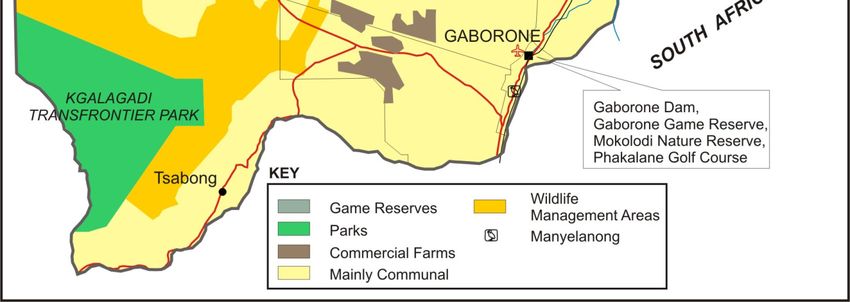
Sustainability 2020, 12, 1524                                                                        2 of 17

unreliable rainfall and recurring droughts, and population growth in villages flanking protected
areas [6,10,13,21,26,34,43–47]. In southern Africa, livelihood activities with sole dependence on
forest and rangeland resources have caused, and in some instances, exacerbated soil and land
degradation [48,49]. Subsequently, instances of conflicts over natural resource use between different
stakeholders that include park authorities and adjacent local communities [15,24,50–52] have also
fueled unsustainable livelihood activities such as illegal hunting, overharvesting of rare species of flora
and fauna [32]. In response, rural communities have resorted to new livelihood ventures, such as
park-based community ecotourism and wildlife safaris enterprises in the form of Community-based
Organizations (CBOs) or Trusts near or in Protected Areas (PAs) [5,47,52–55]. In Botswana, the
government has introduced the concept of community based natural resource management (CBNRM)
and community based organization (CBOs) (e.g., wildlife based Trusts) as a strategy to diversify
rural livelihoods and reduce competition for the same resources among stakeholders [24,49]. It is
through such initiatives that rural communities are encouraged to establish CBOs (Trusts) to develop
community-based tourism enterprises from which they collectively plan, make decisions, manage and
operate tourism enterprises and share benefits [5,56,57].
     Thus, many rural communities especially those found in or near resource rich (i.e., fauna, flora,
and cultural-heritage) protected areas have formed CBOs/Trusts which are comprised of one or several
villages with equal rights of ownership and management. For instance, local residents of Khwai,
Sankuyo and Mababe villages in the Okavango Delta region were found to benefit from ecotourism
ventures via their CBOs/Trusts [54]. In the southern Kalahari region, marginalized communities with
CBOs/Trusts accrued benefits from ecotourism activities tied to wildlife in PAs [33,47,58]. Likewise,
residents of Khawa village and Ngwatle, Ukhwi and Ncaang settlements, all are located in the Wildlife
Management Areas (WMAs) derived benefits from CBNRM - safari hunting operations through their
CBOs/Trusts [56]. WMAs are areas reserved by the government for wildlife uses and other conservation
activities. Permitted land uses are for consumptive or non-consumptive wildlife utilization. These
areas are situated in the buffer zones of PAs and mitigate land uses conflicts, and are used for migratory
corridors for wildlife [59].
     Overall, tourism activities that occur in all types of protected areas create opportunities (e.g.,
tour guides, entrepreneurial activities (e.g., beadwork for souvenirs)) as well as lead to increased
competitiveness as destinations [3,5,35,36,60,61]. Hence, it is important that local people are actively
involved in all spheres of decision-making with regards to community-based ventures [33,37,62], and
conservation of resources (i.e., fauna, flora, and cultural heritage) [7,53,63].
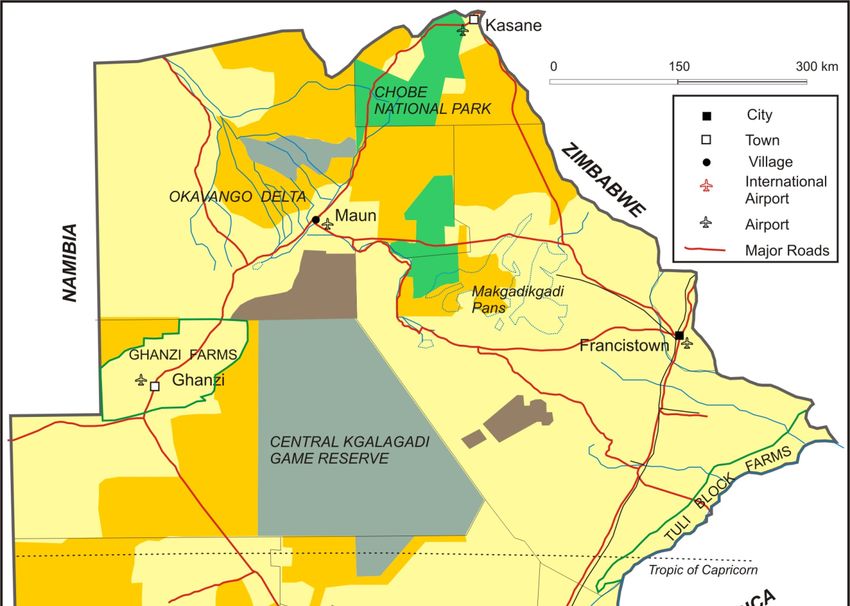
2. Site Context
      The southwest Kalahari region is popularly known for and is associated with the Kgalagadi
Transfrontier Park (KTP) that is conterminous with Botswana and South Africa (see Figure 1). KTP
is the first transboundary protected area to be created in southern Africa [48,64,65], and has become
important for conservation as well as sources of livelihood for local people that reside within or adjacent
to it [5,7,41,52,58]. In Botswana, national parks and game reserves were created to safeguard and
maintain wildlife resources, preserve biodiversity, integrate conservation and development activities,
foster ecological education and promote park-based tourism to benefit environmental resources and
people [41,66,67]. The government’s commitment to conservation and preservation of the natural and
cultural resource base, and the promotion of sustainable utilization of such assets are evident [29,68].
The protection and preservation of wildlife resources inside and/or in the Wildlife Management Areas
(WMAs) or buffer zones of PAs have created increased numbers of wild animals in some parts of
Botswana [69]. There has also been benefits in terms of improved grass cover and biomass for wild
animals and for grazing domesticated animals—goats and sheep. It is also in these WMAs that local
people have established CBOs through which they venture in tourism—e.g., photographic tourism
and community camping sites for wilderness or nature-based tourists.
Agriculture in the Kgalagadi region only benefits a number of small to medium scale commercial
farmers [48,64,71], and there is over exploitation of tree resources, especially adjacent to villages and
settlements [39,47,72]. Thus, recent recommendations include the necessity for alternative livelihoods
in which rural
Sustainability       people
               2020, 12, 1524 could use rangeland in a sustainable manner to benefit themselves and 3 ofthe
                                                                                                         17
environment [29,32,41,50].

         Figure
      Figure 1. 1.Map
                   MapofofBotswana
                           Botswana depicting
                                     depicting Wildlife
                                               Wildlife Management
                                                        ManagementAreas
                                                                      Areas(WMAs)
                                                                            (WMAs)andandthethe
                                                                                             location of of
                                                                                                location
                  Kgalagadi Transfrontier
      Kgalagadi Transfrontier              Park
                               Park (KTP) in    (KTP) inBotswana
                                             southwest   southwest Botswana
                                                                 (P.G.       (P.G. Koorutwe).
                                                                       Koorutwe).

      Additionally,
      In               the Kgalagadi,
         the case of the    Kgalagadi region
                                           studieshas  high
                                                     have    unemployment
                                                          identified               along with
                                                                         that rangelands    havelimited   opportunities
                                                                                                    supported               to
                                                                                                                  a diversity
initiate
of        income
    wildlife   andgenerating
                     livelihoodactivities
                                   activities[47].
                                                 suchThe
                                                       as KTP
                                                           game  offers   opportunities
                                                                    ranches    (Tsabong,toMaubelo
                                                                                              further capitalize      on and
                                                                                                          and Maralaleng
developTrust/CBO
villages    community-based
                        located inecotourism      initiativessouth)
                                     Tsabong, Kgalagadi        [32,33,47,61].    The recent
                                                                        [32], subsistence      emphasis
                                                                                            hunting,    andon    sustainable
                                                                                                             gathering    [70].
ecotourism initiatives
Agriculture                 demands
                in the Kgalagadi         that local
                                      region    onlypeople’s
                                                      benefitsinvolvement
                                                                a number ofin       tourism
                                                                                  small      ventures,
                                                                                         to medium         especially
                                                                                                         scale          those
                                                                                                                commercial
that reside
farmers        in or near
           [48,64,71], and PAs
                             therebe    increased,
                                    is over           particularly
                                              exploitation   of tree among      theespecially
                                                                       resources,    most affected      [16,29].
                                                                                                 adjacent          Given and
                                                                                                            to villages    the
importance [39,47,72].
settlements    in the establishment
                            Thus, recent  of the KTP for transboundary
                                             recommendations       include the conservation,
                                                                                   necessity forlocal  residents
                                                                                                   alternative      have also
                                                                                                                 livelihoods
had
in     expectations
   which     rural peoplefor could
                               development
                                     use rangelandopportunities       for their
                                                        in a sustainable      mannerrespective
                                                                                        to benefit communities
                                                                                                      themselves and  [48,65].
                                                                                                                           the
Additionally,[29,32,41,50].
environment       there is limited research that pertains to conservation, tourism, and local communities
adjacent    to PAs inthe
      Additionally,      southwestern
                            Kgalagadi regionBotswana    [19,32,33,47].
                                                   has high  unemployment  Hence,along
                                                                                    the purpose      of this
                                                                                          with limited        study was to
                                                                                                          opportunities
examineincome
initiate    local communities’      attitudes[47].
                    generating activities        andThe
                                                      support
                                                          KTP towards        the Kgalagadi
                                                                 offers opportunities         Transfrontier
                                                                                           to further            Park.onMore
                                                                                                         capitalize       and
specifically,
develop         to identify factors
            community-based            which influence
                                   ecotourism              the[32,33,47,61].
                                                  initiatives   level of support  Theorrecent
                                                                                         opposition
                                                                                              emphasis of KTP.    This study
                                                                                                            on sustainable
only focusedinitiatives
ecotourism       on communities
                            demands   onthat
                                          the local
                                               Botswana   sideinvolvement
                                                     people’s    of KTP due to   inthe  paucity
                                                                                    tourism       of research.
                                                                                             ventures,           Additional
                                                                                                           especially   those
information
that  reside in about  the South
                   or near   PAs beAfrican      perspective
                                       increased,            has been
                                                     particularly    amongdetailed   elsewhere
                                                                               the most           [7,25,30,58,70].
                                                                                           affected    [16,29]. Given the
importance in the establishment of the KTP for transboundary conservation, local residents have also
3. Methods
had  expectations for development opportunities for their respective communities [48,65]. Additionally,
there is limited research that pertains to conservation, tourism, and local communities adjacent to
3.1. Study
PAs          Site
     in southwestern       Botswana [19,32,33,47]. Hence, the purpose of this study was to examine local
communities’      attitudes
      The Kgalagadi region    andissupport
                                    known for  towards   the Kgalagadi
                                                  its unique,                Transfrontier
                                                              large and relatively           Park.
                                                                                        pristine     More specifically,
                                                                                                   ecosystem,    with large-to
identify   factors which
scale migratory      routesinfluence
                              for wild the     level ofand
                                           ungulates    support    or opposition
                                                             predatory      mammalian of KTP.  This study
                                                                                           carnivores.     Theonly   focused
                                                                                                                  region   has
on  communities      on  the Botswana      side  of KTP  due  to  the    paucity  of research.   Additional
desert features such as salt pans, calcrete rimmed fossil valleys, and undulating and crisscrossing             information
about   the South
sand dunes           Africanthroughout
                 scattered     perspective its haslandscape
                                                   been detailed     elsewhere [7,25,30,58,70].
                                                                [41,48,59,65,72].     The attractiveness of southern
Kalahari and the greater KTP includes unique natural attractions—birdlife and social weaver nests.
3. Methods
Other desert tourism attractions include cultural heritage with ethnic songs, music, dances,
traditions, local food, poetry, folklore, handicrafts, religion, language, and traditional costumes [47].
3.1. Study Site
The study site is distinctive as it boasts of unspoiled wilderness, desert-adapted wildlife (e.g.,
      The Kgalagadi
elephants),           region isofknown
             and handicrafts              for its Kalahari
                                   the diverse    unique, large
                                                           peopleand relatively
                                                                   that include pristine ecosystem,
                                                                                San/Basarwa,        with
                                                                                               BaHerero,
large-scale migratory  routes for wild  ungulates   and predatory  mammalian   carnivores. The region
BaKgalagadi, and many others [47,73]. The architecture of dwellings is unique, and is an attraction   has
desert features such as salt pans, calcrete rimmed fossil valleys, and undulating and crisscrossing sand
dunes scattered throughout its landscape [41,48,59,65,72]. The attractiveness of southern Kalahari
and the greater KTP includes unique natural attractions—birdlife and social weaver nests. Other
desert tourism attractions include cultural heritage with ethnic songs, music, dances, traditions,
Sustainability 2020, 12, 1524                                                                                            4 of 17

local food, poetry, folklore, handicrafts, religion, language, and traditional costumes [47]. The study
site is distinctive as it boasts of unspoiled wilderness, desert-adapted wildlife (e.g., elephants), and
handicrafts of the diverse Kalahari people that include San/Basarwa, BaHerero, BaKgalagadi, and
many others [47,73]. The architecture of dwellings is unique, and is an attraction in its own way as
appreciated at the Trailblaizers cultural village for tourism, situated about 10 miles from the village of
Ghanzi in northern Kalahari.
      The Kgalagadi district is sparsely populated (49,049) with a density of 0.38 people per square
kilometer [74]. The population is comprised of six ethnic groups, namely Bangologa, Basarwa, Baherero,
Batlharo, Coloureds, and Nama. Residents overwhelming live in the communal areas mostly in and
around the villages of Matsheng, Kang and Tsabong [48]. On average, the village/settlement size
consists of 198 inhabitants. Within the district, there are more people and settlements in the southern
Kgalagadi region (59%) than the north (41%) [48]. The economy is principally based on raising
small scale livestock and nominal crop farming, while traditional livelihood activities inclusive of
subsistence hunting and gathering are also evident [39,50]. For this study, nine village/settlements were
selected from the districts: Kang, Ncaang, Ukhwi, Zutshwa, Tshane (Kgalagadi North) and Khawa,
Struizendam, Bokspits, Tsabong (Kgalagadi south).

3.2. Data Collection
      The targeted respondent was the head of the household. In the event this person (father or mother)
was not available, then any member of the family (18 years or older) who had lived in the village or
settlement for at least 12 months was requested. The survey questions were translated into the national
language—Setswana. The translation was checked and verified for consistency by an expert in English
and African languages. The questionnaire was translated back to English [75], as it is the official
language and used as the medium of instruction at schools and government institutions. Responses to
the survey questions (45–60 minutes approximately) were conducted verbally by the lead author who
is a native of Botswana. Collectively 746 responses were completed for a response rate of 75% (see
Table 1).

                  Table 1. Selected villages, population, distance from KTP and sample households.

                                                                                                                Approx.
                                                     Total
                                 Total Village                          30% of            Household         Distance from
  Village/Settlements                              Households
                                Population (N)                        Households           Sampled          the Park Fence
                                                      (n) *
                                                                                                                 (km)
    North Kgalagadi
         Ncaang                      175                 43                 13                 37                  250
          Ukhwi                      453                114                 34                 59                   90
         Zutshwa                     469                118                 35                 55                   75
          Tshane                     858                209                 63                 89                  160
           Kang                     3744                913                274             122 (82) **             280
    South Kgalagadi
          Khawa                      517                128                 39                 75                   21
      Struizendam                    313                 76                 23                 44                   23
         Bokspits                    499                122                 37                 53                   53
         Tsabong                    6591               1608                482            212 (145) **             300
         Total (9)                  13,619             3331                1000                746
      * Household estimate = total population/4.1; Note: ** Initially sampled 30% of the total households and subsequently
      extracted 30% of this sample (number in parentheses) for data collection. (Source: GoB, 2001).
Sustainability 2020, 12, 1524                                                                       5 of 17

3.3. Operationalization of Variables
      The questionnaire had items that measured various constructs and issues. First, attitudes towards
KTP (independent variable) were operationalized with 13 items adapted from the literature [22,26,34,76].
The items focused on conservation priorities, land ownership, perceived benefits, resource use and
management. Each was operationalized using a five-point Likert-type scale anchored by 1 (strongly
disagree) to 5 (strongly agree). In addition, knowledge about KTP was operationalized with three
items (Yes/No/Don’t Know) such as: KTP provides opportunities for community development
programs/projects; community campsites outside KTP accrue more money from visitors; and many
visitors who visit KTP stay in my district.
      Support for KTP (dependent variable) was measured via 5 items in a Likert-type scale anchored
by 1 (strongly oppose); 2 (Oppose); 3 (Neutral); 4 (support) to 5 (strongly support). The items focused
on support or opposition towards KTP regulations and guidelines, management staff, transfrontier
status, conservation area, buffer zones and wildlife management areas. The items were adapted
from the literature [43,77,78]. Finally, ancillary items that relate to age, gender, education, household
income, employment, residency, ethnicity, household size, sources of income, and occupation were
also measured. Among these, four items such as literacy (educated/uneducated), proximity to KTP
(distance in kilometers), employment status (formal, part-time, self-employed, unemployed, retired),
and length of stay (residence in the area) were included as covariates, as past research has demonstrated
its applicability at this site [33].

4. Results

4.1. Profile of Respondents
      With respect to the sample, 45% of the respondents were from Tsabong and Kang, 20% from
Tshane and Khawa, and 35% from Ncaang, Ukhwi, Zutshwa Struizendam and Bokspits. Only 45%
were males and 55% females, as reflective of the time of day for the household survey since most men
were engaged in agricultural and livestock related work, and women largely focused on domestic
chores. Forty one percent were in the 18-30 age category, 40% between 31 and 50 years old, and 19%
above 51 years old. About 21% had primary education while 16% had no formal schooling. Only 18%
reported a high school education. With respect to distance, 38% lived close (21–99 km) to the park
whereas 62% lived further away (100-300 km). About two-thirds had lived at their current address
since birth, while a third of the respondents had lived between 1 to 10 years. For income, 42% noted
less than P1000 total household income per month, 31% between P1001 and P3500, and 26% reported
over P3500 (US $1.00–BWP 10.00 based on May 2017 USA-BWP conversion). The primary source
of income was through formal employment (31%) (e.g., security guard, family welfare nurse) and
self-employment (24%) (e.g., souvenir production for commercial purposes). In addition, 25% reported
to be unemployed and were dependent on government aided welfare support programme. The
study area had mixed race/ethnic groupings with Bakgalagadi as the majority, followed by Batlharo,
Bangologa, and San/Basarwa.

4.2. Conservation Attitudes and Support for KTP
      Some of the key findings relate to the fact that nearly all household heads (98%) agreed (strongly
agreed and agreed responses combined) that KTP should be protected to benefit future generations,
while 92% agreed to the importance in the protection for survival of plants. The majority (91%) agreed
that it was essential for the government to devote more money toward a strong conservation program
for KTP. However, 87% agreed that if hunting and cattle grazing were allowed in KTP, then wild
animals would all disappear. Moreover, the majority (85%) agreed that unlimited access to natural
resources (e.g., collecting fuel wood, medicinal plants, herbs, etc.) inside the KTP would lead to loss of
and extinction of some rare species. About 70% disagreed (strongly disagreed and disagreed responses
combined) that conservation and protection of KTP had taken land from the community. Similarly, 71%
Sustainability 2020, 12, 1524                                                                                               6 of 17

disagreed that farmers did not have land to cultivate and graze their livestock due to KTP, while 20%
agreed. Respondents were also asked to put forth their views about whether it would be better if some
parts of the land in KTP were allocated to communities to utilize for agriculture. A sizeable percentage
of respondents (69%) disagreed that parts of land from KTP should be allocated for agriculture, while
23% agreed (see Table 2).

          Table 2. Residents’ attitudes (percentages) towards the Kgalagadi Transfrontier Park (N = 746).

                                                                       Strongly                                         Strongly
                            Statements                                                  Disagree Neutral Agree
                                                                       Disagree                                          Agree
 KTP should be protected for benefit of our future generations.          0.4              0.4          1.3      42.9       55
 KTP protection has taken our land from us *.                            17.8            51.7          9.5      17.8      3.1
 It is important to protect KTP for survival of plants.                  0.8              3.6          3.2      68.0      24.3
 Farmers don’t have land to cultivate and graze livestock due
                                                                         19.2            51.7          9.0      15.8      4.3
 to KTP*.
 Staff from KTP has done nothing for villagers’ lives *.                 6.4             36.2          20.0     29.8      7.6
 It is better if some parts in KTP be allocated to the local people
                                                                         19.7            49.7          7.4      19.2      3.6
 to use for agriculture *.
 If hunting and grazing in KTP is allowed then wildlife will
                                                                         2.4              6.3          3.6      57.4      30.0
 disappear.
 If there is unlimited access to forest resources in KTP
 (Firewood, medicinal plants, forest foods) they will all                3.4              6.7          5.4      61.7      22.9
 disappear.
 It is important for government to devote more money toward
                                                                         1.2              3.9          4.4      62.9      27.5
 a strong a conservation program for the KTP.
 KTP provides jobs for people from the village.                          5.4             31.1          12.1     42.4      9.1
 KTP is being managed for the local people.                              4.2             35.3          16.4     35.3      8.7
 I am happy to have my village next to KTP.                              0.9              6.4          9.5      66.2      16.2
 It is important to protect KTP for the survival of wildlife.            1.6              1.5          2.9      61.9      32.0
                                             * Item reverse coded prior to analysis.

      Similarly, majority of respondents (95%) expressed support (strongly support and support
responses combined) for the protection of KTP as a conservation area. A sizeable proportion (72%)
were supportive of KTP as a transfrontier park. Also, the level of support for the current management
staff was noted by 65% of the respondents. Although the majority were supportive of KTP as a
transfrontier park, there were others (21%) who opposed it (strongly oppose and oppose responses
combined). Additionally, a large number (78%) were supportive of the creation of KTP buffer zones
and Wildlife Management Areas, while 73% supported regulations and guidelines that maintained
KTP as a transfrontier park (see Table 3).

           Table 3. Residents’ level of support (percentages) for Kgalagadi Transfrontier Park (N = 746).

                                                            Strongly                                                   Strongly
             Statements – I Support                                             Oppose          Neutral Support
                                                            Oppose                                                     Support
 KTP as a Transfrontier Park.                                   9.4               11.9           6.7          51.7       20.0
 Current management staff at KTP.                               1.1               14.6           19.2         51.5       13.5
 Creation of buffer zones and WMAs.                             2.1               6.2            13.0         58.8       19.6
 Regulation and guidelines for KTP.                             4.3               7.6            15.3         54.2       18.5
 Protection of KTP as a conservation area.                      0.4               1.2            2.8          65.5       29.8
Sustainability 2020, 12, 1524                                                                                          7 of 17

4.3. Data Analysis
      First, the 13-item independent attitudinal measures were assessed for appropriateness to conduct
data analysis via Bartlett’s test of sphericity and Kaiser-Meyer-Oaklin (KMO) measure of sampling
adequacy. Bartlett’s test of sphericity was highly significant (approximate chi-square = 1386.647, df =
78, p < 0.001), and KMO was 0.752, which exceeded [79] recommended cut-off of 0.60. Likewise, for
the five-item dependent variable measure (i.e., support) Bartlett’s test of sphericity was also highly
significant (approximate chi-square = 753.445, df = 10, p < 0.001), and KMO was 0.699. These two
measures for the independent and dependent variable measures suggested that the data was suitable
for factor analysis.
      Second, a principal component analysis (PCA) was performed using Varimax rotation with Kaiser
normalization. Four factors (i.e., land ownership, conservation awareness, local benefits, and resource
use) were generated and accounted for 53.14% of the total variance which exceeded the minimum
cut-off of the 50% [79,80]. The four factors explained 20.09%, 12.27%, 10.03%, and 7.75% of the variance,
and had eigenvalues of 3.00, 1.59, 1.30, and 1.01, respectively (see Table 4). The single factor for the
criterion or dependent measure explained 46.71% of the total variance. Factor loadings 0.40 or greater
were considered significant [81]. The reliability score ranged from 0.56 to 0.70, and were deemed
acceptable [81]. Considering these scores, [82] recommend reporting the mean inter-item correlation
for the items, and suggests an optimal range of 0.20 to 0.40. For this study, the ranges of inter-item
correlation means were 0.241 to 0.440, and noted to be acceptable. Although reliabilities were lower
than desired, they were not low enough to justify discontinuation given the range of mean inter-item
correlations, number of items, and the unique nature of the data [81–84]. The items within each factor
were computed as independent index, respectively. In addition, an index was created for the three
items that measured perceived benefits about KTP which were: 1.) KTP provides opportunities for
community development; community; 2) Community campsites accrue more money from visitors;
and 3) Many visitors who visit KTP stay in my district.

                                           Table 4. Factor loadings and reliabilities.

                                                                            % of           Mean
                                                   No. of                                                            Scale
             Constructs and Items                           Loading       Variance       Inter-item    Reliability
                                                   Items                                                             Mean *
                                                                         Explained       Correlation
                                                                                                                     10.92
                Land Ownership                       3                     20.09            0.440        0.70
                                                                                                                     (2.58)
  Farmers don’t have land to cultivate and
                                                              0.806
  graze livestock due to KTP.
  KTP protection has taken our land from us.                  0.802
  It is better if some parts of land in KTP is
  allocated to local people to                                0.705
  use for agriculture.
                                                                                                                     16.96
           Conservation Awareness                    4                     12.27            0.242        0.56
                                                                                                                     (1.81)
  KTP should be protected for the future of
                                                              0.701
  our new generation.
  It is important to protect KTP for the
                                                              0.601
  survival of wildlife.
 It is important for the government to devote
 more money towards a strong conservation                     0.570
 program for KTP.
  It is important to protect KTP for
                                                              0.479
  survival of plants.
Sustainability 2020, 12, 1524                                                                                                                                                           8 of 17

                                                                                     Table 4. Cont.

                                                                                                                  % of                  Mean
                                                                           No. of                                                                                                 Scale
                   Constructs and Items                                                    Loading              Variance              Inter-item               Reliability
                                                                           Items                                                                                                  Mean *
                                                                                                               Explained              Correlation
                                                                                                                                                                                    10.76
                         Local Benefits                                        4                                   10.03                   0.241                  0.56
                                                                                                                                                                                    (2.74)
  KTP provides jobs to people from the village.                                              0.765
  Staff from KTP have done nothing for
                                                                                             0.682
  villagers’ lives.                                                                                                                                8 of 16
  KTP is being managed for the local people.                                                 0.641
                                                                                                                                                     8 of 16          8 of 16          8 of 16         8 of 16
  I am happy to have my village                                                                                                                               8 of 16
   I am happy to have my village next to KTP. 0.415                                                      0.415
  next to KTP.
     I am happy to      I am
                           havehappy
                                   my village
                                           Itoam have
                                                    happymy village
                                                                Itoam
                                                                    havehappy
                                                                            my village
                                                                                  to have my village                                                      8.01                                8.01
  I am happyResource to have     my village                                       0.415             0.415           0.415
                                                                                                                     0.396 7.750.415
     next to KTP.next        Resource
                               toUse
                                   KTP.next    Use  to KTP.next     2 to KTP.   0.415 2           7.75                                    0.57       0.396
                                                                                                                                                         (1.52)
                                                                                                                                                                             0.57
                                                                                                                                                                                            (1.52)
  next to KTP.                                                                                                                                                8 of 16
                                                                                                                                                             8.01             8.01          8.01         8.01
  IfIfhunting      and
       huntingResource
                     and  grazing
                     Resourcegrazing  inResource
                                    Use    KTP
                                            in KTP  is Use is Resource
                                                              allowed 2      UseResource
                                                                                       2 Use 7.752                   7.75
                                                                                                                        0.396
                                                                                                                          2           7.75
                                                                                                                                        0.396
                                                                                                                                            0.57      7.758.01
                                                                                                                                                        0.3960.57        0.396
                                                                                                                                                                             0.57          0.57
                                  Use                               2                             7.75   0.789       0.396                0.57              ( 1.52)          ( 1.52)       ( 1.52)      ( 1.52)
  allowed
  Ithen
     am
               then
            wild
          happy
                       wild animals
                    animals
                     to            will       will
                                            disappear.                          0.789                                                                    (1.52)
     If hunting
  disappear.         andIfhave   my
                           hunting
                            grazing    village
                                        and
                                         inIf KTP
                                               hunting
                                                 grazing
                                                      is and   in
                                                                If KTP
                                                                    hunting
                                                                     grazing
                                                                           is 0.415
                                                                                and
                                                                                 in KTP
                                                                                      grazing
                                                                                            is in KTP is
  If hunting
  next    to KTP.  and grazing in KTP is                                                                                                                      8 of 16
     allowed      then  allowed
                           wild animals
                                     then  allowed
                                               wild
                                                 will
                                                   to animals
                                                           then allowed
                                                                   wild
                                                                     willanimals
                                                                             then0.789
                                                                                    wild
                                                                                      willanimals   0.789
                                                                                                        will        0.789           0.789
  IfIfthere
       thereisisunlimited
  allowed
                    unlimited
               then wild animals
                                      access
                                  access      to
                                              will
                                                        forest
                                                                                0.789                                                                     8.01
     disappear.
   resources        in  disappear.
                         KTP
                  Resource       (e.g.,    disappear.
                                          firewood,
                                  Use(e.g.,                     disappear.
                                                               medicinal
                                                                    2                             7.75   0.775       0.396                0.57
  forest resources
  disappear.                in KTP                                                                                                                       (1.52)
  Iplants)
     am   happy
     If there  then  toIfhave
                ismedicinal
                    unlimited
                           there
                         they    myis  village
                                    access
                                 will  unlimited
                                           If there
                                        also     to      isaccess
                                                  disappear. unlimited
                                                                If there
                                                                     to isaccess0.775to access to
                                                                               unlimited
  firewood,
  If  there
      hunting is unlimited
                   and    grazing plants)
                                  access
                                      in   KTPtothenis                          0.415
  next    to KTP.
     forest   resources forestin resources
                                  KTP     (e.g.,
                                           forest  in resources
                                                       KTP      (e.g.,
                                                                forest in resources
                                                                           KTP    (e.g.,in  KTP    (e.g.,
  they
  forest
  allowed will   alsoDependent
            resources
               then     disappear.
                       wild in animals
                               KTP (e.g.,    Measure
                                              will                                0.775
                                                                                0.789               0.775           0.775           0.775                 8.01
     firewood,Resource
                     medicinal
                        firewood,   plants)
                                  Use   medicinal
                                           firewood,
                                                   then plants)
                                                             medicinal
                                                                firewood,
                                                                    2 thenplants)
                                                                                medicinal
                                                                                0.775 thenplants) 7.75 then          0.396                0.57
  firewood,
  disappear. Dependent
                  medicinal    Measure
                                  plants) then                                                                                                           (1.52)
     they will also     they
                           disappear.
                               will also   theydisappear.
                                                    will also   theydisappear.
                                                                        will also disappear.                                                              19.08                             19.08
  they
  If therewillisalso
      hunting    unlimited
                  KTP
                             KTP
                   anddisappear.
                          grazing
                           Support
                                      Support
                                  access
                                      in KTP  to is Dependent       5 Dependent
                                                                                          5      46.71                .327
                                                                                                                               46.71 0.70             .327                   0.70
               Dependent          Measure
                                  Dependent            Measure             Measure Measure                                                               ( 3.16)                            (3.16)
  allowed    Dependent
  forest resources
               then wild       Measure
                            in animals
                               KTP     (e.g., will                              0.789
  Regulations         and    guidelines                                         0.775 Support                                                               19.08            19.08         19.08        19.08
   Regulations
  firewood,
  disappear.         KTPand
                  medicinal  Support    KTPto
                               guidelines
                                  plants)       thento maintain
                                                  Support             5 KTPKTP
                                                              KTP Support              5            46.715          46.71.327
                                                                                                                          5          46.71
                                                                                                                                         .327
                                                                                                                                            0.70 46.71    19.08
                                                                                                                                                         .3270.70         .327
                                                                                                                                                                             0.70          0.70
                  KTP      Support                                  5                            46.710.789           .327                0.70              (3.16)           (3.16)        (3.16)       (3.16)
  maintain
   as
  they
  If
        a        KTP
           Transfrontier
          willisalso
      there
                         as  a Transfrontier
                        disappear.
                 unlimited
                                  Park.
                                  accessRegulations
                                              to toguidelines
                                                                                0.789                                                                    ( 3.16)
     Regulations
  Park.                 Regulations
                        and guidelines       and                Regulations
                                                                  andtoguidelines  andtoguidelines to
  Regulations
   Current
  forest     Dependentandin
                 management
            resources        guidelines
                               Measure  staff  to at KTP.                                                0.753 0.789
     maintain      KTP     as aKTP
                        maintain       (e.g.,
                                  Transfrontier
                                      KTP  maintain
                                                 as a Transfrontier
                                                            KTP maintain
                                                                    as a Transfrontier
                                                                               KTP0.789
                                                                                0.775as a Transfrontier
                                                                                                    0.789                           0.789
  Current management
  maintain       KTP     as  a      staff at KTP.
                               Transfrontier                                    0.753
                                                                                0.789                                                                     19.08
  firewood,
     Park.as a medicinalPark.     plants)  Park.then            Park.
   KTP            KTP      SupportNational
                   Transfrontier           National          Park.  5                            46.71   0.701        .327                0.70
  KTP
  Park.
  they    as a  Transfrontier
          will also     disappear.                                              0.701                                                                    (3.16)
     Current      management
                        Current     management
                                       staff
                                           Current
                                                 at KTP.   management
                                                             staff
                                                                Current
                                                                     at KTP. management
                                                                                staff
                                                                                  0.753
                                                                                      at KTP.staff  0.753
                                                                                                        at KTP. 0.753               0.753
  Park.
  Current
  Regulations
   Protection  management
                      and
                     of   KTP       staff
                             guidelines
                                  as          attoKTP.
                                       aNational
                                          conservation              area.       0.753                    0.614
     KTP as  Dependent
                a Transfrontier
                        KTP    Measure
                               as  a Transfrontier
                                           KTP as a Transfrontier
                                                               National
                                                                KTP     as a Transfrontier
                                                                                 National National
  Protection       of KTP
  KTP as a Transfrontier
  maintain       KTP     as a as   a National
                               Transfrontier                                      0.701
                                                                                0.789               0.701           0.701           0.701                 19.08
     Park.
   Creation        of
                  KTP   Park.
                       KTP     buffer
                           Support         Park.
                                            zones       and     Park.
                                                                 WMAs.
                                                                    5           0.614
                                                                                0.701            46.71   0.527        .327                0.70
  conservation area.
  Park.                                                                                                                                                  (3.16)
     Protection ofProtection
                          KTP as a ofProtection
                                              KTP as a ofProtectionKTP as a of KTP as a
  Creation
  Protection
  Current
  Regulations   ofofKTPKTPbuffer
               management
                      and             zones
                               as astaff
                             guidelines           and
                                              attoKTP.                        * Scale
                                                                                  0.614standard
                                                                                0.753                   deviation
                                                                                                    0.614              in brackets.
                                                                                                                    0.614           0.614
     conservation       conservation
                          area.            conservation
                                              area.             conservation
                                                                   area.        0.527
                                                                                    area.
                                                                                0.614
  WMAs.
  conservation
  KTP
  maintain       KTParea.
          as a Transfrontier          National
                         as a Transfrontier                                     0.789
     Creation of KTP    Creation
                               buffer ofzones
                                           KTP
                                           Creation buffer
                                                     andof zonesKTP
                                                                Creationbuffer
                                                                         andof0.701
                                                                                 zones
                                                                                  KTP buffer
                                                                                          and zones and
  Creation of KTP buffer zones and * Scale standard
  Park.                                                                           0.527
                                                                                    deviation in    0.527
                                                                                                       brackets. 0.527              0.527
     WMAs.Furthermore,
  WMAs. management
  Protection
  Current
                        WMAs. several
                   of KTP as astaff at KTP.
                                           WMAs. techniques     WMAs. 0.527       were used to ensure against multi-collinearity. First, a correlation
                                                                                0.753
analysis          was
        Furthermore,
  conservation
  KTP                  area.
          as a Transfrontierconducted
                                  several
                                      National       along
                                                  techniques* Scale with were a0.614
                                                               * Scale standard
                                                                       standard
                                                                                 * Scale
                                                                                   used
                                                                                       deviation
                                                                                           standard
                                                                                  collinearity
                                                                                    deviation
                                                                                                  * Scale
                                                                                             to ensure
                                                                                                      in deviation
                                                                                                         brackets.
                                                                                                            standard
                                                                                                                  * Scale
                                                                                                         diagnosis.
                                                                                                   in brackets.
                                                                                                                      indeviation
                                                                                                                          brackets.
                                                                                                                             standard indeviation
                                                                                                                             The bivariate
                                                                                                               against multi-collinearity.
                                                                                                                                          brackets. in brackets.
                                                                                                                                                      correlations
                                                                                                                                                         First, a             ranged between
                                                                                0.701
correlation
  Creation
  Park.
0.01 and        of  analysis
                    KTP
                    0.49,    buffer
                               and waszones
                                         were conducted
                                                  and  below       along
                                                                       0.70   with
                                                                                 [80] a  collinearity
                                                                                         (see     Table      diagnosis.
                                                                                                              5).             The
                                                                                                                    Subsequently,   bivariate   cutcorrelations
                                                                                                                                                       off     points       were     earmarked
           Furthermore,       Furthermore,
                                    severalFurthermore,
                                                     techniques
                                                          severalFurthermore,
                                                                         techniques
                                                                           were
                                                                             several
                                                                                0.527used techniques
                                                                                             were
                                                                                              several
                                                                                               to ensure
                                                                                                       usedtechniques
                                                                                                             were
                                                                                                                to
                                                                                                                 against
                                                                                                                     ensure
                                                                                                                       usedweremulti-collinearity.
                                                                                                                                 to
                                                                                                                                  against
                                                                                                                                     ensure
                                                                                                                                       used multi-collinearity.
                                                                                                                                                toagainst
                                                                                                                                                     ensure First,
                                                                                                                                                                multi-collinearity.
                                                                                                                                                                   against
                                                                                                                                                                      a First,   multi-collinearity.
                                                                                                                                                                                     a First, a First, a
  WMAs. Furthermore,
  Protection
ranged             of KTP0.01
             between           asseveral
                                   a and 0.49,    techniques
                                                         and werewere      below   used
                                                                                      0.70 to [80]ensure
                                                                                                     (see Tableagainst      multi-collinearity.
                                                                                                                     5). Subsequently,          cut offFirst,
                                                                                                                                                            pointsa
toconservation
      determine
  correlation          area.
                             multicollinearity—tolerance
                     correlation
                       analysis       was
                                        correlation
                                          analysis
                                                 conducted  was
                                                              correlation
                                                                analysis
                                                            * Scale
                                                                     conducted
                                                                     along
                                                                       standard
                                                                                0.614
                                                                               was
                                                                                with
                                                                                 analysis    value
                                                                                      conducted
                                                                                       along
                                                                                         a  collinearity
                                                                                                was
                                                                                                 with    of  less
                                                                                                       conducted
                                                                                                        along
                                                                                                          a          0.10,
                                                                                                             collinearity
                                                                                                               diagnosis.
                                                                                                                  with   along
                                                                                                                           a    or  a  variance
                                                                                                                              collinearity
                                                                                                                                diagnosis.
                                                                                                                                The
                                                                                                                                  withbivariate
                                                                                                                                           a            inflation
                                                                                                                                              collinearity
                                                                                                                                               diagnosis.
                                                                                                                                                The  correlations
                                                                                                                                                       bivariate          factor
                                                                                                                                                                 diagnosis.
                                                                                                                                                                 The  correlations
                                                                                                                                                                        bivariate The(VIF)      value
                                                                                                                                                                                      correlations
                                                                                                                                                                                       bivariate    correlations
correlation
were earmarked      analysis       was conducted
                              to determine                         along      withdeviation
                                                       multicollinearity—tolerance                 in brackets.
                                                                                      a collinearity    valuediagnosis.
                                                                                                                 of less 0.10,The orbivariate
                                                                                                                                       a variance  correlations
                                                                                                                                                        inflation
  ranged
ofCreation
      above    between
                     ranged
                    10     [84] 0.01
                                   between
                                    (p. and
                                        ranged    0.49,
                                               164). 0.01
                                                        between
                                                            and
                                                              ranged
                                                              and
                                                              The   were
                                                                      0.49,
                                                                         0.01
                                                                           between
                                                                             below
                                                                               and
                                                                                and
                                                                        tolerance     were
                                                                                       0.49,
                                                                                        0.70
                                                                                          0.01 below
                                                                                                and
                                                                                                [80]
                                                                                                 and   (see
                                                                                                       were
                                                                                                         0.49,
                                                                                                          0.70Table
                                                                                                               below
                                                                                                                and
                                                                                                                [80]   were
                                                                                                                       5).
                                                                                                                        (see
                                                                                                                           0.70
                                                                                                                             Subsequently,
                                                                                                                               Table
                                                                                                                                below
                                                                                                                                 [80]   (see
                                                                                                                                        5).0.70
                                                                                                                                             Subsequently,
                                                                                                                                               Table
                                                                                                                                                 [80]
                                                                                                                                                  cut   (see
                                                                                                                                                        5).
                                                                                                                                                        off   Subsequently,
                                                                                                                                                               points
                                                                                                                                                                Table
                                                                                                                                                                   0.98 or less with 0.98off points
                                                                                                                                                                    cut  5).
                                                                                                                                                                          off  Subsequently,
                                                                                                                                                                                points
                                                                                                                                                                                    cut off   points
                                                                                                                                                                                                  cut
ranged
factor     (VIF)of KTP
             between value   buffer
                             0.01     zones
                                     and
                               of above           and
                                               0.49,
                                                  10     and
                                                       [84]       were
                                                                (p.  164). below
                                                                              The
                                                                                0.527 0.70value
                                                                                     tolerance[80] (see  for
                                                                                                     value     each
                                                                                                           Table
                                                                                                              for    5). of
                                                                                                                   each     of the    variables
                                                                                                                           Subsequently,
                                                                                                                                the variables   cutwasoffwaspoints
                                                                                                                                                           0.98   or
  were
  WMAs.     earmarked
        Furthermore, were      earmarked
                                to  determine
                                        were
                                  several           earmarked
                                                     to    multicollinearity—tolerance
                                                           determine
                                                  techniques  were      earmarked
                                                                         to  determine
                                                                             multicollinearity—tolerance
                                                                                          to   determine
                                                                                               multicollinearity—tolerance
                                                                                                          valuemulticollinearity—tolerance
                                                                                                                  of   lessvalue
                                                                                                                              0.10, of
                                                                                                                                     orless
                                                                                                                                          avalue
                                                                                                                                             variance
                                                                                                                                              0.10, ofor
                                                                                                                                                       lessinflation
                                                                                                                                                           a
                                                                                                                                                           value
                                                                                                                                                              variance
                                                                                                                                                                0.10,oforless
                                                                                                                                                                           ainflation
                                                                                                                                                                               variance
                                                                                                                                                                                0.10, or ainflation
                                                                                                                                                                                             variance inflation
as the
were          highest,
          earmarked           to which
                                  determine             greaterwere       thanused
                                                   is multicollinearity—tolerance    0.10.to The  ensure
less with .98 as the highest, which is greater than 0.10. The variance inflation factor (VIF) was 1.432        against
                                                                                                          variance
                                                                                                        value               multi-collinearity.
                                                                                                                            inflation
                                                                                                                 of less 0.10,                           First,
                                                                                                                                                          (VIF)a was 1.432 (highest),
                                                                                                                                             factorinflation
                                                                                                                                   or a variance
  factor (VIF)factor
correlation    value(VIF)
                     of above
               analysis  factor
                           value10
                                (VIF)
                                  of[84]
                                     *above
                                      factor
                                        value
                                         (p. standard
                                       Scale 164).
                                              10
                                              (VIF)
                                                of[84]
                                                   above
                                                    The
                                                     value
                                                       (p.
                                                         tolerance
                                                           164).
                                                           10of[84]
                                                                above
                                                        deviationThe
                                                                  in(p.
                                                                     value
                                                                      tolerance
                                                                        164).
                                                                        10 [84]
                                                                            for
                                                                     brackets.The
                                                                                (p.
                                                                                each
                                                                                 value
                                                                                  tolerance
                                                                                    164).
                                                                                      of for
                                                                                         the
                                                                                          Theeach
                                                                                              variables
                                                                                              value
                                                                                               tolerance
                                                                                                   offor
                                                                                                      thewas
                                                                                                         each
                                                                                                          variables
                                                                                                          value
                                                                                                             0.98
                                                                                                              offor
                                                                                                                 the
                                                                                                                  orwas
                                                                                                                    each
                                                                                                                     variables
                                                                                                                        0.98
                                                                                                                         of the
                                                                                                                             orwas
                                                                                                                                variables
                                                                                                                                   0.98 orwas 0.98 or
factor (VIF)
(highest),
which          value
            which
          was        was
                  below of was
                            above
                             below
                               theconducted
                                     10
                                      the[84]
                                     cut-offcut-offalong
                                                (p.of164).
                                                       of   with
                                                          10.
                                                        10.  The    a collinearity
                                                                   tolerance
                                                                Collectively,
                                                              Collectively,      value
                                                                                   thethediagnosis.
                                                                                          for each ofThe
                                                                                        multicollinearity  the bivariate
                                                                                                                variables
                                                                                                                 assumption  correlations
                                                                                                                              waswas0.98notor
  less with
ranged       .98
         betweenless
                  as with
                      the highest,
                     0.01    .98
                               less
                             and  aswith
                                      the
                                       which
                                   0.49,    highest,
                                             .98
                                           and less
                                                  as
                                                  is with
                                                 weregreater
                                                      the
                                                        which
                                                           highest,
                                                            .98
                                                          below  than
                                                                  as
                                                                  is0.70
                                                                     the
                                                                     greater
                                                                        which
                                                                        0.10.
                                                                           highest,
                                                                           [80] The
                                                                                than
                                                                                 (see    0.10.multicollinearity
                                                                                  is greater
                                                                                       variance
                                                                                        which
                                                                                        Table   The
                                                                                                than
                                                                                                 isinflation
                                                                                                 5). greater
                                                                                                       variance
                                                                                                         0.10. The
                                                                                                                than
                                                                                                                 factor
                                                                                                      Subsequently,inflationassumption
                                                                                                                      variance
                                                                                                                        0.10.
                                                                                                                          (VIF)
                                                                                                                           cutThe
                                                                                                                                factor
                                                                                                                                  was
                                                                                                                                  inflation
                                                                                                                                off  variance
                                                                                                                                         1.432    was1.432
                                                                                                                                         (VIF)factor
                                                                                                                                                 was     not
                                                                                                                                                 inflation
                                                                                                                                                      (VIF)    violated.
                                                                                                                                                            factor
                                                                                                                                                              was  1.432
                                                                                                                                                                   (VIF) was 1.432
less with In
violated.  .98addition,
                 as the highest,      which validity
                             discriminant       is greater     than 0.10.was
                                                            assessment        Theperformed,
                                                                                    variance inflation
                                                                                                    and thefactor
                                                                                                                bivariate(VIF)  waspoints
                                                                                                                                       1.432
                                                                                                                             correlations
In  addition,
  (highest),  which
      Furthermore,
were earmarked      discriminant
                (highest),
                        was   which
                               below
                               (highest),
                          several
                      totodetermine    was
                                        the validity
                                              which
                                              cut-off
                                     techniques(highest),
                                               below    was
                                                        the
                                                         of
                                                        wereassessment
                                                            10.
                                                             which
                                                              cut-off
                                                              below
                                                                  Collectively,
                                                                 used  was
                                                                        the
                                                                        ofto10.  was
                                                                              cut-off
                                                                              below       performed,
                                                                                 Collectively,
                                                                               ensurethethe
                                                                                        ofmulticollinearity
                                                                                            10.
                                                                                             cut-off
                                                                                                 Collectively,
                                                                                           against   theof     and      the
                                                                                                           multicollinearity
                                                                                                            10.  Collectively,
                                                                                                                   assumption
                                                                                                                    the       bivariate
                                                                                                                          multicollinearity
                                                                                                        multi-collinearity.       assumption
                                                                                                                                   the
                                                                                                                                    was
                                                                                                                                  First,      correlations
                                                                                                                                        multicollinearity
                                                                                                                                           not
                                                                                                                                            a    assumption
                                                                                                                                                   was  not     ranged
                                                                                                                                                              assumption
                                                                                                                                                                was  not was not
(highest),
ranged      which
         from    0.01was     below
                            0.49,     themulticollinearity—tolerance
                                  while     cut-off    of 10.were
                                            reliabilities       Collectively,
                                                                     from 0.56the   value    of Thus,
                                                                                                less 0.10,
                                                                                    to multicollinearity
                                                                                         0.70.                orassumption
                                                                                                                  a variance
                                                                                                          discriminant           inflation
                                                                                                                                  waswas
                                                                                                                            validity     not
  violated.
correlation
from
factor 0.01
       (VIF) Inanalysis
                violated.
               toaddition,
               value0.49,
                        of   Indiscriminant
                            wasviolated.
                                addition,
                             while
                            above conducted
                                     10     Inviolated.
                                         [84]  discriminant
                                                addition,
                                                  validity
                                                (p.along
                                       reliabilities 164).  Inassessment
                                                              discriminant
                                                            with
                                                            were
                                                             Theaddition,
                                                                  validity
                                                                    a from    discriminant
                                                                              assessment
                                                                               was
                                                                                 validity
                                                                       collinearity
                                                                   tolerance   0.56
                                                                                 valueperformed,
                                                                                             assessment
                                                                                              wasvalidity
                                                                                         diagnosis.
                                                                                        to  0.70.
                                                                                          for  each   performed,
                                                                                                       and
                                                                                                       of The
                                                                                                      Thus,  the
                                                                                                             assessment
                                                                                                           thewas bivariate
                                                                                                                     performed,
                                                                                                                      and the
                                                                                                                bivariate
                                                                                                                 discriminant
                                                                                                                variables    was
                                                                                                                               correlations
                                                                                                                                 bivariate
                                                                                                                                    performed,
                                                                                                                                     and
                                                                                                                             correlations
                                                                                                                              was   0.98   thecorrelations
                                                                                                                                        validity
                                                                                                                                           or   bivariate
                                                                                                                                                   and
                                                                                                                                                    was thecorrelations
                                                                                                                                                             bivariatefor
                                                                                                                                                           verified    correlations
violated.  In the
verified for   addition,     discriminant validity assessment was performed, and the bivariate correlations
                    constructs.
  ranged
ranged
less with  from
         between
           .98  ranged
                 as0.01
                     0.01
                    the   to
                           from
                              0.49,
                               ranged
                             and
                          highest,0.01
                                    while
                                   0.49, to
                                          from
                                      whichand0.49,
                                               reliabilities
                                               ranged
                                                  0.01
                                                 were
                                                is   while
                                                         to
                                                   greaterfrom
                                                             0.49,
                                                              reliabilities
                                                          below were
                                                                  0.01
                                                               than  while
                                                                       from
                                                                    0.70 to[80]
                                                                      0.10.  0.49,
                                                                              reliabilities
                                                                               were
                                                                               0.56
                                                                              The   while
                                                                                 (see  to
                                                                                        from
                                                                                           0.70.
                                                                                        Table
                                                                                    variance reliabilities
                                                                                               were
                                                                                               0.56
                                                                                                  Thus,
                                                                                                 5).   to
                                                                                                        from
                                                                                                           0.70.
                                                                                                            discriminant
                                                                                                              were
                                                                                                               0.56
                                                                                                                  Thus,
                                                                                                      Subsequently,
                                                                                                 inflation     factor to
                                                                                                                       from
                                                                                                                          0.70.
                                                                                                                           discriminant
                                                                                                                           cut
                                                                                                                         (VIF)validity
                                                                                                                              0.56
                                                                                                                                 Thus,
                                                                                                                                off
                                                                                                                                was  to1.432
                                                                                                                                         0.70.
                                                                                                                                          discriminant
                                                                                                                                          was
                                                                                                                                     points   validity
                                                                                                                                               Thus, discriminant
                                                                                                                                                        was
                                                                                                                                                          validity wasvalidity was
the constructs.
ranged   from 0.01 to 0.49, while reliabilities were from 0.56 to 0.70. Thus, discriminant validity was
  verified
were         for
       earmarked verified
                  the was
                        constructs.
                             forverified
                        to determinethe constructs.
                                                for  verified
                                                       the constructs.
                                                                    for Collectively,
                                            themulticollinearity—tolerance the constructs. value
(highest),
verified for  which
                theTable     5.below
                     constructs. Correlation      cut-off
                                                    matrix of       10.
                                                                of study                  the
                                                                             variables, means   andofstandard
                                                                                                       less 0.10,
                                                                                               multicollinearity   orassumption
                                                                                                                      a variance inflation
                                                                                                                deviations.        was not
factor (VIF)
violated.        value of above
            In addition,                 10 [84] validity
                              discriminant             (p. 164).assessment
                                                                      The tolerance  was value   for eachand
                                                                                           performed,       of the
                                                                                                               the  variables correlations
                                                                                                                    bivariate  was 0.98 or
                          Table
                         Ƶ1 highest,  5.   Correlation
                                        ƵTable                     matrix      of  study   variables,     means     and  standard    deviations.
   Variables
less
rangedwith   .98 as
          from
                      Table
                      the
                   0.01
                    Tableto 5.
                               5. Correlation
                             0.49,
                                          2
                                           which
                                       while
                                 Correlation            isƵ3 greater
                                                    5. matrix
                                                       Correlation
                                                             Table
                                                   reliabilities
                                                    matrix
                                                                      5.Ƶthan
                                                                  of study
                                                                       were
                                                                of study
                                                                                   X15.
                                                                          4Correlation
                                                                           matrix
                                                                              Table
                                                                              variables,
                                                                                  of
                                                                                0.10.
                                                                               from
                                                                                     study
                                                                                       The
                                                                                      0.56
                                                                             variables,
                                                                                              X2ofand
                                                                                        Correlation
                                                                                        matrix
                                                                                         means
                                                                                            variables,
                                                                                                   study
                                                                                            variance
                                                                                            to 0.70.
                                                                                        means
                                                                                                         X3
                                                                                                     matrix
                                                                                                       standard
                                                                                                        means
                                                                                                          variables,
                                                                                                             of and
                                                                                                                study
                                                                                                        inflation
                                                                                                      Thus,
                                                                                                and standard
                                                                                                                     X4
                                                                                                                  deviations.
                                                                                                                     standard
                                                                                                                     means
                                                                                                                   factor
                                                                                                              discriminant(VIF)
                                                                                                                deviations.
                                                                                                                               X5standard
                                                                                                                       variables,
                                                                                                                            and   was
                                                                                                                              validity
                                                                                                                                        Y1
                                                                                                                              deviations.
                                                                                                                                  means  and
                                                                                                                                      1.432
                                                                                                                                        was
                                                                                                                                           deviations.
                                                                                                                                             standard deviations.
                                                                          Covariates
(highest),
verified
     Variableswhich
        Variables       was
           for theVariables    below
                     constructs.
                           Ƶ11              the
                                           Ƶ2 Ƶ21
                                      Variables   cut-off      of   10.    Collectively,  the  multicollinearity
                                                            Ƶ3 Ƶ2 Ƶ31 Ƶ4 Ƶ3 Ƶ2 Ƶ41 X1 Ƶ4 Ƶ3 Ƶ2X1
                                                           Variables                            X2X1Ƶ4 Ƶ3 X3         assumption
                                                                                                             X2X1Ƶ4 X4X3
                                                                                                            X2                     was
                                                                                                                          X2X1 X5X4X3
                                                                                                                         X3              not
                                                                                                                                       X2 Y1 X5X4X3
                                                                                                                                      X4          X5 Y1 X5X4Y1 Y1 X5                                      Y1
  Literacy
   Variables( 1)       1.000
                         Ƶ1 discriminantƵ2               Ƶ3            Ƶ4          X1was performed,
                                                                                              X2         X3          X4        X5       Y1
violated.   In addition,                               validity      assessment
                                                                            Covariates   Covariates       and the bivariate
                                                                                                      Covariates    Covariatescorrelations
 Proximity (Ƶ2) 0.11 **               1.000                               Covariates     Covariates
ranged    from
    Literacy  ( 1)0.01   to 5.
                   Literacy
                    Table    0.49,
                         1.000         while
                               ( Correlation
                                  1)Literacy 1.000(reliabilities
                                                     1)Literacy
                                                    matrix      1.000( were
                                                                of study       from
                                                                                1.000 0.56
                                                                         1) variables,      to 0.70.
                                                                                        means         Thus, discriminant
                                                                                                and standard    deviations. validity was
 Employment
  Literacy  ( 1)
        Literacy       −0.20
                       1.000
verified   for (Ƶ
   Proximity    the
                  2) constructs.
                         1.000
                  Proximity
                        0.11       2−0.10
                              **(ƵProximity
                                     ) 1.000 ** **(Ƶ1.000
                                           0.11       Proximity
                                                       2) 1.0000.11 **(Ƶ2) 1.000
                                                                               0.11 **     1.000
   status (Ƶ
  Variables
Proximity       )) 2) 0.11
           ( 31(Ƶ          Ƶ**1 **          Ƶ2
                                          1.000             Ƶ3             Ƶ4            X1            X2           X3           X4         X5       Y1
  EmploymentEmployment     −0.20 Employment     −0.20 Employment   −0.20             −0.20
Length
Employmentof  stay
        Proximity        −0.50
                         −0.20            −0.10 **          1.000
                                                             −0.10 ** Covariates
                                                                               1.000
                                                                                 −0.10 **        1.000
                                                                                                  −0.10 **       1.000
     status   (Ƶ3) Table
                       status
                           0.11**(Ƶ
                                 5.   )  −0.09
                                          status
                                    Correlation
                                   ** −0.10 1.000
                                    3             *
                                                 ****(Ƶ3 0.31
                                                         )
                                                        matrix
                                                          1.000**
                                                             statusof**
                                                                      (Ƶ1.000
                                                                      study
                                                                          3 )           **
                                                                                 variables,     means     and   standard   deviations.
       (Ƶ4)(Ƶ
   status
 Literacy  ( (3))1)         **
                            **
                         1.000
  Length of2 stay    Length−0.50
                               of stay Length−0.50 of stayLength−0.50of stay         −0.50
  Variables
Length
Proximity of  stay
               (Ƶ  2)      Ƶ
                         −0.50
                        0.11  1 **         −0.09
                                            Ƶ
                                          1.000
                                              2      *     0.31   Independent
                                                            Ƶ3−0.09
                                                                  **   * 1.000
                                                                           Ƶ4 0.31   ** Measures
                                                                                 −0.09    * 1.000
                                                                                         X1     0.31
                                                                                                  −0.09
                                                                                                      **X2* 1.000
                                                                                                                0.31X3**    1.000X4         X5       Y1
        Employment
         (Ƶ4)              (Ƶ4**)        −0.09(Ƶ*4**) 0.31 **(Ƶ4**   ) 1.000            **
  Perceived
Employment)
       (Ƶ4status            ** **
                         −0.20
                          −0.20               −0.10     **         1.000      Covariates
                         −0.07          −0.13 **
                                        −0.10    **       −0.07         −0.04
                                                          1.000 Independent            1.000
                                                                                        Independent
                                                                                           Measures Independent
                                                                                                           MeasuresIndependent
                                                                                                                          Measures Measures
 benefits
 Literacy  ((X1)
   status (Ƶ (33))1)        **
                         1.000                                    Independent Measures
     Perceived         Perceived Perceived Perceived
      Land
  Perceived
Length
Proximity of stay
               (Ƶ2) 0.11   −0.07
                         −0.50  **        −0.13
                                          1.000 −0.07
                                                    **      −0.07
                                                             −0.13 −0.07
                                                                      ** −0.04 −0.07
                                                                                 −0.13
                                                                                     −0.07
                                                                                         **
                                                                                          1.000
                                                                                             −0.04
                                                                                                 −0.07
                                                                                                  −0.13 **1.000
                                                                                                              −0.04
                                                                                                                 −0.07 1.000−0.04      1.000
         Length
   benefits    (X1)benefits
                         −0.07    (X1)−0.13
                                        benefits
                                         −0.09**  * (X1)
                                                 **        benefits
                                                          −0.07
                                                         0.31  **       −0.15
                                                                        (X1)
                                                                        −0.04
                                                                        1.000          1.000
  Ownership
 benefits4) (X1)
       (Ƶof
Employment   stay       0.12** ** ** 0.20−0.09
                         −0.20
                          −0.50                          *−0.07Land
                                                                  0.31 ****             0.04
                                                                                     1.000            1.000
        Land
      (X2)(Ƶ             Land                Land
                                        −0.10 **          1.000
      Land
   status  ( 34))           **                                             −0.15
                                                                  Independent                −0.15
                                                                                        Measures              −0.15         −0.15
    Ownership          Ownership
                          0.12 ** Ownership0.200.12** ** Ownership
                                                            −0.07
                                                              0.20
                                                                 0.12**−0.15
                                                                         ** −0.07 0.20
                                                                                    0.12**0.04
                                                                                           ** −0.070.201.000
                                                                                                         ** 0.04−0.07 1.000
                                                                                                                          0.04       1.000
                                                                                                                                        0.04      1.000
Conservation
  Ownership
  Perceived
Length    of  stay      0.12
                         −0.50  **       0.20 **          −0.07               **        0.04 ** 1.000 **                       **
        (X2)              (X2)
                         −0.07          −0.13
                                         −0.09(X2)
                                                 **
                                                  *      −0.13*
                                                          −0.07
                                                         0.31 ** (X2)      **
                                                                        −0.04
                                                                        1.000          1.000
  Awareness
      (X2)
 benefits
       (Ƶ4) (X1)         −0.06
                            **            −0.06                          0.01         0.23   **      0.25  **     1.000
  Conservation        Conservation      Conservation        *
                                                           Conservation
      (X3)
Conservation
      Land                                                 −0.13* Independent  −0.13* Measures  −0.13*           −0.13*
    Awareness Awareness    −0.06 Awareness  −0.06
                                                −0.06 −0.13*Awareness
                                                               −0.06
                                                                   −0.06    0.01 −0.06
                                                                        −0.15        −0.06
                                                                                         0.230.01
                                                                                               ** −0.060.25
                                                                                                          0.23
                                                                                                             **0.01
                                                                                                                ** 1.000
                                                                                                                       0.25
                                                                                                                         0.23
                                                                                                                            **0.01
                                                                                                                               ** 1.000
                                                                                                                                    0.25
                                                                                                                                      0.23
                                                                                                                                         ** ** 1.000
                                                                                                                                                 0.25 **       1.000
  Awareness
  Ownership
  Perceived              −0.06
                        0.12    **        −0.06
                                         0.20   **        −0.07*         0.01 * 0.23    0.04** *0.25  1.000**       *
                                                                                                                  1.000
        (X3)              (X3)
                         −0.07          −0.13(X3)**         * (X3) −0.04
                                                          −0.07            **          1.000
      (X3) (X1)
      (X2)
 benefits
Conservation
      Land
                                                         −0.13*         −0.15
  Awareness
  Ownership              −0.06
                        0.12    **        −0.06
                                         0.20   **        −0.07          0.01         0.23
                                                                                        0.04**       0.25
                                                                                                      1.000**     1.000
                                                            *              **
      (X3)
      (X2)
Conservation
                                                         −0.13*
  Awareness              −0.06            −0.06                          0.01         0.23 **        0.25 **      1.000
ranged between
              ranged0.01
                       between
                           and
                           ranged
                                0.49,
                                  0.01
                                     between
                                        and
                                          ranged
                                          andwere
                                                0.49,
                                                  0.01
                                                     between
                                                       below
                                                         and
                                                          andwere
                                                                0.49,
                                                                 0.70
                                                                  0.01below
                                                                       and
                                                                       [80]
                                                                        and(see
                                                                             were
                                                                              0.49,
                                                                                0.70
                                                                                   Table
                                                                                     below
                                                                                     and
                                                                                      [80] were
                                                                                           5).
                                                                                            (see
                                                                                              0.70
                                                                                                Subsequently,
                                                                                                   Table
                                                                                                    below
                                                                                                     [80] (see
                                                                                                           5).0.70
                                                                                                                 Subsequently,
                                                                                                                  Table
                                                                                                                    [80]
                                                                                                                     cut (see
                                                                                                                           5).
                                                                                                                           off Subsequently,
                                                                                                                                 points
                                                                                                                                  Table
                                                                                                                                      cut 5).
                                                                                                                                            offSubsequently,
                                                                                                                                                points
                                                                                                                                                     cut off points
                                                                                                                                                                  cut off points
 were earmarked
              were earmarked
                     to determine
                           were earmarked
                                  to multicollinearity—tolerance
                                       determine
                                          were earmarked
                                                  to determine
                                                       multicollinearity—tolerance
                                                                  to determine
                                                                      multicollinearity—tolerance
                                                                                value
                                                                                    multicollinearity—tolerance
                                                                                        of less
                                                                                              value
                                                                                                  0.10,oforless
                                                                                                             avalue
                                                                                                                variance
                                                                                                                  0.10,oforless
                                                                                                                              inflation
                                                                                                                              avalue
                                                                                                                                 variance
                                                                                                                                  0.10,oforless
                                                                                                                                             ainflation
                                                                                                                                                variance
                                                                                                                                                 0.10, or ainflation
                                                                                                                                                             variance inflation
 factor (VIF)factor
                value(VIF)
                       of above
                           factor
                             value10
                                  (VIF)
                                    of[84]
                                         above
                                          factor
                                            value
                                             (p. 164).
                                                 10
                                                  (VIF)
                                                    of[84]
                                                         above
                                                          The
                                                           value
                                                             (p.tolerance
                                                                  164).
                                                                  10of[84]
                                                                       above
                                                                         The(p.
                                                                             value
                                                                               tolerance
                                                                                164).
                                                                                10 [84]
                                                                                     forThe
                                                                                          (p.
                                                                                          each
                                                                                            value
                                                                                             tolerance
                                                                                              164).
                                                                                                  of for
                                                                                                     the
                                                                                                       The
                                                                                                         each
                                                                                                          variables
                                                                                                           value
                                                                                                             tolerance
                                                                                                                  offor
                                                                                                                     thewas
                                                                                                                         each
                                                                                                                          variables
                                                                                                                           value 0.98
                                                                                                                                  offor
                                                                                                                                     the
                                                                                                                                      orwas
                                                                                                                                         each
                                                                                                                                          variables
                                                                                                                                                0.98
                                                                                                                                                 of the
                                                                                                                                                      orwas
                                                                                                                                                         variables
                                                                                                                                                             0.98 orwas 0.98 or
 less with .98less
                 as with
                    the highest,
                         .98
                           less
                              aswith
                                 the
                                   which
                                       highest,
                                        .98
                                          less
                                             as
                                             is with
                                                greater
                                                the
                                                  whichhighest,
                                                        .98 than
                                                             as
                                                             is the
                                                                greater
                                                                   which
                                                                   0.10.
                                                                      highest,
                                                                          The
                                                                           than
                                                                            is greater
                                                                                variance
                                                                                 which
                                                                                  0.10. The
                                                                                         than
                                                                                          isinflation
                                                                                             greater
                                                                                               variance
                                                                                                 0.10. The
                                                                                                        than
                                                                                                         factor
                                                                                                            inflation
                                                                                                               variance
                                                                                                                 0.10.
                                                                                                                   (VIF)
                                                                                                                       The
                                                                                                                         factor
                                                                                                                           was
                                                                                                                            inflation
                                                                                                                               variance
                                                                                                                                   1.432
                                                                                                                                   (VIF)factor
                                                                                                                                            was
                                                                                                                                            inflation
                                                                                                                                                  1.432
                                                                                                                                                  (VIF)factor
                                                                                                                                                         was 1.432
                                                                                                                                                               (VIF) was 1.432
 (highest), which
              (highest),
                     was which
                           below
                           (highest),
                                  was
                                   the which
                                         cut-off
                                          (highest),
                                          belowwas the
                                                   of 10.which
                                                          cut-off
                                                          below
                                                             Collectively,
                                                                  was
                                                                   the
                                                                   of 10.
                                                                        cut-off
                                                                        below
                                                                            Collectively,
                                                                              thethe
                                                                                  ofmulticollinearity
                                                                                     10.
                                                                                      cut-off
                                                                                          Collectively,
                                                                                             theofmulticollinearity
                                                                                                    10. Collectively,
                                                                                                            assumption
                                                                                                             the multicollinearity
                                                                                                                            assumption
                                                                                                                             the
                                                                                                                               was multicollinearity
                                                                                                                                     not assumption
                                                                                                                                               was not assumption
                                                                                                                                                            was not was not
 violated. Inviolated.
               addition,Indiscriminant
                           violated.
                            addition,Inviolated.
                                          discriminant
                                           addition,
                                             validityInassessment
                                                          discriminant
                                                           addition,
                                                             validity discriminant
                                                                        assessment
                                                                         was
                                                                           validity
                                                                               performed,
                                                                                       assessment
                                                                                        was
                                                                                          validity
                                                                                              performed,
                                                                                               and theassessment
                                                                                                       wasbivariate
                                                                                                              performed,
                                                                                                               and thewas
                                                                                                                        correlations
                                                                                                                          bivariate
                                                                                                                              performed,
                                                                                                                                and thecorrelations
                                                                                                                                          bivariate
                                                                                                                                               and thecorrelations
                                                                                                                                                        bivariate correlations
Sustainability 2020, 12, 1524                                                                                                                                  9 of 17
 ranged from  ranged
                 0.01 to
                       from
                          0.49,
                           ranged
                              0.01
                                while
                                    to
                                     from0.49,
                                          reliabilities
                                          ranged
                                             0.01
                                                while
                                                    to
                                                     from0.49,
                                                          reliabilities
                                                           were
                                                             0.01
                                                                while
                                                                  from
                                                                    to 0.49,
                                                                        reliabilities
                                                                         were
                                                                          0.56while
                                                                                to
                                                                                 from
                                                                                    0.70.
                                                                                       reliabilities
                                                                                        were
                                                                                         0.56
                                                                                           Thus,
                                                                                               to
                                                                                                from
                                                                                                   0.70.
                                                                                                    discriminant
                                                                                                       were
                                                                                                        0.56
                                                                                                          Thus,to
                                                                                                                from
                                                                                                                   0.70.
                                                                                                                    discriminant
                                                                                                                       validity
                                                                                                                       0.56
                                                                                                                          Thus,to 0.70.
                                                                                                                                    discriminant
                                                                                                                                    wasvalidity
                                                                                                                                          Thus, discriminant
                                                                                                                                                   wasvalidity was validity was
 verified forverified
               the constructs.
                        forverified
                            the constructs.
                                      forverified
                                           the constructs.
                                                      for the constructs.

                     Table 5. Correlation
                                 Table 5. matrix
                                          Correlation
                                            Tableof study
                                                    5. Correlation
                                                       matrix
                                                         Table    Table
                                                          variables,
                                                              of 5.
                                                                 study    5.ofCont.
                                                                    Correlation
                                                                    matrix
                                                                     means
                                                                       variables,
                                                                              and
                                                                               study
                                                                                 matrix
                                                                                   standard
                                                                                    means
                                                                                      variables,
                                                                                         of and
                                                                                            study
                                                                                              deviations.
                                                                                                 standard
                                                                                                 means
                                                                                                   variables,
                                                                                                        and
                                                                                                          deviations.
                                                                                                              standard
                                                                                                              means anddeviations.
                                                                                                                         standard deviations.

    Variables
       Variables VariablesƵ11         Ƶ2 Ƶ21
                                  Variables        Ƶ3 Ƶ2 Ƶ31 Ƶ4 Ƶ3 Ƶ2 Ƶ41 X1 Ƶ4 Ƶ3 Ƶ2X1
                                                  Variables                                X2X1Ƶ4 Ƶ3 X3   X2X2X1Ƶ4 X4X3  X2X1 X5X4X3
                                                                                                                        X3             X2 Y1 X5X4X3
                                                                                                                                      X4          X5 Y1 X5X4Y1   Y1 X5     Y1
                                                                  Covariates       Covariates
                                                                          Independent Measures      Covariates     Covariates
   Literacy ( 1)Literacy
                       1.000( 1)Literacy
                                       1.000 ( 1)Literacy
                                                       1.000 ( 1)       1.000
       Perceived
  Proximity (ƵProximity
                 2)   0.11 **(ƵProximity
                                2) 1.000
                                      0.11 **(ƵProximity
                                                2) 1.000
                                                      0.11 **(Ƶ2) 1.0000.11 **       1.000
       benefits         −0.07        −0.13 **          −0.07           −0.04            1.000
  Employment           −0.20 Employment
          (X1) Employment              −0.20 Employment−0.20            −0.20
                                  −0.10 **       1.000
                                                  −0.10 **        1.000
                                                                   −0.10 **       1.000
                                                                                   −0.10 **        1.000
    status (Ƶ3) status**(Ƶ3) status**(Ƶ3) status**(Ƶ3)                    **
         Land
  Length of stay Length−0.50   Length−0.50
                          of stay              Length−0.50
                                         of stay         of stay        −0.50
       Ownership 0.12 ** −0.09        0.20* ** 0.31    −0.07
                                                   −0.09
                                                      **    * 1.000
                                                                 0.31 −0.15
                                                                       ** * **
                                                                    −0.09      1.000
                                                                                 0.31  **0.04
                                                                                    −0.09   * 1.000
                                                                                                  0.31 **1.000 1.000
           4)
        (Ƶ(X2)         (Ƶ4**
                           )          (Ƶ4**
                                          )           (Ƶ4**
                                                          )               **
                                                         IndependentIndependent
                                                                            Measures Independent
                                                                                             MeasuresIndependent
                                                                                                             Measures Measures
       Conservation
    Perceived Perceived Perceived Perceived
       Awareness −0.07  −0.06 −0.13    −0.06
                                       −0.07
                                          **         −0.13**
                                                 −0.07
                                                  −0.13−0.07
                                                          ** −0.04−0.07
                                                                   −0.13 0.01
                                                                        −0.07
                                                                           **
                                                                            1.000
                                                                               −0.04
                                                                                  −0.070.23
                                                                                   −0.13      **−0.04
                                                                                           **1.000 −0.070.251.000
                                                                                                              **−0.04 1.000
                                                                                                                          1.000
   benefits
          (X3)(X1)benefits (X1)benefits (X1)benefits (X1)
       Land          Land            Land            Land
         Local                                                −0.15            −0.15            −0.15           −0.15
    Ownership Ownership
                      0.12 ** Ownership
                                   0.20
                                      0.12
                                         ** ** Ownership
                                                 −0.07
                                                   0.20
                                                      0.12
                                                         ** ** −0.070.20
                                                                       0.12
                                                                          **0.04
                                                                             ** −0.07
                                                                                    0.201.000
                                                                                          ** 0.04−0.07 1.000 0.04       1.000
                                                                                                                           0.04       1.000
       Benefits        0.13 **        0.14 **           0.05 **          0.02 ** −0.40 ** ** −0.17 ** ** −0.32 **                   1.000
       (X2)           (X2)           (X2)            (X2)
          (X4)
  Conservation   Conservation  Conservation     Conservation
       Resource                                  −0.13*           −0.13*          −0.13*           −0.13*
    Awareness Awareness−0.06
                        −0.05 Awareness
                                    −0.06
                                       −0.06 Awareness
                                       −0.01        −0.06
                                                       −0.06 0.01 −0.06 −0.06
                                                                           0.230.01
                                                                                 ** −0.06
                                                                                        0.25
                                                                                           0.23**0.01
                                                                                                  ** 1.000
                                                                                                         0.25
                                                                                                            0.23
                                                                                                               **0.01
                                                                                                                  ** 1.000
                                                                                                                       0.25
                                                                                                                         0.23
                                                                                                                           **** ** −0.176
                                                                                                                                   1.000
                                                                                                                                     0.25 **   1.000
       Use (X5)                                     * −0.07          * −0.01         * 0.10 **        * 0.26**        0.35                **     1.000
       (X3)           (X3)           (X3)            (X3)
                                                                            Dependent Measure
          KTP
        Support       −0.16 **       −0.11 **       −0.07           0.04         0.30 **       0.16 **        0.25 **      −0.40 **        0.16 **       1.000
          (Y1)
         Mean           0.60           0.62          2.46          28.51          0.37           3.64          4.24           2.69          4.00          3.82
       Standard
                        0.49           0.49          1.20          19.84          0.32           0.86          0.45           0.68          0.76          0.63
       Deviation
               * Correlation Significant at the 0.05 level (2 tailed); ** Correlation significant at the 0.01 level (2 tailed).

4.4. Regression Analysis
      Hierarchical regression was conducted with five predictor independent measures (perceived
benefits, land ownership, conservation awareness, local benefits, and resource use) along with four
covariates (literacy, proximity, employment status, and length of stay) on the outcome dependent
measure (KTP support). Except for perceived benefits that employed an index, means of the predictor
and outcome constructs were used in the analysis. The use of means has two advantages. First, “it
provides a means of overcoming to some extent the measurement error inherent in all measured
variables,” and second, the mean is able “to represent the multiple aspects of a concept in a single
measure” [81] (p. 116–117). In the analysis, two models were produced and referred to as Model 1 and
2 (see Table 6).
      Model 1 presents the effects of the four covariates (literacy, proximity, employment status, and
length of stay) on KTP support. The relationship was significant (F = 8.854, p < 0.001) as the variables
explained 4.6% of the variance in KTP support. Literacy (beta = −0.183, p < 0.001), proximity (beta =
−0.100, p < 0.01) and employment status (beta = −0.102, p < 0.01) were all significant and had negative
relationships with KTP Support. However, length of stay failed to register a significant relationship.
So, the next step was to control the four covariates, and identify if the five independent variables could
predict a significant amount of variance in KTP support.
      Model 2 was highly significant (F= 23.281, p < 0.001) along with the change in the F value
(F = 33.273, p < 0.001). Results demonstrated that with the control of the four covariates, the five
independent variables predicted a significant amount of variance in KTP support. This new model
explained 22.2% of the variance with the five independent variables that accounted for 17.7% of
additional variance. Of the four covariates, only literacy had a significant effect on KTP support (beta
= −0.116, p < 0.01). Essentially, any increase in the level of literacy resulted in support for KTP. Among
the five independent variables, only resource use was not statistically significant. Perceived benefits
(beta = 0.143, p < 0.001), land ownership (beta= 0.109, p < 0.01), conservation awareness (beta= 0.071, p
< 0.05), and local benefits (beta= 0.272, p < 0.001) were all positively related to KTP support. In addition,
local benefits had the strongest relationship followed by perceived benefits, land ownership, and then
WMAs.
    correlation     analysis was
            Furthermore,                 conducted
                                   several      techniquesalongwere with useda collinearity
                                                                                     to ensure     diagnosis.
                                                                                                       against The       bivariate correlations
                                                                                                                  multi-collinearity.        First, a
                                                             * Scale standard deviation in brackets.
    ranged    between
      correlation          0.01
                      analysis      and
                                     was  0.49,   and
                                            conducted   werealongbelow with  0.70
                                                                               a    [80]  (see
                                                                                   collinearity   Table   5).
                                                                                                     diagnosis.Subsequently,
                         Furthermore, several techniques were used to ensure against multi-collinearity. First, a   The            cut
                                                                                                                            bivariate   off  points
                                                                                                                                        correlations
    were   earmarked
      ranged    between     to0.01
                  correlation    determine
                                      and
                                    analysis     multicollinearity—tolerance
                                             0.49,  and
                                                  was      were below
                                                        conducted              0.70
                                                                           along      [80]to
                                                                                     with    value
                                                                                            a(see      of less
                                                                                                    Table
                                                                                                collinearity5). 0.10,  or a variance
                                                                                                                 Subsequently,
                                                                                                                 diagnosis.      Thecut   inflation
                                                                                                                                          off points
                                                                                                                                       bivariate   correlations
                  Furthermore,           several     techniques          were     used           ensure     against      multi-collinearity.      First,  a
    factor  (VIF)
      werecorrelationvalue
             earmarked        of
                               to above
                                   determine10   [84] (p.   164).    The    tolerance
                                                   multicollinearity—tolerance            valuevaluefor  each
                                                                                                         of lessof  the
                                                                                                                  0.10,  variables
                                                                                                                          or  a       was
                                                                                                                                variance    0.98cut
                                                                                                                                                  or off points
                  rangedanalysis
                              betweenwas    0.01conducted
                                                   and 0.49, and   along werewith below    0.70 [80] (see
                                                                                     a collinearity             Table 5).
                                                                                                          diagnosis.      The    bivariate inflation
                                                                                                                              Subsequently,  correlations
    less with(VIF)
      factor    .98
                  wereas  the
                       value     highest,
                                 of above
                          earmarked          which
                                            to 10  [84]is(p.
                                                 determine greater
                                                               164).   than
                                                                       The     0.10. The value
                                                                              tolerance
                                                                 multicollinearity—tolerance  variance     inflation
                                                                                                      forTable
                                                                                                           each
                                                                                                            value ofof  factor
                                                                                                                      the        (VIF)
                                                                                                                            variables
                                                                                                                         less  0.10,    was
                                                                                                                                     orwas
                                                                                                                                         acut 1.432or inflation
                                                                                                                                              0.98
                                                                                                                                            variance
           ranged
Sustainability        between
               2020, 12,   1524      0.01 and      0.49,  and    were      below     0.70 [80] (see               5).  Subsequently,            off points
                                                                                                                                                     10 of 17
    (highest),
           withwhich
      less were    .98
                  factoras was
                            the    below
                                   highest,
                           (VIF) value        the  cut-off
                                                which    is   of  10.
                                                             greater    Collectively,
                                                                          than
                                               of abovemulticollinearity—tolerance0.10.    the
                                                                                         The
                                                            10 [84] (p. 164). The tolerance       multicollinearity
                                                                                                variance     inflation
                                                                                                          value   for each assumption
                                                                                                                           factor  (VIF)   was
                                                                                                                                           was   notwas
                                                                                                                                                1.432
                    earmarked         to determine                                                    value   of less   0.10,of orthe  variables
                                                                                                                                   a variance            0.98 or
                                                                                                                                                 inflation
    violated.
      (highest),Inless
                    addition,
                    which     was  discriminant
                                      below     the   validity
                                                     cut-off    of  assessment
                                                                     10.              was
                                                                           Collectively,    performed,
                                                                                              the             and the bivariate
                                                                                                    multicollinearity                 correlations
                                                                                                                             assumption      was  not
           factor (VIF) value of above 10 [84] (p. 164). The tolerance value for each of the variables was 0.98 or1.432
                        with     .98   as the   highest,     which      is greater     than    0.10.   The   variance     inflation   factor  (VIF)  was
    ranged    from
      violated.    In 0.01   to 0.49,
                      addition,           while
                                      discriminant reliabilities
                                                         validity     were    from
                                                                      assessment       0.56
                                                                                        wasto     0.70. Thus,
                                                                                               performed,  the anddiscriminant
                                                                                                                      the bivariate  validity   was was not
conservation      (highest),
           less with     .98 aswhich
                    awareness.     the      was below
                                         highest,
                                        Basically,   which
                                                        any  theis cut-off
                                                                    greater
                                                                increase      of
                                                                               in 10.
                                                                                thaneachCollectively,
                                                                                        0.10.
                                                                                           ofThe the variance
                                                                                                       independent inflation    factor correlations
                                                                                                                multicollinearity
                                                                                                                            variables   assumption
                                                                                                                                        (VIF)
                                                                                                                                          (i.e.,was  1.432
                                                                                                                                                 perceived
    verified   for
      ranged from   the  constructs.
                        0.01
                  violated.      to addition,
                                 In  0.49,  while    reliabilities
                                                   discriminant         were
                                                                       validity  from    0.56 to 0.70.
                                                                                    assessment              Thus,    discriminant
                                                                                                      wasmulticollinearity
                                                                                                            performed,       and the validity
                                                                                                                                       bivariatewascorrelations
benefits,(highest),       which
            land ownership,          was    below
                                         conservationthe cut-off       of
                                                               awareness,  10. Collectively,         the
                                                                                   and local benefits)           resulted inassumption
                                                                                                                                   support forwas      not
                                                                                                                                                    KTP.
      verified   for
           violated.  the
                  rangedIn  constructs.
                              from 0.01discriminant
                             addition,        to 0.49, while       reliabilities
                                                                validity             were from
                                                                             assessment       was      0.56 to 0.70.and
                                                                                                      performed,        Thus,the discriminant
                                                                                                                                 bivariate        validity was
                                                                                                                                             correlations
                        Table 5. Correlation matrix of study variables, means and standard deviations.
           ranged verified
                      from6.for0.01 theto constructs.
                                           0.49, while      reliabilities     were     from    0.56    to 0.70.  Thus, discriminant
                   Table  Table  Hierarchical
                                    5. Correlation  regression
                                                      matrix     of analysis
                                                                     study        with
                                                                              variables, KTP
                                                                                           means  support    as dependent        variable. validity was
       Variables             Ƶ
           verified for the constructs.
                               1           Ƶ2           Ƶ3            Ƶ4           X1           X2 and standard
                                                                                                            X3        deviations.
                                                                                                                          X4          X5        Y1
         Variables                        Ƶ1         TableƵ2 5. Correlation
                                                                        Ƶ3       matrix
                                                                                     Ƶ4 of 1study
                                                                                    Covariates
                                                                                     Model       X1 variables,X2 means    X3and standard     deviations.
                                                                                                                                       X4 Model  2X5       Y1
      Literacy ( 1)                 1.000Table 5. Correlation matrix ofCovariates       study  variables,    means    and   standard   deviations.
                           Variables                      Ƶ1        B Ƶ2             Ƶ3
                                                                                     Beta        Ƶ4 T-Value   X1          X2 B        X3 Beta X4             X5
                                                                                                                                                       T-Value        Y1
     Proximity
        Literacy(Ƶ( 2)1) 0.11              **
                                       1.000          1.000
     Covariates Variables−0.20 Ƶ1                                Ƶ2           Ƶ3           Ƶ4      Covariates
                                                                                                       X1           X2           X3         X4        X5         Y1
      Employment
       Proximity (Ƶ          2)      0.11
                         Literacy         ( 1** ) −0.10 1.000
                                                            **
                                                        1.000       1.000                   Covariates
       status
     Literacy   (Ƶ
                (
        Employment 31))                **
                                       −0.20                     −0.236            −0.183             −4.420   ***         −0.150          −0.116       3.044 **
              LiteracyProximity ( −0.50
                                    1)
                                            (Ƶ21.000
                                                 ) −0.10
                                                       0.11 ** **     1.000
                                                                      1.000
     Length
         status
     Proximity of stay
                   (Ƶ   32))
                   ( Employment           **                     −0.130            −0.100              −2.762 **           −0.077          −0.059         1.725
            Proximity             (Ƶ   )       0.11 −0.09
                                                      **−0.20* 1.000
                                                                  0.31 **       1.000
           (Ƶ4) of stay
       Length
                                     2 **
                                       −0.50                        −0.10 **       1.000
     Employment
             Employment     status
                           Status       (Ƶ
                                        (  33))           **
                                                −0.20−0.09 *     −0.054
                                                                     0.31 **       −0.102
                                                                                  1.000 Measures       −2.685   **         −0.030          −0.057         1.643
              (Ƶ4) Length of **            stay         −0.50−0.10 ** Independent
                                                                            1.000
     Length    ofstatus
       Perceived   Stay (Ƶ    ( 34))               **            −0.001
                                                                     −0.09 *       −0.028
                                                                                  0.31  **     1.000    −0.660              0.001          0.020          0.522
            Length                (Ƶ−0.07
                            of stay  4)             −0.13****
                                                −0.50               −0.07 Independent
                                                                                −0.04          Measures
                                                                                             1.000
      benefits
     Independent
         Perceived(X1)      Measures                          −0.09 *      0.31 **       1.000
          Land benefits(Ƶ4)            −0.07 ** −0.13 **              −0.07       −0.04 Independent
                                                                                               1.000        Measures
        benefits
     Perceived       (X1)   Perceived(X1)                                       −0.15                                       0.278          0.143       3.964 ***
       Ownership                  0.12 **            0.20  **
                                                        −0.07       −0.07
                                                                    −0.13 **        Independent
                                                                                   −0.07 0.04         Measures
                                                                                               −0.04 1.000  1.000
            Land benefits
     Land(X2)
           Ownership               (X2)  (X1)                                     **                                        0.080          0.109        3.047 **
                Perceived                                                         −0.15
         Ownership Land               0.12 **−0.070.20−0.13   ** **−0.07−0.07            −0.04 0.041.000 1.000
             benefitsAwareness
     Conservation
     Conservation              (X1)               (X3)                               **        −0.15                        0.100          0.071         1.954 *
             (X2) Ownership                            0.12 ** −0.13*0.20 **       −0.07                     0.04        1.000
       Awareness
     Local          Land
            Benefits (X4)           −0.06             −0.06                      0.01       0.23  **
                                                                                                 **      0.25  **     1.000 0.251          0.272       7.213 ***
       Conservation              (X2) 0.12 **                         * −0.07            −0.15
          (X3) Ownership                                      0.20 **−0.13*                           0.04         1.000
         Awareness
     Resource      Use      (X5)
                       Conservation    −0.06            −0.06                      0.01 ** 0.23 **         0.25 **      1.000
                                                                                                                            0.027          0.032          0.910
                      (X2)                                              *         −0.13*
             (X3) Awareness                             −0.06         −0.06                     0.01       0.23  **     0.25  **     1.000
     R2      Conservation                                                            0.046                                                 0.222
                                 (X3)                                      −0.13* *
     Adj. R2 Awareness                          −0.06          −0.06
                                                                              *      0.0410.01       0.23 **      0.25 **      1.000       0.213
                      (X3)
     F Value                                                                      8.854 ***                                              23.281 ***
     df                                                                  4738                                                        9733
     ∆R2                                                                                                                             0.177
     ∆F                                                                                                                           33.273 ***
     VIF
You can also read