Climate Assessment for the electorate of Herbert - The Australia Institute
←
→
Page content transcription
If your browser does not render page correctly, please read the page content below
Climate Assessment for
the electorate of
Herbert
The electorate of Herbert stands to be heavily impacted
by climate change. Increasing floods, drought and
heatwaves will impact the community’s health,
environment, infrastructure and vital industries,
particularly agriculture and mining unless decisive action
is taken to tackle climate change
Report
Mark Ogge
April 2019
ABOUT THE AUSTRALIA INSTITUTE
The Australia Institute is an independent public policy think tank based in Canberra. It
is funded by donations from philanthropic trusts and individuals and commissioned
research. We barrack for ideas, not political parties or candidates. Since its launch in
1994, the Institute has carried out highly influential research on a broad range of
economic, social and environmental issues.

OUR PHILOSOPHY
As we begin the 21st century, new dilemmas confront our society and our planet.
Unprecedented levels of consumption co-exist with extreme poverty. Through new
technology we are more connected than we have ever been, yet civic engagement is
declining. Environmental neglect continues despite heightened ecological awareness.
A better balance is urgently needed.

The Australia Institute’s directors, staff and supporters represent a broad range of
views and priorities. What unites us is a belief that through a combination of research
and creativity we can promote new solutions and ways of thinking.

OUR PURPOSE – ‘RESEARCH THAT MATTERS’
The Institute publishes research that contributes to a more just, sustainable and
peaceful society. Our goal is to gather, interpret and communicate evidence in order to
both diagnose the problems we face and propose new solutions to tackle them.

The Institute is wholly independent and not affiliated with any other organisation.
Donations to its Research Fund are tax deductible for the donor. Anyone wishing to
donate can do so via the website at https://www.tai.org.au or by calling the Institute
on 02 6130 0530. Our secure and user-friendly website allows donors to make either
one-off or regular monthly donations and we encourage everyone who can to donate
in this way as it assists our research in the most significant manner.

Level 1, Endeavour House, 1 Franklin St
Canberra, ACT 2601
Tel: (02) 61300530
Email: mail@tai.org.au
Website: www.tai.org.au
ISSN: 1836-9014
Summary
The electoral profile of Herbert describes the local industries as:
“Copper, nickel and zinc refineries, bulk sugar terminal, and tropical fruits,
prawn and fishing industry, beef cattle and tourism. Townsville, noted for its
port facilities, is also home to James Cook University, the Great Barrier Reef
Marine Park Authority and large defence establishments at Lavarack Barracks
(Army) and Garbutt (RAAF).
Most of these industries are likely suffer serious impacts from climate change. Many
workers in copper, nickel and zinc refineries are required to work in spaces without air-
conditioning. Soldiers, construction and mining workers are required to undertake
strenuous work outdoors wearing heavy clothing and will be put at risk by increasing
heatwaves. Tropical fruits and grazing both suffer from extreme temperatures, floods,
droughts and changes in rainfall and evaporation. The Great Barrier Reef and fisheries
are under threat from rising ocean temperatures and ocean acidification, representing
an existential risk to the tourism and fishing industries.
This climate assessment finds that:
Unless strong action is taken on climate change, by 2070, well within our
children’s lifetime, the electorate of Herbert is projected to experience:
o Up to 30 percent increase in evaporation.
o Up to 50 percent reduction in rainfall.
o Up to 100 percent increase heatwave days per year.
o Single heatwaves lasting up to over 50 days.
o A 90-130 percent increase in the frequency of droughts and floods.
o Coastal inundation effecting over 4000 properties in 23 suburbs (by
2100)
These climate impacts would result in highly disruptive and costly impacts on
the community and economy including:
o Increased damage to property and infrastructure
o Reduced agricultural yields
o Reduced workforce productivity
o Increasing heat related illnesses and deaths
Most of these impacts can be avoided if the globally agreed Paris climate target
of 1.5 degrees is achieved.
Climate Assessment for the electorate of Herbert 1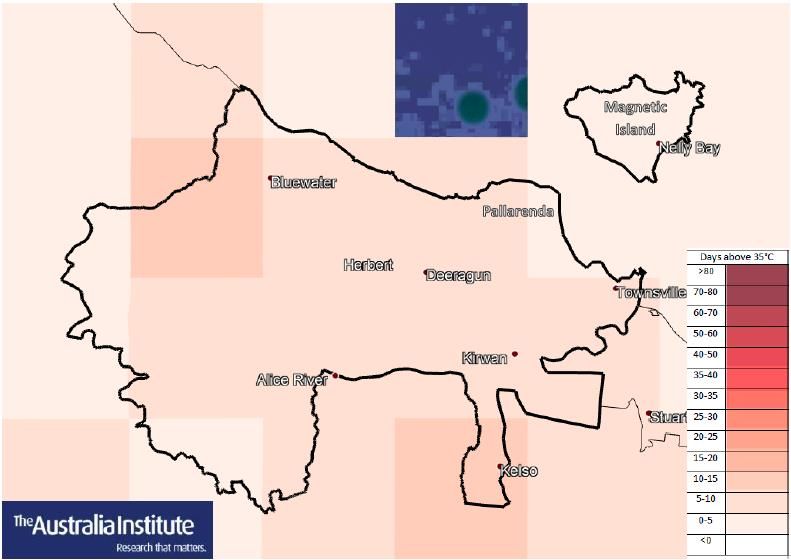
Table of Contents
Summary .................................................................................................................. 1
Introduction ............................................................................................................. 3
   Projected changes to Herbert’s climate ............................................................................4
       Decreasing rainfall and increasing evaporation in Herbert ................................................................ 4
       Increasing extreme heat in Herbert .................................................................................................... 7
       Increasing Heatwaves in Herbert ...................................................................................................... 10
       Sea level rise and coastal inundation ................................................................................................ 12

The economic costs of climate change impacts in Herbert ....................................... 14
   Natural disasters ........................................................................................................... 14
   Health ........................................................................................................................... 15
   Heat stress and Townsville’s workforce .......................................................................... 17
       Mining workers ................................................................................................................................. 18

   Agriculture .................................................................................................................... 20
       Impacts on cropping ......................................................................................................................... 20
       Impacts on grazing ............................................................................................................................ 21

   Infrastructure and industry ............................................................................................ 22

Conclusion .............................................................................................................. 24
Appendix ................................................................................................................ 25

    Climate Assessment for the electorate of Herbert                                                                                                   2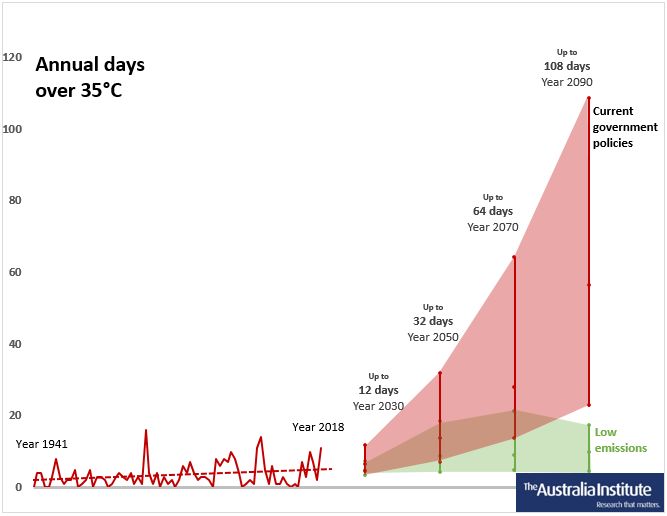
Introduction
The electoral Division of Herbert includes Palm Island Aboriginal Shire Council, part of
Hinchinbrook Shire Council, and part of the Townsville City Council.
This paper examines the projected impact of climate change in these regions on:
Rainfall
Evaporation
Extreme temperature
Heatwaves
This assessment draws on projections from the Queensland Government’s Future
Climate Dashboard.1 The Dashboard has been developed by the Queensland
Department of Environment and Sciences (DES), providing a comprehensive set of high
resolution climate change projections for the state to assist the community and
industries of Queensland to understand the changes and to support climate adaptation
plans.
The assessment also draws on CSIRO/Bureau of Meteorology Climate Change in
Australia projections which were primarily developed to support the planning needs of
Australia’s natural resource management sector, and to provide information to assist
climate adaptation processes. These projections use up to 40 global climate models
and are the most comprehensive analysis of Australia’s future climate ever
undertaken.2
1
Queensland Government (2018) Future Climate Dashboard,
https://app.longpaddock.qld.gov.au/dashboard/#responseTab1
2
CSIRO/BOM, Climate Change in Australia: Projections for Australia’s NRM regions,
https://www.climatechangeinaustralia.gov.au/en/
Climate Assessment for the electorate of Herbert 3PROJECTED CHANGES TO HERBERT’S CLIMATE
Decreasing rainfall and increasing evaporation in
Herbert
Water availability in the regions that make up the Herbert electorate are dependent on
a number of factors including rainfall, the rate of evaporation and the distribution of
rainfall throughout the individual years and over extended periods.
Rainfall projections as a result of climate change are uncertain, ranging from a small
increase in average annual rainfall, to a large decrease (up to 50 percent in some areas
by 2070). Evaporation is projected to increase substantially, up to in excess of 25
percent by 2070 in mainland areas. Rainfall is also projected to be more concentrated,
with floods and droughts expected to become more frequent.
Evaporation
Increasing evaporation can exacerbate drought,3 reduce soil moisture,4 reduce water
levels in dams and reservoirs,5 and dry out vegetation increasing bushfire risk.6
Evaporation rates in the mainland areas of the Herbert electorate are expected to
increase substantially. Projections range from increases of 6 percent to over 25
percent by 2070. For instance, as shown in Figure 1 the projections for Townsville City
range from a 6 to 26 percent increase by 2070, with an average of all models being a
rise of 15 percent.
3 Hannan (2018), Record evaporation rates across eastern Australia exacerbate drought,
https://www.smh.com.au/environment/weather/record-evaporation-rates-across-eastern-australia-
exacerbate-drought-20180821-p4zys3.html
4 Steffen et al (2018) Deluge and drought: Australia’s water security in a changing climate,
https://www.climatecouncil.org.au/wp-content/uploads/2018/11/Climate-Council-Water-Security-
Report.pdf
5 Helfer et al (2012) Impacts of climate change on temperature and evaporation from a large reservoir
in Australia, https://www.sciencedirect.com/science/article/pii/S0022169412008827
6 Hughes et al (2018) Escalating Queensland Bushfire Threat: Interim Conclusions,
https://www.climatecouncil.org.au/wp-content/uploads/2018/11/Queensland-Bushfires-and-Climate-
Change_Interim-Conclusions.pdf
Climate Assessment for the electorate of Herbert 4Figure 1: Projected change in annual pan evaporation in Townsville City LGA
Source: QLD Government (2018) Future Climate Dashboard
Table 1 below shows the range of projected changes in rainfall for each of the local
government areas within the Herbert electorate.
Table 1: Projected change in annual pan evaporation in local government areas in the
Herbert electorate.
2030 2050 2070 2090
Townsville 1% decrease- 3-21% 6-26% 10-44%
16% increase increase increase increase
Hinchinbrook 2% decrease - 2-20% 6-26% 8-46%
13% increase increase increase increase
Palm Island 4% decrease-4% 5% decrease- 8% decrease- 11 decrease-
increase 2% increase 4% increase 4% increase
Source: QLD Government (2018) Future Climate Dashboard
Rainfall
Rainfall projections for the Herbert electorate are uncertain. The overall range is from
a small increase to large decrease. For instance, as shown in Figure 2 below the
Climate Assessment for the electorate of Herbert 5projections for Townsville City LGA range from a 12 percent increase in rainfall by 2070
to a 50 percent decrease, and up to a 78 percent decrease by 2090.
Figure 2: Projected change in annual precipitation Townsville City LGA.
Source: QLD Government (2018) Future Climate Dashboard
Table 2 below shows the range of projections for each of the local government regions
in the Herbert electorate over the coming decades.
Table 2: Projected change in annual precipitation of Local Government areas within
the electorate of Herbert.
2030 2050 2070 2090
Townsville 2% increase- 2% increase- % increase- 16% increase-
City 30% decrease 49% decrease 49% decrease 78% decrease
Hinchinbrook 1% increase- 2% increase- 4% increase- 6% increase-
22% decrease 42% decrease 45% decrease 70 %decrease
Palm Island 1% increase- 1% increase- 3%increase- 9% increase-
28% decrease 50% decrease 54% decrease 77% decrease
E
Source: QLD Government (2018) Future Climate Dashboard
Climate Assessment for the electorate of Herbert 6Increasing drought and floods
The Australian Bureau of Meteorology (BOM) has found climate change has already
increased the risk of major disruptions to Pacific weather (which includes Eastern
Australia), and the risk will continue to rise as global warming increases. These major
disruptions include drought and extreme rainfall.
The BOM modelling found there has already been a 30 percent increase in the
frequency of rainfall disruptions. That is projected to increase to 90 percent in the
early part of this century and 130 percent increase as century progresses.7
Increasing extreme heat in Herbert
Climate change is increasing land and ocean temperatures. These increases can be
measured as an increase in average temperatures over the year as a whole. Australia
has warmed by just over 1 degree as a result of greenhouse gas emissions (from pre-
industrial levels) and is projected to warm by up to over 5 degrees by the end of
century if global emissions remain high.8 The World Bank considers 4 degree
“devastating” with “extremely severe risks for vital human support systems.”9
QLD Government projections show an increase in the annual mean temperature for
QLD as a whole of up to 5.5 degrees by 2090.10 The projections for the regions within
the electoral division of Herbert follow a similar trajectory, with slight variations
between the regions. For example, the annual mean temperature is projected to rise
by up to 4.3 degrees by 2090 in Townsville.
However, while increasing average or mean temperatures can have serious impacts on
human health and activities, extreme temperature events are the most dangerous to
human health, agriculture and the natural environment.
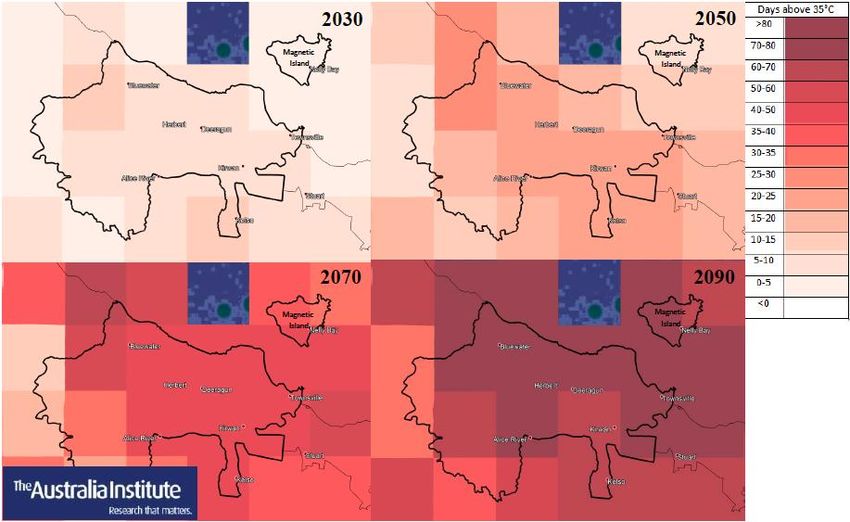
The QLD Government provides projections for the number of extreme heat days over
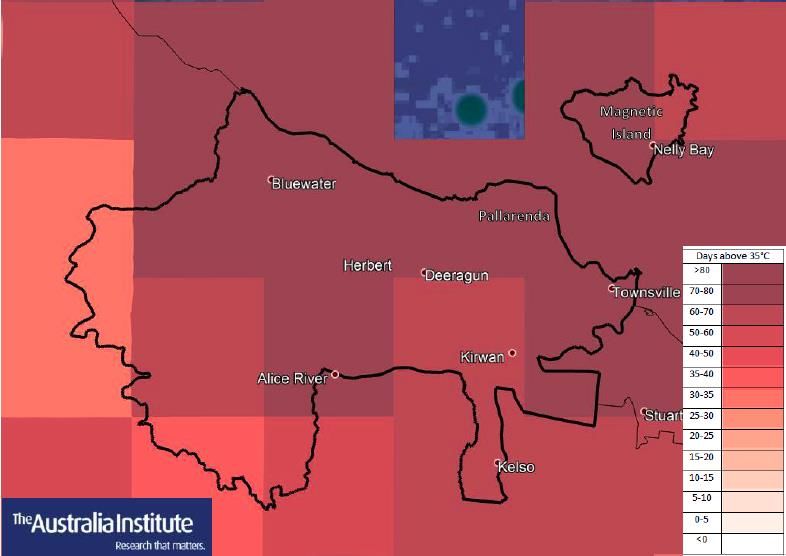
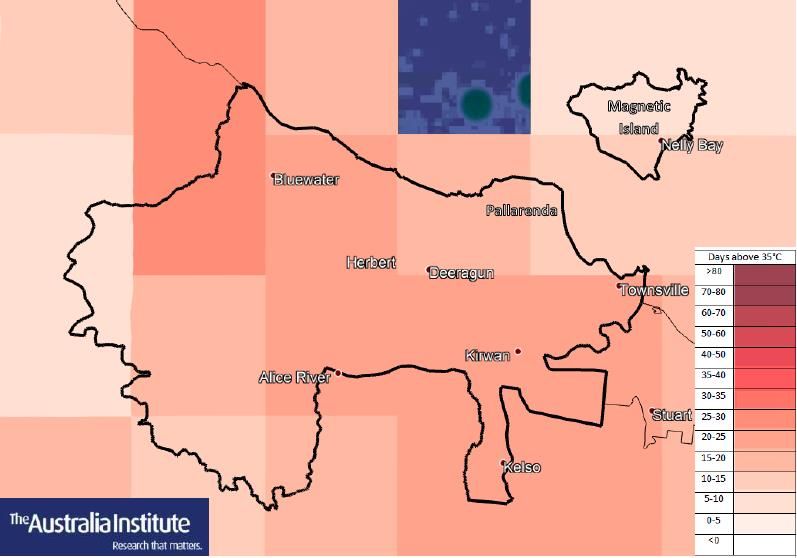
various thresholds. These maps in Table 3 below show the increasing frequency of
7
BOM (2017) Droughts and flooding rains already more likely as climate change plays havoc with Pacific
weather, http://www.bom.gov.au/climate/updates/articles/a023.shtml
8
BOM, CSIRO (2015) Australia’s changing climate,
https://www.climatechangeinaustralia.gov.au/media/ccia/2.1.6/cms_page_media/176/AUSTRALIAS_C
HANGING_CLIMATE_1.pdf
9
World Bank (2012) Turn down the heat: Why a 4 degrees Celsius warmer world must be avoided,
https://openknowledge.worldbank.org/handle/10986/11860
10Queensland Government (1018) Future Climate Dashboard, Mean Temperature
QLD, https://app.longpaddock.qld.gov.au/dashboard/#responseTab1
Climate Assessment for the electorate of Herbert 7extreme temperature days in the electorate of Herbert over the coming decades. The
darker the shade of red, the greater the increase in the amount of hot days per year in
that location.
Table 3: Projected increase in the number of days over 35 degrees per year in the
electorate of Herbert
Source: QLD Government (2018) Future Climate Dashboard
The CSIRO and BOM provide a separate set of projections, for the number of extreme
heat days over various thresholds for particular locations. These projections are
broadly consistent with the QLD Government projections but allow us to examine the
projections for particular locations, and also enable comparison between a business-
as-usual emissions scenario, and a scenario consistent with emissions reductions
required to meet the 1.5 degree Paris target.
Figures 3 below shows the historic and projected increase in extreme heat days for
Townsville. The red line shows actual recorded historic annual number of days over 35
degrees, with the dotted line showing the trend.
The red shaded area shows the range of projections from various climate models used
by the CSIRO and BOM over coming decades if emissions continue to increase on
current trajectories.
Climate Assessment for the electorate of Herbert 8The green shaded areas show the range of projected days over 35 if the world achieves
a reduction in greenhouse gas emissions consistent with the 1.5-degree target agreed
to by Australia and almost all other nations under the Paris Climate Agreement.
A reduction of emissions in line with the globally agreed target of 1.5 degrees avoids
the vast majority of the projected increase in extreme temperatures, leading to a
decline beginning around mid-century.
Figure 3: Forecast annual number of days over 35 degrees Townsville
Source: Bureau of Meteorology (2019) Climate data online,
http://www.bom.gov.au/climate/data/index.shtml; CSIRO and Bureau of Meteorology (2018)
Climate projections, provided on request
Climate Assessment for the electorate of Herbert 9Increasing Heatwaves in Herbert
Heatwaves occur when there are three consecutive days of extreme temperature.
Heatwaves have more serious consequences than hot days on their own, as people
(and animals) have less opportunity to recover from extreme temperatures.
Heatwaves are a serious health risk and have killed more people in Australia than all
other natural disasters combined.11
Heatwaves in Herbert are projected to become more frequent, hotter and longer. In
the Townsville region for example, as shown in Figure 8 below, the annual number of
heatwave days is projected to increase by up to around 180 percent by 2070.12
Figure 4: Projected increase in annual heatwave days Townsville LGA.
Source: QLD Government (2018) Future Climate Dashboard
Figure 9 below shows the range of the projected number of heatwave days per year in
each of the local government areas in Herbert.
11
McMichael et al (2003) Climate change and human health, risks and responses, p 53,
https://www.who.int/globalchange/publications/climchange.pdf
12
Queensland Government (2018), Queensland Future Climate Dashboard,
https://app.longpaddock.qld.gov.au/dashboard/#responseTab2
Climate Assessment for the electorate of Herbert 10Figure 5: Projected increase in annual heatwave days of Local Government Areas
within the electorate of Herbert.
2030 2050 2070 2090
Townsville 2-20% 13-65% 40-137% 69-179%
City
Hinchinbrook 2-24% 14-77% 55-155% 103-188%
Palm Island 7-52% 26-101% 58-161% 93-189%
Source: QLD Government (2018) Future Climate Dashboard
As well as becoming more frequent, heatwaves in the region are projected to become
hotter and longer. Heatwave amplitude (the hottest heatwave day of the year) in the
Townsville region is projected to increase by up to 5.6 degrees by 2090. Currently
heatwaves typically last a few days. The duration of heatwaves is projected to rise
dramatically over coming decades. A single heatwave in the Townsville region in 2070
is projected to last up to 54 days and by 2090, it could be up to 115 days per year, as
shown in Figure 9 below.13
Figure 6: Projected increase in annual heatwave duration Townsville City LGA.
13
Queensland Government (2018), Queensland Future Climate Dashboard,
https://app.longpaddock.qld.gov.au/dashboard/#responseTab2
Climate Assessment for the electorate of Herbert 11Source: QLD Government (2018) Future Climate Dashboard
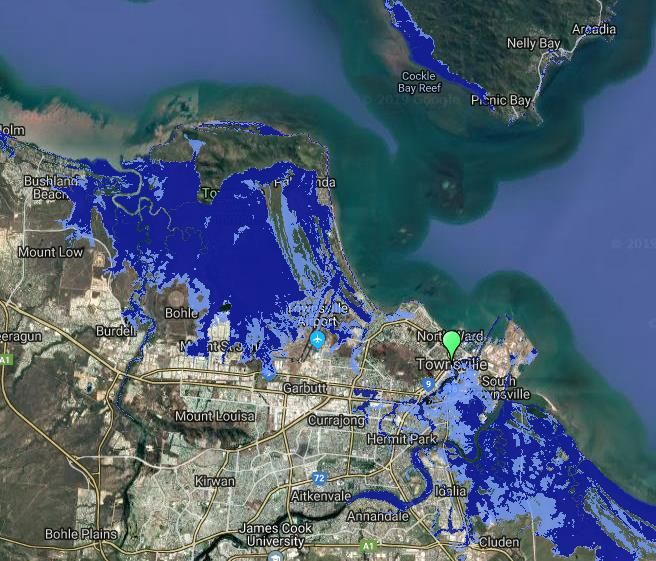
Sea level rise and coastal inundation
Townsville is a low-lying city that will be heavily impacted by sea level rise and coastal
inundation.
In 2012, a study was undertaken by global engineering firm GHD for the Townsville City
Council examining the potential ongoing cumulative impacts of sea level rise and
coastal inundation on the community.14 The Study was supported by the Australian
and Queensland Governments, Griffith University and the Local Government
Association of Queensland (LGAQ).
The study found that with a 0.8 meter sea level rise by 2100 would result in 4,400
properties in 23 suburbs being impacted by inundation. The total cost impact was
estimated to be over $2.5 billion. The report recommended measures to defend
Townsville’s inner suburbs, to consider defending 7 other suburbs and to retreat from
another 13 suburbs.
Alarmingly, sea level rise projections have increased dramatically since the report
came out. Since the IPCC Fifth Assessment in 2014, there have been a number of key
studies suggesting sea level rise could rise much faster. The National Oceanic and
Atmospheric Administration in the US found sea levels could rise to up to 2 meters by
2100 if emissions remain high.15
One of the key factors that could lead to a rapid acceleration in sea level rise is the
melting of the Antarctic ice sheets. Alarmingly, recent research has found a sixfold
increase in the melting Antarctic Ice Sheet from 40 billion tonnes per year between
1979-1990, to 252 billion tonnes per year between 2009-2017.16
If these more dramatic scenarios of sea level rise eventuate, the impacts on Townsville
will be far worse.
14
GHD (2012) Coastal Hazard adaptation strategy for Townsville City Council,
https://www.townsville.qld.gov.au/__data/assets/pdf_file/0016/7036/Coastal_Hazard_Adaptation_St
rategy.pdf
15
Op. cit. NOAA
16
Rignot et al (2019) Four decades of Antarctic Ice Sheet mass balance from 1979–2017,
https://www.pnas.org/content/early/2019/01/08/1812883116
Climate Assessment for the electorate of Herbert 12Figure 7: Projected inundation of Townsville at highest tide with 0.74 sea level rise in
2100
Source: Coastal Risk Australia, http://coastalrisk.com.au/viewer
Climate Assessment for the electorate of Herbert 13The economic costs of climate
change impacts in Herbert
NATURAL DISASTERS
The cost of natural disasters in Australia has been estimated by Deloitte Access
Economics, in a report for the Australian Business Roundtable, a group of major
Australian businesses.
It found the total economic cost of natural disasters in Australia over the decade to
2016, averaged $18.2 billion per year and is expected to rise to around $39 billion per
annum by 2050 in present value terms. This is a conservative estimate of future
disasters costs as it does not include projected climate change impacts.17
QLD is by far the most vulnerable state to natural disasters, with total economic costs
of $6.2 billion per year currently which are expected to rise to $18.3 billion per year by
2050.18
Looking at individual natural disasters, the costs are very high. For instance, the
Queensland 2011 floods were estimated to have cost around $14 billion (requiring a
national flood levy to cover the bill).19
The Queensland government estimated the floods, fires and heatwaves of the 2018-19
Queensland “Summer of Disasters” imposed $1.5 billion in costs on the state.20 These
costs will come out of other spending in the budget and could impact on services.
The total costs could be far higher. The $1.5 billion figure does not include insured and
uninsured losses to private property, Commonwealth Government contributions to
disaster relief and reconstruction or the wider economic and social costs.
To help cover rising disaster costs, the Commonwealth Government has set up a new
$3.9 billion Disaster Recovery Fund. This was strongly criticised by the Australian
17
Deloitte Access Economics (2017) The economic cost of the social impact of natural disasters
http://australianbusinessroundtable.com.au/assets/documents/ABR_building-resilience-in-our-states-
and-territories.pdf
18
Deloitte Access Economics (2017) Ibid.
19
Deloitte Access Economic (2017) Ibid.
20
Sagunto (February 2019) Summer of disasters' reveals the cost of climate change for Queensland
taxpayers https://www.abc.net.au/news/2019-02-19/climate-change-and-the-cost-of-qlds-summer-of-
disasters/10826122
Climate Assessment for the electorate of Herbert 14insurers with the Actuaries Institute calling it “short-sighted and disappointing” as it is
focused too much on recovery over resilience to increasing climate impacts.21
As previously mentioned, BOM has found that “Pacific rainfall disruptions” that include
floods and drought in Eastern Australia have already increased in frequency by 30
percent as a result of climate change and are projected to increase by 90 percent by
mid-century.22
The BOM and CSIRO have also found that the frequency and intensity of extreme fire
has increased significantly over much of Australia over recent decades and that climate
change is contributing to these changes.23
Given the high cost of individual disasters, the projected increase in the frequency and
intensity of these events will have a large impact on the overall cost of natural
disasters in Queensland.
For example, if “rainfall disruptions” causing a $14 billion flood or a $12.5 billion
drought occur twice as often, there could be double the cost to the community, if not
more. Climate change also has many impacts that are not classified as natural
disasters but have very significant costs.
HEALTH
The impact of extreme heat on human health, particularly over extended periods, is
severe. Although people living in hot areas do acclimatise to higher temperatures,
there are limits.24 A large increase in days above extreme heat thresholds as detailed
above will push past those limits.
The health impacts of increasing extreme heat can include both direct heat illnesses
such as heat exhaustion and indirect illnesses such as heart failure and even death.25
WorkSafe Queensland lists a range of illnesses arising from extreme temperatures
from cramps, rashes, and dehydration to severe injuries such as heat stroke,
21
Fernyhough (April 2019) Insurers slam budget's 'short-sighted' climate
measureshttps://www.afr.com/news/politics/national/insurers-slam-budget-s-short-sighted-climate-
measures-20190403-p51a93
22
BOM (2017) Droughts and flooding rains already more likely as climate change plays havoc with
Pacific weather http://www.bom.gov.au/climate/updates/articles/a023.shtml
23
BOM (2019) State of the Climate 2018 http://www.bom.gov.au/state-of-the-climate/
24
Hanna and Tait (2015) Limitations to thermoregulation and acclimatisation challenges human
adaptation to global warming, Int J Environ Res Public Health 12
25
NSW Government (2017) Heat-related illness including heat stroke,
https://www.health.nsw.gov.au/environment/factsheets/Pages/heat-related-illness.aspx
Climate Assessment for the electorate of Herbert 15exhaustion and even death, if treatment is delayed.26 As climate change worsens this
can be expected to put people that are more vulnerable at increasingly greater risk.
The groups most vulnerable to heat impacts include the elderly, the very young, and
those with pre-existing health conditions. Illnesses such as angina, kidney disease, and
diabetes are at higher risk of being triggered or exacerbated when people are unable
to maintain a safe body temperature.27 People suffering from mental disorders are
also vulnerable. This vulnerability to extreme heat can result from altered behavioral
responses to high temperatures or the impact of medications.
As stated earlier, irritability and psychological stress also increase in heat. When hot
days are combined with hot nights, heat load and stress carry over and the body has
no opportunity to cool down and recover. Studies show that there is an association
between mortality and high night temperatures, particularly in stroke patients.28 The
‘synergistic effect’ of night humidity and increased temperatures as a result of the
urban heat Island effect (UHI)29 has been estimated in some studies to double general
mortality risk by the end of the century under the current global climate trajectory (the
red line trajectory in Figure 3 - RCP 8.5).30 Heatwaves have been dubbed the ‘silent
killer’, causing more deaths in the last century in Australia than all natural disasters put
together.31
Hot nights also increase insomnia and lack of rest. This can be exacerbated by high
humidity. As sleep is vital for health, a deficit means more susceptibility to disease,
obesity, chronic illness and harm to our psychological and cognitive functioning.32
Productivity decreases significantly under these stresses as people are affected with
the consequences of extreme heat. Workplace safety and the ability to work declines.
26
WorkSafe Queensland (n.d.) Health effects, https://www.worksafe.qld.gov.au/injury-prevention-
safety/hazardous-exposures/heat-stress/health-effects
27
Hanna et al (2016) The silent killer: Climate Change and the Health Impacts of Extreme Heat, The
Climate Council, https://research-
management.mq.edu.au/ws/portalfiles/portal/72578140/72578105.pdf
28
Murage et al (2017) Effect of night-time temperatures on cause and age-specific mortality in London,
Environmental Epidemiology 1; Roye (2017) The effects of hot nights on mortality in Barcelona, Spain,
International Journal of Biometeorology 61
29
The urban heat island effect is when cities are hotter than surrounding as a result of materials used in
urban construction. Concrete and bitumen absorb heat and re-radiate into the urban environment,
particularly at night.
30 Zhao et al (2018) Interactions between urban heat islands and heat waves, Environmental Research
Letters 13
31 Hanna et al (2016) The silent killer: Climate Change and the Health Impacts of Extreme Heat, The
Climate Council
32 Obradovich et al (2017) Nighttime temperature and human sleep loss in a changing climate, Science
Advances 3
Climate Assessment for the electorate of Herbert 16This can also be displayed in economic terms as costs rise to account for the lack of
labour productivity and changes needed in workplaces.33
HEAT STRESS AND TOWNSVILLE’S WORKFORCE
Increasing extreme heat will have serious consequences for the health and safety of
many of Townsville’s workforce.
There is no temperature threshold for halting heavy outdoor work in Queensland. This
is important to Townsville, where over 13,000 workers are technicians and trades
workers. Of these, over 5,000 work in agriculture, mining, manufacturing or
construction, which are industries that require a large amount of work exposed to the
heat in many roles.34 There are also around 10,000 labourers, which is another
occupation regularly requiring strenuous work outside or in non-air conditioned
spaces.
Table 4 below shows the number of workers in Townsville in some of the occupations
that are very likely to require strenuous work outdoor work, or in non-air-conditioned
indoor spaces which can be even hotter.
Table 4: Selected occupations and industries in Townsville likely to exposed to
extreme heat.
Technicians Machinery Labourers Total
and Trades Operators and
Workers Drivers
Agriculture, Forestry 118 445 773 1,336
and Fishing
Mining 256 358 78 692
Manufacturing 1,732 929 962 3,623
Electricity, Gas, Water 466 164 94 724
and Waste Services
Construction 3,001 698 900 4,599
Transport, Postal and 325 2,111 314 2,750
Warehousing
Total 5,898 4,705 3,121 13,724
33 Climate Council (2014) Heatwaves: Hotter, Longer, More Often,
https://www.climatecouncil.org.au/uploads/9901f6614a2cac7b2b888f55b4dff9cc.pdf
34 ABS (2016) 2016 Census Community Profile, Working Population Profile,
http://quickstats.censusdata.abs.gov.au/census_services/getproduct/census/2016/communityprofile/318?opend
ocument
Climate Assessment for the electorate of Herbert 17Source: ABS (2016) 2016 Census Community Profile, Working Population Profile,
http://quickstats.censusdata.abs.gov.au/census_services/getproduct/census/2016/community
profile/318?opendocument
Townsville hosts the largest garrison in the Australian Defence Force (ADF) and is home
to 15,000 defence force personal and their families, making up 8% of the Townsville
population.35 Soldiers are required to train strenuously in heavy clothing which
reduces air circulation essential to cooling the body, and heavy equipment which adds
to the level of exertion. The tragic consequences of excessive training in the heat can
be seen in the case of the death of a young a soldier due to heat stress at the ADF
Puckapunyal base in Victoria last year.36
As discussed above, at temperatures above 35 degrees, the human body’s main
cooling mechanism – sweating – is far less effective. Sweating exchanges heat from the
body to the atmosphere, but this heat exchange process diminishes significantly
beyond 35 degrees, so body temperature rises. There is a range of health impacts,
from mild to severe. Heat stroke can cause permanent damage to the brain and other
vital organs and can even result in death.37 The US Army Research Institute of
Environmental Medicine advises that all outdoor work with physical exertion be
cancelled when the Wet Bulb Globe Temperature WBGT temperature exceeds 32
degrees.38 The WBGT is a measure of heat stress that takes into account temperature,
humidity and some other factors.
Mining workers
Although mining is currently a relatively small employer in the Townsville region,
employing fewer than 1000 workers, around 1% of the workforce,39 there are have
35
Townsville City Council (2017) Defence Fact Sheet: Australian Defence Force,
https://www.townsville.qld.gov.au/__data/assets/pdf_file/0018/9360/Defence-Fact-Sheet-17.pdf
36
Smith (2019) Australian soldier dies during exercise at Puckapunyal Army base in Victoria,
https://www.news.com.au/national/victoria/news/australian-soldier-dies-during-exercise-at-
puckapunyal-army-base-in-victoria/news-story/452c965683ad8e2ecdb7f2017dff98c9
37
Hanna and Tait (2015) Limitations to thermoregulation and acclimatisation challenges human
adaptation to global warming, Int J Environ Res Public Health,
https://academic.oup.com/heapro/article/30/2/239/561863; Australian Mining Review (November
2017) WA miners urged to guard against heat stress, https://www.miningreview.com.au/wa-miners-
urged-guard-heat-stress/
38 Hanna (2016) Microclimates and heat islands: Climate change exacerbates occupational heat exposures,
http://greenhouse.asnevents.com.au/assets/Greenhouse/Presentations/1420HannaMR2Wed.pdf
39
ABS (2016) 2016 Census Community Profile, Working Population Profile,
http://quickstats.censusdata.abs.gov.au/census_services/getproduct/census/2016/communityprofile/
318?opendocument
Climate Assessment for the electorate of Herbert 18been calls to support an expansion of mining in the region.40 Extreme heat presents a
significant health risk to mining workers. The Australasian Mining Safety Journal
describes the risks as follows:
When environmental temperatures exceed that of dry skin, sweating becomes
the primary source of thermoregulation. However, as temperatures continue to
rise, particularly in humid environments with poor airflow, this may not be
enough. The body’s core temperature rises, resulting in a continuum of
ailments, collectively known as heat illness. This ranges from the relatively mild
heat rash and muscle cramps, to heat exhaustion and the potentially fatal heat
stroke.
Heat illness can present as headache, nausea or vomiting, irritability, clammy
skin, dizziness, fatigue, elevated heart rate, and rapid breathing rate. This
translates to lower productivity, poor morale and higher rates of accidents in
the workplace. When left untreated, heat illness can progress to heat stroke,
where confusion, further reduced muscle coordination, convulsions and
ultimately a loss of consciousness can occur.41
A survey of mine workers in Northern Australia found heat stress symptoms were
experienced by 87% of open cut mine workers and 79% of underground mine workers.
Around 80% of workers experienced these symptoms more than once. The survey also
found that only 27% were well hydrated with 10% significantly dehydrated.42
There are also factors that compound the heat risks of mining in particular including
having to wear heavy protective clothing that can reduce air circulation to the skin,
long shifts and that water is not always readily available.
Despite Worksafe Queensland warnings that working in extreme heat can lead to
serious injury and death,43 there is no temperature level threshold for halting heavy
outdoor work in Queensland. The death of a coal seam gas worker near Roma in
40
Ludlow, Macilroy (2019) CFMEU and miners tell Labor to stop playing games over Adani mine,
https://www.afr.com/news/politics/cfmeu-and-miners-tell-labor-to-stop-playing-games-over-adani-
mine-20190221-h1bj4c
41
Australasian Mining Safety Journal (October 2015) Handling the heat,
https://www.amsj.com.au/handling-the-heat/
42
Hunt et al (2012) Symptoms of heat illness in surface mine workers, https://eprints.qut.edu.au/54048/
43
WorkSafe Queensland (n.d.) Health effects, https://www.worksafe.qld.gov.au/injury-prevention-
safety/hazardous-exposures/heat-stress/health-effects
Climate Assessment for the electorate of Herbert 19Queensland as a result of heat in 2016 prompted the Coroner to recommend
temperature thresholds being adopted.44
The health and safety risks of heatwave are likely to accelerate the process of fully
automating mining operations from mine to port, as multi-national corporation Adani
have already indicated they aim to do at their proposed Carmichael mine. This will
mean even fewer mining jobs in the region.45
AGRICULTURE
Agriculture is a vital industry in the Townsville region and the Herbert electorate, with
a focus on tropical fruit growing and beef grazing.
Agriculture is on the frontline of global warming impacts in many ways. Increasing
temperatures and falling precipitation can reduce cropping and livestock yields.
Increasing temperatures can also reduce soil moisture and increase erosion. Extreme
heat can damage crops and stress livestock. Floods can destroy crops, livestock and
farm infrastructure including buildings, roads, machinery and fencing.
Impacts on cropping
A recent Australian Bureau of Agricultural and Resource Economics and Sciences
(ABARES) report found that changes in the climate since 2000 have significantly
reduced farm productivity and crop yield:
The recent changes in climate have had a significant negative effect on the
productivity of Australian cropping farms, particularly in south-western
Australia and south–eastern Australia (Figure 2). In Western Australia, climate
conditions between 2000–01 and 2014–15 lowered TFP by an average of 7.7
per cent—relative to what would have been seen under long-run average
conditions (1914–15 to 2014–15). In New South Wales climate conditions post
2000–01 lowered productivity by an average of 6.5 per cent.
A similar pattern is observed for wheat yields, although the climate effects are
larger. Climate conditions between 2000–01 and 2014–15 lowered national
44
Briggs (2016) Coroner calls for temperature threshold to stop outdoor work in extreme heat,
https://www.abc.net.au/news/2016-04-20/coroner-calls-temperature-threshold-to-stop-outdoor-
work-heat/7342464
45
Krien (June 2017) Revealed: Gautam Adani's coal play in the state facing global-warming hell,
https://www.smh.com.au/lifestyle/adani-how-we-got-conned-by-coal-20170525-gwcw5h.html
Climate Assessment for the electorate of Herbert 20wheat yields by around 11.9 per cent relative to long-run conditions (16.3 per
cent in Western Australia and 14.8 per cent in Victoria).46
Recent CSIRO research has found potential wheat yields in Australia have already
declined by 27% from 1990 to 2015 below what they would otherwise have been due
to climate impacts, mostly the fall in rainfall and increasing temperatures over this
period.47
As would be expected, increasing global warming will continue to reduce agricultural
productivity and yields.
The 2009 Garnaut Review found that as a result of climate change, and without serious
emission reductions, the Murray Darling Basin would be likely to lose up to half its
annual irrigated agricultural output by mid-century.48
Impacts on grazing
A recent CSIRO report examined 25 locations in south eastern Australia and found that
without adaptation meat production could be reduced by up to 92% by 2050 and wool
production by up to 95% 49 This study examines the more gradual impact increasing
annual average temperatures and decreasing annual average rainfall. However, the
impact of individual extreme weather events on grazing (and crops) must also be
considered. The most extreme of these events are referred to as natural disasters.
The recent Queensland floods and the current drought are a reminder of the devasting
impact of extreme events on grazing. As previously discussed, the frequency of pacific
rainfall disruptions including drought and flooding have already increased by 30
46
ABARE (2017) Farm performance and climate Climate-adjusted productivity for broadacre cropping
farms,
http://data.daff.gov.au/data/warehouse/9aas/2017/FarmPerformanceClimate/FarmPerformanceClim
ate_v1.0.0.pdf
47
Hochman et al (2017) Climate trends account for stalled wheat yields in Australia since 1990,
https://onlinelibrary.wiley.com/doi/full/10.1111/gcb.13604
48
The Garnaut climate change review (2009) Chapter 6, Climate Change Impacts on Australia,
http://www.garnautreview.org.au/chp6.htm
49
Gaharamani and Moore (2014) Systemic adaptations to climate change in southern Australian
grasslands and livestock: Production, profitability, methane emission
and ecosystem function,
https://www.researchgate.net/publication/269106683_Systemic_adaptations_to_climate_change_in_
southern_Australian_grasslands_and_livestock_Production_profitability_methane_emission_and_ecos
ystem_function
Climate Assessment for the electorate of Herbert 21percent and are projected to increase by 90 percent in the early part of this century,
and 130 percent increase as century progresses.50
An AgForce survey in October 2018 found that about half of Queensland’s farmers had
lost more than half their annual income due to drought. 51
The floods that followed in February 2019 in and around Townsville were the highest
on record since records began in 1888, with rainfall records set as far west as Mt Isa. 52
Agforce has estimated Queensland graziers alone have lost up to 500,000 head of
cattle with an estimated value of $500 million.53
INFRASTRUCTURE AND INDUSTRY
Townsville’s infrastructure is at risk from seal level rise and coastal inundation,
flooding from extreme weather events and extreme heat.
23 of Townsville’s suburbs are considered at risk from inundation with a 0.8 meter sea
level rise by 2100, with an estimated cost of over $2.5 billion These suburbs include
the CBD, residential and industrial areas, as well as important civic infrastructure such
as sewerage treatment plants.54 If this is inundation is realised it would render the city
inhospitable.
Extreme heat can cause failures to critical infrastructure, particularly transport and
electricity supply.
Coal and gas power stations in particular are highly vulnerable to extreme heat,
experiencing both reduced output and an increased level of breakdowns. This is
exacerbated by high electricity demand as a result increased use of air-conditioning
during extreme heat conditions. Last year there were 56 breakdowns of coal and gas
50
BOM (2017) Droughts and flooding rains already more likely as climate change plays havoc with Pacific
weather, http://www.bom.gov.au/climate/updates/articles/a023.shtml
51
AgForce (October 2018) Media Release: Impact of drought laid bare in survey of Queensland farmers,
https://agforceqld.org.au/index.php?tgtPage=news&id=view,763
52
Bureau of Meteorology (February 2019) Special Climate Statement 69—an extended period of heavy
rainfall and flooding in tropical Queensland,
http://www.bom.gov.au/climate/current/statements/scs69.pdf
53
Crockford (February 2019) Queensland floods damage bill estimates top $1 billion,
https://www.brisbanetimes.com.au/national/queensland/queensland-floods-damage-bill-estimates-
top-1-billion-20190216-p50ya1.html
54
GHD (2012) Coastal Hazard adaptation strategy for Townsville City Council,
https://www.townsville.qld.gov.au/__data/assets/pdf_file/0016/7036/Coastal_Hazard_Adaptation_St
rategy.pdf
Climate Assessment for the electorate of Herbert 22power stations, in Queensland, many of which are likely to be as a result of extreme
heat.
The Queensland floods are estimated to have had a total economic cost of $14.1
billion,55 including an estimated $157 million on road reconstruction.56 The floods also
affected over 3000 km of rail track in some way.57
An efficient transport system is fundamental to regional areas like Herbert, and climate
change impacts transport infrastructure in many ways.
Extreme heat can also disrupt transport infrastructure. It can cause roads can melt58
and rail can buckle,59 and disruption to airlines.60
55
Deloitte (2013), The economic cost of the social impact of natural disasters,
costshttp://australianbusinessroundtable.com.au/assets/documents/Report%20-
%20Social%20costs/Report%20-
%20The%20economic%20cost%20of%20the%20social%20impact%20of%20natural%20disasters.pdf
56
Creighton (2016) Queensland floods 2011: The floods by the numbers,
https://www.brisbanetimes.com.au/national/queensland/queensland-floods-2011-the-floods-by-the-
numbers-20160112-gm4czk.html
57
Queensland Floods Commission of Inquiry: Final Report (2013) Chapter 10, Essential Services p155,
http://www.floodcommission.qld.gov.au/__data/assets/pdf_file/0014/11714/QFCI-Final-Report-
Chapter-10-Essential-services.pdf
58
Cheer (January 2018) Traffic delays after 10 kilometers of Victoria's Hume Freeway melts,
https://www.sbs.com.au/news/traffic-delays-after-10-kilometres-of-victoria-s-hume-freeway-melts
59
Lauder (2009) Melbourne railway buckles under heat,
http://www.abc.net.au/worldtoday/content/2008/s2477350.htm
60
Coffell and Horton (August 2017) How hot weather – and climate change – affect airline flights,
https://theconversation.com/how-hot-weather-and-climate-change-affect-airline-flights-80795
Climate Assessment for the electorate of Herbert 23Conclusion
The electorate of Herbert stands to be heavily impacted by climate change.
Increasing heatwaves and falling water availability will impact the community’s health,
infrastructure and vital industries.
However, none of this is inevitable. Climate projections clearly show that if the world
achieves the 1.5-degree target agreed to by virtually every nation on earth under the
Paris Agreement, most of these impacts can be avoided (see the green shaded line in
Figure 3 for example).
Fortunately, the measures we need to take to tackle climate change are consistent
with a prosperous future and growing employment in the region. Renewable energy
jobs doubled in Queensland in the last two years61 and the electorate of Herbert has
an excellent solar resource providing opportunities for more renewable development
and provide ongoing power sector jobs. As the cost of renewable energy is already
lower than new coal or gas, the region also has a potential competitive advantage in
developing new industries that can take advantage of this clean, low cost power.
There are also ample opportunities for land use sequestration that could provide
additional income streams for farmers, as well as necessary adaptation measure to
build resilience in our communities, farms, businesses and infrastructure to the
changes already locked in. Besides avoiding costs from climate impacts, these
measures will also provide jobs and flow on economic benefits to the region.
However, leadership will be required to grasp these opportunities. It requires leaders
with an understanding of the issues and a willingness to rise to the challenge.
61
Australian Bureau of Statistics (2019) 4631.0 - Employment in Renewable Energy Activities, Australia,
2017-18 https://www.abs.gov.au/AUSSTATS/abs@.nsf/Lookup/4631.0Main+Features12017-
18?OpenDocument
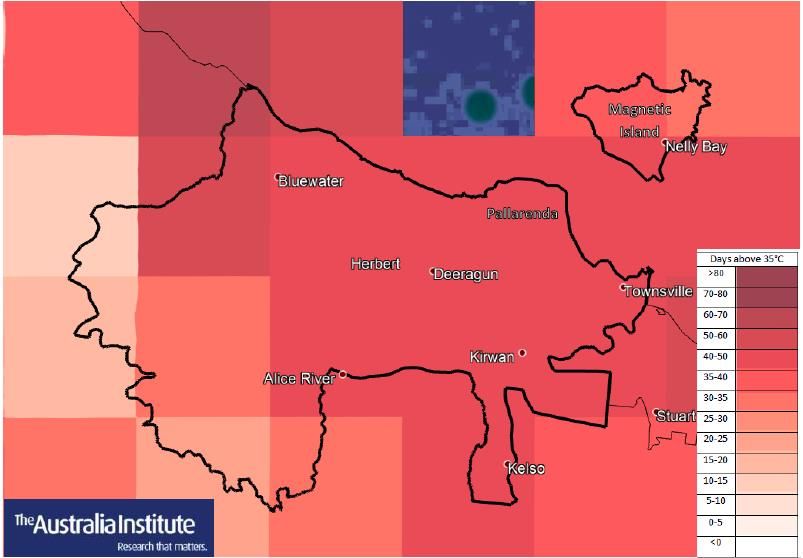
Climate Assessment for the electorate of Herbert 24Appendix
Figure 8: Projected increase in days over 35 degrees per year above current levels in
the electorate of Herbert 2030
Source: QLD Government (2018) Future Climate Dashboard, AEC.
Climate Assessment for the electorate of Herbert 25Figure 9: Projected increase in days over 35 degrees per year above current levels in
the electorate of Herbert 2050
Source: QLD Government (2018) Future Climate Dashboard, AEC.
Climate Assessment for the electorate of Herbert 26Figure 10: Projected increase in days over 35 degrees per year above current levels in
the electorate of Herbert 2070
Source: QLD Government (2018) Future Climate Dashboard, AEC.
Climate Assessment for the electorate of Herbert 27Figure 11: Projected increase in days over 35 degrees per year above current levels in
the electorate of Herbert 2070
Source: QLD Government (2018) Future Climate Dashboard, AEC.
Climate Assessment for the electorate of Herbert 28You can also read