In Insulin Regulated Aminopeptidase - Degree Project in Computational Medicinal Chemistry, 45 hp, Spring Semester 2021 Examiner: Christian Sköld
←
→
Page content transcription
If your browser does not render page correctly, please read the page content below
Conformational                             Changes   in     Insulin
Regulated Aminopeptidase
Sebastian Moes
Degree Project in Computational Medicinal Chemistry, 45 hp, Spring
Semester 2021

Examiner: Christian Sköld

Division for Drug Design and Development
Department of Medicinal Chemistry
Faculty of Pharmacy
Uppsala University
2
To Friends and Family and my delightful Girlfriend that
                        helped me through this project

                                                     3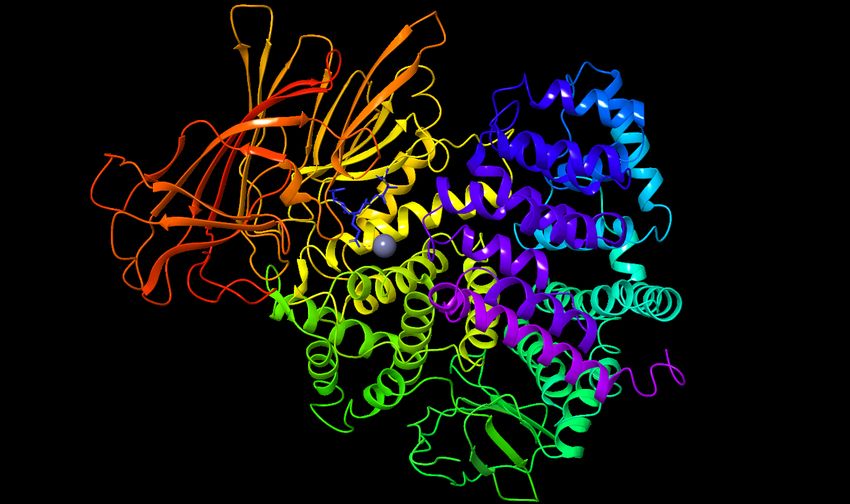
Table of Contents
Summary ........................................................................................................................... 5

Abstract............................................................................................................................. 7

Introduction ...................................................................................................................... 8

Purpose ........................................................................................................................... 12

Methods .......................................................................................................................... 12

   Protein Preparation ..................................................................................................................17

   Pseudoresidue Creation ............................................................................................................17

   MD simulation Preparation .......................................................................................................18

   MD analysis ..............................................................................................................................18

Results and Discussion ..................................................................................................... 20

   PCA analysis ..............................................................................................................................20

   Ligand Interaction Maps ...........................................................................................................26

   Distances ..................................................................................................................................27

Additional simulations ..................................................................................................... 27

Conclusion ....................................................................................................................... 28

References ....................................................................................................................... 29

                                                                                                                                               4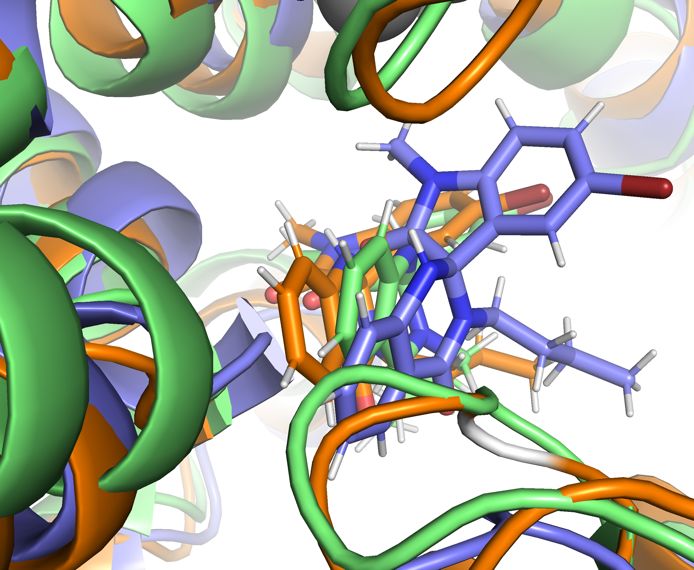
Summary
Around the world the elderly population is growing, and many new challenges are presenting
themselves to the field of pharmacy. Dementia and age-related cognitive decline are among
the most pressing challenges to overcome if we wish to improve the quality of life for our
aging population. To meet this need, computational techniques are being used to investigate
new targets for drugs that can alleviate or even cure these conditions, a feat no current drugs
can accomplish. One target of particular interest is called Insulin Regulated Aminopeptidase
(IRAP). The IRAP enzyme exists primarily in the brain, and serves several functions, including
breakdown of neuropeptide hormones in brain areas associated with memory and cognition.
By inhibiting the action of IRAP, the breakdown of these neuropeptides is prevented, which
has been shown in many animal studies to have a positive effect on conditions such as
Alzheimer’s disease and age-related cognitive decline. To develop better drugs learning how
existing compounds inhibit the IRAP enzyme function is paramount. Using computational
modelling and simulation of IRAP inhibitors when attached to the IRAP enzyme, we can draw
conclusions about how future drugs need to be designed to maximize safety and efficacy. In
this work natural substrates of IRAP, as well as four known inhibitors were simulated and
examined to determine how these inhibitors exert their effects on the enzyme. A recently
developed spiro-oxindole inhibitors developed in the host lab previously was studied and a
promising binding pose was found that could become a basis for designing better drugs that
take advantage of this information. The techniques used in this project are also applicable to
other enzymes and could lead to useful methods for investigating potential drugs with
computational modelling.

                                                                                             5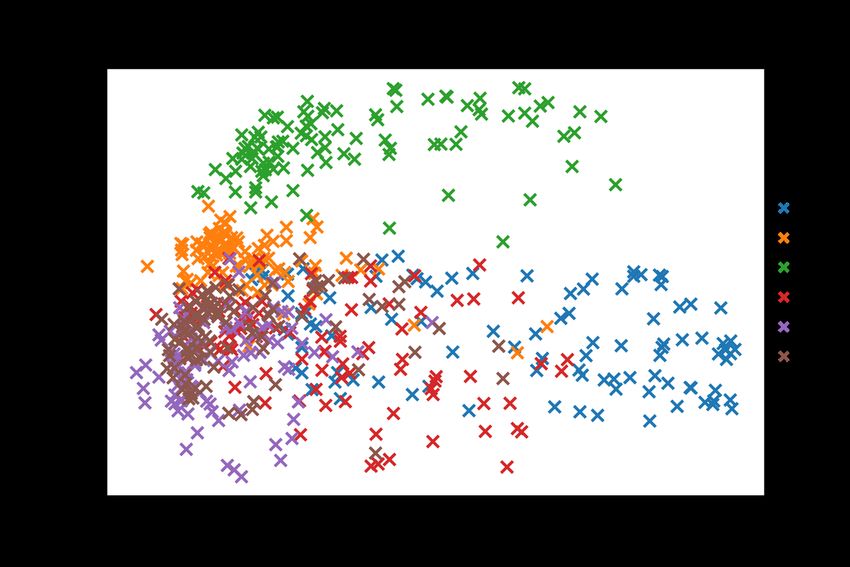
6
Abstract
Global disease burden due to age related cognitive decline and dementias, especially
Alzheimer’s disease, are a growing public health problem. Current treatments fail to
completely prevent or cure dementia. A target of interest is the Insulin Regulated
Aminopeptidase (IRAP) enzyme, inhibitors of IRAP have shown promise in preventing and
reversing neurological degeneration associated with dementia. Structural information about
IRAP when bound to an inhibitor is lacking, however, and future ligand design depends on
knowledge of the mechanism of inhibition. We used long term MD simulations of IRAP bound
to various ligands to investigate the conformational changes undergone by IRAP. PCA analysis
was also used to investigate larger changes in the enzyme. A highly stable pose for a known
spiro-oxindole inhibitor was found with key interactions between the ligand and SER546 and
TYR 954, providing useful data for the design of future inhibitors of the IRAP enzyme.

                                                                                          7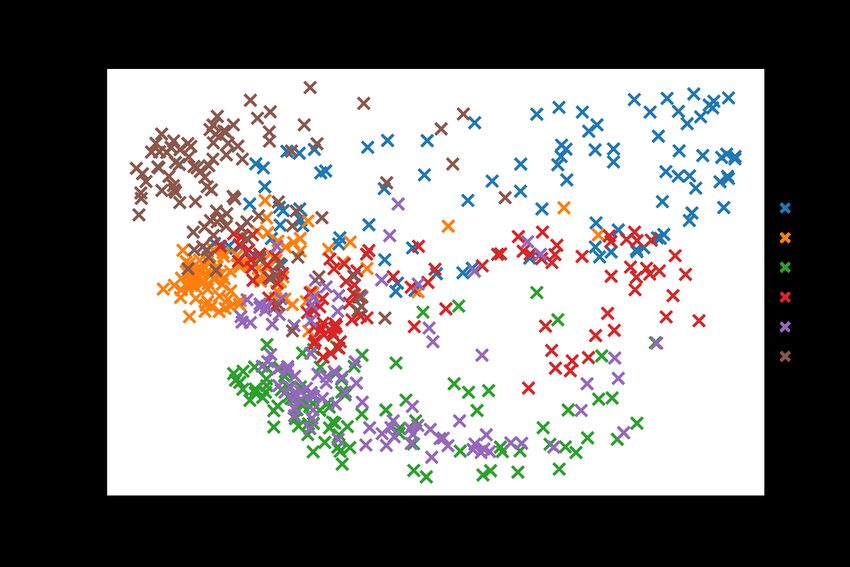
Introduction

The field of computational chemistry can be said to have begun in the early part of the 20th
century when the first theoretical chemical calculations were performed by Walter Heitler in
19271. Heitler’s work would set the stage for quantum calculations that would later be done
on computers. Since then, the field of computational chemistry has grown to become an
integral part of research in chemistry and pharmacy2. As the power of computers has grown,
so too have our abilities to simulate larger and more complex systems with many thousands
of atoms, such as the interactions between proteins and ligands. The gold standard method
for accurate simulations of atomic systems are quantum mechanical calculations. Quantum
mechanical calculations allow robust and highly accurate predictions in small systems of a few
atoms but requires an incredible amount of computing power. In order to simulate an entire
protein consisting of thousands of atoms a different representation is required. Molecular
Dynamics (MD) is a computational technique which uses Newton’s laws of motion to calculate
the position and momentum of a system over a given time period with arbitrary temporal
resolution. Molecular dynamics simulations use an atomistic representation of molecules
modelled in forcefields which dictate the properties of individual atoms and the forces atoms
exert and receive from nearby atoms. These forcefields are calculated based on quantum
mechanical calculations and experimental data. There are many forcefields for different
purposes, for our calculations we used the optimized potentials for liquid simulations OPLS-
AA (all atoms) forcefield.

Neurodegenerative disorders are a major problem affecting an ever-increasing number of
people as life expectancy continues to rise globally3. Dementia is the most common type of
neurodegenerative disorders, and of dementia cases Alzheimer’s disease is the most
frequently diagnosed4. Neurodegenerative diseases involve the degradation of the brain
and/or cognitive function. Current treatments such as cholinesterase inhibitors and N-methyl-
D-aspartate (NMDA) receptor antagonists, for example memantine, treat only symptoms but
fail to cure or reverse cognitive decline5. One exciting new avenue for treatment of
neurodegenerative degenerative diseases is the Insulin Regulated Aminopeptidase (IRAP)

                                                                                            8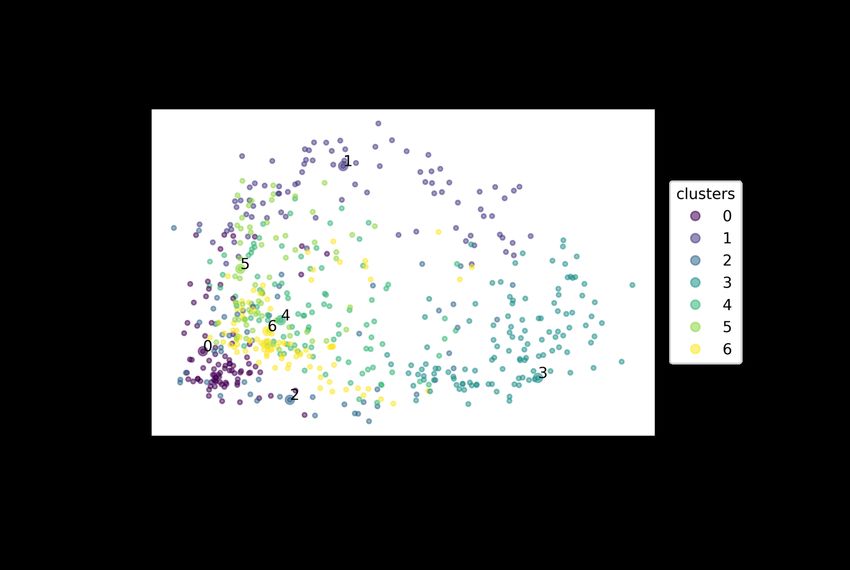
enzyme of the M1 aminopeptidase family. Metallo-type 1 (M1) aminopeptidases are a sub-
family of metallopeptidases which are important for cell maintenance, defense and
development6. An important function of IRAP is the degradation of peptide hormones such
as oxytocin, vasopressin and angiotensin III. It is also involved in the translocation of GLUT4
after insulin-stimulation as well as in MHC class I antigen presentation by trimming the N-
terminal of cross-presenting peptides7,8. IRAP is highly expressed in brain regions associated
with memory and cognition 4. Previous work has shown that cognitive decline can be
alleviated and prevented by inhibition of the IRAP enzyme5. Albiston et al. (2001) have
identified IRAP to be the AT4 receptor, that binds Angiotensin IV (Ang IV) and LVV-hemorphin
79. Ang IV and its analogues have been identified to improve memory and learning
abilities10. It is believed that the cognitive improvements are mediated through the binding
to IRAP, even though the involvement of other binding sites are being investigated as well11.
Although the exact mechanisms of action are not yet understood, evidence strongly suggests
that IRAP plays a key role in memory and cognition12. A proposed mechanism of action for
the cognition enhancing effects of IRAP inhibition via Ang IV and its analogues is that inhibition
leads to prolonged half-lives of neuropeptides that may potentiate memory and learning e.g.,
arginine vasopressin, oxytocin and somatostatin13. Wallis et. Al (2007) demonstrated that the
levels of circulating vasopressin are elevated in IRAP knockout mice14.

The Family of M1 aminopeptidases share two distinct binding motifs that are located at the
C-terminal domain and are involved in the catalysis of peptide substrates: the GXMEN
exopeptidase motif, an N-terminal recognition site essential for peptide substrate selectivity
and the HEXXH zinc-binding motif (see Figure 1). In humans nine different M1
aminopeptidases can be found, either as integral membrane proteins or located in the
cytoplasm15. One of them is the type II integral membrane protein, the IRAP enzyme. IRAP
consists of three main domains, an N-terminal cytoplasmic domain, an extracellular/intra-
endosomal domain containing the catalytic site as well as the C-terminal, and a
transmembrane domain16. The 160 kDa enzyme is expressed in a wide range of cells with
particularly high levels found in neuronal and placental cells where it is involved in a variety
of physiological processes17-18

                                                                                                9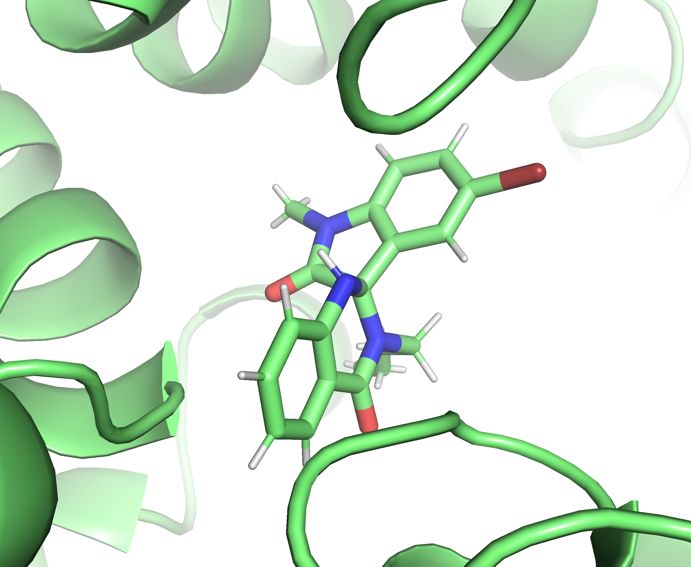
Figure 1. Structure of the three main domains of IRAP: The extracellular C-terminal domain with the
catalytic site containing HEXXH and GAMEN, the transmembrane domain and the N-terminal
cytoplasmic domain. Adapted from Vear et al. (2020). Copyright © 2020 Vear, Gaspari, Thompson and
Chai. Created with BioRender.com

The catalytic extracellular domain of the IRAP enzyme consists of four domains, hereafter
referred to as D1 through D4. The D2 domain contains the active site also called the S1 pocket,
inhabited by a zinc ion bonded to histidine 468 and 464, and glutamines 431, 465 and 487. A
region of interest is the GXMEN (GAMEN in IRAP) loop highlighted in figure 2, a short loop
from GLY428 to ASN432. The glycine in the GAMEN loop is critical for enzyme function, and
any mutation in this residue results in a loss of catalytic activity19. The GAMEN loop of IRAP is
conserved across related metallopeptidases20, however the GAMEN loop of IRAP is capable
of adopting two conformations, open and closed as can be seen in Figure 3. The open and
closed conformation of GAMEN correspond to open and closed form of the IRAP enzyme
which itself represents simply an increase in volume of the S1 pocket. This change in the
difference in volume is an attractive property to utilize in order to create highly specific IRAP
inhibitors without off target effects at related peptidases. Figure 4 demonstrates the
difference in GAMEN loop conformations between IRAP and very closely related Endoplasmic
Reticulum Associated Peptidase (ERAP). ERAP is an important enzyme in regulation of
cytokine production and inflammatory responses, as well as production of MHC proteins that

                                                                                                10
aid in immune cell recognition. Inhibitors which affect ERAP could have highly detrimental
effects, thus specificity for IRAP over ERAP is critical to consider when designing inhibitors. An
important feature of the GAMEN loop in the IRAP enzyme is that the ability to adopt both
open and closed conformations allow it to accommodate large cyclic peptide substrates.
Comparatively ERAP has far less flexibility and can be considered to only exist in the closed
form, reducing the size of the accessible volume in the active site21,22. The difference in size
and shape of the active site between ERAP and IRAP is an important feature to take advantage
of when examining the features of the IRAP protein relevant to medicinal computational
chemistry and the design of new ligands.
Figure 2. Shown here is the structure of the IRAP monomer of interest. In the center of the structure
the Zinc is visible, represented by a grey sphere. Directly up and to the left of the grey Zinc is the
GAMEN loop represented by blue sticks to indicate the location.
This thesis concerns the interactions between ligands chosen based on previous works in the
Åqvist Lab and published structures of the IRAP as outlined in Table 1. The binding pocket of
11IRAP is known to change upon substrate binding23, though comparison between structures
using long MD simulations is absent from the literature.
Purpose
The main goal of this thesis was to determine how known inhibitors of the IRAP enzyme affect
the conformation of the IRAP enzyme during a long-term simulation of the enzyme with and
without ligands. To this end three known inhibitors, a natural substrate, and two inactive
substrates will be modelled, compared and used to draw conclusions about future drug
design projects concering the IRAP enzyme (ligands outlined in Table 1). A key element of the
investigation is determining the overall structural changes undergone by the IRAP enzyme
when bound to an inhibitor, as well as determining which ligand-protein interactions are
promising targets to examine when developing a quantitative structure-activity relationship
(QSAR).
Methods
In order to analyse the conformational change, principal component analysis (PCA) was used
to analyse the totality of distances between all alpha-carbon atoms in the protein structure24.
PCA allows the analysis of high dimensional data, in this case over thirty thousand distances
were included. PCA works by projecting dimensional data onto a plane and rotating the plane
of the data to minimize the cross-sectional size of the resulting dataset it is projected onto a
lower dimensional plane, in this way changes in the structure of the protein could be detected
that are too small to detect by visual inspection alone. The different IRAP structures selected
for analysis were taken from the PDB database and structures generated by others in the
group as outlined in Table 1. The different IRAP structures correspond to different
conformations possibly owing to the presence of various ligands as this work intends to show.
The structure 4PJ625 (simulation 1) was chosen because it contains only a lysine bound to the
zinc in the active site. 5C9726 (simulation 2) is a structure published alongside 4Z7I26
(simulation 4), 5C97 contains no ligand in the active site which provides a baseline
conformation of the unbound enzyme. 4Z7I (simulation 4) is an IRAP structure with a
12pseudopeptide transition state analogue that mimics antigenic peptides which are cleaved by
IRAP27. 5MJ6 23
(simulation 3) was chosen because the paper associated with that IRAP
structure showed evidence of conformational change due to ligand binding, and thus is a
structure of interest. The 4 IRAP structures created from the IRAP structure created by the
host group represent the IRAP enzyme with a spiro-oxindole inhibitor plus Leu-pNA (Leucine
para-nitroaniline), a chromogenic substrate for aminopeptidases used in many assays to
detect or characterize IRAP28–31 (simulation 5), IRAP with Ang IV (simulation 6), with only the
spiro-oxindole inhibitor (simulation 7), and with only Leu-pNA (simulation 8)32. This structure
was based on 4PJ6 and used a crystal structure of closely related enzyme alanine-
aminopeptidase (APN) to generate a docked pose of Ang IV33, this docked pose was super
imposed onto 4PJ6 to generate the structure in simulation 6. To create the structure in
simulation 5, the spiro-oxindole ligand and leu-pNA was docked onto the 4PJ6 structure.
Structures in simulations 7 and 8 were created from 4PJ6, with either the Leu-pNA deleted or
the spiro-oxindole ligand deleted.
Table 1: IRAP Structures selected for investigation with structure of the ligands contained therein. For
each structure that contains a ligand, another set of simulations were run with that ligand deleted.
Structure Name Ligand Conformation Ligand Structure
PDB id 4PJ6 Sim1 Lysine OPEN
PDB id 5C97 Sim2 None OPEN
PDB id 5MJ6 Sim3 7O2 Inhibitor CLOSED
PDB id 4Z7I Sim4 Transition State OPEN
Analogue
13Spiro-oxindole Sim5 Spiro-oxindole OPEN
inhibitor with Leu-
Structure
pNA
Spiro-oxindole Sim6 Angiotensin OPEN
structure with IV (Ang IV)
Ang IV
Spiro-oxindole Sim7 Spiro Oxindole OPEN
Inhibitor
structure with
Spiro
Spiro-oxindole Sim8 Leu-pNA OPEN
structure with
LeuPna
145MJ6 (Sim 3)
4PJ6 (Sim1)
5C97 (Sim2)
4Z7I (Sim4)
Figure 3. Comparison of superimposed IRAP structures, 5PJ6 a closed conformation of
the GAMEN loop in white, 4Z7I in yellow, 4PJ6 in green, and 5C97 in pink. Ligands are
clustered in background represented as sticks. The three open forms of the IRAP enzyme
are close together in the lower middle portion of the image, the lone closed form in
white notably different in position.
15ERAP1 : Closed
ERAP2 : Closed
5C97 : Open
Figure 4. Contrast between GAMEN loop conformations of IRAP and closely related ERAP
enzymes. IRAP open conformation (5C97) in magenta, IRAP closed (5MJ6) in yellow.
ERAP1 and ERAP2 structures from PDBid 2YD0 and 3SE6 respectively showing the closed
form of the ERAP GAMEN loop. Differences in the open and closed forms can be seen
on the left side of the image. Ligands for the various structures can be seen represented
as sticks in the center of the image.
16Protein Preparation
3D structures of the IRAP structures relevant to this study were downloaded from the Protein
Data Bank, (PDB ids: 4PJ6, 5C97, 5MJ6, 4Z7I). Another structure from previous work in this
lab was also included (Table 1). Chain A from each structure was used, along with any ligands
included, simulations were then done on the structure with and without the ligand. Proteins
were prepared using the protein preparation wizard in Shrödinger Maestro34. Hydrogens
were added to the structures, bonds to metals added, disulphide bonds created and waters
deleted beyond 5Å. Missing loops and side chains were modelled and added using the Prime
module. Het states were generated using Epik. H-bond assignment and optimization was done
at pH of 7.4 with water orientations sampled (where there were waters), the structure was
then minimized using the OPLS3e force field to an RMSD value of 0.30Å. Topologies for the
ligands were generated using the LigParGen server35–37. The forcefield used for further
simulations in this work is the OPLS-AA, and the ligand parameters obtained with the
LigParGen server. Modifications to the forcefield were made to the parameters of the zinc
atom to reflect developments in the study of the properties of zinc. 34. Hydrogens were added
to the structures, bonds to metals added, disulphide bonds created and waters deleted
beyond 5Å. Missing loops and side chains were modelled and added using the Prime module.
Het states were generated using Epik. H-bond assignment and optimization was done at pH
of 7.4 with water orientations sampled (where there were waters), the structure was then
minimized using the OPLS3e force field to an RMSD value of 0.30Å. Topologies for the ligands
were generated using the LigParGen server35–37. The forcefield used for further simulations in
this work is the OPLS-AA , and the ligand parameters obtained with the LigParGen server.
Modifications to the forcefield were made to the parameters of the zinc atom to reflect
developments in the study of the properties of zinc.
Pseudoresidue Creation
The pseudopeptide transition state analogue from the 4Z7I structure file was created by both
automatic and manual parameterization. The properties of Leucine were used for the leucine-
like branch of the pseudoresidue, with the portion after the second beta carbon
17parameterized with LigParGen with an extra carbon atom added to represent the alpha
carbon to which the new beta carbon will be bound to. The two sets of parameters are
combined in the amino acid database file used by GROMACS manually, the new bonds
written, and improper dihedrals added for the new phenyl ring on the pseudoresidue. The
atom names had to be edited completely from the LigParGen parameters and structure in
order to be compatible with GROMACS, since the carbon and hydrogen naming schemes
differ. Finally, the pseudopeptide can be simply combined with the IRAP structure and
converted to gro format by pdb2gmx. Thereafter the simulation proceeded as the other
systems.
MD simulation Preparation
The protein structure files were converted to GROMACS format with pdb2gmx, which also
generated the protein topology. The ligand structure files from LigParGen were added to the
protein structure file, and the topologies included in the topol.top file gmx solvate and genion
were used to solvate the protein in water molecules using the TIP3P water model, and
generate counter ions to neutralize the protein as well as set the concentration of salt to a
phsysiological 0.1M NaCl. The MD simulations were performed using GROMACS v. 202138–45.
Energy minimization was performed for 1ps, then equilibration for 5000 steps at 310K. The
simulations were run in triplicate for 100ns to allow time for conformational changes in the
structure of the IRAP protein to occur. The trajectories were aligned using gmx_trjconv to
center the protein in the water box.
MD analysis
Analysis of the trajectories was done using the mdtraj46 and sklearn47 python packages.
Trajectories were stripped of solvents and then the backbone alpha carbon atoms were
selected for analysis. Pairwise distances between all alpha carbons were calculated using the
combinations python package and used as features in the PCA analyses. Pairs of trajectories
were combined to generate the PCA model, then compared on a single plot, each pair of
simulations were compared during analysis. Trajectories were visualized using Visual
Molecular Dynamics (VMD)48 and Pymol.
18After initial MD equilibration, a refined stable configuration of the ligand in simulation 7 was
found, and so an additional three simulations were performed using the final frame of the
simulation in question as a starting point. Particle velocities were randomly generated at the
start of the three new simulations in order to ensure the three runs were not identical.
19Results and Discussion
PCA analysis
Many of the changes in the protein are too small to detect using simple tools like gmx distance
which only look at a single distance at a time. The variability in a distance calculation over the
course of 100ns is quite high as shown in figure (distances) and detecting trends may be
impossible for a human reader. The PCA analysis reduces many thousand, or even millions of
distances into a 2D plot.
A difference in structure between IRAP trajectories with ligands and without ligands could be
seen after PCA analysis. Structural differences between the trajectories were determined
from the PCA analysis of the trajectory and investigation into specific residue distances and
angles.
Sim8
Sim8
Sim8
Sim8 no sub
Sim8 no sub
Sim8 no sub
Figure 5. Comparison between all replicates of simulation 8 (with Leu-pNA substrate)
and a version of simulation 8 (Sim8 no sub in the figure) where the substrate was
removed before energy minimization.
20In figure 5 the PCA analysis of the distances between the two trajectories show a narrower
range of difference between a ligand free and substrate occupied IRAP. Relative to figure 6
the variance in the two principal components is lesser, with much more overlap between the
trajectories in the PCA space.
Sim6 no sub
Sim6 no sub
Sim6 no sub
Sim6
Sim6
Sim6
Figure 6. Comparison between simulation 6 and a version of simulation 6 with the ligand
(Ang IV) deleted before energy minimization. Since the distribution of all the
trajectories appears randomly spread across the same area of the PCA plot, we conclude
that the ligand did not affect much the behavior of simulations.
21Sim1
Sim1
Sim1
Sim6
Sim6
Sim6
Figure 7. Simulation 1 (structure 4PJ6) vs Trajectory 6, which includes Ang IV. A clear
difference in the simulations can be seen across primary component 1, indicating the
presence of specific ligands causes a conformational change.
A large difference can be seen between the simulation 1 (4PJ6) trajectory compared to
simulation 6 in figure 7, which has Ang IV bound in the active site. The variance in PC2 is
similar between the two trajectories. Figure 8 shows how the two trajectories differ when not
compressed on PC1. The individual plots show there is some variance between trajectories,
but those differences become compressed into a single dimension when plotted beside each
other. A clear difference can be seen between, as well as withing each set of trajectories. The
variance in PC2 shared by both sets of trajectories could be a result of the natural movement
of the protein in water, and the variance in PC1 explained by the different conformational
changes caused by the ligand.
22Simulation 11
Simulation Simulation 6
Simulation 1
Simulation 1
Trajectory 1
Trajectory 2
Trajectory 3
Figure 8. Comparison between trajectory 1 and 6 showing the relatively low variance
within each set of triplicate trajectories, 8A shows trajectories from simulation 1, and
8B shows simulation 6. The load
Simulation 5 vs Simulation 2
Simulation 5
Simulation 5
Simulation 5
Simulation 2
Simulation 2
Simulation 2
Simulati
Figure 9: Comparison of PCA results from a comparison between simulation 2 (without
a ligand) and simulation 5 (with a spiro-oxindole ligand) generated from analysis of only
residues within 12Å of the zinc atom at any point during the simulation. Separation in
both principal components is observed, though the spread within each group appears
to follow a similar diagonal trend.
23Visual analysis of frames chosen by centroid clustering of the PCA results shown in figure 9
shows a dramatic shift in residues GLU295 to ALA298 (figure 10). With a ligand bound those
residues are stable and moving towards the ligand during the simulation, with GLU295
stabilizing the zinc which is in turn bound to the ligand, this can also be seen in figure 11
(GLU295 has the number 136 in that structure) where GLU295 is bound to the N-terminal of
Ang IV in simulation 6. The shrinking of the accessible volume of the active site could be the
main mechanism of inhibition, preventing the bulky substrates from displacing inhibitors.
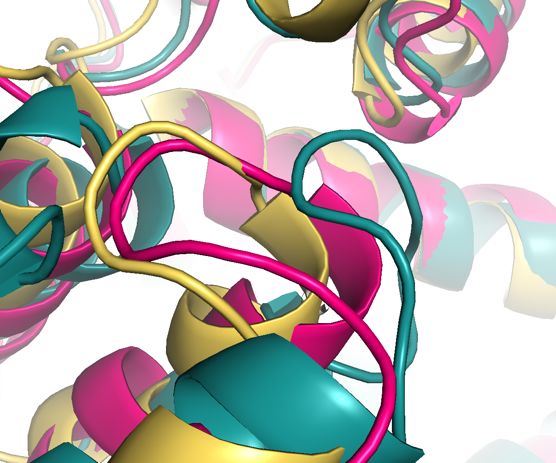
Figure 10: Centroid clustering analysis of frames in simulations 2 and 5. Clusters 0
through 4 (bottom left) correspond to simulation 5 and clusters 5 through 10
correspond to simulation 2. (B) shows the outlier cluster 7 in contrast with the
structures of the other trajectories, the blue loop is adopting a very different position
from the other trajectories, on the left an alpha helix is adopting a different
conformation.
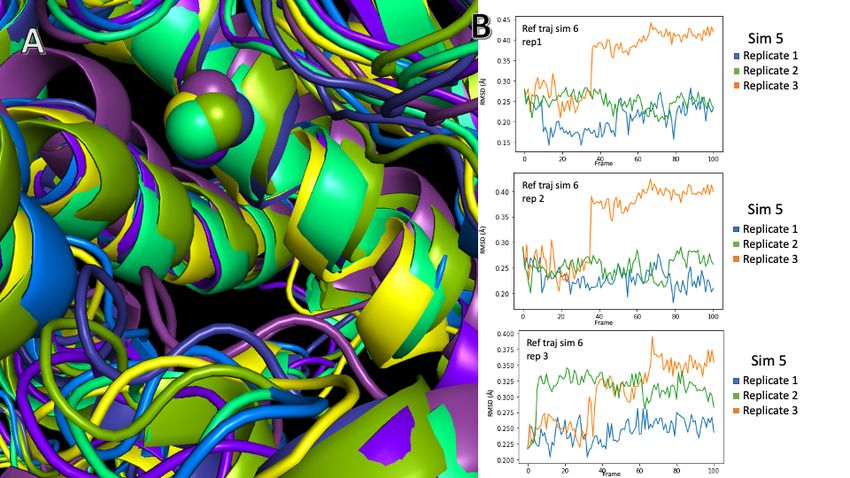
Simulations 5 and 6, which are simulations with the spiro-oxindole inhibitor and with Ang IV,
respectively (shown in figure 12) demonstrate a very similar conformational change. Analysis
of the trajectories visually show a similar result, in figure 12A the alignment between all
clusters is fairly close, which is confirmed by RMSD analysis as shown in figure 13B. The
notable outlier is replicate 3 of simulation 5, where the ligand migrates out of the active site
and the IRAP enzyme changes in response.
24Figure 11: Comparison between simulation 5 and simulation 6, clusters 0 through 3
correspond to frames in simulation 5. Clusters 4, 5, and 6 correspond to simulation 6.
Figure 12: Frames generated by clustering analysis of simulations 5 and 6 superimposed
together are shown in (A), relatively minor changes can be seen between the
superimposed structures. RMSD analyses of the superimposed and aligned trajectories
are shown in (B) which compares the RMSD of each of the three replicates of simulation
5, with each individual replicate of simulation 6. The third replicate of simulation 5 (in
25orange on each graph) deviates due to the ligand leaving the S1 pocket, which causes a
reversion of IRAP back to an unbound state.
Ligand Interaction Maps
Contact maps were generated between the ligand and protein for some simulations, in order
to show interactions between the ligands and certain residues.
The contact map in figure 13 shows the interaction between Ang IV and the IRAP protein over
the course of one 100ns MD simulation. The most stable interactions are near the N terminal,
which is close to the zinc ion required for catalytic activity. Interaction between the N
terminal and the GAMEN loop residues, here numbered 269-273 (due to alternate numbering
scheme in the structure), can be seen.
Figure 13. Interaction map of simulation 6 (with Ang IV) in the active site of IRAP. 13(A)
is a snapshot from frame 0 of the trajectory, 13(B) shows the contacts in the last frame
of the trajectory. 13(C) is the total average of interactions between the peptide
substrate and the IRAP protein during the trajectory trajectory.
26Distances
Distance - GLY428 PHE544 Distance - GLY428 PHE544
4 3.8
3.75
3.9
3.7
3.8 3.65
Distance (nm)
Distance (nm)
3.6
3.7
3.55
3.6
3.5
3.5 3.45
3.4
3.4
3.35
3.3 3.3
0 20000 40000 60000 80000 100000 0 20000 40000 60000 80000 100000
Time (ps) Time (ps)
Figure 14: Comparison between distance measurements between the alpha carbons of
GLY428 and PHE544 of two trajectories; Figure A compares the distances over the
course of simulation 6 which included Ang IV. Figure B shows the same distances during
a simulation of the same structure with Ang IV excluded.
Distance calculations were more difficult to gain information from. The distance graphs seen
in figure 14 show the distance between two residues on opposite sides of the catalytic S1
pocket with the catalytic zinc bisecting the line formed between the two residues. The
distances are very similar though figure 14A indicates that Ang IV in the active site caused
some expansion in the distance across the S1 pocket, though the difference could be
explained by the protein equilibriating rather than actual conformational change resulting
form the presence of the Ang IV analogue.
Additional simulations
After the first round of simulations, a very stable ligand binding pose was detected in
simulation 7. The three additional simulations revealed the pose was very stable, all three
replicates maintained a very similar pose to the starting frame despite random velocities
being added to the simulation parameters. The resulting trajectories were very stable, with a
maximum RMSD from the initial frame of 0.24nm.
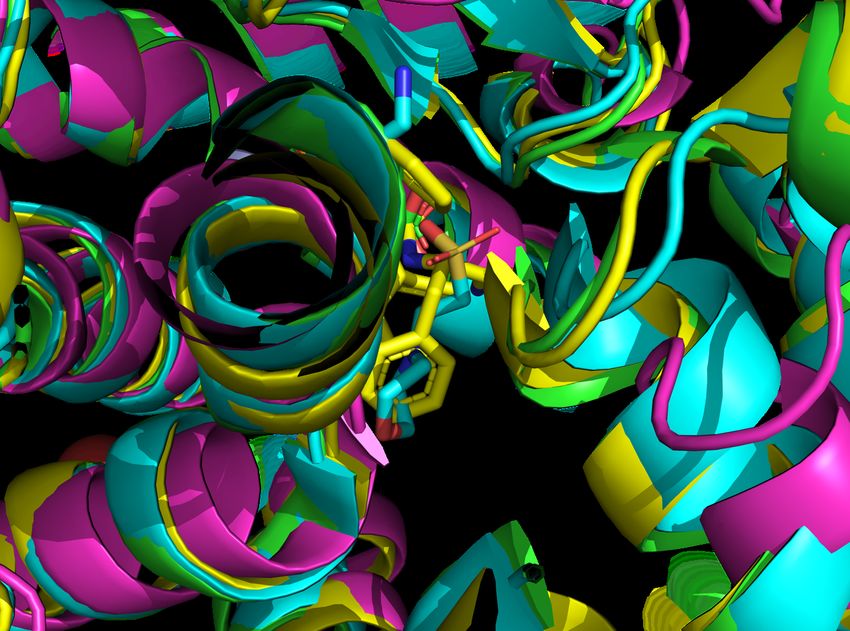
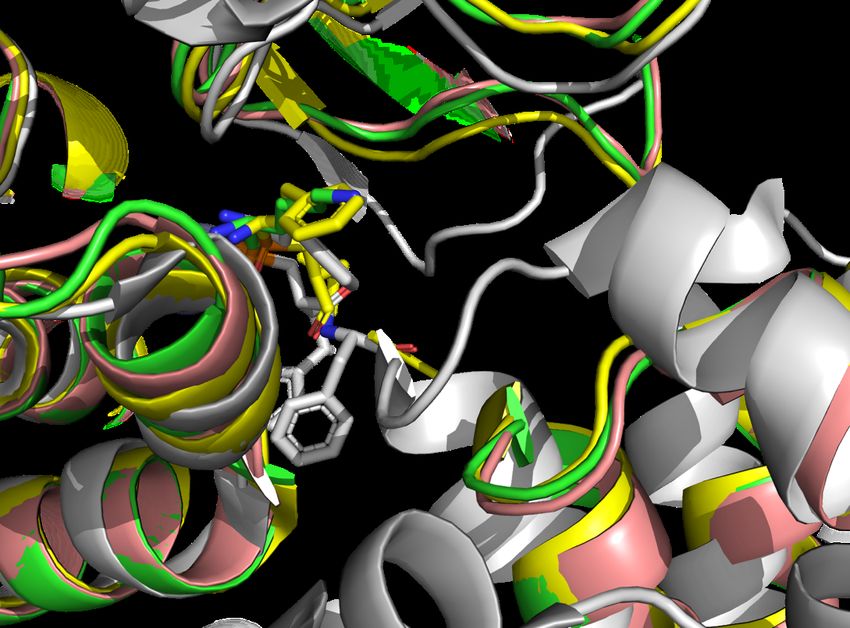
27Figure 15: The position of the spiro-oxindole ligand at the start of the extra 100ns
simulation for all three trajectories (A) and after 100ns of additional simulation with
each trajectory in a different colour (B). The binding pose is quite stable, the
interactions between serine 546 and Tyrosine 954 driving the binding and providing
strong targets for drug design.
The interactions between the spiro-oxindole inhibitor and the IRAP protein are outlined in
Figure 5. An interesting possibility in the mechanism of binding at this position is the flexibility
of the tyrosine, to stabilize a wider range of positions, and the serine at position 548. If the
electrostatic interaction between the ligand and serine 546 fail, due to movement of the
protein or ligand, the interaction can be re-established with either serine.
Conclusion
PCA is a valuable tool for reducing complex data into a format that humans can read. This
technique was useful in detecting differences in the movement of a protein when a ligand is
bound compared to no ligand. Distance plots can be useful when enzyme dynamics are well
understood, but when movement in the protein is concerted across many residues PCA
analysis of total distances or distances of a selection of residues can be valuable. The
movement in IRAP seems to be on a large scale throughout the protein, being able to detect
tiny changes in the overall conformation of a the IRAP protein is therefore a valuable tool.
28Based on the PCA data the presence of a ligand in the binding pocket has an effect on the
conformation of the IRAP enzyme. The effect of the inhibitor on the conformation seems to
resemble the change caused by substrate or substrate mimicking ligands. The conformational
change in the IRAP protein in the presence of an inhibitor during an MD simulation can
therefore be a valuable tool in research into new IRAP inhibitors. Residues of interest are the
two serines at position 546 and 548, and the tyrosine at position 961
This project would have benefitted from longer term simulations of each other ligands, in
order to determine stable interactions over a great time period. The addition of more ligands,
as well as weaker inhibitors could lead to further insight on which specific interactions and
conformational changes in the IRAP enzyme are important for the design of IRAP inhibiting
drugs.
In a future project using the PCA tool to compare specific distance pairs between entire
regions or set of residues could lead to deeper insights into the conformational changes a
protein undergoes in a variety of situation, from ligand binding or pH changes, or temperature
changes, or a huge variety of situations that lead to protein dysfunction. Future work including
closely related enzymes ERAP and APN with ligands could also illuminate the mechanism
underlying enzyme selectivity for one ligand or another.
References
(1) Heitler, W.; London, F. Wechselwirkung Neutraler Atome Und Homöopolare Bindung
Nach Der Quantenmechanik. Zeitschrift für Physik 1927, 44 (6–7), 455–472.
https://doi.org/10.1007/BF01397394.
(2) Liu, X.; Shi, D.; Zhou, S.; Liu, H.; Liu, H.; Yao, X. Molecular Dynamics Simulations and
Novel Drug Discovery. Expert Opinion on Drug Discovery. Taylor and Francis Ltd
January 2, 2018, pp 23–37. https://doi.org/10.1080/17460441.2018.1403419.
(3) WHO. WHO Neurological Disorders: Public Health Challenges
https://www.who.int/mental_health/neurology/neurodiso/en/ (accessed 2021 -05 -
25).
29(4) Samuelsson, J.; Kern, S.; Zetterberg, H.; Blennow, K.; Rothenberg, E.; Wallengren, O.;
Skoog, I.; Zettergren, A. A Western-style Dietary Pattern Is Associated with
Cerebrospinal Fluid Biomarker Levels for Preclinical Alzheimer’s Disease—A
Population-based Cross-sectional Study among 70-year-olds. Alzheimer’s & Dementia:
Translational Research & Clinical Interventions 2021, 7 (1).
https://doi.org/10.1002/trc2.12183.
(5) Livingston, G.; Huntley, J.; Sommerlad, A.; Ames, D.; Ballard, C.; Banerjee, S.; Brayne,
C.; Burns, A.; Cohen-Mansfield, J.; Cooper, C.; Costafreda, S. G.; Dias, A.; Fox, N.;
Gitlin, L. N.; Howard, R.; Kales, H. C.; Kivimäki, M.; Larson, E. B.; Ogunniyi, A.; Orgeta,
V.; Ritchie, K.; Rockwood, K.; Sampson, E. L.; Samus, Q.; Schneider, L. S.; Selbæk, G.;
Teri, L.; Mukadam, N. Dementia Prevention, Intervention, and Care: 2020 Report of
the Lancet Commission. The Lancet. Lancet Publishing Group August 8, 2020, pp 413–
446. https://doi.org/10.1016/S0140-6736(20)30367-6.
(6) Drinkwater, N.; Lee, J.; Yang, W.; Malcolm, T. R.; McGowan, S. M1 Aminopeptidases
as Drug Targets: Broad Applications or Therapeutic Niche? FEBS Journal. Blackwell
Publishing Ltd May 1, 2017, pp 1473–1488. https://doi.org/10.1111/febs.14009.
(7) Barlow, N.; Vanga, S. R.; Sävmarker, J.; Sandström, A.; Burns, P.; Hallberg, A.; Åqvist,
J.; Gutiérrez-De-Terán, H.; Hallberg, M.; Larhed, M.; Chai, S. Y.; Thompson, P. E.
Macrocyclic Peptidomimetics as Inhibitors of Insulin-Regulated Aminopeptidase
(IRAP). RSC Medicinal Chemistry 2020, 11 (2), 234–244.
https://doi.org/10.1039/c9md00485h.
(8) Weimershaus, M.; Mauvais, F. X.; Evnouchidou, I.; Lawand, M.; Saveanu, L.; van
Endert, P. IRAP Endosomes Control Phagosomal Maturation in Dendritic Cells.
Frontiers in Cell and Developmental Biology 2020, 8.
https://doi.org/10.3389/fcell.2020.585713.
(9) Albiston, A. L.; McDowall, S. G.; Matsacos, D.; Sim, P.; Clune, E.; Mustafa, T.; Lee, J.;
Mendelsohn, F. A. O.; Simpson, R. J.; Connolly, L. M.; Chai, S. Y. Evidence That the
Angiotensin IV (AT4) Receptor Is the Enzyme Insulin-Regulated Aminopeptidase.
Journal of Biological Chemistry 2001, 276 (52), 48623–48626.
https://doi.org/10.1074/jbc.C100512200.
(10) Lew, R. A.; Mustafa, T.; Ye, S.; McDowall, S. G.; Chai, S. Y.; Albiston, A. L. Angiotensin
AT4 Ligands Are Potent, Competitive Inhibitors of Insulin Regulated Aminopeptidase
30(IRAP). Journal of Neurochemistry 2003, 86 (2), 344–350.
https://doi.org/10.1046/j.1471-4159.2003.01852.x.
(11) Albiston, A. L.; Fernando, R. N.; Yeatman, H. R.; Burns, P.; Ng, L.; Daswani, D.;
Diwakarla, S.; Pham, V.; Chai, S. Y. Gene Knockout of Insulin-Regulated
Aminopeptidase: Loss of the Specific Binding Site for Angiotensin IV and Age-Related
Deficit in Spatial Memory. Neurobiology of Learning and Memory 2010, 93 (1), 19–30.
https://doi.org/10.1016/j.nlm.2009.07.011.
(12) Fernando, R. N.; Larm, J.; Albiston, A. L.; Chai, S. Y. Distribution and Cellular
Localization of Insulin-Regulated Aminopeptidase in the Rat Central Nervous System.
Journal of Comparative Neurology 2005, 487 (4), 372–390.
https://doi.org/10.1002/cne.20585.
(13) Yeatman, H. R.; Albiston, A. L.; Burns, P.; Chai, S. Y. Forebrain Neurone-Specific
Deletion of Insulin-Regulated Aminopeptidase Causes Age Related Deficits in
Memory. Neurobiology of Learning and Memory 2016, 136, 174–182.
https://doi.org/10.1016/j.nlm.2016.09.017.
(14) Wallis, M. G.; Lankford, M. F.; Keller, S. R. Vasopressin Is a Physiological Substrate for
the Insulin-Regulated Aminopeptidase IRAP. American Journal of Physiology -
Endocrinology and Metabolism 2007, 293 (4).
https://doi.org/10.1152/ajpendo.00440.2007.
(15) Vear, A.; Gaspari, T.; Thompson, P.; Chai, S. Y. Is There an Interplay Between the
Functional Domains of IRAP? Frontiers in Cell and Developmental Biology. Frontiers
Media S.A. September 29, 2020. https://doi.org/10.3389/fcell.2020.585237.
(16) Barlow, N.; Thompson, P. E. IRAP Inhibitors: M1-Aminopeptidase Family Inspiration.
Frontiers in Pharmacology. Frontiers Media S.A. September 25, 2020, p 1515.
https://doi.org/10.3389/fphar.2020.585930.
(17) Albiston, A. L.; Cacador, M.; Sinnayah, P.; Burns, P.; Chai, S. Y. Insulin-Regulated
Aminopeptidase Inhibitors Do Not Alter Glucose Handling in Normal and Diabetic
Rats. Journal of Molecular Endocrinology 2017, 58 (4), 193–198.
https://doi.org/10.1530/JME-17-0033.
(18) Keller, S. R.; Scott, H. M.; Mastick, C. C.; Aebersold, R.; Lienhard, G. E. Cloning and
Characterization of a Novel Insulin-Regulated Membrane Aminopeptidase from Glut4
31Vesicles. Journal of Biological Chemistry 1995, 270 (40), 23612–23618.
https://doi.org/10.1074/jbc.270.40.23612.
(19) Laustsen, P. G.; Vang, S.; Kristensen, T. Mutational Analysis of the Active Site of
Human Insulin-Regulated Aminopeptidase. European Journal of Biochemistry 2001,
268 (1), 98–104. https://doi.org/10.1046/j.1432-1327.2001.01848.x.
(20) Nguyen, T. T.; Chang, S. C.; Evnouchidou, I.; York, I. A.; Zikos, C.; Rock, K. L.; Goldberg,
A. L.; Stratikos, E.; Stern, L. J. Structural Basis for Antigenic Peptide Precursor
Processing by the Endoplasmic Reticulum Aminopeptidase ERAP1. Nature Structural
and Molecular Biology 2011, 18 (5), 604–613. https://doi.org/10.1038/nsmb.2021.
(21) Nguyen, T. T.; Chang, S. C.; Evnouchidou, I.; York, I. A.; Zikos, C.; Rock, K. L.; Goldberg,
A. L.; Stratikos, E.; Stern, L. J. Structural Basis for Antigenic Peptide Precursor
Processing by the Endoplasmic Reticulum Aminopeptidase ERAP1. Nature Structural
and Molecular Biology 2011, 18 (5), 604–613. https://doi.org/10.1038/nsmb.2021.
(22) Marapaka, A. K.; Pillalamarri, V.; Gumpena, R.; Haque, N.; Bala, S. C.; Jangam, A.;
Addlagatta, A. Discovery, Structural and Biochemical Studies of a Rare Glu/Asp
Specific M1 Class Aminopeptidase from Legionella Pneumophila. International Journal
of Biological Macromolecules 2018, 120, 1111–1118.
https://doi.org/10.1016/j.ijbiomac.2018.08.172.
(23) Mpakali, A.; Saridakis, E.; Harlos, K.; Zhao, Y.; Kokkala, P.; Georgiadis, D.; Giastas, P.;
Papakyriakou, A.; Stratikos, E. Ligand-Induced Conformational Change of Insulin-
Regulated Aminopeptidase: Insights on Catalytic Mechanism and Active Site Plasticity.
Journal of Medicinal Chemistry 2017, 60 (7), 2963–2972.
https://doi.org/10.1021/acs.jmedchem.6b01890.
(24) Jollife, I. T.; Cadima, J. Principal Component Analysis: A Review and Recent
Developments. Philosophical Transactions of the Royal Society A: Mathematical,
Physical and Engineering Sciences. Royal Society of London April 13, 2016.
https://doi.org/10.1098/rsta.2015.0202.
(25) Hermans, S. J.; Ascher, D. B.; Hancock, N. C.; Holien, J. K.; Michell, B. J.; Chai, S. Y.;
Morton, C. J.; Parker, M. W. Crystal Structure of Human Insulin-Regulated
Aminopeptidase with Specificity for Cyclic Peptides. Protein Science 2015, 24 (2), 190–
199. https://doi.org/10.1002/pro.2604.
32(26) Mpakali, A.; Saridakis, E.; Harlos, K.; Zhao, Y.; Papakyriakou, A.; Kokkala, P.;
Georgiadis, D.; Stratikos, E. Crystal Structure of Insulin-Regulated Aminopeptidase
with Bound Substrate Analogue Provides Insight on Antigenic Epitope Precursor
Recognition and Processing. The Journal of Immunology 2015, 195 (6), 2842–2851.
https://doi.org/10.4049/jimmunol.1501103.
(27) Mpakali, A.; Saridakis, E.; Harlos, K.; Zhao, Y.; Papakyriakou, A.; Kokkala, P.;
Georgiadis, D.; Stratikos, E. Crystal Structure of Insulin-Regulated Aminopeptidase
with Bound Substrate Analogue Provides Insight on Antigenic Epitope Precursor
Recognition and Processing. The Journal of Immunology 2015, 195 (6), 2842–2851.
https://doi.org/10.4049/jimmunol.1501103.
(28) Yin X, Liu L, Jia Y, Ming X, Zhang Y, Li T, Wei P. [Expression and biological function
analysis of chicken aminopeptidase N]. Sheng Wu Gong Cheng Xue Bao. 2010
Apr;26(4):470-5. Chinese. PMID: 20575434.
(29) Stokoe, D.; Caudwell, B.; Cohen, P. T. W.; Cohen, P. The Substrate Specificity and
Structure of Mitogen-Activated Protein (MAP) Kinase-Activated Protein Kinase-2.
Biochemical Journal 1993, 296 (3), 843–849. https://doi.org/10.1042/bj2960843.
(30) Gopalaswamy, G.; Balasubramaniam, N.; Kanagasabapathy, A. S. Fractionation of
Cystine Aminopeptidases ('oxytocinase’) from Term Human Placenta and Maternal
Serum. Clinica Chimica Acta 1984, 144 (1), 39–48. https://doi.org/10.1016/0009-
8981(84)90258-4.
(31) Matsumoto, A. K.; Martin, D. R.; Carter, R. H.; Klickstein, L. B.; Ahearn, J. M.; Fearon,
D. T. Functional Dissection of the CD21/CD19/TAPA-1/Leu-13 Complex of b
Lymphocytes. Journal of Experimental Medicine 1993, 178 (4), 1407–1417.
https://doi.org/10.1084/jem.178.4.1407.
(32) Engen, K.; Vanga, S. R.; Lundbäck, T.; Agalo, F.; Konda, V.; Jensen, A. J.; Åqvist, J.;
Gutiérrez-de-Terán, H.; Hallberg, M.; Larhed, M.; Rosenström, U. Synthesis,
Evaluation and Proposed Binding Pose of Substituted Spiro-Oxindole
Dihydroquinazolinones as IRAP Inhibitors. ChemistryOpen 2020, 9 (3), 325–337.
https://doi.org/10.1002/open.201900344.
(33) Diwakarla, S.; Nylander, E.; Grönbladh, A.; Vanga, S. R.; Khan, Y. S.; Gutiérrez-De-
Terán, H.; Sävmarker, J.; Ng, L.; Pham, V.; Lundbäck, T.; Jenmalm-Jensen, A.;
Svensson, R.; Artursson, P.; Zelleroth, S.; Engen, K.; Rosenström, U.; Larhed, M.;
33Åqvist, J.; Chai, S. Y.; Hallberg, M. Aryl Sulfonamide Inhibitors of Insulin-Regulated
Aminopeptidase Enhance Spine Density in Primary Hippocampal Neuron Cultures.
ACS Chemical Neuroscience 2016, 7 (10), 1383–1392.
https://doi.org/10.1021/acschemneuro.6b00146.
(34) Macromodel. Schrödinger, LLC: New York, NY 2020.
(35) Jorgensen, W. L.; Tirado-Rives, J. Potential Energy Functions for Atomic-Level
Simulations of Water and Organic and Biomolecular Systems; 2005.
(36) Dodda, L. S.; De Vaca, I. C.; Tirado-Rives, J.; Jorgensen, W. L. LigParGen Web Server:
An Automatic OPLS-AA Parameter Generator for Organic Ligands. Nucleic Acids
Research 2017, 45 (W1), W331–W336. https://doi.org/10.1093/nar/gkx312.
(37) Dodda, L. S.; Vilseck, J. Z.; Tirado-Rives, J.; Jorgensen, W. L. 1.14∗CM1A-LBCC:
Localized Bond-Charge Corrected CM1A Charges for Condensed-Phase Simulations.
Journal of Physical Chemistry B 2017, 121 (15), 3864–3870.
https://doi.org/10.1021/acs.jpcb.7b00272.
(38) Hess, B.; Kutzner, C.; Van Der Spoel, D.; Lindahl, E. GROMACS 4: Algorithms for Highly
Efficient, Load-Balanced, and Scalable Molecular Simulation. Journal of Chemical
Theory and Computation 2008, 4 (3), 435–447. https://doi.org/10.1021/ct700301q.
(39) Bekker, Henk & Berendsen, Herman & Dijkstra, E.J. & Achterop, S. & Drunen, Rudi &
van der Spoel, David & Sijbers, A. & Keegstra, H. & Reitsma, B. & Renardus, M.K.R..
(1993). Gromacs: A parallel computer for molecular dynamics simulations. Physics
Computing. 92. 252-256.
(40) S. Pronk, S. Páll, R. Schulz, P. Larsson, P. Bjelkmar, R. Apostolov, M. R.; Shirts, J. C.
Smith, P. M. Kasson, D. van der Spoel, B. Hess, and E. L. GROMACS 4.5: A High-
Throughput and Highly Parallel Open Source Molecular Simulation Toolkit.
Bioinformatics 2013, No. 29, 845–854.
(41) Lindahl, E.; Hess, B.; van der Spoel, D. GROMACS 3.0: A Package for Molecular
Simulation and Trajectory Analysis. Journal of Molecular Modeling 2001, 7 (8), 306–
317. https://doi.org/10.1007/s008940100045.
(42) Van Der Spoel, D.; Lindahl, E.; Hess, B.; Groenhof, G.; Mark, A. E.; Berendsen, H. J. C.
GROMACS: Fast, Flexible, and Free. Journal of Computational Chemistry. December
2005, pp 1701–1718. https://doi.org/10.1002/jcc.20291.
34(43) M.J. Abraham, D. van der Spoel, E. Lindahl, B. Hess, and the GROMACS development
team, GROMACS User Manual version 5.1.4, www. gromacs. org (2016). GROMACS -
Gmx Mdrun, VERSION 5.1.4.
(44) Berendsen, H. J. C.; van der Spoel, D.; van Drunen, R. GROMACS: A Message-Passing
Parallel Molecular Dynamics Implementation. Computer Physics Communications
1995. https://doi.org/10.1016/0010-4655(95)00042-E.
(45) M. J. Abraham, T. Murtola, R. Schulz, S. Páll, J. C. Smith, B. Hess, E.; Lindahl.
GROMACS: High Performance Molecular Simulations through Multi-Level Parallelism
from Laptops to Supercomputers. SoftwareX 2015, 1, 19–25.
(46) McGibbon, R. T.; Beauchamp, K. A.; Harrigan, M. P.; Klein, C.; Swails, J. M.;
Hernández, C. X.; Schwantes, C. R.; Wang, L. P.; Lane, T. J.; Pande, V. S. MDTraj: A
Modern Open Library for the Analysis of Molecular Dynamics Trajectories. Biophysical
Journal 2015, 109 (8), 1528–1532. https://doi.org/10.1016/j.bpj.2015.08.015.
(47) Pedregosa, F.; Varoquaux, G.; Gramfort, A.; Michel, V.; Thirion, B.; Grisel, O.; Blondel,
M.; Prettenhofer, P.; Weiss, R.; Dubourg, V.; Vanderplas, J.; Passos, A.; Cournapeau,
D.; Brucher, M.; Perrot, M.; Duchesnay, É. Scikit-Learn: Machine Learning in Python
Gaël Varoquaux Bertrand Thirion Vincent Dubourg Alexandre Passos PEDREGOSA,
VAROQUAUX, GRAMFORT ET AL. Matthieu Perrot. J. Mach. Learn. Res. 2011, 12 (85),
2825–2830.
(48) Humphrey, W.; Dalke, A.; Schulten, K. VMD: Visual Molecular Dynamics. Journal of
Molecular Graphics 1996, 14 (1), 33–38. https://doi.org/10.1016/0263-
7855(96)00018-5.
35You can also read