Spatiotemporal dynamics of fog and low clouds in the Namib unveiled with ground- and space-based observations
←
→
Page content transcription
If your browser does not render page correctly, please read the page content below
Atmos. Chem. Phys., 19, 4383–4392, 2019
https://doi.org/10.5194/acp-19-4383-2019
© Author(s) 2019. This work is distributed under
the Creative Commons Attribution 4.0 License.

Spatiotemporal dynamics of fog and low clouds in the Namib
unveiled with ground- and space-based observations
Hendrik Andersen1,2 , Jan Cermak1,2 , Irina Solodovnik1,2 , Luca Lelli3 , and Roland Vogt4
1 Karlsruhe Institute of Technology (KIT), Institute of Meteorology and Climate Research, Karlsruhe, Germany
2 Karlsruhe Institute of Technology (KIT), Institute of Photogrammetry and Remote Sensing, Karlsruhe, Germany
3 University of Bremen, Institute of Environmental Physics and Remote Sensing, Bremen, Germany
4 University of Basel, Department of Environmental Sciences, Basel, Switzerland

Correspondence: Hendrik Andersen (hendrik.andersen@kit.edu)

Received: 6 December 2018 – Discussion started: 17 December 2018
Revised: 21 March 2019 – Accepted: 22 March 2019 – Published: 4 April 2019

Abstract. Fog is an essential component of Namib-region          Eckardt et al., 2013; McHugh et al., 2015). However, only
ecosystems. Current knowledge on Namib-region fog pat-           little is known about its spatial and temporal patterns, as well
terns and processes is limited by a lack of coherent obser-      as the environmental drivers of fog in the Namib.
vations in space and time. In this study, data from multiple         While meteorological measurements are generally sparse
satellite platforms and station measurements paint a coher-      in this region, historical station observations of fog in the
ent picture of the spatiotemporal dynamics of fog and low        central Namib between the 1940s and the 1980s have shown
cloud (FLC) distribution. It is found that observed seasonal     contrasting seasonal patterns of fog occurrence at coastal
FLC patterns derived from satellite observations differ from     and inland locations (Nagel, 1959; Lancaster et al., 1984).
fog measurements at coastal station locations, whereas they      These studies find that, at inland locations, fog tends to oc-
agree further inland. This is linked to an observed seasonal     cur less frequently between April and August, while fog oc-
cycle in the vertical structure of FLCs that determines the      currence at coastal locations peaks during this time. More
probability of low-level clouds touching the ground. For the     recently, satellite data have been used to study the patterns
first time, these observations are complemented by spatially     of fog and low clouds (FLCs) in the Namib (e.g., Olivier,
coherent statistics concerning the diurnal cycle of FLCs us-     1995; Cermak, 2012; Andersen and Cermak, 2018). The only
ing geostationary satellite data. The average timing of the      satellite-based study that comprises a multi-year seasonal cy-
start of the diurnal FLC cycle is found to strongly depend       cle of FLCs is presented in Cermak (2012), and while the
on the distance to the coastline (correlation ≈ 0.85 north of    observed patterns compare well to station measurements of
25◦ S), a clear indication of dominant advective processes.      fog presented in Lancaster et al. (1984) at the inland sta-
In the central Namib, FLCs typically occur 2–4 h later than      tion in Gobabeb, observed seasonal cycles from satellite data
in other coastal regions, possibly due to local advection pat-   and station measurements of fog differ at the coastal loca-
terns. The findings lead to a new conceptual model of the        tion in Walvis Bay. This could be related to seasonally vary-
spatiotemporal dynamics of fog and low clouds in the Namib.      ing mechanisms responsible for fog formation or due to a
                                                                 seasonal cycle in vertical characteristics of FLCs in this re-
                                                                 gion, i.e., the fact that all low clouds are treated summar-
                                                                 ily by the satellite technique, whereas only the ones with
1   Introduction                                                 the lowest cloud bases manifest themselves as fog as re-
                                                                 ported by ground-based observations. However, a spatially
In arid environments like the Namib, fog can be a crucial        coherent detailed characterization of FLCs, including verti-
source of water for many species and ecosystems (e.g., Seely     cal characteristics, as well as seasonal and diurnal patterns,
et al., 1977; Seely, 1979; Shanyengana, 2002; Ebner et al.,      is still missing. Additionally, the importance of the different
2011; Azúa-Bustos et al., 2011; Roth-Nebelsick et al., 2012;

Published by Copernicus Publications on behalf of the European Geosciences Union.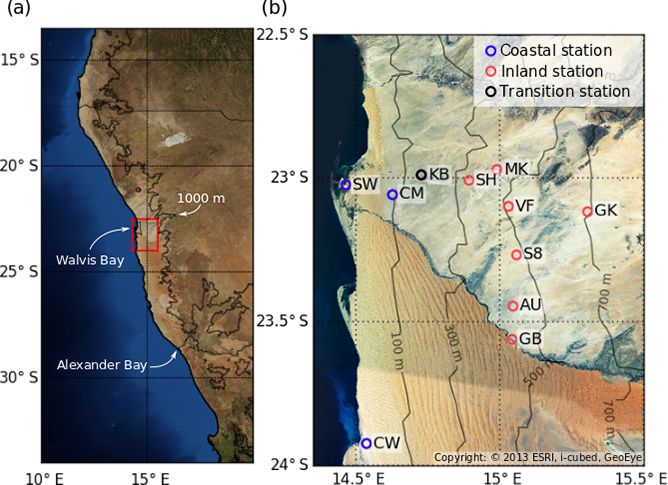
4384                                                               H. Andersen et al.: Spatiotemporal dynamics of Namib fog

mechanisms that can lead to fog formation is still uncertain.
While most studies (e.g., Lancaster et al., 1984; Olivier and
Stockton, 1989; Olivier, 1992, 1995; Cermak, 2012; Ander-
sen and Cermak, 2018) relate Namib-region fog mostly to
the advection of low clouds formed over the cool waters of
the Benguela current, recent analyses of stable isotopes have
pointed to mixed or sweet water sources, which have been
interpreted as an indication for radiation fog (Kaseke et al.,
2017, 2018). However, the labor-intensive field work needed
for isotope analyses has limited these studies in spatial and
temporal extent, underscoring the need for a spatiotempo-
rally complete and coherent characterization of FLC mecha-
nisms. In this study, active-sensor and passive-sensor satellite
data are used in conjunction with ground-based meteorolog-
ical measurements to better understand fog and low-cloud
patterns at different scales. The goal of this study is to pro-     Figure 1. (a) An overview of the study area. The grey line repre-
vide climatological, spatiotemporally complete patterns that        sents 1000 m above sea level and approximates the transition from
help understand the processes driving Namib-region fog and          the low-lying coastal plains to the Great Escarpment that represents
low clouds.                                                         the eastern limit of the Namib desert. The red box in the Walvis Bay
   The guiding hypotheses are that                                  area highlights the central Namib, which is shown in more detail in
                                                                    panel (b): FogNet stations are illustrated by circles and are anno-
    1. FLC patterns in time and space differ distinctly between     tated with their respective IDs (full station names are given in the
       the coastline and regions further inland, and                Appendix). Blue circles represent coastal and red circles inland sta-
                                                                    tions as defined in this study (Sect. 2.4). The Kleinberg (KB) station
    2. apparent differences between the seasonal cycle of fog       is colored in black, as it is viewed to be at a transitional location not
       as observed from the ground and satellite perspectives       clearly belonging to either category.
       are explained by a seasonal cycle in the vertical struc-
       ture of FLCs.
                                                                    in the thermal infrared, enabling a fully diurnal detection of
                                                                    FLCs in the region. It has been validated against surface net
2     Data and methods                                              radiation measurements with a probability of detection of
                                                                    94 %, a false alarm rate of 12 % and a general correctness
In this study, multiple data sets from various space-based          of all classifications of 97 % (Andersen and Cermak, 2018).
sensors are used to characterize FLCs and analyze their spa-
tiotemporal occurrence patterns. The general spatial domain         2.2   CALIPSO
investigated in this study is the western coastline of south-
ern Africa (13.5–34◦ S and 5–20◦ E, Fig. 1a), with a specific       SEVIRI observations are complemented by retrieved layer
focus on patterns over land and a core region of FLC oc-            heights from the active-sensor platform from the Cloud-
currence in the central Namib near Walvis Bay (22.5–24◦ S           Aerosol Lidar and Infrared Pathfinder Satellite Observa-
and ≈ 14–15.5◦ E, Fig. 1b). In the central Namib, the FogNet        tion (CALIPSO). Mounted aboard the satellite is the Cloud-
station network (Kaspar et al., 2015) is located, providing a       Aerosol Lidar with Orthogonal Polarization (CALIOP) that
ground-based perspective on fog patterns. Detailed descrip-         samples with 30 m vertical and 333 m horizontal resolutions.
tions of the different sensors, techniques and data sets used       Here, the level 2 CALIPSO 5 km cloud-layer product (ver-
in this study are given in Sect. 2.1–2.4.                           sion 4.10) is used to detect FLCs with the algorithm de-
                                                                    veloped by Cermak (2018) for the period of 13 June 2006–
2.1    SEVIRI                                                       31 December 2017 (daytime and nighttime). The algorithm
                                                                    essentially detects low clouds with a cloud-top altitude of
Coherent spatiotemporal patterns of FLC occurrence are cre-         ≤ 2000 m and a cloud-base altitude ≤ 500 m above ground
ated using data from the Spinning Enhanced Visible and In-          level. Additionally, spatial and temporal patterns of cloud-top
frared Imager (SEVIRI) aboard the Meteosat Second Gener-            height (CTH) are generated using the same data. Results are
ation (MSG) satellites. The sensor has a nadir spatial resolu-      then aggregated to 2.5◦ × 2.5◦ regions to increase the sample
tion of 3 km and provides 96 hemispheric scans per day (re-         size as in Cermak (2018).
peat rate of 15 min) (Schmetz et al., 2002). The novel FLC-
detection technique by Andersen and Cermak (2018) is ap-
plied to data of nearly the entire operational period of MSG
satellites (2004–2017). The technique uses only observations

Atmos. Chem. Phys., 19, 4383–4392, 2019                                                 www.atmos-chem-phys.net/19/4383/2019/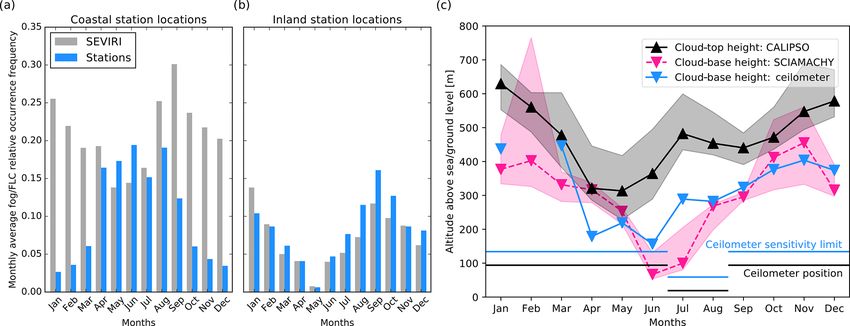
H. Andersen et al.: Spatiotemporal dynamics of Namib fog                                                                         4385

2.3   SCIAMACHY                                                         Measurements of fog precipitation and relative humid-
                                                                     ity are combined to create a binary data set of fog oc-
The Scanning Imaging Absorption Spectrometer for Atmo-               currence. Fog precipitation measurements describe advected
spheric Chartography (SCIAMACHY) sensor (Bovensmann                  cloud water collected by a Juvik fog collector (Juvik and
et al., 1999), aboard the Envisat platform, is used to infer         Nullet, 1995). The Juvik fog collector is an omnidirectional,
cloud bottom altitudes. This is done using the fit of sun-           cylindrical aluminium fog gauge, positioned at 1.5 m above
light absorption by the strongest molecular band of oxy-             ground. Measured fog precipitation depends on the near-
gen (the A band), located in the near-infrared (NIR) be-             ground liquid water content of fog and fog droplet size, and
tween 750 and 770 nm (nominal spectral resolution 0.4 nm).           also scales with near-surface wind speed, as this determines
The deployed algorithm Semi-Analytical CloUd Retrieval               the volume of air that perfuses the gauge (Frumau et al.,
Algorithm (SACURA) (Rozanov and Kokhanovsky, 2004;                   2011). There can be a time lag between fog occurrence and
Lelli et al., 2012) exploits the constant vertical abundance of      measured fog precipitation due to the build-up time until the
columnar oxygen so that any cloud intervening in the field of        runoff of fog water occurs. Also, the instrument might not be
view of the sensor shields the gas column below, thus chang-         sensitive in instances of very thin fog, as there is a lower limit
ing the depth of the A band. Concurrently, the increase of ab-       of water needed for runoff. To reduce measurement-related
sorption by oxygen within a cloud due to multiple scattering         uncertainties in the fog occurrence estimates, fog precipita-
is accounted for by calculating the single-scattering albedo         tion measurements are supplemented by observations of 2 m
of the atmospheric volume at 760 nm. In this way, with the           relative humidity (Campbell CS215) to create a binary fog
knowledge of the cloud optical thickness (COT) computed              product. The station measurements have a 1 min temporal
at the non-absorbing channel (758 nm), the inversion of the          resolution but are averaged in 15 min intervals for compar-
measurement delivers the cloud geometrical extent. As long           ison with SEVIRI observations. Fog is counted whenever the
as the sensed cloud is single layered and has a constant liquid      average relative humidity during a 15 min interval exceeds
water content, the reported model error in CBH amounts to            95 % or any amount of fog precipitation is measured during
−200/350 m (Lelli et al., 2011), which is paired to a CTH ab-        this time.
solute error of ±250 m (Lelli et al., 2012, 2014). These errors         A ceilometer (Vaisala CL31, instrument “CL31-2” in
are irrespective of COT, given CTH values < 10 km. How-              Wiegner et al., 2019) complemented the measurements at the
ever, the coarse footprint size of SCIAMACHY (60 × 40 km             Coastal Met (CM) station from September 2017 to June 2018
at nadir) can degrade this assumption due to a likely hetero-        to observe patterns in cloud-base height (CBH). In July, the
geneous cloud field sensed by the instrument. In this case, a        ceilometer was repositioned closer to the coastline (Swakop-
set of filters ensures the extraction of a representative cloud      mund). The CL31 emits a laser beam at 905 nm and pro-
sample from the unfiltered data record, discarding cirrus and        vides a profile of attenuated light backscatter with a verti-
multi-layer clouds. The procedure employed here is exten-            cal resolution of up to 5 m (Martucci et al., 2010; Kotthaus
sively described in Lelli and Vountas (2018) and 7 years             et al., 2016). It emits 214 laser pulses with a frequency of
(2003–2009) of retrievals at the SCIAMACHY overpass of               10 kHz every 2 s, after which it takes about 0.36 s of idle time
≈ 10:15 LT are aggregated monthly at a grid resolution of            to compute the cloud-base height (Vaisala CL31 firmware)
0.5◦ .                                                               (Kotthaus et al., 2016). CBH retrievals are then averaged to a
                                                                     temporal resolution of 1 min. This CL31 has a minimum de-
2.4   Ground-based measurements                                      tection altitude of ≈ 40 m and was located at ≈ 95 m a.s.l. at
                                                                     CM and is currently situated at ≈ 19 m a.s.l. at Swakop-
Overall, 3 years (2014–2017) of station measurements from
                                                                     mund. As such, the ceilometer cannot give an accurate esti-
the FogNet station network in the central Namib are used to
                                                                     mate for CBH < 135 m a.s.l. or 59 m, respectively. Here, data
gain insights into fog occurrence at the ground. As illustrated
                                                                     from 1 year (September 2017 to August 2018) are used. Due
in Fig. 1b, the FogNet network consists of 11 automated me-
                                                                     to data collection difficulties, no data are available during
teorological stations that are aligned in two transects (N–S
                                                                     February 2018. To focus on fog and low-level clouds, only
from 22.97 to 23.92◦ S and W–E from 14.46 to 15.31◦ E).
                                                                     CBH < 2000 m a.g.l. are considered.
FogNet was created as part of the Southern African Science
Service Centre for Climate Change and Adaptive Land Man-
agement (SASSCAL) initiative to study fog occurrence and
processes in this region (Kaspar et al., 2015). The stations         3     Results and discussion
can be broadly classified by their geographic location into
                                                                     3.1    Fog and low cloud spatial patterns and seasonality
low-lying coastal stations (blue circles in Fig. 1b): all stations
located < 100 m above sea level (a.s.l.); and inland stations
                                                                     Figure 2 shows climatological patterns of FLC occurrence
(red circles in Fig. 1b): all stations located > 300 m a.s.l.), as
                                                                     as seen by CALIPSO (Fig. 2a) and SEVIRI (Fig. 2b) using
well as a transition station (Kleinberg: KB).
                                                                     the algorithms developed by Cermak (2018) (land and ocean)
                                                                     and Andersen and Cermak (2018) (land only), respectively.

www.atmos-chem-phys.net/19/4383/2019/                                                 Atmos. Chem. Phys., 19, 4383–4392, 2019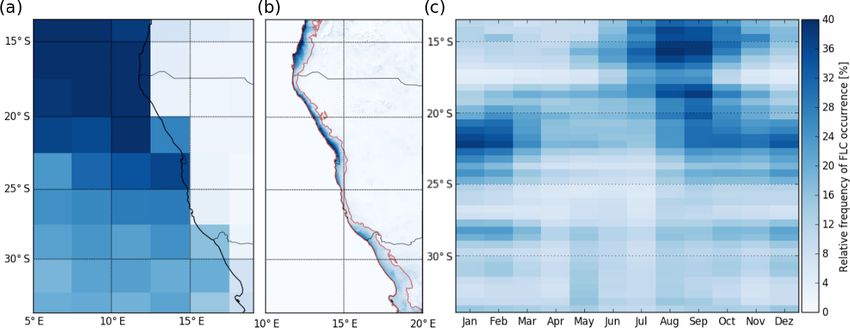
4386                                                                H. Andersen et al.: Spatiotemporal dynamics of Namib fog

Figure 2. A satellite-based climatology of relative fog and low cloud occurrence frequency derived by using the algorithms presented in
Cermak (2018) (a) and Andersen and Cermak (2018) (b), based on the nearly complete data records of CALIPSO (2006–2017) and SEVIRI
(2004–2017). Daytime and nighttime overpasses (approximately 13:00 and 01:00 UTC, respectively) are averaged to produce panel (a); all
SEVIRI time slots are used for panel (b). The seasonality (c) is computed by averaging pixels from panel (b) in coastal regions (maximum
100 km distance to coastline) with frequent FLC occurrence (minimum of 5 % relative FLC occurrence in the 14-year climatology shown in
panel b). The regions used for averaging in panel (c) lie within the red contours in panel (b).

The spatial patterns of FLC occurrence correspond well with           continental high-pressure systems as well as the Intertropical
those derived in earlier satellite-based studies (Olivier, 1995;      Convergence Zone combine to drive the observed seasonal
Cermak, 2012; Andersen and Cermak, 2018), where FLCs                  patterns of FLCs.
occur frequently over the ocean and in the low-lying coastal             The satellite-derived seasonal cycle of FLC occurrence
plains, with three separate core regions over land: the south-        agrees well qualitatively and quantitatively with the season-
ern parts of the Angolan coastline (15–17◦ S), the Namib-             ality of fog observed at inland stations (Fig. 3b). However,
ian coastline from Walvis Bay (≈ 23◦ S) northwards to 18◦ S           the observations do not show similar patterns at the coastal
and to a lesser extent at Alexander Bay at the Namibian–              stations (Fig. 3a). Here, satellite observations show a season-
South African border (≈ 28◦ S). While not studied here in             ality that resembles that found at inland stations, with a min-
detail, smaller spatial structures of FLC occurrence may be           imum during May and a maximum in September. In contrast,
influenced by local topography, e.g., by river valleys that can       ground-based fog observations at the coastal stations peak in
lead to a channeling of the inland flow and locally higher hu-        winter between April and August. This mismatch between
midity levels (Olivier, 1995). The general spatial patterns of        ground-based fog measurements and space-based FLC ob-
FLC occurrence (Fig. 2a, b) indicate a connection between             servations is also apparent when comparing earlier studies
the stratocumulus cloud field off the southwestern African            by Lancaster et al. (1984) and Cermak (2012). It should be
coastline and FLC occurrence in the Namib, even though the            noted that while the seasonal patterns disagree, during the
CALIPSO data are not able to capture some of the finer spa-           period from April to July, observed fog/FLC occurrence fre-
tial features in FLC distribution (e.g., the low-FLC region           quencies agree quantitatively (Fig. 3b). Both – similarities
between 17 and 18◦ S) due to the coarse averaging resolu-             and discrepancies of the observed seasonal cycles – are likely
tion. The occurrence of FLCs along the western coast of               explained in large parts by the seasonality in the vertical
southern Africa features a distinct seasonal cycle that varies        structure of FLCs in the central Namib (Fig. 3b). Cloud verti-
with latitude (Fig. 2c) and agrees with findings from Cermak          cal properties are investigated using ground-based and space-
(2012). The observed seasonal pattern of the Angolan Namib            based active sensoric measurements. A distinct seasonal pat-
agrees well with that of the southeastern Atlantic stratocu-          tern in CTH is observed using CALIPSO, with 183 m lower
mulus cloud field (Klein and Hartmann, 1993) and under-               cloud-top altitudes between April and June compared to the
scores a likely link of stratocumulus clouds over the ocean           rest of the year (significant at the 99 % confidence level: in-
and FLCs over land. The latitudinal dependence of the sea-            dependent t test). This seasonal pattern is also found in ob-
sonal patterns of FLCs may be an indication of a seasonal             servations of CBH of the CL31 ceilometer located in CM.
shift of the large-scale dynamical systems responsible for a          Here, cloud bases are found to be on average 130 m lower
landward advection of low clouds formed over the ocean. It is         between April and June than during the rest of the year. As
likely that the position and strength of the Atlantic and mid-        the ceilometer measurements are only available for 1 (in-

Atmos. Chem. Phys., 19, 4383–4392, 2019                                                 www.atmos-chem-phys.net/19/4383/2019/
H. Andersen et al.: Spatiotemporal dynamics of Namib fog                                                                             4387

Figure 3. Monthly averaged relative fog/FLC occurrence frequency at locations of coastal (a) and inland stations (b) as defined in Fig. 1b.
SEVIRI observations (2004–2017) are illustrated by grey bars; station measurements of ground fog (2015–2017) are in blue. (c) Medi-
ans, 25th and 75th percentiles of monthly averaged CBH and CTH in the central Namib based on SCIAMACHY (above ground level;
22.5–24.0◦ S and 14.25–15.5◦ E; 2003–2009) and CALIPSO (above sea level; 22.5–24.0◦ S and 14.0–15.5◦ E; 2006–2017) observations,
respectively. Ceilometer CBH observations (above sea level) are only available starting from September 2017. Ceilometer positions (Coastal
Met from September to June and Swakopmund in July and August) and sensitivity limits are illustrated by thin horizontal lines and described
in Sect. 2.4.

complete) year, 7-year monthly averaged CBH estimates                   are only considered if they are located within 100 km to the
from SCIAMACHY are considered in addition. While the                    coastline and feature a relative frequency of FLC occurrence
SCIAMACHY-derived CBH are especially low later in the                   of at least 5 %. It is apparent from Fig. 4a that the start of
year (June and July), the seasonal pattern agrees in the sense          the diurnal FLC cycle is closely related to the distance from
that it features lower CBH during the southern-hemispheric              the coastline, at least north of 25◦ S (r = 0.86 between 22.5
winter (CBH 173 m lower in June, July and August than dur-              and 25◦ S and r = 0.85 north of 22.5◦ S). As Andersen and
ing all other months, significant at the 95 % confidence level:         Cermak (2018) argue, this is a clear indication of a region
independent t test). It is likely that during this time, FLCs           dominated by advective processes rather than radiation fog,
touch the ground even at the low-lying coastal stations (lo-            contrasting findings from Kaseke et al. (2017). It should be
cated on average ≈ 40 m above sea level) frequently, leading            noted that while the results here are of statistical nature and
to the observed agreement between ground fog and satellite-             thus reflect the dominant patterns, incidences of radiation fog
based FLCs during this time (Fig. 3a). Between August and               are also likely to occur, at least in some locations. The ap-
March, cloud-base height is significantly higher on average             parent discrepancy between these findings might be related
and displays a higher variability, more frequently leading to           to the limited sampling of the isotope analyses or due to a
situations where clouds are disconnected from the surface at            mixing of water from marine and continental sources as wa-
the coast but still might touch the ground further inland, lead-        ter vapor from local sources is additionally condensed at the
ing to fog occurrences at stations located there (locations on          front of the advected cold marine stratus.
average ≈ 490 m above sea level).                                          More distinct spatial characteristics in the start time of the
                                                                        diurnal FLC cycle can be identified, as in the region between
3.2   Diurnal cycle of fog and low clouds                               22.5 and 25◦ S (circles in Fig. 4b), FLCs typically start to oc-
                                                                        cur more than 2 h later than in other regions along the south-
Based on the diurnally stable FLC detection by Andersen and             western African coastline. This temporal offset may be due
Cermak (2018), spatial information on the statistical proper-           to local advection patterns, as fog at the inland station Gob-
ties of the diurnal cycle of FLCs can be analyzed. Figure 4a            abeb (GB) has been found to be associated with northwest-
shows the average time of day when the FLC diurnal cycle                erly wind (Seely and Henschel, 1998), as opposed to a di-
typically starts. The start of the diurnal cycle is defined here        rect westerly advection from the coast. The timing of FLC
as the first occasion after the diurnal FLC minimum during              occurrence may also be locally modified by surface charac-
noon, when the relative FLC occurrence frequency reaches                teristics, e.g., increased surface roughness due to the coast-
10 % of the total range of its diurnal cycle at this location           parallel linear dunes of the Namib sand sea (≈ 100 m high;
and is derived from 14 years of SEVIRI observations. To                 Vermeesch et al., 2010) that may decelerate the inland advec-
focus on the regions where FLCs frequently occur, pixels                tion of FLCs.

www.atmos-chem-phys.net/19/4383/2019/                                                     Atmos. Chem. Phys., 19, 4383–4392, 2019
4388 H. Andersen et al.: Spatiotemporal dynamics of Namib fog
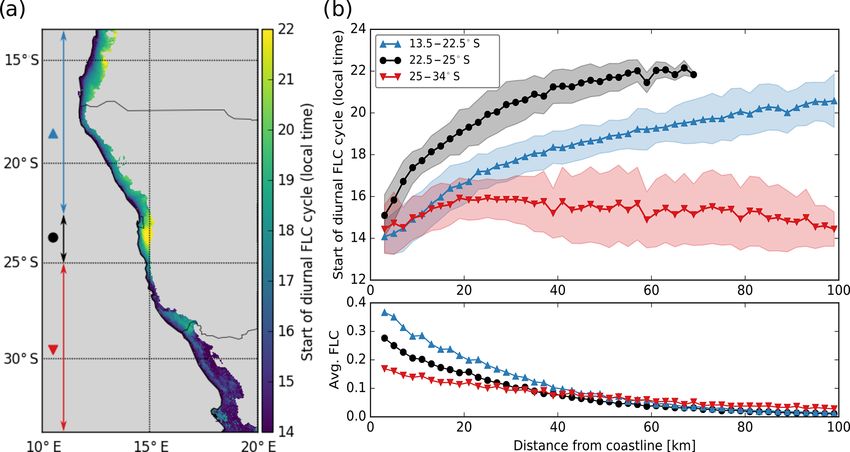
Figure 4. (a) The time of the start of the diurnal FLC cycle on pixel level. Pixels which are either more than 100 km removed from the
coastline or feature a relative frequency of FLC occurrence of less than 5 % are not considered. The north–south-oriented arrows indicate
the northern/southern extent of the three regions considered in panel (b), with colored markers illustrating their respective association.
(b) Upper panel: the average timing of start of the diurnal FLC cycle as a function of average distance to the coastline. Shaded area illustrates
mean ± 1 standard deviation. Lower panel: average relative FLC occurrence frequency in the three subregions. The same pixels are considered
as in panel (a) and are averaged in 2 km distance bins (x axis).
The differences in timing between the three subregions and in inland regions, where no relationship between dis-
in Fig. 4 are highly significant (99 % confidence level, two- tance from coastline and time of FLC occurrence is apparent,
sided t test). South of 25◦ S, the diurnal cycle of FLCs seems FLC occurrence is below 5 %. In these regions, assessments
to start earlier and to only depend on the distance to the coast- of the statistics of the diurnal cycle are limited by the over-
line up to a distance of ≈ 20 km (r = 0.42) and seems decou- all accuracy of the detection algorithm (97 %; Andersen and
pled from the coast further inland (r = −0.20). The region at Cermak, 2018), and the statistics of the diurnal cycle may
Alexander Bay seems to be an exception, where the diurnal be more susceptible to the influence of random misclassifi-
cycle of FLCs is similar to that of the northern regions. This cations. In general, the slope of the relationship illustrated
may be seen as a suggestion of subregional differences in the in Fig. 5a can be affected by the average advection speed,
mechanisms leading to FLC formation. The lower panel of the fraction of advective FLCs and the partial contribution of
Fig. 4b shows the average FLC occurrence frequency in the random misclassifications.
three subregions as a function of the distance to the coastline
that features a strong relationship, especially north of 25◦ S.
While this is a typical feature of coastal fog (e.g., Olivier, 4 Conclusions and outlook
1992), it serves as an additional indication that the region
south of 25◦ S is not influenced by marine air masses to the In this study, Namib-region fog and low-cloud patterns are
same extent as regions further north. analyzed based on data from multiple satellite sensors as well
Figure 5a shows the time of the start of the diurnal FLC cy- as station measurements.
cle between 22.5 and 25◦ S in two different time periods with FLC occurrence along the southwestern African coastline
contrasting vertical FLC characteristics. During the season is found to be highest close to the coastline and in general
of systematically higher-level FLCs (September–November: confined to the low-lying coastal plains. The seasonal cycle
high-FLC season), a distinct relationship between distance of satellite-derived FLC occurrence is found to have a dis-
from the coastline and the timing of FLC occurrence is ap- tinct latitudinal dependence. In the Angolan regions north of
parent up to about 60 km inland. During the time of lower- ≈ 17.5◦ S, FLC occurrence peaks between July and Octo-
level FLCs (April, May and June: low-FLC season), this re- ber, whereas in Namibia, between 20 and 25◦ S, FLCs occur
lationship is only apparent within ≈ 30 km of the coastline. It mostly between August and February. This pattern may be
should be noted that the overall FLC occurrence frequency is explained by a seasonal shift in the dynamic conditions that
also dependent on the distance from coastline (lower panel), led to the inland advection of marine low clouds. On sea-
sonal scales, the spatiotemporal FLC occurrence indicates a
Atmos. Chem. Phys., 19, 4383–4392, 2019 www.atmos-chem-phys.net/19/4383/2019/H. Andersen et al.: Spatiotemporal dynamics of Namib fog 4389
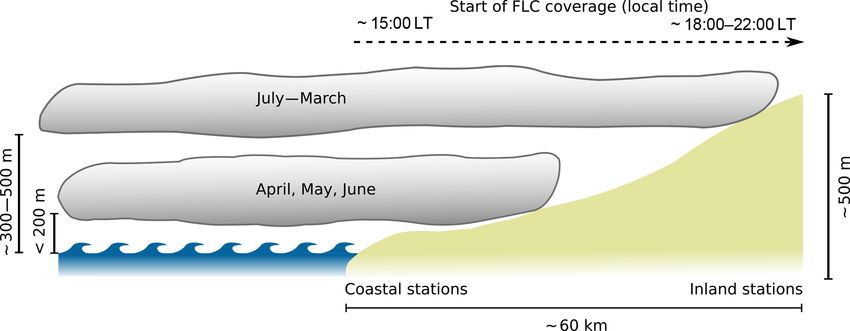
Figure 6. Schematic illustrating the observed seasonal cycle in
cloud vertical characteristics and the dependence of the diurnal FLC
cycle on the distance to the coastline.
Namib, the diurnal cycle of FLCs is found to start more than
2 h later than in most regions along the coastline. This may
be caused by local advection patterns of FLCs or could be
Figure 5. (a) Start of diurnal FLC cycle in the central Namib as due changes in surface roughness associated with the coast-
a function of distance from the coastline. Two different seasons parallel dunes of the Namib sand sea. The key findings re-
are shown: high-FLC season (September, October and November) garding the seasonal and diurnal patterns of FLCs are sum-
and low-FLC season (April, May and June). Shaded area illustrates marized schematically in Fig. 6 and lead to a more complete
mean ± 1 standard deviation. (b) Average relative FLC occurrence
view on Namib-region FLCs. The results of this study high-
frequency in the two seasons. The same pixels are considered as in
light the advantages of combining ground- and space-based
panel (a) and averaged in 2 km distance bins (x axis).
(active and passive sensoric) measurements.
The interplay of large-scale dynamics with thermally and
topographically induced local winds (Tyson and Seely, 1980;
connection to the southeastern Atlantic stratocumulus cloud Olivier, 1992, and sources therein), (sea) surface characteris-
deck. As such, process knowledge from studies on the heav- tics (Olivier, 1995), radiative transfer and aerosols is likely
ily investigated stratocumulus clouds in this region (e.g., to explain fog and low cloud occurrence and variability in
Adebiyi and Zuidema, 2018; Andersen and Cermak, 2015; the Namib desert. The exact manner, however, by which the
Diamond et al., 2018; Fuchs et al., 2017, 2018; Gordon et al., various processes determine this complex system and its ob-
2018; Painemal et al., 2014; Yuter et al., 2018) may be appli- served spatiotemporal dynamics is still unclear. Future re-
cable to Namib-region FLCs, and vice versa. search is thus needed to more fully understand the processes
Satellite-derived seasonal patterns of FLCs are compared that lead to the variability in spatial patterns, overall cover-
to ground-based measurements of fog occurrence from the age, vertical structure and life cycle of FLCs, as well their
FogNet stations in the central Namib. While the seasonal capacity to serve as a water source for ecosystems. Within
patterns agree qualitatively and quantitatively for inland the ongoing research project Namib Fog Life Cycle Anal-
stations, they feature contrasting patterns at coastal sta- ysis (NaFoLiCA), these aspects are currently studied using
tions. This can likely be explained by seasonal patterns a combination of satellite data, ground-based measurements
in cloud-base altitude that determine whether a low-level and numerical models.
cloud touches the ground (fog) or not. Observations from
CALIPSO and SCIAMACHY suggest that, on average,
clouds in coastal regions seem to be disconnected from Code and data availability. Code and data are available from the
the surface more frequently between August and Febru- corresponding author upon reasonable request.
ary, where the satellite observations strongly overestimate
station-measured ground-fog occurrence.
Coherent spatial patterns of the diurnal cycle of FLC oc-
currence in the Namib could be observed for the first time
using the algorithm developed by Andersen and Cermak
(2018). Generally, the timing of FLC occurrence seems to
be tightly connected to the proximity of the coastline, where
the diurnal cycle of FLCs starts systematically earlier at the
coast than further inland. This is a strong indication for a
dominant role of advection for the climatological patterns of
FLCs in the region, contrasting the interpretation of findings
from isotope analyses by Kaseke et al. (2017). In the central
www.atmos-chem-phys.net/19/4383/2019/ Atmos. Chem. Phys., 19, 4383–4392, 20194390 H. Andersen et al.: Spatiotemporal dynamics of Namib fog Appendix A: List of acronyms A1 Station abbreviations Aussinanis AU (inland station) Coastal Met CM (coastal station) Conception Water CW (coastal station) Garnet Koppie GK (inland station) Gobabeb Met GB (inland station) Kleinberg KB (transition station) Marble Koppie MK (inland station) Saltworks SW (coastal station) Sophies Hoogte SH (inland station) Station 8 S8 (inland station) Vogelfederberg VF (inland station) A2 General acronyms a.g.l. Above ground level a.s.l. Above sea level CALIOP Cloud-Aerosol Lidar with Orthogonal Polarization CALIPSO Cloud-Aerosol Lidar and Infrared Pathfinder Satellite Observation CBH Cloud-base height COT Cloud optical thickness CTH Cloud-top height FLCs Fog and low clouds MSG Meteosat Second Generation SACURA Semi-Analytical CloUd Retrieval Algorithm SCIAMACHY Scanning Imaging Absorption Spectrometer for Atmospheric Chartography SEVIRI Spinning Enhanced Visible and Infrared Imager SASSCAL Southern African Science Service Centre for Climate Change and Adaptive Land Management Atmos. Chem. Phys., 19, 4383–4392, 2019 www.atmos-chem-phys.net/19/4383/2019/
H. Andersen et al.: Spatiotemporal dynamics of Namib fog                                                                              4391

Author contributions. HA and JC had the idea for the analysis. HA       mos. Meas. Tech., 11, 5461–5470, https://doi.org/10.5194/amt-
obtained and analyzed most of the data sets, conducted the original     11-5461-2018, 2018.
research and wrote the manuscript. IS and LL contributed to data      Azúa-Bustos, A., González-Silva, C., Mancilla, R. A., Salas,
analysis, and RV provided the quality controlled FogNet data. JC,       L., Gómez-Silva, B., McKay, C. P., and Vicuña, R.: Hy-
IS, LL and RV contributed manuscript preparation and the interpre-      polithic Cyanobacteria Supported Mainly by Fog in the Coastal
tation of findings.                                                     Range of the Atacama Desert, Microb. Ecol., 61, 568–581,
                                                                        https://doi.org/10.1007/s00248-010-9784-5, 2011.
                                                                      Bovensmann, H., Burrows, J. P., Buchwitz, M., Frerick, J., Noël,
Competing interests. The authors declare that they have no conflict     S., Rozanov, V. V., Chance, K. V., and Goede, A. P. H.:
of interest.                                                            SCIAMACHY: Mission objectives and measurement modes,
                                                                        J. Atmos. Sci., 56, 127–150, https://doi.org/10.1175/1520-
                                                                        0469(1999)0562.0.CO;2, 1999.
Special issue statement. This article is part of the special issue    Cermak, J.: Low clouds and fog along the South-Western African
“New observations and related modelling studies of the aerosol–         coast – Satellite-based retrieval and spatial patterns, Atmos. Res.,
cloud–climate system in the Southeast Atlantic and southern Africa      116, 15–21, https://doi.org/10.1016/j.atmosres.2011.02.012,
regions (ACP/AMT inter-journal SI)”. It is not associated with a        2012.
conference.                                                           Cermak, J.: Fog and low cloud frequency and properties from
                                                                        active-sensor satellite data, Remote Sens.-Basel, 10, 1–7,
                                                                        https://doi.org/10.3390/rs10081209, 2018.
                                                                      Diamond, M. S., Dobracki, A., Freitag, S., Small Griswold, J.
Acknowledgements. Funding for this study was provided by
                                                                        D., Heikkila, A., Howell, S. G., Kacarab, M. E., Podolske, J.
Deutsche Forschungsgemeinschaft (DFG) in the project Namib
                                                                        R., Saide, P. E., and Wood, R.: Time-dependent entrainment of
Fog Life Cycle Analysis (NaFoLiCA), CE 163/7-1. Luca Lelli
                                                                        smoke presents an observational challenge for assessing aerosol–
has been financially supported by the European Space Agency
                                                                        cloud interactions over the southeast Atlantic Ocean, Atmos.
(ESA) via the Living Planet Fellowship for the STARCLINT
                                                                        Chem. Phys., 18, 14623–14636, https://doi.org/10.5194/acp-18-
(STatistics of AeRosol and CLoud INTeractions) project and by
                                                                        14623-2018, 2018.
the German Science Foundation (DFG) in the framework of the
                                                                      Ebner, M., Miranda, T., and Roth-Nebelsick, A.: Effi-
Transregional Collaborative Project TR 172 AC3 (ArctiC Am-
                                                                        cient fog harvesting by Stipagrostis sabulicola (Namib
plification: Climate relevant Atmospheric and surfaCe processes
                                                                        dune bushman grass), J. Arid Environ., 75, 524–531,
and feedback mechanisms). We acknowledge support by the
                                                                        https://doi.org/10.1016/j.jaridenv.2011.01.004, 2011.
KIT-Publication Fund of the Karlsruhe Institute of Technology. The
                                                                      Eckardt, F., Soderberg, K., Coop, L., Muller, A., Vickery, K.,
authors would like to thank the Gobabeb Research and Training
                                                                        Grandin, R., Jack, C., Kapalanga, T., and Henschel, J.: The nature
Centre for access to the station measurements and gratefully
                                                                        of moisture at Gobabeb, in the central Namib Desert, J. Arid En-
acknowledge the Gobabeb maintenance team for their efforts
                                                                        viron., 93, 7–19, https://doi.org/10.1016/j.jaridenv.2012.01.011,
in the field. We thank Mary Seely for her contributions in the
                                                                        2013.
development of FogNet. The valuable comments of two anony-
                                                                      Frumau, K. F., Burkard, R., Schmid, S., Bruijnzeel, L. A., To-
mous reviewers and the co-editor helped improve the original paper.
                                                                        bón, C., and Calvo-Alvarado, J. C.: A comparison of the per-
                                                                        formance of three types of passive fog gauges under conditions
The article processing charges for this open-access
                                                                        of wind-driven fog and precipitation, Hydrol. Process., 25, 374–
publication were covered by a Research
                                                                        383, https://doi.org/10.1002/hyp.7884, 2011.
Centre of the Helmholtz Association.
                                                                      Fuchs, J., Cermak, J., Andersen, H., Hollmann, R., and Schwarz, K.:
                                                                        On the Influence of Air Mass Origin on Low-Cloud Properties in
                                                                        the Southeast Atlantic, J. Geophys. Res.-Atmos., 122, 11076–
Review statement. This paper was edited by Frank Eckardt and re-        11091, https://doi.org/10.1002/2017JD027184, 2017.
viewed by Stephanie Westerhuis and Jana Olivier.                      Fuchs, J., Cermak, J., and Andersen, H.: Building a cloud in
                                                                        the southeast Atlantic: understanding low-cloud controls based
                                                                        on satellite observations with machine learning, Atmos. Chem.
                                                                        Phys., 18, 16537–16552, https://doi.org/10.5194/acp-18-16537-
References                                                              2018, 2018.
                                                                      Gordon, H., Field, P. R., Abel, S. J., Dalvi, M., Grosvenor, D. P.,
Adebiyi, A. A. and Zuidema, P.: Low cloud cover sensitivity to          Hill, A. A., Johnson, B. T., Miltenberger, A. K., Yoshioka, M.,
  biomass-burning aerosols and meteorology over the southeast           and Carslaw, K. S.: Large simulated radiative effects of smoke in
  Atlantic, J. Climate, 2, 4329–4346, https://doi.org/10.1175/JCLI-     the south-east Atlantic, Atmos. Chem. Phys., 18, 15261–15289,
  D-17-0406.1, 2018.                                                    https://doi.org/10.5194/acp-18-15261-2018, 2018.
Andersen, H. and Cermak, J.: How thermodynamic en-                    Juvik, J. O. and Nullet, D.: Comments on “A Proposed Stan-
  vironments control stratocumulus microphysics and in-                 dard Fog Collector for Use in High-Elevation Regions”, J.
  teractions with aerosols, Environ. Res. Lett., 10, 24004,             Appl. Meteorol., 34, 2108–2110, https://doi.org/10.1175/1520-
  https://doi.org/10.1088/1748-9326/10/2/024004, 2015.                  0450(1995)0342.0.CO;2, 1995.
Andersen, H. and Cermak, J.: First fully diurnal fog and low
  cloud satellite detection reveals life cycle in the Namib, At-

www.atmos-chem-phys.net/19/4383/2019/                                                   Atmos. Chem. Phys., 19, 4383–4392, 2019
4392 H. Andersen et al.: Spatiotemporal dynamics of Namib fog Kaseke, K. F., Wang, L., and Seely, M. K.: Nonrainfall water origins Olivier, J.: Spatial distribution of fog in the Namib, J. Arid Environ., and formation mechanisms, Science Advances, 3, e1603131, 29, 129–138, https://doi.org/10.1016/S0140-1963(05)80084-9, https://doi.org/10.1126/sciadv.1603131, 2017. 1995. Kaseke, K. F., Tian, C., Wang, L., Seely, M., Vogt, R., Wassenaar, Olivier, J. and Stockton, P. L.: The influence of upwelling extent T., and Mushi, R.: Fog spatial distributions over the central namib upon fog incidence at Lüderitz, southern Africa, Int. J. Climatol., desert – An isotope approach, Aerosol Air Qual. Res., 18, 49–61, 9, 69–75, https://doi.org/10.1002/joc.3370090106, 1989. https://doi.org/10.4209/aaqr.2017.01.0062, 2018. Painemal, D., Kato, S., and Minnis, P.: Boundary layer reg- Kaspar, F., Helmschrot, J., Mhanda, A., Butale, M., de Clercq, W., ulation in the southeast Atlantic cloud microphysics during Kanyanga, J. K., Neto, F. O. S., Kruger, S., Castro Matsheka, M., the biomass burning season as seen by the A-train satel- Muche, G., Hillmann, T., Josenhans, K., Posada, R., Riede, J., lite constellation, J. Geophys. Res.-Atmos., 119, 11288–11302, Seely, M., Ribeiro, C., Kenabatho, P., Vogt, R., and Jürgens, N.: https://doi.org/10.1002/2014JD022182, 2014. The SASSCAL contribution to climate observation, climate data Roth-Nebelsick, A., Ebner, M., Miranda, T., Gottschalk, V., Voigt, management and data rescue in Southern Africa, Adv. Sci. Res., D., Gorb, S., Stegmaier, T., Sarsour, J., Linke, M., and Konrad, 12, 171–177, https://doi.org/10.5194/asr-12-171-2015, 2015. W.: Leaf surface structures enable the endemic Namib desert Klein, S. A. and Hartmann, D. L.: The Sea- grass Stipagrostis sabulicola to irrigate itself with fog water, sonal Cycle of Low Stratiform Clouds, J. Cli- J. Roy. Soc., 9, 1965–74, https://doi.org/10.1098/rsif.2011.0847, mate, 6, 1587–1606, https://doi.org/10.1175/1520- 2012. 0442(1993)0062.0.CO;2, 1993. Rozanov, V. V. and Kokhanovsky, A. A.: Semianalytical cloud re- Kotthaus, S., O’Connor, E., Münkel, C., Charlton-Perez, C., Haef- trieval algorithm as applied to the cloud top altitude and the cloud felin, M., Gabey, A. M., and Grimmond, C. S. B.: Recommenda- geometrical thickness determination from top-of-atmosphere re- tions for processing atmospheric attenuated backscatter profiles flectance measurements in the oxygen A band, J. Geophys. Res., from Vaisala CL31 ceilometers, Atmos. Meas. Tech., 9, 3769– 109, 4070, https://doi.org/10.1029/2003JD004104, 2004. 3791, https://doi.org/10.5194/amt-9-3769-2016, 2016. Schmetz, J., Pili, P., Tjemkes, S., Just, D., Kerkmann, J., Lancaster, J., Lancaster, N., and Seely, M. K.: Climate of the central Rota, S., and Ratier, A.: An Introduction to Meteosat Sec- Namib desert, Madoqua, 14, 5–61, 1984. ond Generation (MSG), B. Am. Meteorol. Soc., 83, 977–992, Lelli, L. and Vountas, M.: Chapter 5 – Aerosol and Cloud Bot- https://doi.org/10.1175/BAMS-83-7-Schmetz-1, 2002. tom Altitude Covariations From Multisensor Spaceborne Mea- Seely, M. K.: Irregular fog as a water source for desert dune beetles, surements, in: Remote Sensing of Aerosols, Clouds, and Pre- Oecologia, 42, 213–227, https://doi.org/10.1007/BF00344858, cipitation, edited by: Islam, T., Hu, Y., Kokhanovsky, A., and 1979. Wang, J., pp. 109–127, Elsevier, Amsterdam, the Netherlands, Seely, M. K. and Henschel, J. R.: The Climatology of Namib Fog, https://doi.org/10.1016/B978-0-12-810437-8.00005-0, 2018. Proceedings, First International Conference on Fog and Fog Col- Lelli, L., Kokhanovsky, A. A., Rozanov, V. V., and Bur- lection, Vancouver, Canada, 353–356, 1998. rows, J. P.: Radiative transfer in the oxygen A-band Seely, M. K., De-Vos, M. P., and Louw, G. N.: Fog imbibition satel- and its application to cloud remote sensing, Atti Acc. lite fauna and unusual leaf structure in a namib desert dune plant Pel. Per. (AAPP), 89, C1V89S1P056–1–C1V89S1P056–4, trianthema hereroensis, S. Afr. J. Sci., 73, 169–172, 1977. https://doi.org/10.1478/C1V89S1P056, 2011. Shanyengana, E.: Exploring fog as a supplementary wa- Lelli, L., Kokhanovsky, A. A., Rozanov, V. V., Vountas, M., Sayer, ter source in Namibia, Atmos. Res., 64, 251–259, A. M., and Burrows, J. P.: Seven years of global retrieval of cloud https://doi.org/10.1016/S0169-8095(02)00096-0, 2002. properties using space-borne data of GOME, Atmos. Meas. Tyson, P. D. and Seely, M. K.: Local winds over Tech., 5, 1551–1570, https://doi.org/10.5194/amt-5-1551-2012, the central Namib, S. Afr. Geogr. J., 62, 135–150, 2012. https://doi.org/10.1080/03736245.1980.10559630, 1980. Lelli, L., Kokhanovsky, A. A., Rozanov, V. V., Vountas, M., and Vermeesch, P., Fenton, C. R., Kober, F., Wiggs, G. F., Bristow, Burrows, J. P.: Linear trends in cloud top height from passive ob- C. S., and Xu, S.: Sand residence times of one million years in servations in the oxygen A-band, Atmos. Chem. Phys., 14, 5679– the Namib Sand Sea from cosmogenic nuclides, Nat. Geosci., 3, 5692, https://doi.org/10.5194/acp-14-5679-2014, 2014. 862–865, https://doi.org/10.1038/ngeo985, 2010. Martucci, G., Milroy, C., and O’Dowd, C. D.: Detection Wiegner, M., Mattis, I., Pattantyús-Ábrahám, M., Bravo-Aranda, of cloud-base height using Jenoptik CHM15K and Vaisala J. A., Poltera, Y., Haefele, A., Hervo, M., Görsdorf, U., Lein- CL31 ceilometers, J. Atmos. Ocean. Tech., 27, 305–318, weber, R., Gasteiger, J., Haeffelin, M., Wagner, F., Cermak, https://doi.org/10.1175/2009JTECHA1326.1, 2010. J., Komínková, K., Brettle, M., Münkel, C., and Pönitz, K.: McHugh, T. A., Morrissey, E. M., Reed, S. C., Hungate, B. A., Aerosol backscatter profiles from ceilometers: validation of wa- and Schwartz, E.: Water from air: An overlooked source of ter vapor correction in the framework of CeiLinEx2015, Atmos. moisture in arid and semiarid regions, Sci. Rep.-UK, 5, 1–6, Meas. Tech., 12, 471–490, https://doi.org/10.5194/amt-12-471- https://doi.org/10.1038/srep13767, 2015. 2019, 2019. Nagel, J. F.: Fog Precipitation at Swakopmund, South African Yuter, S. E., Hader, J. D., Miller, M. A., and Mechem, Weather Bureau Newsletter, 125, 1–9, 1959. D. B.: Abrupt cloud clearing of marine stratocumulus in Olivier, J.: Some spatial and temporal aspects of fog in the Namib, the subtropical southeast Atlantic, Science, 361, 697–701, South African Geographer, 19, 106–126, 1992. https://doi.org/10.1126/science.aar5836, 2018. Atmos. Chem. Phys., 19, 4383–4392, 2019 www.atmos-chem-phys.net/19/4383/2019/
You can also read