Modification of a SERS-active Ag surface to promote adsorption of charged analytes: effect of Cu2+ ions
←
→
Page content transcription
If your browser does not render page correctly, please read the page content below
Modification of a SERS-active Ag surface to promote
adsorption of charged analytes: effect of Cu2+ ions
Bahdan V. Ranishenka1, Andrei Yu. Panarin2, Irina A. Chelnokova3, Sergei N. Terekhov2,
Peter Mojzes4 and Vadim V. Shmanai*1

  Full Research Paper                                                                                                              Open Access

  Address:                                                                Beilstein J. Nanotechnol. 2021, 12, 902–912.
  1Institute of Physical Organic Chemistry, National Academy of           https://doi.org/10.3762/bjnano.12.67
  Sciences of Belarus, 13 Surganova Str., Minsk, 220072, Belarus,
  2B. I. Stepanov Institute of Physics, National Academy of Sciences of   Received: 23 March 2021
  Belarus, 68 Nezavisimosti Ave., 220072, Minsk, Belarus, 3Institute of   Accepted: 27 July 2021
  Radiobiology of NAS of Belarus, Feduninskogo st., 4, 246007, Gomel,     Published: 16 August 2021
  Belarus and 4Institute of Physics, Charles University, Ke Karlovu 5,
  CZ-121 16 Prague 2, Czech Republic                                      Associate Editor: A. J. Meixner

  Email:                                                                  © 2021 Ranishenka et al.; licensee Beilstein-Institut.
  Vadim V. Shmanai* - v.shmanai@gmail.com                                 License and terms: see end of document.

  * Corresponding author

  Keywords:
  electrostatic interaction; oligonucleotides; porphyrin; silver
  nanoparticles; substrate modification; surface-enhanced Raman
  spectroscopy (SERS)

Abstract
This work studies the impact of the electrostatic interaction between analyte molecules and silver nanoparticles (Ag NPs) on the in-
tensity of surface-enhanced Raman scattering (SERS). For this, we fabricated nanostructured plasmonic films by immobilization of
Ag NPs on glass plates and functionalized them by a set of differently charged hydrophilic thiols (sodium 2-mercaptoethyl
sulfonate, mercaptopropionic acid, 2-mercaptoethanol, 2-(dimethylamino)ethanethiol hydrochloride, and thiocholine) to vary the
surface charge of the SERS substrate. We used two oppositely charged porphyrins, cationic copper(II) tetrakis(4-N-methylpyridyl)
porphine (CuTMpyP4) and anionic copper(II) 5,10,15,20-tetrakis(4-sulfonatophenyl)porphine (CuTSPP4), with equal charge value
and similar structure as model analytes to probe the SERS signal. Our results indicate that the SERS spectrum intensity strongly, up
to complete signal disappearance, correlates with the surface charge of the substrate, which tends to be negative. Using the data ob-
tained and our model SERS system, we analyzed the modification of the Ag surface by different reagents (lithium chloride, poly-
ethylenimine, polyhexamethylene guanidine, and multicharged metal ions). Finally, all those surface modifications were tested
using a negatively charged oligonucleotide labeled with Black Hole Quencher dye. Only the addition of copper ions into the analyte
solution yielded a good SERS signal. Considering the strong interaction of copper ions with the oligonucleotide molecules, we
suppose that inversion of the analyte charge played a key role in this case, instead of a change of charge of the substrate surface.
Changing the charge of analytes could be a promising way to get clear SERS spectra of negatively charged molecules on Ag SERS-
active supports.

                                                                                                                                            902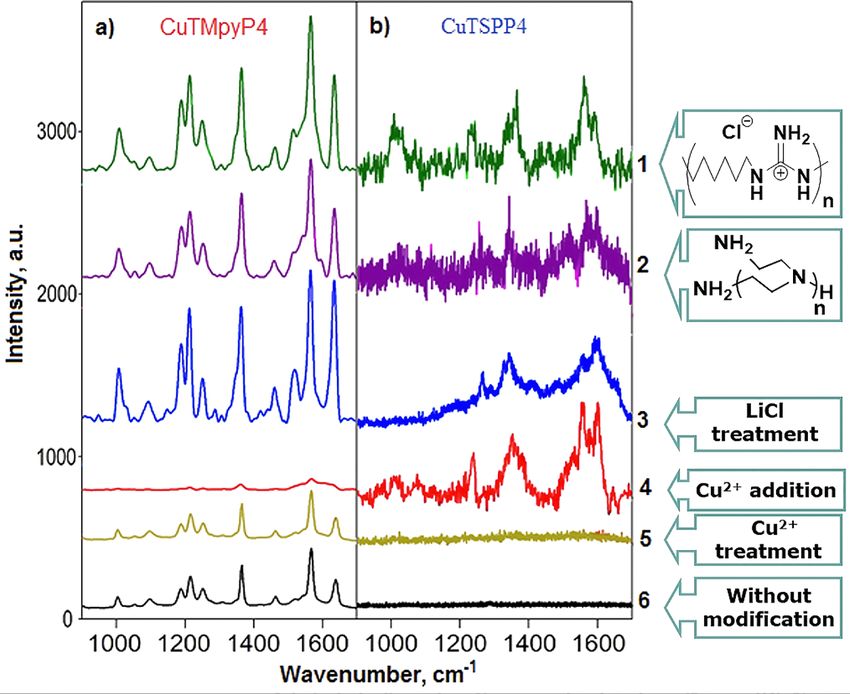
Beilstein J. Nanotechnol. 2021, 12, 902–912.

Introduction
Surface-enhanced Raman scattering (SERS) with its advan-               adsorbed at the plasmonic metal surfaces and located at the “hot
tages of extreme sensitivity, high selectivity, and non-destruc-       spots”. The detection of analytes that are not interacting with
tive nature has demonstrated great potential for the quick detec-      (or adsorbing to) plasmonic surfaces remains an important prac-
tion of chemicals in different samples [1]. It became popular in       tical task. This problem significantly hampers a wider practical
the scientific community during the last decades due to great          application of SERS because even optimally fabricated SERS
prospects for practical solutions of, particularly, analytical prob-   substrates lose their effectiveness when the analyte molecules
lems [2]. However, despite the promising potential, it turned out      cannot access the “hot spots”. To address this problem, various
that a lot of practical, theoretical, and even technical tasks need    techniques have been developed to capture non-adsorbing mole-
to be solved for practical applications of the method [2-4].           cules on SERS-active surfaces [3,18-20].

Raman signal surface enhancement uses so-called SERS-active            Among various plasmonic materials, silver SERS substrates
substrates that are mainly inorganic or hybrid nanostructured          provide the strongest Raman enhancement for the same struc-
materials. Significant attention has been devoted to the develop-      ture [8] and are therefore promising for wide practical applica-
ment of formation methods of metallic NP arrays with control-          tion. At the same time, Ag is much more chemically active than
lable parameters such as size, shape, interparticle distance, and      the widely used Au. Consequently, the use of the correspond-
ordering degree [5-12], with a focus on plasmonic structures           ing Ag-based SERS-active systems is complicated by addition-
with a high density of “hot spots”. Due to the progress in nano-       al chemical processes. The most exciting example is the influ-
technology, a large number of highly sensitive SERS substrates         ence of halide ions on the SERS signal. It is due to the high
has been synthesized [1,13].                                           binding energy of Ag with halides, which is also responsible for
                                                                       the low solubility of Ag halides in water. The SERS activation
The design of SERS substrates commonly aims at maximizing              of cationic analytes was observed in a number of studies after
the plasmonic effect of Raman enhancement. There are two               treatment of nanoparticles with halide ions [21-24]. The unusual
generally recognized mechanisms responsible for the SERS en-           effect that lithium chloride gives stronger SERS signal enhance-
hancement, namely electromagnetic enhancement (EM) and                 ment than other alkali metal halides was reported as well [23].
chemical enhancement (CE) [14,15]. The basic mechanism is              Also, the almost complete absence of the SERS signal of
EM through localized surface plasmon resonances (LSPRs) on             positively charged and neutral analytes (crystal violet and
the metal surface [16]. CE is at least two orders of magnitude         9-aminoacridine) was reported for nanomaterials that were pre-
weaker than EM. The CE mechanism is supposed to be caused              pared in the absence of halides [22].
by a charge transfer between the plasmonic surface and the
chemically adsorbed analyte molecules, which introduces new            It should be noted that the role of halide ions in the SERS acti-
states in the electronic structure of the metal–adsorbate com-         vation of Ag-based substrates is not yet fully clarified. A
plex leading to an increase in the Raman scattering cross section      possible explanation could be their effect on the electrostatic
of the analyte [17]. Consequently, the CE mechanism should be          interaction between analyte molecules and the surface of the Ag
accompanied by a change of spectral properties of the analyte,         NPs. Literature analysis reveals that many authors use cationic
which was not observed in this study. Thus, we suppose EM is           organic dyes as SERS probing analytes [18,25]. In contrast,
dominating in our work.                                                practically interesting biological molecules are mostly nega-
                                                                       tively charged. In 2015, the authors of [18] pointed out a possi-
Since the LSPR-enhanced electromagnetic field decays expo-             bility to prepare positively charged Ag NPs to analyze anionic
nentially with the distance from the metal surface, the analyte        analytes, which are hardly detectable by the Ag NPs prepared
molecules should be located near the surface of the SERS sub-          by common protocols. They used thiocholine to create a strong
strate to achieve maximum enhancement. However, close prox-            positive charge on the Ag NP surface. However, the solution of
imity is not optimal because of possible quantum tunneling             the charge problem was not so simple because citrate ions,
effects [2]. The SERS in the “hot spots” suffers from those            which are used in many common protocols, caused aggregation
undesired effects even more because the analyte molecules have         of the resulting positively charged Ag NPs. Nevertheless, the
to be localized in a small volume in gaps between the NPs [4].         proposed approach enabled the successful analysis of a number
Thus, a principal challenge in using SERS for sensitive and            of negatively charged analytes. Silver NPs treated with poly-
nondestructive detection is to localize the molecules of interest      ethylenimine, spermine, or spermidine were successfully used
at the plasmonic surface but at a proper distance (2–4 nm) [2,4].      for the detection of negatively charged oligonucleotides [19].
It is a common practice to demonstrate the SERS effectivity of         Finally, recent work [20] demonstrates the detection of anionic
a SERS-active substrate by using analytes that are strongly            analytes by addition of multicharged metal cations. The above-

                                                                                                                                        903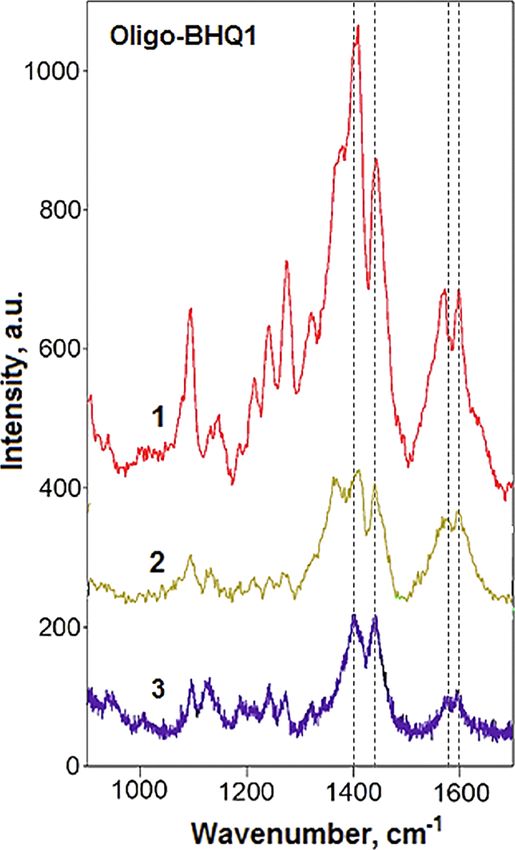
Beilstein J. Nanotechnol. 2021, 12, 902–912.
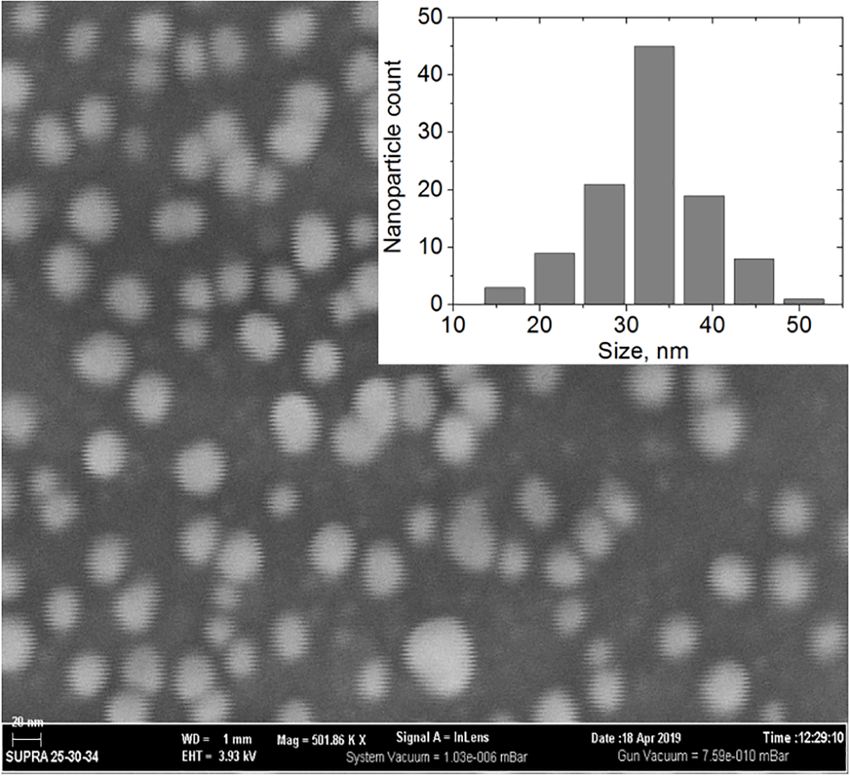
mentioned papers devoted to the chemical SERS activation of particles and is therefore less reliable. Both methods give NP
silver-based substrates, with the exception of [23,24], described diameters in the interval of 30–35 nm. According to the SEM
colloidal NPs. The work [20] reports the absence of NP aggre- image, the NPs are mostly spherical with an average diameter
gation in the presence of multicharged metal ions. Considering of 33 nm. SEM and TEM images demonstrate a similar size dis-
the strong tendency of multicharged ions to destabilize colloidal tribution. Hence, we conclude that no NP size selection occurs
systems [26-28] even at low concentrations, this observation is during their adsorptive immobilization. The absorption spec-
surprising. It should be noted that it is difficult to control the trum of the Ag NPs (Figure S2, Supporting Information File 1)
aggregation of NPs in colloidal substrates, which can occur is in good agreement with electron microscopy and literature
even in the absence of any additives. SERS signals from aggre- [30].
gates due to the creation of “hot spots” can be orders of magni-
tude higher than the signal from the non-aggregated NPs [2,4].
Thus, even a small amount of the aggregates that is not visible
in the absorption spectra of the solution can lead to a signifi-
cant increase of the SERS intensity, obscuring the effect of
functionalization of the NP surfaces. In contrast, solid sub-
strates exhibit improved reproducibility of the SERS enhance-
ment and provide the exact location of the target molecules,
which makes it possible to exploit different techniques of func-
tionalization.
To avoid different effects related to the aggregation of NPs we
used Ag NPs immobilized by adsorption as a convenient and
reproducible SERS substrate for the investigation of the chemi-
cal treatment of the Ag surface with different reagents. To study
the electrostatic interaction with an analyte and exclude factors
caused by complex specific interactions with the Ag surface, we
used a set of organic thiols with differently charged functional
groups and similar linker length. Additionally, we checked pre- Figure 1: SEM image of Ag NPs and the corresponding size distribu-
viously reported approaches on the surface modification of Ag tion histogram. For SEM imaging Ag NPs were deposited onto a PEI-
modified silicon conductive support by adsorptive immobilization.
(polymers, lithium chloride, and multicharged metal ions) to
improve the SERS signal of substrates (our preliminary results
have been described in [29]). Finally, we applied the obtained Immobilization of Ag NPs on a glass surface
results to detect oligonucleotide molecules and showed that the Utilizing glass slides for the preparation of SERS substrates
addition of Cu2+ ions into the analyte leads to a good SERS permitted us to use siloxane chemistry to modify the surface
signal. and to control the immobilization process via the absorption
spectra. Glass also minimizes additional effects related to SERS
Results and Discussion enhancement due to energy transfer to the support, which might
Characterization of silver nanostructures occur when conductive or semi-conductive materials are used
We synthesized Ag NPs with a size appropriate for SERS inves- [31]. The immobilization of Ag NPs from sodium citrate solu-
tigations (30–35 nm) with a relatively high NP concentration tion was possible due to the poor adsorption of citrate ions on
(32 µg/mL) sufficient for good immobilization. Size and shape the Ag surface, which leads to a high immobilization efficiency.
of the NPs were analyzed from SEM and TEM images. To The sodium citrate concentration (2.5 mM) was adjusted to
achieve a better resolution during SEM, we utilized a conduc- obtain a maximal NP surface filling and, at the same time, to
tive silicon support and excluded the metal coating of the sam- avoid NP aggregation caused by high salt concentration.
ple; Ag NPs were placed on the silicon surface by adsorptive
immobilization to avoid aggregation during solvent evapora- Figure 2 shows absorption spectra of the polyethylenimine
tion. (PEI)-modified glass support (slide) depending on the time of
contact with Ag NPs. The maximum absorption value stabilizes
Figure 1 shows an SEM image of the NPs as well as the corre- after approximately 12 h with a shift from 412 to 427 nm. We
sponding size distribution histogram. A similar TEM image suppose that the redshift of the absorption maximum is due to
(Figure S1, Supporting Information File 1) shows fewer nano- the plasmon interactions of the closely packed NPs.
904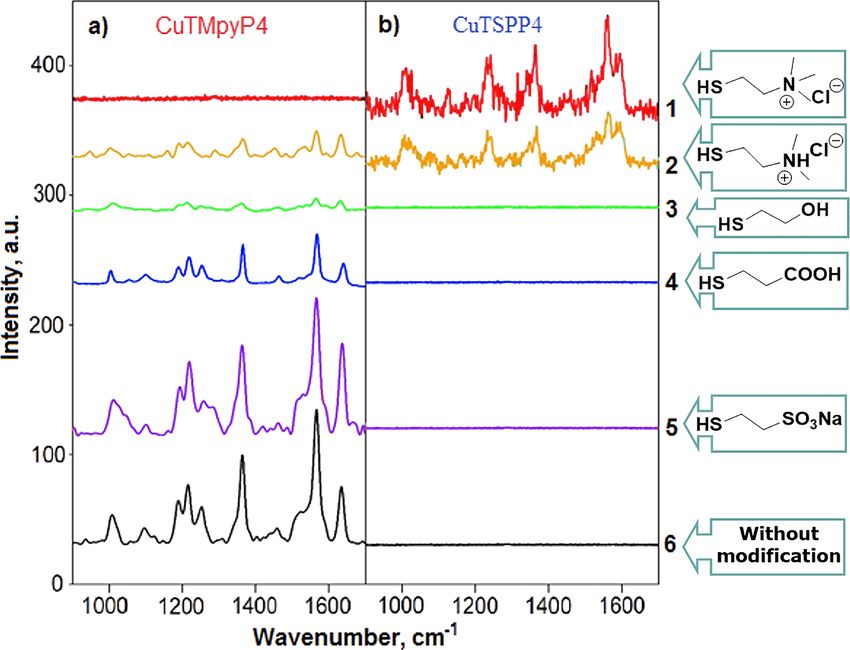
Beilstein J. Nanotechnol. 2021, 12, 902–912.

                                                                          ness of the PEI modifying layer considering its molecular
                                                                          weight (25 kDa) and its branched structure gives a value below
                                                                          10 nm. Taking into account the diameter of the NPs, we con-
                                                                          clude that the major part of their surface would remain uncov-
                                                                          ered by the polymer layer in the plasmonic film on the SERS
                                                                          substrate. AFM images (Figure S3, Supporting Information
                                                                          File 1) confirm our conclusion. Topology map shows that the
                                                                          NPs are sticking out of the polymer layer. The adhesion image
                                                                          proves that the surface properties of the immobilized Ag NPs
                                                                          strongly differ from those on the glass substrate and that the
                                                                          polymer does not cover them. Weak citrate interaction with the
                                                                          Ag surface enables one to treat the NPs with different reagents
                                                                          and to study the influence of resulting surface effects on the
                                                                          SERS intensity. Thus, the prepared SERS substrates are a con-
 Figure 2: Immobilization kinetics of Ag NPs on a glass substrate.        venient instrument for surface affinity investigations with dif-
 Since the glass slides were modified on both sides, the spectra corre-   ferent surface modifications and analyte types.
 spond to the absorption of two NPs layers.

                                                                          To exclude uncontrollable interactions of the analytes with the
In order to investigate the surface coverage of the glass SERS            Ag surface, we used a set of organic thiols with the same linker
substrates, we used SEM images of the PEI-modified silicon                length but differently charged hydrophilic functional groups.
support with analogous NP treatment supposing equal packing               Thiol functionality guarantees a strong binding to the surface
density (Figure 3). The surface coverage degree obtained was              and a sufficiently dense molecule packing to make the surface
58%, that is, 74% of the theoretical value for spherical particles        properties determined by the introduced functional group. We
with equal sizes and corresponds to the highest reported values           used a short ethylene linker and hydrophilic functional groups
for this method [10,12,32]. Moreover, the SEM image demon-                to avoid lipophilic interactions. Two hydrophilic porphyrins
strates many interparticle contacts, which are potential “hot             with similar structures, equal charge value and opposite charge
spots” in SERS analysis.                                                  (CuTMpyP4 and CuTSPP4) were used as model analytes.
                                                                          Structures of the modifying molecules and the analytes are
                                                                          depicted in Figure 4.

                                                                          The initially prepared plasmonic nanostructures yielded a rather
                                                                          intensive SERS signal for CuTMpyP4 bearing positive charge
                                                                          (Figure 5a, number 6). However, no spectrum was obtained
                                                                          for the negatively charged porphyrin CuTSPP4 (Figure 5b,
                                                                          number 6). Treatment of Ag NPs with sodium mercaptoethyl
                                                                          sulfonate did not result in a significant change of the SERS in-
                                                                          tensity for both porphyrins (Figure 5, number 5).

                                                                          These data are in line with the initial negative charge of the NP
                                                                          surfaces. The high affinity of thiol groups to the Ag surface sug-
                                                                          gests that the chloride counter ions of CuTMpyP4 do not signif-
                                                                          icantly influence the SERS signal. The use of mercaptopropi-
 Figure 3: SEM image of Ag NPs immobilized on silicon surface by op-      onic acid for the modification leads to a decrease of SERS in-
 timized procedure. The surface coverage degree is 58%.
                                                                          tensity of CuTMpyP4 (Figure 5, number 4). There is no SERS
                                                                          signal of CuTSPP4, presumably, because of the lowering of the
Electrostatic effect on SERS signal for thiol-                            negative charge of the Ag surface due to the several orders of
modified Ag NPs                                                           magnitude lower acidity constant of the introduced carboxylic
Despite the high NP packing density, about 42% of the support             groups, compared to sulfate groups. Using neutral mercapto-
surface remains unoccupied, thus providing space for localiza-            ethanol for surface modification led to an almost complete
tion of the analyte in the case of poor interaction with the NP           absence of SERS spectra for both porphyrins (Figure 5,
surfaces. Besides, a rough theoretical assumption of the thick-           number 3). In this case, the Ag surface became neutral and the

                                                                                                                                           905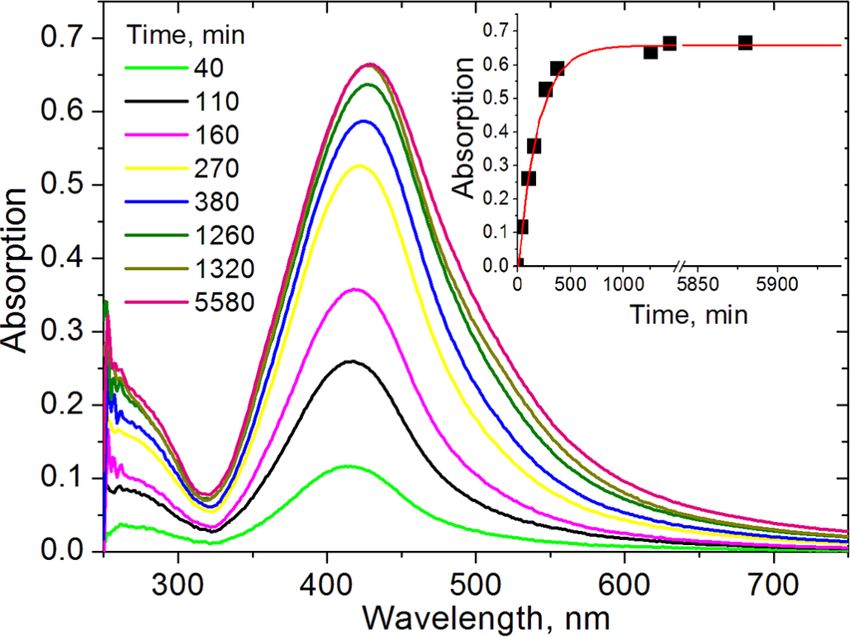
Beilstein J. Nanotechnol. 2021, 12, 902–912.

 Figure 4: Schematic representation of the surface modification of immobilized Ag NPs by thiols bearing differently charged functional groups, and the
 oppositely charged model analytes CuTMpyP4 and CuTSPP4.

 Figure 5: SERS spectra of (a) CuTMpyP4 and (b) CuTSPP4 drop-cast from 10−6 M solution onto the substrate modified with (1) thiocholine,
 (2) 2-(dimethylamino)ethanethiol hydrochloride, (3) 2-mercaptoethanol, (4) mercaptopropionic acid, (5) sodium mercaptoethyl sulfonate, and onto (6)
 the unmodified plasmonic surface.

analyte molecules were localized only on the glass support.                  NP surfaces. Thiocholine surface modification causes the com-
Modification of the Ag NPs with 2-(dimethylamino)ethanethiol                 plete disappearance of the CuTMpyP4 SERS signal and a sig-
hydrochloride results in a SERS intensity decrease for the                   nificant spectrum intensity increase for CuTSPP4 (Figure 5,
cationic analyte down to about a fourth. A weak CuTSPP4                      number 1). We explain this by positive charging of the Ag sur-
spectrum is measured using this modification (Figure 5, num-                 face. However, the SERS signal of CuTSPP4 is much weaker in
ber 2). This result proves a sufficient charge reduction due to              that case than that of CuTMpyP4 after negatively charged sur-
the introduction of the weakly basic amine groups to the Ag                  face modification. This is presumably not caused by different
surface. The presence of a SERS signal for both analytes can be              adsorption maxima of the analytes because they have very simi-
explained by additional donor–acceptor interactions between                  lar optical properties [33]. We suggest that some negatively
the Cu atom and electronic pairs of the amine groups. Another                charged centers are still present at the NP surfaces after thio-
explanation is the formation of zwitter-ionic structures on the              choline modification, such as, for example, adsorbed chloride

                                                                                                                                                    906
Beilstein J. Nanotechnol. 2021, 12, 902–912.
thiocholine counter ions, which contribute to the resulting sur- coating with polymers [7,19] or different inorganic reagents
face charge. The experimental data obtained support previous [20,22,23]. Figure 6 shows the corresponding modification
reports about the great importance of the electrostatic interac- schemes. Treatment of the plasmonic surface with lithium chlo-
tion for charged analytes in SERS analysis [18,20] and once ride led to a threefold increase of SERS intensity for the posi-
more emphasize the problem of SERS substrates with high sur- tively charged porphyrin (Figure 7a, number 3) whereas no
face charge. spectra of anionic CuTSPP4 were observed. The result supports
an earlier report about SERS activation by LiCl [23] and contra-
Other methods of silver surface modification dicts the authors’ statement that the effect does not depend on
We also made experiments with other methods of plasmonic the surface charge. We suppose that the advantage of LiCl com-
surface modification using our model SERS system, and com- pared to other metal halides is due to poorly soluble LiAgCl2
pared the results with those reported in literature, for example, formed at the Ag surface, which, according to our results,
Figure 6: Schematic illustration of Ag surface modifications by PHMG, PEI, LiCl, and Cu2+, and charged model analytes CuTMpyP4 and CuTSPP4.
Figure 7: SERS spectra of (a) CuTMpyP4 and (b) CuTSPP4 drop-cast from 10−6 M solution onto the SERS substrate modified with (1) PHMG,
(2) PEI, (3) LiCl, (4) Cu2+ (added into analyte solution), (5) Cu2+ (surface treatment), and onto (6) the unmodified plasmonic surface.
907Beilstein J. Nanotechnol. 2021, 12, 902–912.
enhances the negative surface charge. However, the complex studies because of their strong negative charge. Recently, we
substance can form differently terminated regions on the sur- showed the crucial role of electrostatic interactions of oligo-
face, which can adsorb different molecules and give rise to their nucleotides with NP surfaces for bioconjugation [34]. Thus,
SERS signal. High specific affinity of Ag to the analytes could oligonucleotide SERS spectra can indicate a positive charge of
also promote SERS activity enhancement for the anionic the SERS substrate surface. An oligonucleotide was labeled
analytes described in [23]. with a Black Hole Quencher dye (BHQ1) for better spectrum
recognition due to exclusion of characteristic peaks with back-
We also studied the SERS activity increase for negatively ground fluorescence, which is possible in the case of lumines-
charged analytes using multicharged cations [20]. For this cent dyes. As BHQ1 has a wide band that overlaps the excita-
purpose, copper cations were selected since they are already tion laser frequency, we can speak about surface-enhanced
present in the structure of both analyte molecules and, thus, Raman resonance scattering (SERRS) in this case.
their chemical transformation can be excluded. Treatment of the
NP surfaces with Cu 2+ ions resulted in an about twofold The unmodified SERS substrate did not show any SERS signal
increase of the CuTMpyP4 SERS intensity. Under the same of the oligonucleotide (Figure 8). Based on our previous experi-
conditions, the CuTSPP4 SERS spectrum was absent (Figure 7, ments on Ag surface modification with thiols, we achieved the
number 5). We suggest that Cu2+ ions are weakly adsorbed at best results for the negatively charged analytes by using thio-
the Ag surface and were mostly removed during the washing choline as a modifier. The method enabled the measurement of
stage. Copper complexation with PEI and positive charging of a sufficiently good CuTSPP4 spectrum. We applied this ap-
the glass surface is expected in this case. This could also
explain the SERS increase of the cationic analyte. Furthermore,
we checked the effect of adding Cu2+ cations to the analyte
on the SERS intensity. The SERS intensity of CuTMpyP4
decreases to a fifth in the presence of Cu2+ ions (Figure 7, num-
ber 4). At the same time, a weak SERS signal of CuTSPP4 was
detectable. These observations suggest that the charge of the NP
surfaces remains negative and Cu2+ ions do not create a strong
positive charge on the Ag surface. We suppose that CuTSPP4
detection in this case is related only to the shielding of the
analyte molecules by Cu2+ ions.
Polyethylenimine and polyhexamethylene guanidine (PHMG)
were used as basic polymer modifiers to create positive charges
on the Ag surface (Figure 7, numbers 1 and 2). Both of them
were described as effective Ag NP stabilizers, which lead to
NPs with positive zeta potential [7,19]. We found that treat-
ment of the Ag NPs with those polymers resulted in a signifi-
cant increase of the CuTMpyP4 SERS signal, that is, threefold
for PEI and fourfold for PHMG. A weak CuTSPP4 spectrum
was only observable in the case of PHMG. We suppose that the
results are caused by a partial desorption of polymer molecules
from the surface by washing. The remaining polymer mole-
cules are not able to generate a strong positive charge at the sur-
face but they improve the adsorption of the analyte molecules
due to hydrogen bonding and donor–acceptor and lipophilic
interactions.
SERS analysis of dye-labeled
oligonucleotides
Figure 8: SERS spectra of BHQ1-labeled oligonucleotide drop-cast
Biomolecules such as nucleotides and nucleic acids are of great from 10−5 M solution onto substrates modified with (1) Cu2+ (added
interest for practical SERS applications. Oligonucleotides are into the analyte solution) and (2) Cu2+ (surface treatment); (3) Raman
spectrum of BHQ1 in Ag NP solution.
the most suitable biomolecules for electrostatic interaction
908Beilstein J. Nanotechnol. 2021, 12, 902–912.
proach to obtain the SERS spectrum of the oligonucleotide but negatively charged. Thus, the generation of a strong positive
failed. This supports our idea about negatively charged centers charge on the Ag surface is important for successful SERS
at the Ag surface that decrease the resulting positive charge of detection of negatively charged analytes.
the thiocholine-modified surface. Consequently, the PEI-modi-
fied glass surface becomes more suitable for the competitive Previously described approaches for Ag surface modification
oligonucleotide localization. such as PEI, PHMG, LiCl, and multicharged metal ions led
mainly to a SERS enhancement of CuTMpyP4, that is, three-
From a range of different modifications, only treatment with fold for PEI and fourfold for PHMG and LiCl. Only the addi-
copper ions appeared to be successful (Figure 8, numbers 1 and tion of Cu2+ ions to the analyte enabled a satisfactory measure-
2). According to an earlier investigation [35], the Cu2+ ions ment of the CuTSPP4 SERS spectrum. Nevertheless, under sim-
are able to bind effectively both the phosphate groups and ilar conditions, the SERS signal of CuTMpyP4 was still present,
the nucleobases in the oligonucleotide molecules to yield which means that the surface charge was not inverted by the ad-
charge inversion. This is a key factor for the oligonucleotide dition of Cu2+ ions. At the same time, this was the only method
detection with Cu2+-modified SERS substrates. The spectrum that allowed us to get a SERS spectrum of a negatively charged
detection after Cu2+ treatment, followed by washing (which dye-labeled oligonucleotide, which was shown to interact
was not working for CuTSPP4), supports that and can be strongly with Cu2+ ions. We suppose that the charge inversion
explained by a low Cu 2+ ion concentration created by a of the analyte is the key factor in this case. Thus, our results
residual PEI–copper complex. Additionally, it was confirmed shift the focus from the Ag surface modification to the charge
in experiments with Mg2+ ions, instead of Cu2+ ions, which inversion of the analyte molecules, showing its perspective use
are much less capable of complexation with nucleobases. for negatively charged analytes.
Moreover, Mg 2+ cations have been shown [35] to have the
lowest affinity to DNA molecules among doubly charged ions Experimental
(Mg2+ < Co2+ < Ni2+ < Mn2+ < Zn2+ < Cd2+ < Cu2+) and, in Materials
contrast to the other ions, they do not induce unwinding of the Dye-labeled oligonucleotide 5′-CCTGCGATCTCTC-
double helix. Addition of Mg2+ ions to the analyte did not yield TATCCAG-[BHQ1]-3′ was purchased from Primetech ALC
measurable SERS spectra of oligonucleotides or CuTSPP4. (Minsk, Belarus). Cu(II) tetrakis(4-N-methylpyridyl)porphyrin,
tetrachloride salt (CuTMPyP4), and Cu(II)-5,10,15,20-
Thus, our results emphasize the importance of the SERS sub- tetrakis(4-sulfonatophenyl)porphyrin, tetrasodium salt
strate surface charge for successful SERS detection and point (CuTSPP4), were purchased from Frontier Scientific (Logan,
out another possible way to control it, that is, through analyte U.S.A.). Cellulose acetate membrane (cutoff = 12 kDa),
charge inversion by interaction with positively charged metal branched polyethylenimine (PEI, M W = 25000), polyhexa-
cations. This approach requires the selection of metal cations methylene guanidine hydrochloride (PHMG), analytical
with high affinity to the analyte molecules. As demonstrated in grade DMSO, NaI, LiCl, AgNO 3 , sodium mercaptoethyl
[35], this selection is not always easily predictable from basic sulfonate, mercaptopropionic acid, 2-mercaptoethanol,
considerations regarding complexation. 2-(dimethylamino)ethanethiol hydrochloride, acetylthiocholine
chloride, sodium citrate, and other reagents, if not mentioned
Conclusion otherwise, were purchased from Merck and used without addi-
Effects of electrostatic interaction between analyte molecules tional purification.
and plasmonic surfaces on the SERS enhancement was investi-
gated by using Ag NPs immobilized on a glass support. Two Instrumentation and Software
oppositely charged porphyrins with similar structure and the Absorption and extinction spectra of the samples were
same formal charge (cationic CuTMpyP4 and anionic measured using PB 2201 spectrometers (SOLAR, Belarus).
CuTSPP4) were used as model analytes. The surface charge of Scanning electronic microscopy (SEM) images were recorded
Ag NPs was adjusted by hydrophilic thiols. In the case of using a Zeiss LEO SUPRA 25 (Germany). Transmitting elec-
cationic CuTMpyP4, a shift from an initially negative Ag sur- tron microscopy (TEM) images were recorded using a Zeiss
face charge to a positive charge leads to a SERS intensity de- LEO 906E (Germany). SEM and TEM images were treated
crease up to complete spectrum disappearance. On the other using ImageJ 1.51k freeware. AFM images were scanned in air
hand, positive charging of the Ag surface enables the measure- using a BioScopeResolve (Bruker) atomic force microscope in
ment of CuTSPP4 spectra, which is prevented for the surface PeakForceQNM mode with recording the adhesion force maps
modifications with negative charge. However, it remains rela- and topographic images. SERS measurements were carried out
tively weak, revealing that the Ag surface has a tendency to be by using a scanning probe Raman microscope “NanoFlex”
909Beilstein J. Nanotechnol. 2021, 12, 902–912.
(Solar LS, Belarus). The source of excitation at 488.0 nm was Chemical modification of the plasmonic
an argon ion laser (Melles Griot, USA). Excitation and mea- surface
surement of Raman scattering was carried out using a 100× PEI-modified glass substrates were kept in Ag NP water solu-
objective and a CCD camera Newton 970 EMCCD DU970P- tion (silver concentration of 32 µg/mL) with 2.5 mM sodium
BV (Andor Technology Ltd, UK). Additionally, in some cases, citrate at room temperature for 24 h. The resulting substrates
the SERS spectra were recorded using a Raman spectrometer were washed with deionized water and further chemically
equipped with Spex 270M (Jobin Yvon) spectrograph and treated or dried for use without additional modification. The
liquid-nitrogen-cooled CCD detector (Princeton Instruments). same protocol was applied for the preparation of silicon sub-
Spectra were excited by a 441.6 nm of a He–Cd laser. strates for SEM images.
Synthesis of silver NPs The glass-based SERS substrates were treated with 0.1 mg/mL
The synthetic procedure was analogous to that described in solutions of a series of organic reagents (sodium mercaptoethyl
[36]. 50 mL of deionized water, 42 mg of sodium bicarbonate, sulfonate, mercaptopropionic acid, 2-mercaptoethanol,
15 mg sodium citrate, and 450 mg of water-free glucose were 2-(dimethylamino)ethanethiol hydrochloride, acetylthiocholine
added into a round bottom flask and stirred until complete chloride, PEI, and PHMG). Thiocholine was generated in situ
dissolution. Then, 640 µL of 4 mg/mL silver nitrate solution by basic hydrolysis of its acetyl ether in sodium carbonate
were added under vigorous stirring and kept for 4 h in the ultra- buffer at pH 10.8. The supports were soaked for 30 min in the
sonic bath. The resulting silver nanoparticle solution was corresponding reagent solution, washed with deionized water,
dialyzed against 2.5 mM sodium citrate and stored at 4 °С. and dried. Treatment with doubly charged metal ions was
carried out in 5 mg/mL Cu sulfate or Mg sulfate solution for
Glass and silicon surface functionalization 30 min with subsequent washing and drying. Lithium chloride
Standard optical microscope glass slides of 1.0 mm thickness treatment was performed according to [23].
were used as base substrates. As a silicon support, 5 mm
square-shaped polished chips of Sb-doped electrically conduc- Preparation of samples for SERS analysis
tive silicon were used. The modification was performed in a To assess the SERS substrate activity, water solutions of
similar way as described in [36]. The same modification cationic CuTMPyP4 (1 µM), anionic CuTSPP4 (1 µM), or
protocol was applied as for glass and the silicon supports. The oligonucleotide (10 µM) were used as a probe analyte. The
substrates were treated with a 1:1 (by mass) mixture of concen- solutions were drop-cast onto the substrate (ca. 100 µL/cm2),
trated H2SO4 and 30% hydrogen peroxide water solution for and dried at room temperature. In the case of metal ion addition,
2 h, rinsed with distilled water, and dried. The cleaned sub- 5 mM of the corresponding sulfate was added to the analyte
strates were treated with a solution of (3-chloropropyl)trichloro- solution.
silane in water-free toluene (2% by mass) for 24 h and rinsed
several times with dry toluene, then with isopropyl alcohol, and SERS acquisitions parameters
dried at room temperature. The chloropropyl-functionalized The SERS spectra were obtained in back-scattering geometry
substrates were then modified with PEI by soaking in 10% (by through the microscope objective. The estimated diameter of
mass) polymer solution in DMSO at 80 °C for 5 h in the pres- the laser spot focused on the substrate was 1–2 µm. SERS
ence of catalytic quantities of sodium iodide. Finally, the sub- spectra for every sample were measured at 5–10 different
strates were repeatedly rinsed with hot distilled water and dried. points on its surface. Each spectrum was accumulated for 5 s.
The SERS intensity distribution on the substrate surface was
Silver NPs adsorptive immobilization kinetics rather uniform, that is, the deviation between different point
study was less than 10% for each sample. An average representative
PEI-modified glass substrates 5 × 10 mm in size were placed in graph has been chosen for demonstration in Figures 5, 7, and 8).
3 mL (great excess) of Ag NP water solution (Ag concentration
of 32 µg/mL) with 2.5 mM sodium citrate and kept at room
temperature. A 2.5 mm quartz cuvette filled with 2.5 mM sodi- Supporting Information
um citrate water solution was used to measure the absorption
spectra. The glass substrate covered by Ag NPs was placed into Supporting Information File 1
the cuvette after washing with citrate buffer. The spectrum was Characterization of silver nanostructures.
immediately measured, and the substrate was returned into the [https://www.beilstein-journals.org/bjnano/content/
Ag NPs solution. The absorption spectra were obtained against supplementary/2190-4286-12-67-S1.pdf]
the analogous blank glass substrate.
910Beilstein J. Nanotechnol. 2021, 12, 902–912.
Funding 10. Freeman, R. G.; Grabar, K. C.; Allison, K. J.; Bright, R. M.; Davis, J. A.;
Guthrie, A. P.; Hommer, M. B.; Jackson, M. A.; Smith, P. C.;
This work has been supported by the Government Research
Walter, D. G.; Natan, M. J. Science 1995, 267, 1629–1632.
Program “Photonics, Opto- and Microelectronics 1.4.01”. Par-
doi:10.1126/science.267.5204.1629
ticipation of P. M. in this study was supported by the Czech 11. Grabar, K. C.; Freeman, R. G.; Hommer, M. B.; Natan, M. J.
Science Foundation (Grant 18-10897S). Anal. Chem. (Washington, DC, U. S.) 1995, 67, 735–743.
doi:10.1021/ac00100a008
ORCID® iDs 12. Bright, R. M.; Musick, M. D.; Natan, M. J. Langmuir 1998, 14,
5695–5701. doi:10.1021/la980138j
Bahdan V. Ranishenka - https://orcid.org/0000-0002-9822-6934
13. Li, W.; Zhao, X.; Yi, Z.; Glushenkov, A. M.; Kong, L. Anal. Chim. Acta
Andrei Yu. Panarin - https://orcid.org/0000-0003-2178-7853
2017, 984, 19–41. doi:10.1016/j.aca.2017.06.002
Irina A. Chelnokova - https://orcid.org/0000-0002-6812-753X
14. Le Ru, E. C.; Etchegoin, P. G. Principles of Surface-Enhanced Raman
Peter Mojzes - https://orcid.org/0000-0002-9952-6939
Spectroscopy; Elsevier: Amsterdam, Netherlands, 2009.
Vadim V. Shmanai - https://orcid.org/0000-0003-1775-8101
doi:10.1016/b978-0-444-52779-0.x0001-3
15. Ding, S.-Y.; You, E.-M.; Tian, Z.-Q.; Moskovits, M. Chem. Soc. Rev.
2017, 46, 4042–4076. doi:10.1039/c7cs00238f
Preprint 16. Anker, J. N.; Hall, W. P.; Lyandres, O.; Shah, N. C.; Zhao, J.;
A non-peer-reviewed version of this article has been previously published Van Duyne, R. P. Nat. Mater. 2008, 7, 442–453. doi:10.1038/nmat2162
as a preprint: https://doi.org/10.3762/bxiv.2021.29.v1 17. Kneipp, K.; Kneipp, H.; Itzkan, I.; Dasari, R. R.; Feld, M. S. Chem. Rev.
1999, 99, 2957–2976. doi:10.1021/cr980133r
References 18. Stewart, A.; Murray, S.; Bell, S. E. J. Analyst 2015, 140, 2988–2994.
doi:10.1039/c4an02305f
1. Mosier-Boss, P. A. Nanomaterials 2017, 7, 142.
19. van Lierop, D.; Krpetić, Ž.; Guerrini, L.; Larmour, I. A.; Dougan, J. A.;
doi:10.3390/nano7060142
Faulds, K.; Graham, D. Chem. Commun. 2012, 48, 8192–8194.
2. Langer, J.; Jimenez de Aberasturi, D.; Aizpurua, J.;
doi:10.1039/c2cc31731a
Alvarez-Puebla, R. A.; Auguié, B.; Baumberg, J. J.; Bazan, G. C.;
20. Iancu, S. D.; Stefancu, A.; Moisoiu, V.; Leopold, L. F.; Leopold, N.
Bell, S. E. J.; Boisen, A.; Brolo, A. G.; Choo, J.; Cialla-May, D.;
Beilstein J. Nanotechnol. 2019, 10, 2338–2345.
Deckert, V.; Fabris, L.; Faulds, K.; García de Abajo, F. J.;
doi:10.3762/bjnano.10.224
Goodacre, R.; Graham, D.; Haes, A. J.; Haynes, C. L.; Huck, C.;
21. Wetzel, H.; Gerischer, H. Chem. Phys. Lett. 1980, 76, 460–464.
Itoh, T.; Käll, M.; Kneipp, J.; Kotov, N. A.; Kuang, H.; Le Ru, E. C.;
doi:10.1016/0009-2614(80)80647-6
Lee, H. K.; Li, J.-F.; Ling, X. Y.; Maier, S. A.; Mayerhöfer, T.;
22. Leopold, N.; Stefancu, A.; Herman, K.; Tódor, I. S.; Iancu, S. D.;
Moskovits, M.; Murakoshi, K.; Nam, J.-M.; Nie, S.; Ozaki, Y.;
Moisoiu, V.; Leopold, L. F. Beilstein J. Nanotechnol. 2018, 9,
Pastoriza-Santos, I.; Perez-Juste, J.; Popp, J.; Pucci, A.; Reich, S.;
2236–2247. doi:10.3762/bjnano.9.208
Ren, B.; Schatz, G. C.; Shegai, T.; Schlücker, S.; Tay, L.-L.;
23. Koo, T.-W.; Chan, S.; Sun, L.; Su, X.; Zhang, J.; Berlin, A. A.
Thomas, K. G.; Tian, Z.-Q.; Van Duyne, R. P.; Vo-Dinh, T.; Wang, Y.;
Appl. Spectrosc. 2004, 58, 1401–1407.
Willets, K. A.; Xu, C.; Xu, H.; Xu, Y.; Yamamoto, Y. S.; Zhao, B.;
doi:10.1366/0003702042641227
Liz-Marzán, L. M. ACS Nano 2020, 14, 28–117.
24. Doering, W. E.; Nie, S. J. Phys. Chem. B 2002, 106, 311–317.
doi:10.1021/acsnano.9b04224
doi:10.1021/jp011730b
3. Lee, H. K.; Lee, Y. H.; Koh, C. S. L.; Phan-Quang, G. C.; Han, X.;
25. Anastasopoulos, J. A.; Soto Beobide, A.; Manikas, A. C.;
Lay, C. L.; Sim, H. Y. F.; Kao, Y.-C.; An, Q.; Ling, X. Y.
Voyiatzis, G. A. J. Raman Spectrosc. 2017, 48, 1762–1770.
Chem. Soc. Rev. 2019, 48, 731–756. doi:10.1039/c7cs00786h
doi:10.1002/jrs.5233
4. Bell, S. E. J.; Charron, G.; Cortés, E.; Kneipp, J.; Chapelle, M. L.;
26. Dong, F.; Valsami-Jones, E.; Kreft, J.-U. J. Nanopart. Res. 2016, 18,
Langer, J.; Procházka, M.; Tran, V.; Schlücker, S.
259. doi:10.1007/s11051-016-3565-0
Angew. Chem., Int. Ed. 2020, 59, 5454–5462.
27. Pfeiffer, C.; Rehbock, C.; Hühn, D.; Carrillo-Carrion, C.;
doi:10.1002/anie.201908154
Jimenez de Aberasturi, D.; Merk, V.; Barcikowski, S.; Parak, W. J.
5. Xu, Y.; Konrad, M. P.; Lee, W. W. Y.; Ye, Z.; Bell, S. E. J. Nano Lett.
J. R. Soc., Interface 2014, 11, 20130931. doi:10.1098/rsif.2013.0931
2016, 16, 5255–5260. doi:10.1021/acs.nanolett.6b02418
28. Torres-Nuñez, A.; Faulds, K.; Graham, D.; Alvarez-Puebla, R. A.;
6. Hakonen, A.; Wang, F. C.; Andersson, P. O.; Wingfors, H.;
Guerrini, L. Analyst 2016, 141, 5170–5180. doi:10.1039/c6an00911e
Rindzevicius, T.; Schmidt, M. S.; Soma, V. R.; Xu, S.; Li, Y. Q.;
29. Ranishenka, B. V.; Isic, G.; Mojzes, P.; Terekhov, S. N.;
Boisen, A.; Wu, H. A. ACS Sens. 2017, 2, 198–202.
Panarin, A. Yu. Surface Modification of Plasmonic Nanostructures for
doi:10.1021/acssensors.6b00749
SERS Spectroscopy of Biomolecules. In Interaction of radiation with
7. Tepanov, A. A.; Nechaeva, N. L.; Prokopkina, T. A.; Kudrinskiy, A. A.;
solids Proceedings of 13 International conference, 2019; pp 485–488.
Kurochkin, I. N.; Lisichkin, G. V. IOP Conf. Ser.: Mater. Sci. Eng. 2015,
30. Paramelle, D.; Sadovoy, A.; Gorelik, S.; Free, P.; Hobley, J.;
98, 012002. doi:10.1088/1757-899x/98/1/012002
Fernig, D. G. Analyst 2014, 139, 4855–4861. doi:10.1039/c4an00978a
8. Xu, W.; Ling, X.; Xiao, J.; Dresselhaus, M. S.; Kong, J.; Xu, H.; Liu, Z.;
31. Huang, Y.; Fang, Y.; Zhang, Z.; Zhu, L.; Sun, M. Light: Sci. Appl. 2014,
Zhang, J. Proc. Natl. Acad. Sci. U. S. A. 2012, 109, 9281–9286.
3, e199. doi:10.1038/lsa.2014.80
doi:10.1073/pnas.1205478109
32. Makarik, A. Y.; Tepanov, A. A.; Kolesov, D. V.; Kudrinskii, A. A.;
9. Fan, M.; Brolo, A. G. Phys. Chem. Chem. Phys. 2009, 11, 7381–7389.
Lisichkin, G. V. Nanotechnol. Russ. 2015, 10, 549–557.
doi:10.1039/b904744a
doi:10.1134/s1995078015040126
911Beilstein J. Nanotechnol. 2021, 12, 902–912.
33. Harriman, A.; Richoux, M. C.; Neta, P. J. Phys. Chem. 1983, 87,
4957–4965. doi:10.1021/j150642a038
34. Ranishenka, B.; Ulashchik, E.; Radchanka, A.; Shmanai, V.;
Artemyev, M. ChemNanoMat 2020, 6, 292–297.
doi:10.1002/cnma.201900609
35. Eichhorn, G. L.; Shin, Y. A. J. Am. Chem. Soc. 1968, 90, 7323–7328.
doi:10.1021/ja01028a024
36. Ranishenka, B.; Ulashchik, E.; Tatulchenkov, M.; Sharko, O.;
Panarin, A.; Dremova, N.; Shmanai, V. FlatChem 2021, 27, 100235.
doi:10.1016/j.flatc.2021.100235
License and Terms
This is an Open Access article under the terms of the
Creative Commons Attribution License
(https://creativecommons.org/licenses/by/4.0). Please note
that the reuse, redistribution and reproduction in particular
requires that the author(s) and source are credited and that
individual graphics may be subject to special legal
provisions.
The license is subject to the Beilstein Journal of
Nanotechnology terms and conditions:
(https://www.beilstein-journals.org/bjnano/terms)
The definitive version of this article is the electronic one
which can be found at:
https://doi.org/10.3762/bjnano.12.67
912You can also read