UC Riverside UC Riverside Previously Published Works
←
→
Page content transcription
If your browser does not render page correctly, please read the page content below
UC Riverside
UC Riverside Previously Published Works

Title
Bubble dynamics of laser-induced cavitation in plasmonic gold nanorod solutions and the
relative effect of surface tension and viscosity

Permalink
https://escholarship.org/uc/item/8sf3v0kn

Authors
Sabzeghabae, AN
Devia-Cruz, LF
Gutierrez-Herrera, E
et al.

Publication Date
2021-02-01

DOI
10.1016/j.optlastec.2020.106621

Peer reviewed

 eScholarship.org                             Powered by the California Digital Library
                                                              University of California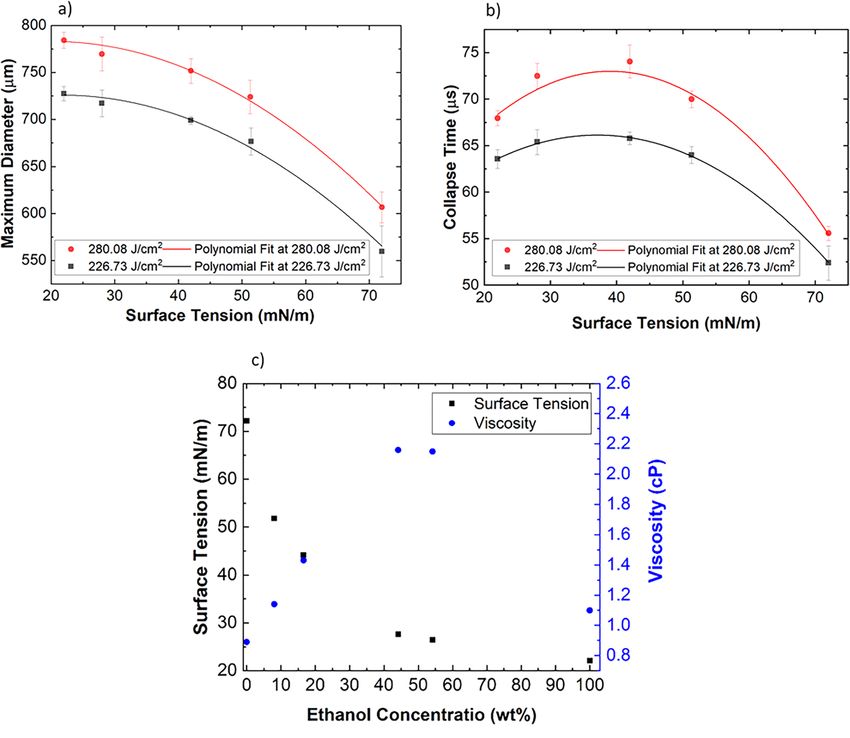
Optics & Laser Technology 134 (2021) 106621
Contents lists available at ScienceDirect
Optics and Laser Technology
journal homepage: www.elsevier.com/locate/optlastec
Full length article
Bubble dynamics of laser-induced cavitation in plasmonic gold nanorod
solutions and the relative effect of surface tension and viscosity
Ariana Nushin Sabzeghabae a, Luis Felipe Devia-Cruz b, Enoch Gutierrez-Herrera a, c,
Santiago Camacho-Lopez b, Guillermo Aguilar a, *
a
Department of Mechanical Engineering, University of California, Riverside, 92521 Riverside, CA, USA
b
Departamento de Óptica, Centro de Investigación Científica y de Educación Superior de Ensenada, Carretera Ensenada-Tijuana No. 3918, Zona Playitas, C.P. 22860
Ensenada, B. C., Mexico
c
Instituto de Ciencias Aplicadas y Tecnología, Universidad Nacional Autónoma de México, Ciudad de México 04510, Mexico
A R T I C L E I N F O A B S T R A C T
Keywords: Laser-induced cavitation (LIC) bubbles and the shockwaves they form upon collapse are destructive to nearby
Gold nanoparticles solid boundaries, making them of interest for biomedical and industrial applications. Furthermore, the LIC
Shockwaves bubbles provide spatial control that can be tuned by the bubble size, collapse time and shockwave intensity. The
Laser-induced cavitation
inclusion of plasmonic nanoparticles, such as gold nanoparticles (GNP) in the liquids where LIC bubbles are
Laser-induced breakdown
formed, can further enhance the absorption of light, allowing for bubble formation at lower laser energies.
However, the effect of the physical properties of such liquids on LIC bubble dynamics remains unknown. In this
study, the dynamics of LIC bubbles in water–ethanol, water-glycerol, and water-GNP solutions were investigated
by simultaneous high-speed shadowgraphy and spatial transmittance modulation. The first set of experiments
demonstrated that LIC bubbles induced in the GNP solutions led to more efficient cavitation formation with
lower fluence compared to solutions without GNPs, thereby producing higher-intensity pressure waves. A second
set of experiments was conducted to determine the surface tension of GNP solutions at room temperature and
was found to be 70.62 mN/m. With this information, and the corresponding values reported in the literature for
ethanol and glycerol, we aimed at discerning the role of surface tension and viscosity on the dynamics of LIC
bubbles, apart from the enhanced optical absorption of the GNP solutions. We observed that the optical
breakdown threshold for plasma formation was reduced by 18% in GNP solutions as compared to DI water and
10.4% compared to ethanol, and the intensity of initial shockwaves in the GNP solutions was much higher than
those in DI water. This enhanced intensity of shockwaves in GNP solutions compared to DI water opens a new
avenue for the enhancement of cancer cell treatment and anti-bacterial applications in the biomedical field and
the enhancement of the laser ablation technique in the industrial setting.
1. Introduction for acoustic relaxation, instead, mechanical relaxation occurs via prop
agation of a shockwave within the liquid medium and through the
Cavitation bubbles have been the main interest of many studies due creation of a cavitation bubble. As the pressure inside the growing
to the damage they can induce to the solid boundaries in the vicinity of bubble decreases, the bubble collapses and another shockwave is
their formation. These bubbles can be formed mechanically, acousti emitted right at the end of the collapse [2–5]. Shockwaves are one of the
cally, or optically. Sometimes, this damage is a beneficial feature, (e.g. mechanisms in laser-induced cavitation (LIC) phenomena that drive
when applied to cancerous cells), which has been the focus of many mechanical damage to solid boundaries in the close vicinity of the
biomedical applications. The cavitation bubbles presented in this paper bubbles. Depending on the application, other phenomena such as
are formed optically by tightly focusing a high-power laser beam inside a jetting, mechanical contact, etc., are also significant contributors. Ten
liquid, which excites the electrons through a process known as Laser- sile stresses were observed for bubbles formed in solutions with high
Induced Breakdown (LIB). This process initially forms a high- viscoelasticity, which is an indication of bubble behaviour in tissue-like
temperature and high-pressure plasma [1]. Electrons do not have time environment is different from bubble dynamics in water [6]. The
* Corresponding author.
https://doi.org/10.1016/j.optlastec.2020.106621
Received 19 April 2020; Received in revised form 30 July 2020; Accepted 21 September 2020
0030-3992/© 2020 Elsevier Ltd. All rights reserved.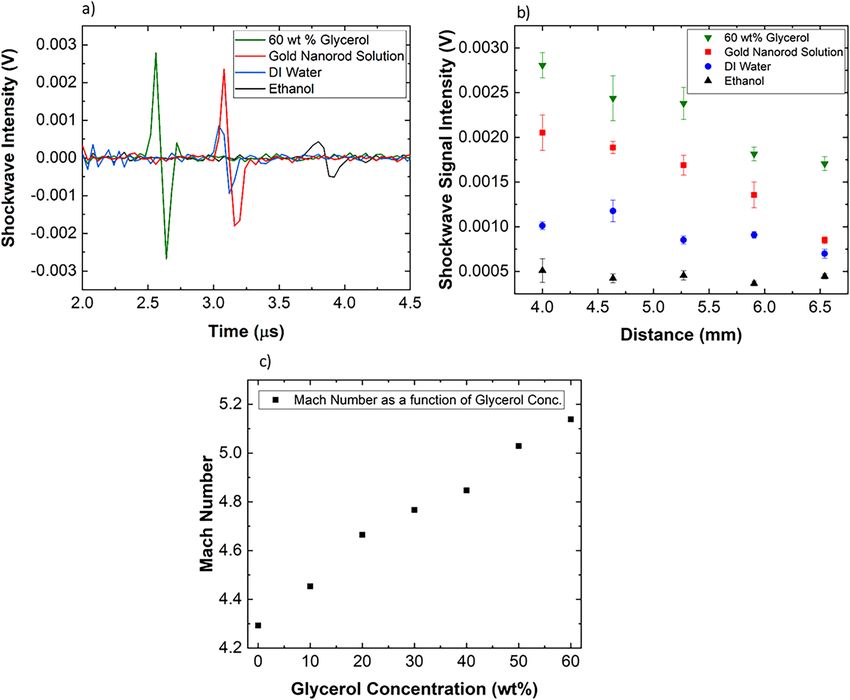
A.N. Sabzeghabae et al. Optics and Laser Technology 134 (2021) 106621
intensity of shockwaves [7] directly influences the intensity of damage spectrometer (NIRQuest, Ocean Optics). A spectroscopic cuvette
in applications where pressure waves have been used as a major part of (CVH100, Thorlabs) was illuminated with a white light source (HL2000
treatment. These applications include eradication of various cell types, FHSA, Ocean Optics) through a fiber. Then, the transmitted light was
such as cancerous and Epidermal Hela cells [8,9], antibacterial effects collected through another fiber connected to the spectrometer. An
by shockwaves [10] and cleaning surfaces of dental root canals [11]. average of 10 spectra and an integration time of 100 ms were chosen in
Although plasma formation sets the initial stage of cavitation, the these measurements.
physical properties of the liquid influence LIC bubble dynamics at the Transmittance,T(λ), was obtained using the following equation,
latter stages of this process. Surface tension forces acting on LIC bubbles
I(λ) − ID (λ)
directly affect the growth rate and the size of the bubble [12–14]. More T(λ) = (1)
I0 (λ) − ID (λ)
specifically, LIC bubbles near boundaries grow larger in solutions with
lower surface tensions [14], as these solutions exhibit less resistance to
where I(λ) is the measured spectral intensity, I0 (λ)is the spectral in
deformation. Viscosity is another physical property that impacts the
tensity of light through the empty cuvette, and ID (λ) indicates the
bubble dynamics and laser-induced shockwaves. Several studies have
reference in the dark environment (Dark Spectrum).
shown the impact of viscosity by producing cavitation in polymer so
The absorbance,A(λ), was obtained from the calculated and
lutions [15,16,6]. Knowledge of bubble dynamics and all external fac
normalized transmittance values by the following equation,
tors that impact them is important to researchers since the size of the LIC
bubble [17] directly influences the severity of the damage on the sur A(λ) = − log(T(λ)) (2)
rounding environment. Therefore, two separate studies in water
–ethanol and water-glycerol mixtures in our paper elaborate on the
2.2. The threshold laser fluence required for bubble formation
impact of (1) surface tension and (2) viscosity changes on LIC bubble
growth, respectively.
The fluence required to form LIC bubbles is referred to as the LIB
For optical cavitation, gold nanoparticle (GNP) solutions can be used
threshold. When the solution demonstrates a 50% probability of bubble
as adjuvants to enhance the damaging effects of LIC bubbles for a given
formation at a certain fluence, this fluence is defined as the threshold
laser fluence, or even reduce the fluence for equivalent damage. In
fluence for bubble formation [21]. The plasma formation can be
particular, gold nanorods absorb more energy in the near-infrared (NIR)
observed by eye since the luminescence appears as white bright light
spectrum, which reduces the fluence requirement for plasma formation
[21]. To study this phenomenon, the probability of bubble formation
induced by a NIR laser. The optical properties of GNP solutions affect the
was obtained by sending 10 pulses at each fluence and counting the
LIB threshold and, therefore, the bubble formation threshold. However,
number of times the plasma was observed, then this procedure was
despite the optical advantages of GNP in many applications, the lack of
repeated four times. The probability was reported as the average prob
knowledge about the influence of physical properties on bubble dy
ability of four measurements for each fluence. Similarly, the error was
namics extends to LIC bubbles in GNP solutions as well. More specif
calculated by finding the standard error between the four probabilities
ically, the surface tension of colloidal gold nanorod solutions and its
at each fluence.
influence on the bubble dynamics of LIC remain unknown, and the
relationship between the concentration of GNP and surface tension of
the solution has not been reported either. To the best of our knowledge, 2.3. Setup for bubble formation and analysis
the only previous studies that have aimed at understanding the surface
tension of GNP have used the Kelvin Equation [18,19] to calculate The optical setup for bubble formation is shown in Fig. 1a. A Pulsed
surface tension between the nanoparticle and vapor based on the free Nd:YAG laser (Surelite, Amplitude) with a pulse duration of 6 ns and
energy of a free nanoparticle. This concept, however, is different from wavelength of 1064 nm was used to create the bubble. A Glan-Laser
the macroscopic surface tension of GNP solutions, which are the subject polarizer and a half-wave plate were used to adjust the delivered en
of our study herein. Therefore, this paper aims to address the effects of ergy. The diameter of the beam was expanded using a telescope
optical and physical properties of GNP solutions on the dynamics of configuration (lenses L1 and L2). An aspheric lens L3 focuses the beam
micro- and millimetric LIC bubbles. We expect these results to allow inside the cuvette with a focal beam waist of 14.5 µm, inducing a
researchers to use GNP solutions to optimize optical cavitation, partic cavitation bubble with every pulse. A knife-edge method was used to
ularly for biomedical applications. measure the pump beam diameter at the focal point of lens L3. A 632 nm
HeNe laser continuous beam that was aimed perpendicular to the pump
2. Study design and methods beam was collimated and expanded using L4, L5, and L6 lenses to illu
minate the bubble. The bubble appears as a dark silhouette in the high-
2.1. Physical and optical properties of GNP solution, water, and ethanol speed camera due to the deflection of the light as shown in Fig. 1b. The
evolution of bubble diameter was captured using a Phantom high-speed
The gold nanorods used in this study (C12-10-1064, Nanopartz) have camera (Miro, Phantom) with a speed of 105 fps.
a diameter and length of 10 × 66 nm and are dispersed in DI water. The The bubbles’ diameters were compared for different solutions.
GNP solution has a concentration of 4.2 × 10¹¹ np/ml, 0.0042 wt%. The Bubbles were formed in the middle of the cuvette to circumvent any
nanorods have cetyltrimethylammonium bromide (CTAB) capping effect of the boundaries on the bubble dynamics. The bubble diameters
agent. This coating is a cationic surfactant, which behaves as a particle were obtained by averaging the diameter four times. The Spatial
stabilizer during synthesis. In all the experiments the nanoparticle so Transmittance Modulation method (STM) was used simultaneously with
lutions were sonicated for 960 s to form a homogenous mixture. The shadowgraphy to measure the collapse time of the LIC bubbles [2]. In
surface tension of the GNP solutions was measured using a tensiometer this method, the portions of the continuous beam that passed through
(SITA Dyno Tester) at room temperature. In this method, an air bubble is the bubble are deflected, thereby, lowering the intensity of the beam
formed in the liquid and surface tension is measured from the forces that reaches the photodiode. Thus, the intensity of the light captured by
acting on the bubble. As shown in Fig. 6c, the surface tension values of the photodiode (DET 10 A, Thorlabs) in our optical setup depends on the
water and ethanol mixtures were obtained by values reported by Khat size of the bubble, which changes with time. The intensity goes back to
tab et al. [20]. its initial value once the bubble collapses completely and the laser light
In order to examine the optical properties of the GNP solution, and passes undeflected. The collapse time was obtained from the photodiode
compare the absorbance with water and ethanol, the transmission data as shown in Fig. 1c. The average diameter and collapse time of five
properties of the solutions in this study were obtained by an NIR bubbles were measured for each fluence.
2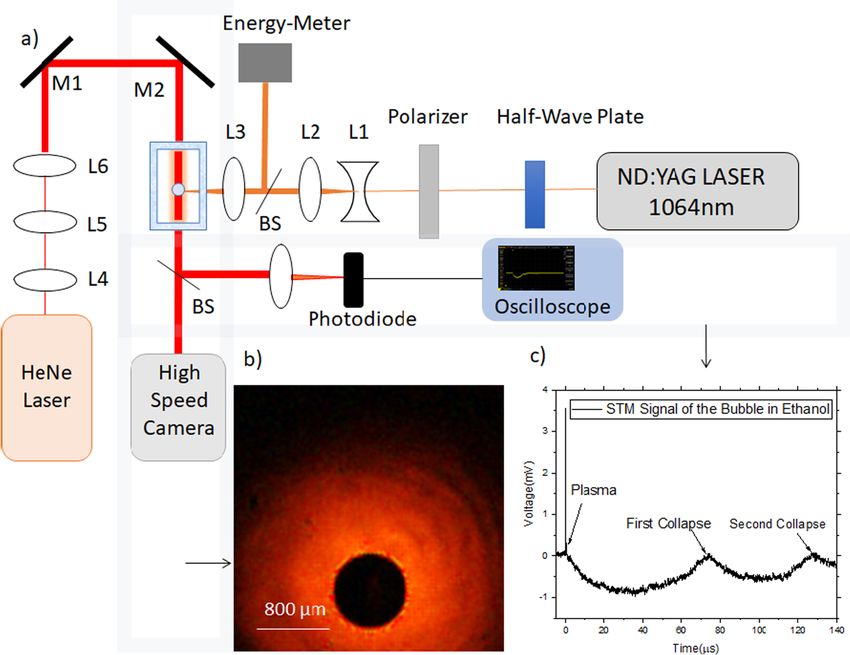
A.N. Sabzeghabae et al. Optics and Laser Technology 134 (2021) 106621
Fig. 1. (a) Optical setup for bubble formation. (b) Typical bubble image obtained by Shadowgraphy, and (c) Spatial transmittance modulation method (STM) signal
is shown for a 280 J/cm2 laser pulse.
2.4. Shockwave study surface tensions, two extreme fluences were chosen and five bubbles
were generated and analyzed for each concentration. The maximum
In some biomedical applications, shockwaves are the prominent bubble diameter and collapse time for each solution was correlated to
damaging mechanism, which is beneficial in applications such as cancer- the surface tension of the solutions. The errors reported in this paper
cell lysis, lithotripsy, dentistry and bacteria control [8–11]. In order to were calculated by finding standard error of the five measurements.
compare the mechanical stress induced by cavitation bubble in the
medium, the comparative shockwave study between DI water, GNP
2.6. Viscosity influence on bubble dynamics
solution, ethanol, and 60 wt% Glycerol-water was performed by using a
Type I hydrophone with 150 ns rise time (RP Acoustics, Leutenbach
Experiments in Newtonian [22] glycerol-water mixtures were con
Germany), which was placed initially 4 mm above the center of the
ducted to investigate the role of viscosity on bubble dynamics. As shown
bubble. The hydrophone was placed in a bag of water to avoid damage to
in Fig. 7c, the values reported by Segar et al. [23] were used to obtain
the coating of the device. The addition of the bag around the hydro
solutions with varying viscosity. It was observed that in solutions with
phone resulted in a 0.3 µs delay in the signal detection process. The
glycerol concentrations higher than 60 wt%, there were multiple
distance between the bubble and hydrophone was modified for in
microbubbles in the solution, which affected the propagation of the laser
crements of 1.27 mm. The average of three shockwaves measurements
beam due to strong light scattering and the growth of the main bubble.
were reported at each distance. The hydrophone was connected to a 100
Therefore, concentrations below 60 wt% glycerol were selected. These
MHz, 1.25 GS/s oscilloscope (TDS 3014B, Tektronix) and triggered with
experiments allowed modifying the viscosity by a factor of ten while
the pulsed laser. The amplitude of the first shockwave (the one triggered
keeping the surface tension variation minor and reducing the impact of
by the LIB) was compared for bubbles in all four liquids. Additionally,
microbubbles on the main LIC bubble [23]. The experiments in glycerol-
the Mach number for the shockwaves were obtained by moving the
water solutions were performed by using three different fluences. By
hydrophone away from the LIC and detecting the time that it takes for
using the optical setup shown in Fig. 1, the bubble diameter and collapse
the shockwaves to reach the hydrophone at each position. Three mea
time were measured five times for each solution at every fluence. The
surements were used to obtain the average time the shockwave takes to
error bars were calculated by finding the standard error of the five
reach the detector. By calculation the slope of position versus time plot,
measurements. The optical properties of glycerol-water solutions were
the Mach number was obtained.
obtained by using water as a reference in double beam scanning UV/Vis/
NIR spectrophotometer (Cary 500, Varian), which uses a high-power
2.5. Dynamic surface tension influence on bubble dynamics xenon arc lamp with wide bandwidth.
The weight concentration of ethanol–water mixtures was modified to 3. Results and discussion
obtain various surface tensions from 22 mN/m to 72 mN/m using the
protocols in Khattab et al. [20] (Fig. 6c). The surface tensions were 3.1. Physical and optical properties of GNP solution, water, and ethanol
measured by the drop number method. The experiments performed in
water–ethanol solutions allowed modifying surface tension while Although the surface tension of this specific type of GNP solutions
keeping the viscosity changes minor. Additionally, water–ethanol solu has not been reported before, studies on surface tension of other nano
tions are Newtonian [22] and the viscosity remains constant at various particle solutions indicate that surface tension of nanoparticles solutions
deformation rates. For the experiments of bubble dynamics at various depends highly on the concentration, size and the material of the
3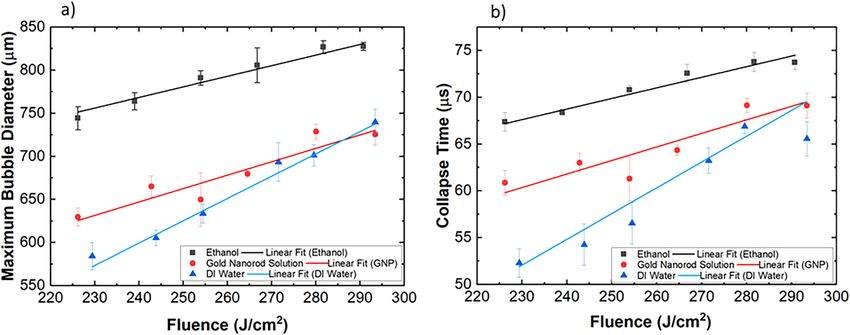
A.N. Sabzeghabae et al. Optics and Laser Technology 134 (2021) 106621
nanoparticle [24–26]. Interestingly, there exists a discrepancy according 3.2. The threshold laser fluence required for bubble formation
to the literature in the correlation between nanoparticle concentration
and the surface tension of the solutions. For example, the surface tension The higher absorbance of gold nanorods solutions at 1064 nm in
of nanofluids in Tanvir et al. [24] study remained unchanged at a con fluences the LIB threshold. To study LIB threshold, the probability of
centration below 4 wt%. This was correlated to the low Van Der Waals bubble formation at different fluences was measured and it is shown in
forces between particles at low concentrations. A positive linear corre Fig. 3. This probability plot describes the threshold fluence for plasma
lation between concentration and surface tension is shown for concen formation which then triggers bubble growth. The LIB threshold corre
trations above 4 wt% [24]. In another study [25], in the case of TiO2 sponds to a 50% probability of bubble formation. LIB threshold GNP
nanoparticles, the surface tension decreases with increasing concentra strongly depends on the efficiency in optical alignment, the laser
tion. However, the reverse trend has been observed for FeC nanoparticle wavelength [29], the pulse duration [27]; due to these experimental
solutions [26]. For our studies, we measured the dynamic surface ten differences, there exists a wide range of reported values for LIB threshold
sion of our GNP solution (gold nanorods) with a concentration of 4.2 × in GNP solutions.
1011 np/ml, measured by tensiometer and obtained a value of 70.62 In our study, the LIB irradiance threshold in the GNP solution was
mN/m at 23.1 ◦ C. Note that the surface tension of the solvent, DI water, 2.75 × 10¹⁰ W/cm2, which is comparable to the reported value of 7.8 ×
is 72.2 mN/m at 23.1 ◦ C, therefore, the presence of gold nanorods 1010 W/cm2 for the LIB threshold under 6 ns pulse duration, 532 nm
reduced surface tension of the liquid (by 2%). wavelength laser in a GNP solution [30]. According to Rau et al. [30],
NIR Spectroscopy allows a better understanding of solution absor the breakdown threshold fluence in water is similar to the fluence
bance at 1064 nm, which is the wavelength of the pump beam inducing required for inducing cell lysis. In our study, the LIB threshold in GNP
the LIC bubbles. In the process of LIB, the cascade ionization is the solutions is 15% lower than the breakdown threshold in water. This
prominent process for plasma formation. When a medium is irradiated indicates that using GNP reduces the fluence required to induce cell
with nanosecond pulsed laser, due to conservation of momentum, ab lysis. Note in Fig. 3 that, at 173 J/cm2, no bubble is formed in water.
sorption of photons leads to creation and collision of free electron, which However, GNP solution demonstrates 95% probability of bubble for
results into plasma formation once the electron density surpasses 1021 mation at that same fluence. The presence of GNP enhances the capacity
cm− 3 [27]. A medium with higher optical absorbance at the pump laser of the medium for bubble formation even at lower fluences. The bubble-
wavelength can obtain the required electron density at lower energies formation probability plot for GNP solutions is shifted to a lower LIB
per pulse as compared to a medium that has a lower absorbance. threshold (left) as compared to water and ethanol which agrees with NIR
Therefore, the optical properties of these solutions were further inves spectroscopy information (see Figs. 2 and 3). The localized heating re
tigated with the goal of better understanding the plasmonic properties of sults are caused by the plasmonic absorption features of gold nano
the GNP. The results indicate that water and ethanol have similar particles at the resonant frequency. The free electrons in the gold
absorbance at 1064 nm (vertical line shown in Fig. 2). The absorbance of nanoparticles collectively oscillate under the light illumination; this
GNP solution is the highest at 1175 nm wavelength. However, the forms what is known as a localized surface plasmon and it is driven by a
absorbance of GNP solutions at 1064 nm wavelength (the pump beam) is characteristic resonant frequency, which corresponds to an enhanced
at least 10 times higher than the absorbance of water and ethanol. absorption at that specific wavelength. The threshold fluence for bubble
Similarly, it was previously reported that the length-to-width ratio of formation in ethanol is lower than in water, despite ethanol having the
gold nanorods can be modified to shift the absorbance peak to the NIR lowest absorbance. A similar outcome was observed previously when
desired wavelength [28]. This is a promising insight for biomedical ethanol was added to a tissue phantom. It was reported that addition of
applications, since tissue cells absorb and scatter less at NIR wavelengths ethanol reduces the power threshold required to induce cavitation by
[29], allowing most of the energy to get absorbed by the particles acoustic waves. Ethanol is a volatile substance that has higher vapor
without damaging the surrounding tissue cells. pressure as compared to water, which reduced the threshold for bubble
formation [31]. This effect may also be present in LIC bubbles in
ethanol. GNP solutions reach from 0 the 100% probability of bubble
formation within the smallest range of fluence.
Several studies have used the plasmonic properties of gold nano
particles to enhance laser-induced nano and micro LIC bubbles and
1.50
Ethanol Gold Nanorod Solution DI Water
1.25 100
Probability of Bubble Formation (%)
Absorbance (a.u.)
1.00
80
0.75
60
0.50
40
0.25
20
Ethanol
0.00 Gold Nanorod Solutions
900 950 1000 1050 1100 1150 1200 1250 1300 DI water
0
(nm)
160 180 200 220 240 260 280 300 320
Fig. 2. NIR Spectra of the solutions at the pump beam wavelength (1064 nm), Fluence (J/cm2)
the absorbance of GNP solutions is at least 10 times higher than the absorbance
of water and ethanol. Fig. 3. Probability of bubble formation as a function of per pulse laser fluence.
4
A.N. Sabzeghabae et al. Optics and Laser Technology 134 (2021) 106621
rupture cell membrane, and it is known that the presence of GNP lowers 3.4. Shockwave study
the threshold energy required to damage cells [29,30,32–34] by
lowering the LIB threshold, and as a consequence lowering the onset for Despite the higher absorbance of the GNP solution compared to DI
generating LIC bubbles. The nanoparticles reduce bulk heat transfer, water (Fig. 2), the maximum bubble diameter and collapse time of
leading to localized heating and creation of nucleation sites. When bubbles in GNP solutions are not significantly higher than bubbles
compared to other shapes of gold nanoparticles, the accumulation of formed in water (Fig. 4a and b). This could be due to higher scattering
gold nanorods has shown to produce the most significant enhancement rates in GNP solutions and the transfer of the energy to production of the
of the intensity of electromagnetic field under laser illumination initial shockwave, since the initial shockwave forms prior to the bubble
[35–37]. [5]. The intensity of shockwave in GNP solutions was compared to the
intensity of the shockwave in DI water, ethanol, and 60 wt% Glycerol-
water solutions in Fig. 5a and b. The amplitudes of shockwaves in
3.3. Analysis of bubble dynamics in GNP solutions GNP solutions were higher than in water. This result indicates that GNP
in solution allow lowering the fluence requirements to induce similar
Although the presence of GNP in solutions lowered the cavitation damage to the surrounding environment compared to cells without
threshold, the bubble dynamics in GNP solutions will be further nanoparticles. Similarly, our results confirm that higher intensity of
explained in this section. The bubble dynamics presented in Fig. 4a and damage can be obtained when GNP are used. Surprisingly, the shock
b compare the maximum bubble diameter and collapse time in DI water, waves in glycerol-water solutions have the highest shockwave intensity
GNP solution, and pure ethanol. The bubbles in ethanol grow largest in compared to the rest of the solutions. We attribute this to the damping
comparison to DI water and GNP solutions because of having the lowest effects in highly viscous solutions, in which the shockwaves carry out its
surface tension (Fig. 6c). The maximum bubble diameter increases as the energy over a longer distance, Fig. 5b. According to Vogel et al, [39] the
laser fluence increases for all three solutions because at higher laser shockwave energy loss is the highest close to the plasma, with 85–90%
fluences, more energy is transferred to the plasma at the initial stage of energy loss within the 200–300 µm from the focal point. Therefore, in
bubble formation [38]. Although the absorbance of GNP solution was our far-field shockwave measurements, the energy dissipation over
much higher than water and ethanol, the maximum bubble diameters in distance impacts the shockwave measurements as well.
GNP solution are lower than the maximum bubble diameters in ethanol, Another study [40] in various glycerol-water solutions indicated that
and only slightly higher than those in DI water. This could be attributed the intensity of shockwaves is the lowest for solutions with the highest
to the energy loss due to absorption and scattering by the plasma in GNP glycerol concentration. However, their results also indicated that
solutions. In the GNP solution, the plasma is formed at lower frequency shockwaves Mach number decays at a lower rate over distance for so
because GNPs provide seed electrons to start the plasma formation. The lutions with higher glycerol concentration. Therefore, at a distance of
plasma forms within the leading edge of the pulse. The GNPs not only 300 µm away from the LIC, the solution with 100% wt. glycerol con
absorb but also scatter the energy in the pulse. Therefore, there is a centration has the highest Mach number despite having the lowest initial
lower effective energy spent in the bubble formation in GNP solution as shockwave pressure. Therefore, in our far-field measurements, the
compared to water and ethanol. In addition, in the GNP solution, part of higher intensity of shockwaves in glycerol-water solution, Fig. 5b, is due
the energy of the travelling pulse is absorbed by the GNPs along the to lower dissipation rate in solutions with higher viscosity. In order to
optical beam path before the focal spot. These two factors can explain confirm this result, we also investigated Mach number as a function of
the lower effective energy transformation to create a bubble in the GNP glycerol concentration as shown in Fig. 5c. As the glycerol concentration
solution. (viscosity) increases, the average speed of the shockwave increases.
The collapse time of the bubbles is another factor that characterizes Liquids with lower viscosity such as water have higher dissipation rate,
the bubble dynamics. The STM technique allows a more accurate mea therefore by the time the shockwave reaches the hydrophone, the
surement of collapse time than the use of high-speed photography. Using shockwave has lost the majority of its energy resulting in smaller Mach
STM traces we studied the growth and collapse of the bubbles. The numbers. Gold nanoparticles solution and ethanol had Mach numbers
bubbles in water have the highest surface tension, so they exhibit the equal to 4.31 and 3.37, respectively.
shortest lifetime. In contrast, the bubbles in the solutions with the lowest Our results also indicate that shockwaves in ethanol have the lowest
surface tension (i.e. ethanol) have the longest lifetimes. The lifetime of intensity at far distance from the source d > 4 mm, Fig. 5a and b. This
bubbles in GNP solutions were slightly longer than those in water.
Fig. 4. (a) Maximum bubble diameter vs. fluence for the three solutions is shown. (b) Collapse time vs. fluence for the three solutions.
5
A.N. Sabzeghabae et al. Optics and Laser Technology 134 (2021) 106621
Fig. 5. (a) Typical shockwave signal distribution over time at a distance 5.3 mm away from the bubble. This data was smoothed by Origin. (b) Shockwave intensity at
various distances from the LIC in water, GNP solutions, 60 wt% glycerol, and ethanol. (c) The shockwave Mach number as a function of concentration for pressure
waves formed in various glycerol solutions.
can be an indication of higher dissipation rate or lower shockwave In Fig. 6a and b the bubble diameter and collapse time vs. surface
pressures at the initial stages. Additionally, the bubbles were bigger in tension are plotted, respectively. In both graphs, as the surface tension
ethanol compared to bubbles in water and GNP solutions. Further con increases, weight concentration of ethanol decrease (refer to Fig. 6c). As
firming that more laser energy is transferred to bubble formation and the surface tension forces acting on the bubble increases in the solutions
thus less energy is transferred to acoustic energy resulting in lower in with lower ethanol content, the bubble diameter decreases. However,
tensity shockwaves in ethanol. the collapse time does not follow the same trend as seen in Fig. 6b. The
explanation for this phenomenon is rooted in viscosity variations shown
3.5. Surface tension influence on bubble dynamics in Fig. 6c. For solutions with surface tension between 30.11 and 72 mN/
m (ethanol concentration 44.13 to 0 wt%), viscosity decrease with in
A set of experiments in ethanol–water solution with various ethanol crease in surface tension. Yet, for solutions with surface tensions below
concentration was conducted to investigate the impact of surface tension 30.11 mN/m, viscosity increase as surface tension increases.
on bubble dynamics. As shown in Fig. 6c, the relative concentration in For solutions with surface tension between 30.11 and 72 mN/m, as
ethanol–water solutions is directly correlated to the surface tension of viscosity decreases and surface tension increases, and the maximum
these solutions. However, the viscosity also changes as ethanol con bubble diameter decreases as well, Fig. 6a. This means that the reduction
centration varies and the secondary impact of viscosity changes is also in viscosity has relatively lower impact on bubble diameter than surface
explained in more in details in this section. The surface tension of water tension since the opposite trend would have been expected due to vis
is high due to the hydrogen bonds. Therefore, as the concentration of cosity changes. Therefore, the increase in surface tension has a bigger
water in water–ethanol solutions decreases, the surface tension also role on bubble diameter and bubbles grow smaller. Both decrease in
decreases. As the surface tension decreases, the maximum bubble viscosity and increase in surface tension in this region contribute to
diameter becomes larger, Fig. 6a. A polynomial trend with a negative decrease in the collapse time, Fig. 6b in this region.
leading coefficient was used to extrapolate results between data points. For solutions with surface tension between 22 and 30.11 mN/m (100
The inertial force on the bubble must overcome the surface tension while to 44.13 wt% ethanol concentration), the viscosity is increasing as sur
the bubble is growing in the medium. face tension increases. If surface tension is increasing, collapse time
6A.N. Sabzeghabae et al. Optics and Laser Technology 134 (2021) 106621
Fig 6. (a) Maximum diameter of the bubbles in ethanol–water solutions with various surface tension (i.e. ethanol concentrations). (b) Collapse time of the bubbles in
ethanol–water solutions with various surface tension (i.e. ethanol concentrations). (c) Correlation between surface tension and viscosity variation with ethanol
concentration is reported based on results in Khattab et al. [20].
should decrease because the bubbles grow smaller and the bubble takes formation in our study, it is expected that the inertial forces are higher in
less time to collapse. However, in this region, the opposite occurred. The LIC bubbles as compared to bubbles formed acoustically. Therefore, the
collapse time is increasing despite the bubbles growing smaller. This interaction between the inertial force and the surface tension force has a
result is because of the increase in viscosity in this region. This indicates bigger impact on the dynamics of the bubbles than the ones observed for
that the drastic increase in viscous forces in solutions with surface ten acoustic cavitation.
sion from 22 to 30.11 mN/m, has a bigger impact on collapse time than
changes in surface tension. 3.6. Viscosity influence on bubble dynamics
There are several studies on the relationship between surface tension
and bubble dynamics. Liu et al. [14] calculated LIC bubble dynamics To investigate the role of viscosity on bubble dynamics even further,
near boundaries from the collapse times measured using the optical bubbles in glycerol-water solutions were compared to bubbles in DI
beam deflection method. However, the authors only focus on examining water. By increasing the glycerol concentration from 0 to 60 wt%, the
ethanol, pure water and solutions with similar surface tensions, and did viscosity changes exponentially from 1.005 cp to 10.8cp [23], while the
not study the solutions with surface tensions between the two extremes. surface tension varies only slightly from 72 mN/m to 68 mN/m [41].
In another study, the correlation between surface tension and cavitation Therefore, the experiments in glycerol-water solutions allow keeping
behaviour was explained theoretically [13]. In that study, acoustic surface tension changes minor, in contrast to the water–ethanol mixture.
cavitation with 1 m/s growth rate was considered. The cavitation The maximum bubble diameter increases rapidly when viscosity in
behaviour was unaffected by change in surface tension of the liquid for creases from 1.15 to 3 mPa∙s. At viscosities higher than 3 mPa∙s the rate
large bubbles. However, it was reported that for smaller bubbles, the of change of maximum bubble diameters in solutions decrease for all
surface tension effect on bubble diameter increases. The LIC bubbles laser fluences, see Fig. 7a. By increasing the concentration of glycerol,
formed in our study have around 20 times faster growth rate than not only viscosity increases exponentially, the absorbance of glycerol-
acoustic bubbles in the paper mentioned above. Due to rapid plasma water solutions at 1064 nm increases as well, refer to Fig. 7c. In
7A.N. Sabzeghabae et al. Optics and Laser Technology 134 (2021) 106621
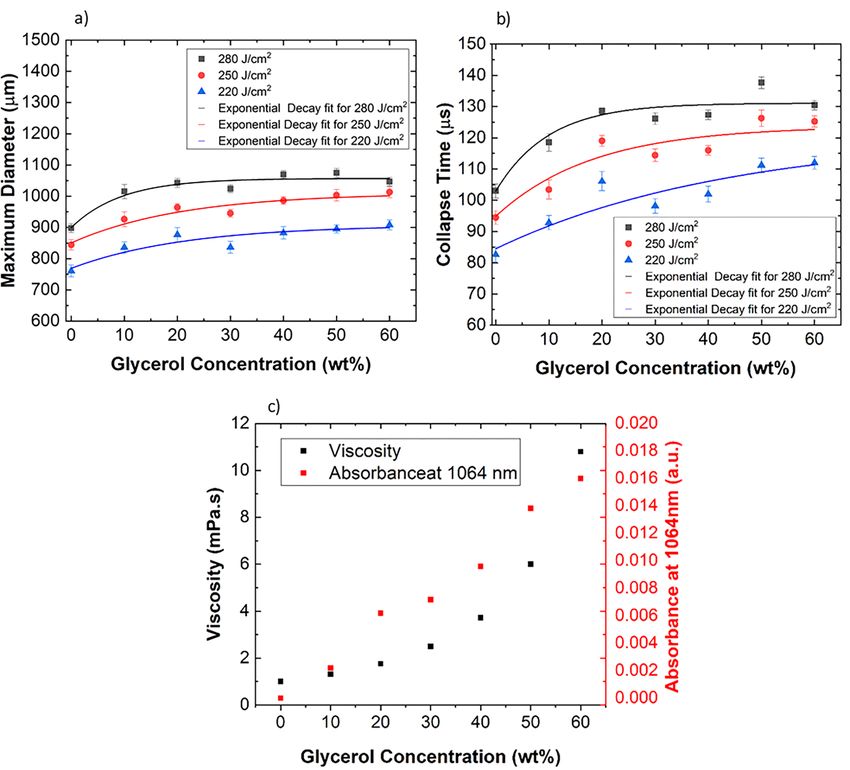
Fig. 7. (a) Maximum diameter of the bubbles in glycerol-water solutions with various concentrations. (b) Collapse time of the bubbles in glycerol-water solutions
with various concentrations. (c) NIR absorbance of glycerol-water solutions with reference to DI water and viscosity values reported by Segar et al. [23] as a function
of glycerol concentration.
highly viscous solutions, viscous forces acting on the bubble will resist and b, the changes in collapse time are within the measurement
the bubble growth in the medium, therefore the bubble should not grow uncertainty.
as big. Concurrently, in our glycerol experiments, such solutions have However, the collapse time of bubbles formed with lower fluences
higher absorbance at the wavelength used to create the plasma (1064 continues to increase by increasing the glycerol concentration. The
nm). Solutions with high absorbance at 1064 nm, should produce bigger bubble dynamics do not change once the absorbed fluence surpasses a
bubbles due to the higher strength of the plasma and high electron certain threshold (refer to discussion of Fig. 4a and b). This phenomenon
density at the cavitation site. These two phenomena are occurring explains the plateau in the curve for bubbles formed by 280 J/cm2 laser
simultaneously in Fig. 7a and b. Viscosity changes at a slower rate for pulse. For lower fluence, the increase in absorbance alongside increase
lower concentrations due to exponential relationship between viscosity in viscosity for higher glycerol concentrations lead to higher collapse
and glycerol concentration. Therefore, at lower concentrations, the times.
impact of absorbance seems to surpass the impact of viscosity. Once the The average speed of the bubble–liquid interface can also be
concentration is above 30 wt%, viscosity and absorbance effects on analyzed from Fig. 7a and b by dividing the average maximum bubble
maximum bubble diameter seem to neutralize each other and no sig diameter by the average time it takes the bubble to reach its maximum
nificant changes in bubble diameter is observed. size. The time it takes for the bubble to reach the maximum bubble
Similarly, the collapse time increases drastically when increasing the diameter is half of the collapse time based on the symmetric nature of
concentration of glycerol from 0 to 20 wt%. However, for concentrations the STM signal (Fig. 1c). When viscosity changes from 1.005 mPa∙s (DI
above 30 wt%, the rate of change in collapse time versus glycerol con water) to 10.8 mPa∙s (60 wt% glycerol), the speed of the bubble–liquid
centration depends on the energy used to induce the bubble, as Fig. 7b interface reduces from 18.43 m/s to 16.22 m/s for bubbles formed by
shown. For bubbles formed by the highest energy of 280 J/cm2 in Fig. 7a 280 J/cm2 laser pulse. The ten times increase in viscosity increases the
8A.N. Sabzeghabae et al. Optics and Laser Technology 134 (2021) 106621
resistance of the fluid to deformation under tensile stress, therefore the 4. Conclusions
bubble growth rate slows down.
There exists a discrepancy between reports that studied LIC bubbles The presence of GNP increased the shockwave intensity as compared
in glycerol solutions by using a 1064 nm pulsed laser. Liu et al [42] to water, however the diameter and collapse time of bubbles in GNP
described the decline of the bubble size to be only 25 µm after changing solutions only altered slightly compared to the bubbles formed in water.
viscosity from 0 to 50 cP, and the increase of bubble lifetime was only 5 GNP provide seed electrons and enhance the transformation of the en
µs. Another study indicated that an increase in concentration of glycerol ergy for creation of the plasma. On the other hand, due to scattering of
from 0 to 100% does not change the main bubble dynamics significantly; GNP, there is less energy efficiency in bubble formation process,
however, the plasma luminescence intensity highly depends upon the therefore the bubble diameters do not change significantly. The surface
concentration of glycerol [43]. It remained unknown why by changing tension of GNP- DI water solutions was measured, and we observed
the viscosity, the bubble diameters remained unchanged or decreased addition of gold nanoparticles to DI water reduces the surface tension
only slightly. Brujan et al [15] also investigated the effect of viscoelas slightly. Although water–ethanol solutions were initially used to study
ticity on bubble dynamics by comparing water to solutions with polymer the surface tension of the liquids, we must note that there also exists
additives. The polymer additives increased the viscosity and elasticity of some variation in viscosity in these solutions, impacting the maximum
the solutions. They reported that as the laser energy increases the impact radius and collapse time during the cavitation process. Another study in
of rheology on the bubble oscillation time diminishes. However, for laser glycerol-water solutions was conducted and showed that the increase in
energies below the threshold energy, the bubble radius is smaller in viscosity was correlated to longer collapse times of bubbles. The overall
polymer solutions compared to water. Similarly, in our experiments findings of this study indicate that physical properties of solutions
with higher laser energies, the curves in Fig. 7a and b reach the plateau (surface tension and viscosity) allow researchers to control the cavita
at lower concentrations, indicating the reduction of viscosity effects on tion dynamics, therefore better managing the intensity of the damage to
bubble dynamics. Although from 0 to 30 wt% glycerol, our result shows the surrounding. Also, GNP lower the energy required to induce cavi
an increase in bubble diameter and collapse time, we attribute the tation and shockwave production resulting more localized damage and
discrepancy between our study and Brujan et al [15] due to use of efficient cavitation process.
glycerol instead of polymers to change the viscosity of the solutions and
different bubble sizes. In a separate study performed by Brujan et al CRediT authorship contribution statement
[16], the effect of viscosity on bubble diameter for bubbles above 0.5
mm was not as prominent as compared to smaller bubbles in their other Ariana Nushin Sabzeghabae: Conceptualization, Methodology,
study [15]. Contrastingly, Li et al [42] also investigated the bubble Writing - review & editing, Writing - original draft, Visualization,
dynamics in glycerol-water solutions in order to examine the impact of Investigation. Luis Felipe Devia-Cruz: Conceptualization, Methodol
viscosity and showed bubble diameters and collapse time change due to ogy, Investigation, Writing - review & editing. Enoch Gutierrez-Her
the addition of glycerol, even for larger bubbles with diameters above rera: Conceptualization, Methodology, Writing - review & editing.
0.8 mm. In our study, we measured the bubble diameter by using a high- Santiago Camacho-Lopez: Conceptualization, Methodology, Writing -
speed camera, instead of computing the bubble diameter from the review & editing, Resources. Guillermo Aguilar: Conceptualization,
collapse time or simulation like in some of the other works. In the reports Methodology, Writing - review & editing, Supervision, Project admin
mentioned above, the higher optical absorption of glycerol when istration, Resources.
compared to water at 1064 nm wavelength was overlooked. In our
study, the bubbles grow slightly larger in solutions with higher glycerol
content. This effect occurs despite the increase in viscous forces acting Declaration of Competing Interest
on the bubble in solutions with higher glycerol content. Higher viscosity
should reduce the maximum bubble diameter, however as the concen The authors declare that they have no known competing financial
tration of glycerol increases, the absorbance and viscosity increase interests or personal relationships that could have appeared to influence
simultaneously. More energy is transferred to the bubbles in solutions the work reported in this paper.
with higher absorbance, therefore the bubbles will increase in size due
to this effect. At the same times, the solutions with higher glycerol Acknowledgments
concentrations also have higher viscosity which resist the bubble growth
and increase the damping and collapse time of the bubble. These two The authors of this paper would like to thank Dr. Robert Zenit and
effects happen simultaneously and as a result the changes in bubble Bernardí Palacios for their assistance with surface tension measurements
diameter are not significant. Our study also indicates that by changing and most specially, Mr. David Halaney, for helping with the discussion
the glycerol concentration from 0 to 60 wt%, the collapse time increases and editing of the paper. ANS and GA acknowledge the support of the
by 30% while the bubble diameter only increases by 10%. This result National Science Foundation (NSF:PIRE 1545852) and Department of
demonstrates that glycerol concentration highly influences the collapse Education (GAANN P200A180037).
time more than it does to the maximum bubble diameter. Higher
absorbance and viscosity of solutions with high glycerol content both References
lead to bubbles with longer collapse times.
[1] A. Vogel, J. Noack, G. Huttman, G. Paltauf, Mechanism of femtosecond laser
In summary, researchers can use the results reported in this paper to
nanosurgery of cells and tissues, Appl. Phys. B 81 (2005) 1015–1047.
tailor the properties of GNP solutions and obtain the desired outcome in [2] L. Devia-Cruz, S. Camacho-Lopez, R. Evans, D. Garcia-Casillas, D. Stepanov, Laser-
biomedical and industrial applications. According to the literature, induced cavitation phenomenon studied using three different optically-based
approaches - An initial overview of results, Photon Lasers Med. 1 (3) (2012)
bubble size [17] and shockwave intensity [7] impact the severity of
195–205.
damage induced to the surrounding by the LIC. For instance, to obtain a [3] W. Lauterborn, A. Vogel, Shock Wave Emission by Laser Generated Bubbles,
larger damage area, higher intensity of shockwave and bubble diameter Bubble Dyn. Shockw. 8 (2012) 67–103.
should be used, which can be obtained by the addition of GNP and [4] M.K. Bhuyan, A. Soleilhac, M. Somayaji, T.E. Itina, R. Antoine, R. Stoian, High
fidelity visualization of multiscale dynamics of laser-induced bubbles in liquids
reduction of the surface tension of the solvents, respectively. Addition containing gold nanoparticles, Sci. Rep. 8 (2018) 1–12.
ally, the use of GNP allows a more precise damage mechanism since [5] R. Evans, S. Camacho-Lopez, F.G. Perez-Gutierrez, G. Aguilar, Pump-probe imaging
lower laser fluence is required. Lastly, the speed of LIC process can be of nanosecond laser-induced bubbles in agar gel, Opt. Express 10 (2008)
7481–7492.
tuned by changing the viscosity of the solvents. Bubbles with slower [6] E.A. Brujan, A. Vogel, Stress wave emission and cavitation bubble dynamics by
speed and growth rate will form in highly viscous solutions. nanosecond optical breakdown, J. Fluid Mech. 558 (2006) 281–308.
9A.N. Sabzeghabae et al. Optics and Laser Technology 134 (2021) 106621
[7] E.A. Brujan, Shock wave emission from laser-induced cavitation bubbles in [27] J. Noack, A. Vogel, Laser-Induced Plasma Formation in Water at Nanosecond to
polymer solutions, Ultrasonics 48 (2008) 423–426. Femtosecond Time Scales: Calculation of Thresholds, Absorption Coefficients, and
[8] R. Dijkink, S. Le Gac, E. Nijhuis, A. Berg, I. Vermes, A. Poot, C. Ohl, Controlled Energy Density, IEEE J. Quantum Electron. 35 (8) (1999) 1156–1167.
cavitation–cell interaction: trans- membrane transport and viability studies, Phys. [28] X. Huang, M.A. El-Sayed, Gold nanoparticles: Optical properties and
Med. Biol. 53 (2008) 375–390. implementations in cancer diagnosis and photothermal therapy, J. Adv. Res. 1
[9] L.B. Jr Feril, T. Kondo, Z. Cui, Y. Tabuchi, Q. Zhao, H. Ando, T. Misaki, (2010) 13–28.
H. Yoshikawa, Umemura, Apoptosis induced by the sonomechanical effects of low [29] M. Kitz, S. Preisser, A. Wetterwald, M. Jaeger, G.N. Thalmann, M. Frenz, Vapor
intensity pulsed ultrasound in a human leukaemia cell line, Cancer Lett. 221 (2) bubble generation around gold nanoparticles and its application to damaging of
(2005) 145–152. cells, Biomed. Opt. Express 2 (2) (2011) 291–304.
[10] G. Divya Prakash, R.V. Anish, G. Jagadeesh, D. Chakravortty, Bacterial [30] K.R. Rau, P.A. Quinto-Su, A.N. Hellman, V. Venugopalan, Pulsed Laser Microbeam-
transformation using micro-shockwaves, Anal. Biochem. 419 (2011) 292–301. Induced Cell Lysis: Time-Resolved Imaging and Analysis of Hydrodynamic Effects,
[11] N. Lukac, M. Jezersek, Amplification of pressure wave in laser-assisted endodontics Biophys. J. 1 (2006) 317–329.
with synchronized delivery of Er:YAG laser pulses, Lasers Med. Sci. 33 (2018) [31] C. Chen, Y. Liu, S. Maruvada, M. Myers, D. Khismatullin, Effect of ethanol injection
823–833. on cavitation and heating of tissues exposed to high-intensity focused ultrasound,
[12] Y. Iwai, S. Li, Cavitation erosion in waters having different surface tensions, Wear Phys. Med. Biol. 57 (2012) 937–961.
254 (2003) 1–9. [32] Y. Arita, M. Ploschner, M. Antkowiak, F. Gunn-Moore, K. Dholakia, Laser-induced
[13] E. Samiei, M. Shams, R. Ebrahimi, A novel numerical scheme for the investigation breakdown of an optically trapped gold nanoparticle for single cell transfection,
of surface tension effects on growth and collapse stages of cavitation bubbles, Eur. Optical Society of America 38 (17) (2013) 3402–3405.
J. Mech. B/Fluids 30 (2011) 41–50. [33] C.M. Pitsillides, E. Joe, X. Wei, R.R. Anderson, C.P. Lin, Selective Cell Targeting
[14] X.M. Liu, J. He, J. Lu, X.W. Ni, Effect of surface tension on a liquid-jet produced by with Light-Absorbing Microparticles and Nanoparticles, Biophys. J . 6 (2003)
the collapse of a laser-induced bubble against a rigid boundary, Opt. Laser Technol. 4023–4032.
1 (2011) 21–24. [34] V.P. Zharov, R.R. Letfullin, E.N. Galitovskaya, Microbubbles-overlapping mode for
[15] E.A. Brujan, Shock wave emission and cavitation bubble dynamics by femtosecond laser killing of cancer cells with absorbing nanoparticle clusters, J. Phys. DAppl.
optical breakdown in polymer solutions, Ultrason.-Sonochem. 58 (2019) 1–8. Phys. 38 (2005) 2571–2581.
[16] E.A. Brujan, P.R. Williams, Cavitation Phenomena in Non-Newtonian Liquids, [35] L. Tong, Y. Zhao, T. Huff, M. Hansen, A. Wei, J. Cheng, Gold Nanorods Mediate
Chem. Eng. Res. Des. 84 (2006) 293–299. Tumour Cell Death by Compromising Membrane Integrity, Adv. Matter. 19 (2007)
[17] M.S. Huston, X. Ma, Plasma and Cavitation Dynamics during Pulsed Laser 3136–3141.
Microsurgery in vivo, Phys. Rev. Lett. 99 (2007), 158104-1–158104-4. [36] H. Xiaohua, I.H. El-Sayed, W. Qian, M.A. El-Sayed, Cancer Cell Imaging and
[18] K.K. Nanda, A. Maisels, E. Kruis, Surface Tension and Sintering of Free Gold Photothermal Therapy in the Near-Infrared Region by Using Gold Nanorods, J. Am.
Nanoparticles, Phys Chem 112 (2008) 13488–13491. Chem. Soc. 128 (2006) 2115–2120.
[19] S.C. Vanithakumari, K.K. Nanda, Phenomenological Predictions of Cohesive Energy [37] O. Ekici, R.K. Harrison, N.J. Durr, D.S. Eversole, M. Lee, A. Ben-Yakar, Thermal
and Structural Transition of Nanoparticles, J. Phys. Chem. B 110 (2006) Analysis of Gold Nanorods Heated with Femtosecond Laser Pulses, J. Phys. D Appl.
1033–1037. Phys. 41 (2008), 185501-1–185501-11.
[20] I.S. Khattab, F. Bandarkar, M.A. Abolghasemi Fakhree, A. Jouyban, Density, [38] M. Mohammadzadeh, S.E. Gonzalez-Avila, K. Liu, Q.J. Wang, C.-D. Ohl, Synthetic
viscosity, and surface tension of water+ethanol mixtures from 293 to 323K, Korean jet generation by high frequency cavitation, J. Fluid Mech. Rapids 823 (2017). R3-
J. Chem. Eng. 6 (2012) 812–817. 1–R3-12.
[21] B. Varghese, V. Bonito, M. Jurna, J. Palero, M.H.R. Verhagen, Influence of [39] A. Vogel, J. Noack, K. Nahen, D. Theisen, S. Busch, U. Parlitz, D.X. Hammer, G.
absorption induced thermal initiation pathway on irradiance threshold for laser D. Noojin, B.A. Rockwell, R. Birngruber, Energy balance of optical breakdown in
induced breakdown, Biomed. Opt. Express 6 (4) (2015) 1234–1240. water at nanosecond to femtosecond times scales, Appl. Phys. B 68 (1999)
[22] C. Ayela, L. Nicu, Micromachined piezoelectric membranes with high nominal 271–280.
quality factors in Newtonian liquid media: A Lamb’s model validation at the [40] H. Kurahara, K. Ando, Effects of Liquid Viscosity in Laser-induced Shockwave
microscale, Sens. Actuators, B 123 (2007) 860–868. Dynamics, ASME Proceeding 5 (2019).
[23] J.B. Segur, H.E. Oberstar, Viscosity of glycerol and its aqueous solutions, Ind. Eng. [41] F. Behroozi, J. Smith, W. Even, Effect of viscosity on dispersion of capillary-gravity
Chem. 9 (1957) 2117–2120. waves, Wave Motion 48 (2011) 176–183.
[24] S. Tanvir, L. Qiao, Surface tension of Nanofluid-type fuels containing suspended [42] X.M. Liu, J. He, J. Lu, X. Ni, Effect of Liquid Viscosity on a Liquid Jet Produced by
nanomaterials, Nanoscale Res. Lett. 7 (2012) 1–10. the collapse of a Laser-Induced Bubble near a Rigid Boundary, Jpn. J. Appl. Phys.
[25] S.M. Sohel Murshed, S. Tan, N. Nguyen, Temperature dependence of interfacial 48 (2009), 016504-1–016504-5.
properties and viscosity of nanofluids for droplet-based microfluidics, J. Phys. D [43] E.M. Englert, A. McCarn, G. Williams, Luminescence from laser-induced bubbles in
Appl. Phys. 41 (2008) 1–5. water-glycerol mixtures: Effect of Viscosity, Phys. Rev. E 83 (2011), 046306-
[26] A. Huminic, G. Huminic, C. Fleaca, F. Dumitrache, I. Morjan, Thermal 1–046306-5.
conductivity, viscosity and surface tension of nanofluids based on FeC
nanoparticles, Powder Technol. 284 (2015) 78–84.
10You can also read