Liquid-Liquid Equilibrium of Deep Eutectic Solvent-Aromatic-Aliphatic Ternary Systems: Experimental Study with COSMO Model Predictions - MDPI
←
→
Page content transcription
If your browser does not render page correctly, please read the page content below
processes
Article
Liquid-Liquid Equilibrium of Deep Eutectic
Solvent-Aromatic-Aliphatic Ternary Systems:
Experimental Study with COSMO Model Predictions
Kyle McGaughy and M. Toufiq Reza *

                                          Department of Biomedical and Chemical Engineering and Sciences, Florida Institute of Technology,
                                          150 West University Blvd, Melbourne, FL 32901, USA; kmcgaughy2019@my.fit.edu
                                          * Correspondence: treza@fit.edu

                                          Abstract: Common solvents used for aromatic extraction from aliphatics typically degrade into toxic
                                          compounds, while green alternatives perform poorly compared to the state-of-the-art solvents. Deep
                                          eutectic solvents (DES) are a novel solvent type made of hydrogen bond donors (HBD) and hydrogen
                                          bond acceptors (HBA). DES have been applied in various applications, including advanced separa-
                                          tions. In this study, DES were studied experimentally and using the Conductor-like Screening Model
                                          (COSMO) to separate benzene from cyclohexane as model compounds for an aromatic:aliphatic sys-
                                          tem. Both equilibrium and kinetic studies were performed to determine the liquid liquid equilibrium
                                          (LLE) and mass transfer rate for the DES-based separation. Selected HBAs including tetrabutylam-
                                          monium bromide (N4444Br), tetrahexylammonium bromide (N6666Br), choline chloride (ChCl), and
                                          methyltriphenylphosphonium bromide (METPB) were paired with HBDs including ethylene glycol

                                   (EG) and glycerol (Gly). COSMO was used, with adjustments to reflect DES specific interactions, to
                                          predict the liquid-liquid equilibrium (LLE). COSMO results showed that ChCl and N6666Br-based
Citation: McGaughy, K.; Reza, M.T.
                                          DES extracted too little benzene or too much cyclohexane, respectively, to be considered for exper-
Liquid-Liquid Equilibrium of Deep
                                          imental evaluation. Overall, the COSMO model predictions for LLE of EG-based DES were very
Eutectic Solvent-Aromatic-Aliphatic
Ternary Systems: Experimental Study
                                          accurate, with root-mean-square deviations (RMSD) below 1% for both N4444Br:EG and METPB:EG.
with COSMO Model Predictions.             The glycerol systems were less accurately modeled, with RMSD’s of 4% for N4444Br:Gly and 6% for
Processes 2021, 9, 1169. https://         METPB:Gly. The lower accuracy of glycerol system predictions fmay be due to limitations in COSMO
doi.org/10.3390/pr9071169                 for handling glycerol’s influence on polarizability in the DES that is not seen in EG-based DES. Mass
                                          transfer kinetics were determined experimentally for DES and the results were fit to a first order
Academic Editors: Weize Wu,               kinetics model. METPB:Gly had the highest mass transfer coefficient at 0.180 min−1 , followed by
Tiancheng Mu and Shuhang Ren              N4444Br:EG at 0.143 min−1 . N4444Br:Gly and METPB:EG had the lowest mass transfer coefficients
                                          at 0.096 min−1 and 0.084 min−1 , respectively. It was found that mass transfer rate was not directly
Received: 1 June 2021
                                          related to maximum benzene solubility, as N4444Br:EG and METPB:Gly had the highest and lowest
Accepted: 3 July 2021
                                          benzene removal, respectively, but had similar mass transfer coefficients.
Published: 5 July 2021

                                          Keywords: deep eutectic solvents; mass transfer kinetics; COSMO; aromatic extraction
Publisher’s Note: MDPI stays neutral
with regard to jurisdictional claims in
published maps and institutional affil-
iations.
                                          1. Introduction
                                               Benzene, toluene, and xylene (collectively referred to as BTX) are common contami-
                                          nants in hydrocarbon mixtures that must be removed before the hydrocarbons can be used
Copyright: © 2021 by the authors.
                                          in most processes. C6 –C8 mixtures derived from petroleum fractionalization typically have
Licensee MDPI, Basel, Switzerland.
                                          10–20 mass% BTX. For these mixtures, benzene is particularly problematic as it has nearly
This article is an open access article
                                          the same boiling point as cyclohexane at around 80–81 ◦ C. Thus, mixtures containing ben-
distributed under the terms and           zene and cyclohexane cannot be separated by thermal distillation and must be purified with
conditions of the Creative Commons        solvent extraction. Sulfolane is the most common solvent used in aromatic extraction [1].
Attribution (CC BY) license (https://     Though effective, with a 99% removal rate for aromatics, sulfolane is a hazardous chemical
creativecommons.org/licenses/by/          that breakdowns into toxic compounds in the environment [2,3]. Sulfolane is used at high
4.0/).                                    temperatures above 120 ◦ C and must therefore also be at high pressures (6–9 atm) to keep

Processes 2021, 9, 1169. https://doi.org/10.3390/pr9071169                                                https://www.mdpi.com/journal/processes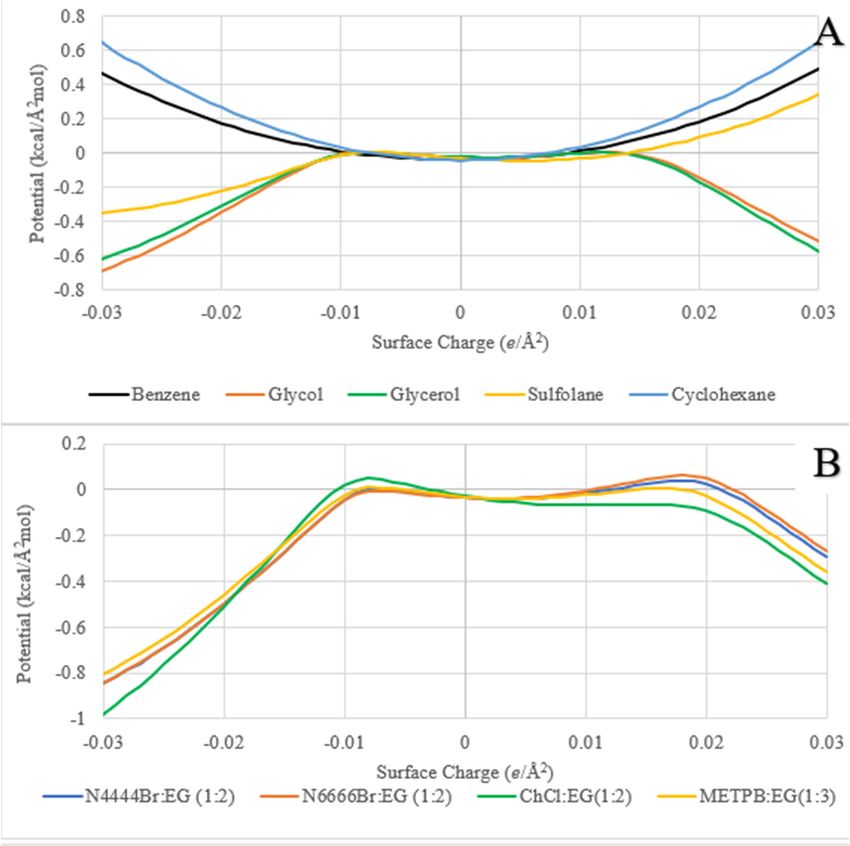
Processes 2021, 9, 1169                                                                                           2 of 15

                          species such as benzene and cyclohexane in the liquid phase [1]. If a solvent with a lower
                          melting point but similar polarity could be used, the separation process may become more
                          energy efficient, and extraction can be performed at lower temperatures and pressures.
                          Furthermore, if a green solvent is used then the hazardous byproducts made from e.g.,
                          sulfolane degradation may be avoided. Other chemicals, particularly polar compounds that
                          are immiscible with nonpolar organics, can also be used in aromatic extraction processes.
                          This includes compounds such as ethylene glycol, glycerol, and propylene carbonate [4].
                          However, these compounds do not typically perform well. For instance, ethylene glycol
                          has a low selectivity for aromatics over aliphatic at 10:1 [5,6]. New solvents are needed that
                          are selective while being able to be used at low temperatures.
                                Deep eutectic solvents (DES) are a type of multicomponent solvent, usually made from
                          a salt or metal halide and acid, that combine to form a liquid at ambient conditions. There
                          is usually one specific ratio, the eutectic ratio, that has a minimized melting point which
                          is below the melting point of either individual component. Oftentimes DESs’ physical
                          properties vary by changing the component pairing as well as the ratio that the components
                          are mixed at. This means that DES can be tailored to meet task-specific requirements like
                          viscosity, density, or polarity just by adjusting the species and mixing ratio. Components
                          that have been shown to form DES through hydrogen interactions include hydrogen
                          bond acceptors (HBA) of quaternary phosphonium and ammonium salts along with
                          hydrogen bond donors (HBD) of nearly any compound with an acidic hydrogen [7–9].
                          These components form Type III DES, which are the most promising candidates for selecting
                          green solvents (Type I use metal chlorides and Type II use metal hydrates which often
                          contain heavy or toxic metals).
                                DES are excellent candidates for the removal of BTX from aliphatic phases as common
                          Type III DES have already been shown to have high selectivity for aromatic compounds.
                          Kareem et al found that methyltriphenylphosphonium bromide (METPB) and ethylene
                          glycol (EG) at a 1:2 molar ratio forms a Type III DES that is more selective for aromatics
                          in hexane than sulfolane (selectivity ratio of 80 compared to 60 for DES and sulfolane
                          respectively) [10]. Existing literature on DES used for the removal of BTX from aliphatic
                          solvents includes a limited range of tetraalkylammonium salts, monohydroxyl ammonium
                          salts, and phosphonium salts. Hadj-Kali et al. summarized the literature on this topic in
                          a 2017 review [11]. In general, the review found that DES have a selectivity between 20
                          and 50 of benzene over cyclohexane at infinite dilution, so while some DES outperform the
                          state of the art in BTX selectivity, not all DES do. Furthermore, the experimental methods
                          used did not consider kinetics of mass transfer for the aromatics into the DES, which is
                          needed to evaluate any process model for extraction.
                                To select and evaluate best performing DES, modeling methods are used to expedite
                          experimental evaluation. Most methods need adjustments to account for the hydrogen
                          bonding that occurs in the DES, but the extent and type of bonding varies even within
                          the category of Type III DES [12–14]. Even models based on empirical data can still fit
                          poorly though. Non-random two-liquid (NRTL) modeling, for example, has been used to
                          predict sodium chloride solubility accurately in DES made of ethyltriphenylphosphonium
                          bromide:ethylene glycol (1:3 molar ratio) with error below 4%. However, the same method
                          had an error of 11–25% compared to experimental measurements for sodium chloride
                          solubility in tetrabutylphosphonium bromide:ferric (III) chloride [12]. An additional
                          complication is that the hydrogen bonding in the eutectic interact not only influences
                          the polar portions of the DES components, but all types of electrostatic interactions [15].
                          While empirical modeling methods can be modified to consider these types of complex
                          electrostatic influences caused by solvent dipolarity, the same method might not work
                          for similar systems of DES. Predictive modeling based on molecular properties, such as
                          electron density, would better fit the unique interactions seen in DES.
                                The Conductor Screening Model (COSMO) is part of the COSMOthermTR software
                          suite from Dassault Systèmes SE (previously Cosmologic.de) that predicts electron density
                          distribution in molecules via density functional theory (DFT) [16]. This method of first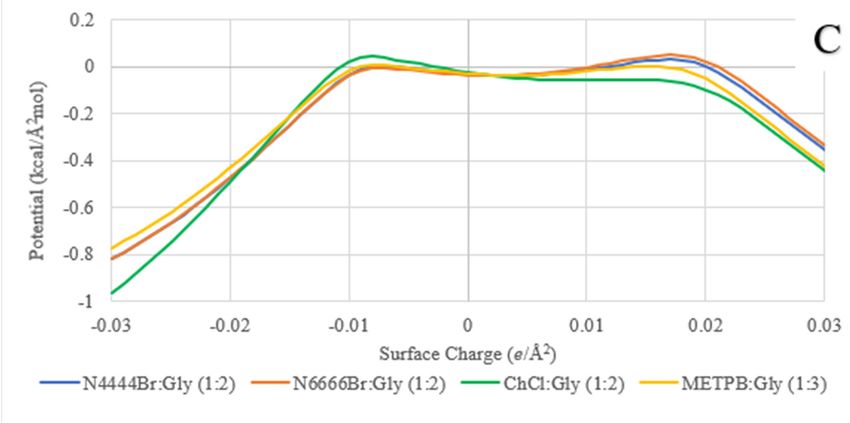
Processes 2021, 9, 1169                                                                                          3 of 15

                          modeling electron density on the surface of a molecule and then examining electrostatic
                          interactions better fits the complex ways that DES components interact with themselves and
                          solutes. The maximum solubility of benzene and hexane have been accurately predicted in
                          DES using COSMO, with an average root mean square deviation (RMSD) of 5% [17,18].
                          Though this is not complete LLE data, it is promising. Adjustments need to be made to the
                          molecular modeling method to limit the shortcomings that COSMO and generate accurate
                          LLE predictions for a wide variety of DES.
                                One common simplification for aliphatic-aromatic separation is assuming that the
                          system is made entirely of cyclohexane and benzene. However, Hadj-Kali et al.’s 2017
                          review found that cyclohexane systems were particularly difficult to model in COSMO,
                          with root-mean square deviations (RMSD) averaging around 30% [11,18]. Meanwhile,
                          Salleh et al. were able to use COSMO to qualitatively rank various Type III DES for their
                          ability to remove benzene from cyclohexane, although, their work was not able to achieve
                          RMSD’s below 30% using the COSMO modeling method [18]. Predicted selectivities of
                          benzene compared to cyclohexane were generally below 5, with a few exceptions. These
                          are far lower than the selectivities reported in the other studies included in Hadj-Kali
                          et al.’s review, so while maximum solubility can be predicted with acceptable accuracy,
                          more complicated phase equilibria require further corrections.
                                The COSMO method can be modified to increase accuracy and this has been demon-
                          strated with aqueous phase extraction processes recently with furfural, where modeling
                          error was below 5% [19]. Modeling the DES components as they behave in solution results
                          in this increased predictive accuracy. HBA are modeled as wholly independent cations and
                          anions with their ionic charges distributed across the molecule, which maintains charge
                          neutrality in the solvent. Additionally, using methodology that better considers the effect
                          of polarization increases accuracy. The tri-zeta valence-polarized (TZVP) method can be
                          used, at the expense of additional computational time, to consider the polarizability effects
                          in DES. Even with increased accuracy COSMO does not give information on the kinetics of
                          mass transfer, which are vital for both evaluating DES and for designing processes to com-
                          pete with the state-of-the-art. To the authors’ knowledge there is currently no publication
                          on the mass transfer kinetics of any DES used in a strictly hydrocarbon aliphatic-aromatic
                          extraction process.
                                The COSMOtherm software suite, along with an understanding of electrostatic model-
                          ing, can be used to quickly determine whether a DES is compatible for aromatic removal
                          from aliphatics. If this method can be completed with a higher accuracy than what has
                          been reported in existing literature, this selection methodology would be far faster than
                          simply experimentally evaluating all possible DES. This would only give the equilibrium
                          conditions though, where mass transfer kinetics are also needed to complete a process
                          model that could evaluate the performance of candidate DES. To this end, this study will
                          use COSMO modeling for DES selection by first screening solvents then taking experimen-
                          tal measurements that confirm model accuracy as well as determine mass transfer kinetics.
                          Exploring new solvent extraction processes with DES requires both equilibrium and ki-
                          netics data. Screening with accurate model prediction followed by kinetics measurements
                          would aid in the development of DES based extraction processes.

                          2. Materials and Methods
                          2.1. Cosmo Methods
                               The following versions were used for each module of the COSMO modeling suite
                          which is copyright of Dassault Systems (formerly copyrighted by COSMOLogic); TmoleX
                          (TmoleX version 4.4.1), COSMOConfx (COSMOconfX Version 4.3 Revision 4677:4678
                          M), COSMOtherm (COSMOtherm Version 19.0.4 Revision 4825:4826). When possible,
                          molecules were used directly from the COSMOtherm molecular database COSMOBase
                          (Version 19.0). All geometric conformers were also taken from this database when available.
                          For molecules not included in the COSMOBase database modeling began by creating the
                          molecule in TmoleX. For all molecules the initial geometric conformer used was one of
Processes 2021, 9, 1169 4 of 15
optimal geometry. SP3 hybridized atoms had a tetrahedral configuration, SP2 atoms had a
trigonal configuration, etc. Bond lengths and dihedral angles were determined by the auto-
matic ‘clean up’ operation in TmoleX that optimized for geometric spacing. Final values for
bond lengths, dihedral angles and bond orders were determined by the TmoleX -based on
molecular geometry, electron distribution and intramolecular electrostatic interactions [16].
For salts, only the cation was modeled in TmoleX; with a designated positive charge. All
modeled components used the BP86 functionals for determining electron density.
Equation (1) shows the fundamental equation of COSMO that determines phase equi-
librium. µs (σ) refers to the potential of a particular surface segment caused by a difference
in electron density difference. Epair is the energy associated with the interaction between the
segment of interest and some nearby surface (σ’). ρs (σ) is the sigma potential of the solution
and T and k and the temperature and Boltzmann constant, respectively. This calculation is
completed for each surface segment of a molecule and all of its neighbors iteratively [16,18].
By modeling the cation independently of the anion, the ions are able to be considered
separately for LLE modeling, while also influencing how TmoleX considered molecular
orbitals of the independent species. Additionally the total surface area considered by
Equation (1) is increased, since the cation and anion are no longer spatially restricted to
one another:
− E pair (σ, σ0 ) + µs (σ0 )
( " #)
µs (σ ) = −kT ln ∑ exp + kT ln(ρs (σ)) (1)
σ0
kT
The output of the TmoleX molecular modeling was also used with the COSMOConfx
program for automatic conformer generation. The preset BP-TVZP-COSMO (Basis Pur-
suit function-Tri Zeta Valence Polarized-COnductor Screening MOdel) job available in
version 4.3 was used to generate the conformers. The ‘Liquid-Liquid Equilibrium (LLE)’
function was used for generating ternary data and tie lines between a DES phase, cyclo-
hexane as a model compound for the aliphatic phase, and benzene as a model for the
aromatic phase. COSMO’s default variables for bonding interaction and parameterization
for temperature were not changed.
The specific DES ratios selected for evaluation was based on literature for the HBA:HBD
ratio that gave the lowest melting point (eutectic ratio) or closest ratio that was a liquid at
25 ◦ C. Additionally, evaluating specifically at the eutectic ratio also gives some consistency
between the different families of DES that are being modeled. Table 1 shows the selected
DES and their eutectic ratio.
Table 1. Selected DES for Initial COSMO Model Screening.
Selected Solvents (HBA:HBD Molar Ratio) Formula Notation
N4444Br:Glycol (1:2) N(C4H9)4Br:(CH2OH)2
N6666Br:Glycol (1:2) N(C6H13)4Br:(CH2OH)2
ChCl:Glycol (1:2) N(CH3)3(C2H4OH)Br:(CH2OH)2
METPB:Glycol (1:3) P(Ph)3(CH3)Br:(CH2OH)2
N4444Br:Glycerol (1:2) N(C4H9)4Br:C3H8O3
N6666Br:Glycerol (1:2) N(C6H13)4Br:C3H8O3
ChCl:Glycerol (1:2) N(CH3)3(C2H4OH):C3H8O3
METPB:Glycerol (1:3) P(Ph)3(CH3)Br:C3H8O3
2.2. Mass Transfer Kinetics and Equilibrium Measurement Methodologies
Mass transfer kinetics were measured experimentally to complement LLE values.
Additionally, these experiments were used to verify the predicted equilibrium conditions.
Mass transfer kinetics were measured for benzene transfer from cyclohexane into select
DES; METPB:EG (1:3), METPB:Glycerol (1:3), N4444Br:EG (1:2), N4444Br:Glycerol (1:2).
These DES were chosen due to promising equilibrium predictions (relatively low solubility
of cyclohexane and high solubility of benzene). For the mass transfer kinetics experiments,
initial concentrations of benzene ranged from 2–10 mass% with a solvent:solute ratio ofProcesses 2021, 9, 1169 5 of 15
1:1.5. DES and the organic phase made of benzene and cyclohexane were mixed in a sealed
flask with stirring at 25 ◦ C in a 65 mm diameter flask with a 25 mm magnetic stir bar.
Stirring rate was varied from 400–600 RPM. The organic phase was regularly sampled and
analyzed using a DR6000 UV-Vis spectrometer (Hach, Loveland, CO, USA) with a quartz
cuvette rated for 190–1100 nm. A Beer-Lambert law calibration at 238.8 nm was made
using benzene in cyclohexane ranging from 3.5 × 10⁻³ to 0.1 mass% benzene. Samples
were then taken at regular intervals until concentration of the benzene was constant to
find concentration at equilibrium. Both benzene’s UV-Vis profile and the Beer Lambert
calibration can be found in the Supplementary Information.
Change in the concentration of benzene in the cyclohexane phase over time can be
defined by Equation (2):
dC (t)
= −kt (2)
dt
where, C(t) is the concentration of benzene, t is time in minutes, and k is the mass transfer
coefficient in minutes−1 . Since the fraction of benzene removed was found to be constant
across the concentration range examined, and this was consistent with literature, benzene
concentration was normalized against the initial concentration [18]. This is shown in
Equation (3):
C (t)
Cn (t) = (3)
Ci
where, Cn is the normalized concentration of benzene and Ci is the initial concentration of
benzene in the cyclohexane phase. Solving Equation (2) with the substitution of normalized
concentration from Equation (3) yields Equation (4), which can be plotted according to
Equation (5) to find the mass transfer coefficient:
Cn (t) = (1 − Ce )e−kt + Ce (4)
where Ce is the equilibrium concentration of benzene in the cyclohexane phase. Note
that Equation (4) has already been solved for the boundary conditions at times of zero
and infinity:
ln(Cn (t) − Ce ) = −kt + ln(1 − Ce ) (5)
The equilibrium concentration of the DES-cyclohexane-benzene system was modeled
in COSMOtherm using the same process as previously described. The predicted concentra-
tion of benzene was compared to the measured concentration to evaluate the accuracy of
the COSMO Model. To ensure that the DES components were not affecting absorbance in
the ultraviolet range, a blank test of each DES with cyclohexane was completed. None of
the DES or individual HBD’s had an effect on the cyclohexane baseline at 238.8 nm.
2.3. Solvatochromic Dye Measurements of Polarizability
Preparation of a solvatochromic dye was done with N,N, diethyl 4-nitroaniline (98%,
Combi-Blocks, San Diego, CA 92126, USA) and acetone (99.5%, Sigma-Aldrich, St. Louis,
MO 63103, USA). The dye was first tested by direct addition to several reference solvents
including; glycerol (99% Acros Organics, Carlsbad, CA 92008, USA), ethylene glycol (99%,
Acros Organics, Carlsbad, CA 92008, USA), deionized (DI) water, cyclohexane (99.9%,
Fisher Scientific, Waltham, MA 02451, USA), Dimethyl sulfoxide (99.9%, Fisher Scientific),
and acetone. The dye was then used with a solvent delivery method to expedite the
experimental process by first preparing a solution of 1.4 × 10⁻⁵ M dye in acetone and then
evaporating the solvent to deliver the dye directly to a cuvette. Samples had a concentration
of 2 × 10⁻⁵ to 2 × 10⁻⁷ M when measured by the UV-Vis. These measurements were
within 0.01 abs of the direct addition measurements. The solvent delivery method was
used for all measurements presented in this study.
DES were prepared to be evaluated by the solvatochromic dye. The following chem-
icals were used for the DES; glycerol (99% Acros Organics), ethylene glycol (99%, Acros
Organics), Choline Chloride (99%, Acros Organics), methyltriphenylphosphonium bro-Processes 2021, 9, 1169 6 of 15
mide (98%, TCI), tetrahexylammonium bromide (98%, Alfa Aesar, Tewksbury, MA 01876,
USA), and tetrabutylammonium bromide (98%, Alfa Aesar, Tewksbury, MA 01876, USA).
The DES were prepared according to the ratios from Table 1. DES components were first
combined at the specified ratios in a sealed flask at room temperature and then heated to
50 ◦ C on a heating plate with gentle mixing. DES were allowed to cool to room temperature
(20 ◦ C) under natural cooling and were sealed with Parafilm to prevent any moisture
uptake from the environment. Dipolarity was calculated from Equation (6):
V Solvent − V DMSO
π∗ = (6)
V Cyclohexane − V DMSO
where V is the wavenumber of the peak of absorbance for 4,4-nitroaniline in either the
solvent, cyclohexane, or dimethyl sulfoxide (DMSO) as noted [20]. In this scale the solvent
dipolarity is normalized between cyclohexane and DMSO at 0 and 1, respectively.
3. Results
3.1. COSMO Model DES Results: Electron Density
One of the main outputs of the COSMO model is the electron density (resulting from
Equation (1)), also known as sigma or σ, that is often plotted for the molecules involved in
the model. These plots are referred to as sigma profiles where the area of sigma, ρ(µ), is
plotted against surface electron density (µ). The total area under the curve of these profiles
is the total area of the molecule. Figure 1A shows the sigma profiles of pure solvents
sulfolane, ethylene glycol, and glycerol as well as cyclohexane and benzene.
Benzene has two peaks where the electron rich peak at 0.006 e/Å2 belongs to the
delocalized aromatic π bonds and the electron deficient peak at −0.006 e/Å2 belongs to the
hydrogens. Please note that the sigma profile plot does not sum to zero across all density
values. It is not uncommon for there to be more surface area on either the electron rich
or deficient side. A solvent can be expected to favorably interact with benzene if it has
corresponding peaks that are electron rich or deficient. Sulfolane, for example, has two
distinct peaks at −0.006 and 0.013 e/Å2 . The first peak is the electron deficient that shows
the hydrogens that line the cyclic carbons. The electron rich peak is due to the sulfur and
oxygen. Notably sulfolane does not have significant surface area that is charge neutral.
Benzene occupies the electron rich sulfur-oxygen area of sulfolane when absorbed, while
the electron deficient ring portion of sulfolane interacts with adjacent sulfolane [21].
Ethylene glycol and glycerol have very similar sigma profiles as shown in Figure 1A.
Despite being the molar minority compound in all of the DES involved in this study, the
HBA dominates the sigma profiles of the DES. Figure 1B,C show the sigma profiles of
ethylene glycol and glycerol-based DES, respectively. For the quaternary ammonium
bromide salts, N4444Br and N6666Br, the non-polar arms of the salts overshadow the
polar portions of their corresponding HBD in areas that are electron deficient. N4444Br
containing DES and N6666Br containing DES have electron deficient peaks at −0.004
and −0.002 e/Å2 , respectively, well below the hydrogen bonding donating threshold of
−0.0081 e/Å2 [16,22]. The sharp, electron rich peak in all DES is due to the halide, which is
the most electron dense portion of any of the DES. This peak is located at 0.017 e/Å2 for
bromide and 0.019 e/Å2 for chloride containing DES. The method of separate modeling of
the HBA cation and anion increases the total area considered by Equation (1). Most notably
the area of available interaction of the halide anion increases as it is no longer at a fixed
position relative to the cation.
METPB based DES have an additional peak at 0.002 e/Å2 when paired with both
glycerol and ethylene glycol. This peak is due to π bonds in the phenyl functions groups,
which notably are less electron rich than benzene itself. This may be advantageous for
promoting HBD-benzene interactions, as the phenyl groups are less electronegative than
benzene. Choline chloride containing DES has the most electronegative peak, occurring
around −0.009 e/Å2 , just beyond the hydrogen bonding threshold. Though the nitrogenProcesses 2021, 9, x FOR PEER REVIEW 7 of 17
ethylene glycol and glycerol-based DES, respectively. For the quaternary ammonium bro-
mide salts, N4444Br and N6666Br, the non-polar arms of the salts overshadow the polar
Processes 2021, 9, 1169 7 of 15
portions of their corresponding HBD in areas that are electron deficient. N4444Br contain-
ing DES and N6666Br containing DES have electron deficient peaks at −0.004 and −0.002
e/Å2, respectively, well below the hydrogen bonding donating threshold of −0.0081 e/Å2
[16,22].
atom The sharp,
already electron
has four richgroups
function peak inand
all DES is due tocharged,
is positively the halide,
thiswhich
showsishow
the most
uncovered
electron dense portion of any of the DES. This peak is located at 0.017 e/Å2 for bromide
it is compared to the nitrogen atom in either N4444Br or N6666Br. Choline chloride also
and 0.019 e/Å2 for chloride containing DES. The method of separate modeling of the HBA
has the lowest charge neutral characteristic of any of the DES. Given the expectedly large
cation and anion increases the total area considered by Equation (1). Most notably the area
contribution of van der Waals interactions to benzene solubility this may inhibit benzene
of available interaction of the halide anion increases as it is no longer at a fixed position
solubility
relative tocompared
the cation. to the other DES [23].
Figure 1. Sigma Profiles of (A) Pure Solvents and Solutes (B) Ethylene Glycol Based DES and
(C) Glycerol Based DES.
Along with the electron density profiles presented, another key output from COSMO
is the sigma potential, or µ(σ), profile which shows how favorable an interaction is between
a molecule and a surface of a specific charge. A key difference between the sigma profile
and sigma potential profile is that while the X-axis in both cases is e/Å2 in the sigma profile
this value is attributed to the molecule itself and in the sigma potential profile this value
is attributed to a surface that is interacting with the molecule. These profiles can usually
be considered complements of one another. A larger surface area in the electron deficientProcesses 2021, 9, 1169 8 of 15
region on a sigma profile, the more favorable an interaction that is predicted on the electron
rich region of a sigma potential profile. This is exactly what is seen with glycerol and
ethylene glycol in Figure 2A. The electron deficient regions shown in Figure 1 for these
species are due to hydrogens that are available for hydrogen bonding. These corresponds
with a negative potential when interacting with electron rich surfaces, which would those
that can accept hydrogen bonds. Though these thresholds for charges, above and below
±0.0081 e/Å2 , are typically framed by considering hydrogen bonding it is important to
consider when hydrogen bonding is not available. For example, sulfolane has a large
surface area that is electron deficient due to the strong electron withdrawing effects of the
SO2 group, but this area cannot contribute to hydrogen bonding as there are no eligible
Processes 2021, 9, x FOR PEER REVIEW 9 of 17
hydrogens attached to either a halide, oxygen, or nitrogen.
Figure 2. Sigma Potential of (A) Pure Solvents and Benzene (B) Ethylene Glycol Based DES and (C)
Figure 2. Sigma Potential of (A) Pure Solvents and Benzene (B) Ethylene Glycol Based DES and
Glycerol Based DES.
(C) Glycerol Based DES.
3.2. Solvatochromic Dye Measurement Results
While COSMO gives preliminary information on the distribution of positive and neg-
ative surface charges it does not give polarizability. This is important as approximately
25% of the driving force for benzene solubility in polar solvents can be attributed to polarProcesses 2021, 9, 1169 9 of 15
The sigma potential profiles, µ(σ), for pure solvents are shown in Figure 2A. There are
three basic types of profiles. Benzene and cyclohexane favor interactions with neutrally
charged surfaces, with the minimum potential occurring around 0 e/Å2 . Sulfolane has a
local minimum between the 0 and the hydrogen bonding threshold around 0.081 e/Å2 ,
showing a combination of favorable interactions with both neutrally charged surfaces and
those with slight electron density. Sulfolane also has an increasingly favorable interaction
displaying as a global minimum with electron deficient surfaces that can interact with
the electron rich SO2 group. Glycol and glycerol both have favorable interactions with
electron rich and deficient surfaces beyond ±0.081 e/Å2 and less favorable, but still below a
potential of 0 kcal/mol × Å2 , interactions with neutral surfaces. All of the DES have similar
profiles to their respective HBD’s, as shown in Figure 2B,C for ethylene glycol and glycerol,
respectively. One important distinction between the pure HBD and the DES is that all
DES have a peak, unfavorable potentials around the electron deficient hydrogen bonding
threshold of −0.081 e/Å2 and electron rich surfaces with approximately 0.015–0.017 e/Å2 .
The unfavorable interactions around 0.015–0.017 e/Å2 are due to the HBA anion, which
are increased due to the method of modeling cation and anion separately. The key point for
these DES is that hydrogen bonding with additional solutes is less favorable than strong
electrostatic interactions as the hydrogen bonding is what is allowing the DES to be a stable
liquid at room temperature [13].
3.2. Solvatochromic Dye Measurement Results
While COSMO gives preliminary information on the distribution of positive and
negative surface charges it does not give polarizability. This is important as approximately
25% of the driving force for benzene solubility in polar solvents can be attributed to po-
lar interactions, while the remaining 75% can be attributed to nonpolar forces [23]. To
determine dipolarity solvatochromic dyes were used. Table 2 shows the experimentally
measured dipolarity of both DES and HBD. The DES all have very similar polarizability
with values ranging from approximately 1.10 to 1.20. All glycerol-based DES have polariz-
ability similar glycerol itself. METPB:EG has a slightly higher value than ethylene glycol
at 1.22 ± 0.02 and 1.02 ± 0.02, respectively. N4444Br:EG and ChCl:EG are also higher
than ethylene glycol at 1.09 ± 0.02 and 1.10 ± 0.04, respectively. N4444Br:Gly has a high
polarizability given its HBD. DES made from N4444Br typically have π* values ranging
from 0.98–1.08, with the highest values occurring at the eutectic point [24]. Unlike N4444Br
DES which have relatively consistent polarizability, ChCl containing DES have been shown
to have polarizability that varies significantly with different HBD’s from π* values of 0.82
for ammonium thiocyanate to 1.15 with ethylene glycol as measured here [25].
Table 2. Polarizability of DES and Reference Solvents.
Solvent Relative Polarizability (π*)
Cyclohexane 0
DMSO 1
Ethylene Glycol 1.02 ± 0.02
Glycerol 1.15 ± 0.02
METPB:EG (1:3) 1.22 ± 0.03
N4444Br:EG (1:2) 1.09 ± 0.02
ChCl:EG (1:2) 1.10 ± 0.04
ChCl:Glycerol (1:2) 1.15 ± 0.02
METPB:Glycerol(1:3) 1.15 ± 0.02
N4444Br:Glycerol (1:2) 1.18 ± 0.02
There is a large range of benzene solubility amongst the selected DES, from 0.08 g
benzene/g solvent for ChCl:Glycerol to full miscibility for N4444Br:EG. However, the
polarizability of these DES are similar, suggesting that the polarizability of the DES is not the
dominant factor for aromatic-aliphatic separation. This is consistent with literature finding
that nonpolar forces account for nearly 75% of the attractive forces in benzene solubilityProcesses 2021, 9, 1169 10 of 15
in polar solvents [23]. Differences in solvent polarizability are still important, as will be
discussed in Section 3.3. Glycerol containing DES are shown to have less accurate LLE
predictions than EG containing DES. The consistent polarizability of glycerol containing
DES may be due to weaker interactions than between the HBA and HBD in ethylene glycol-
based DES. This is significant, as polarizability is the main difference between these DES,
given that electron density distribution and surface potential (Figures 1 and 2 respectively)
are nearly identical for EG and glycerol-based DES.
3.3. Liquid-Liquid Equilibrium of DES and Benzene
The equilibrium concentration of benzene in cyclohexane was both experimentally
measured and predicted with COSMOtherm using the profiles shown in Section 3.1 with
Equation (1). The initial concentration of benzene was between 2 and 10 mass% with a
DES:organic phase mass ratio of 1:1.5. A summary of experimental and model predictions is
shown in Table 3. Overall, the COSMO predictions for ethylene glycol-based DES were very
accurate, with RMSD below 1% for both N4444Br:EG and METPB:EG. The glycerol systems
were less accurately modeled by COSMO, with RMSD’s of 4% for N4444Br:Glycerol and
6% for METPB:Glycerol. In both cases the glycerol containing DES performed slightly
worse than predicted. The lower accuracy for the glycerol containing DES may be due to
its consistent polarizability, as discussed in Section 3.2. COSMO may be overpredicting
the interactions between glycerol and its HBA which results in higher predicted aromatic
extraction than is observed.
Table 3. Experimental and Model Predictions for DES Performance.
Predicted Max % Benzene
Benzene Removal RMSD
DES
Solubility (At Experimental (COSMO Prediction)
(g Solute/g Solvent) Conditions)
N4444Br:EG Miscible 30 ± 1Processes2021,
Processes 2021,9,
9, 1169
x FOR PEER REVIEW 12 of 17 11 of 15
Figure 3. (A) Predicted LLE of N4444 Br:EG (1:2), Cyclohexane and Benzene at 25 ◦ C. Concentra-
tions in Mass Fraction; (B) Predicted LLE of METPB:Gly (1:3), Cyclohexane and Benzene at 25 ◦ C.
Figure 3. (A) Predicted LLE of N4444Br:EG (1:2), Cyclohexane and Benzene at 25 °C. Concentrations
Concentrations in Mass Fraction.
in Mass Fraction; (B) Predicted LLE of METPB:Gly (1:3), Cyclohexane and Benzene at 25 °C. Con-
centrations
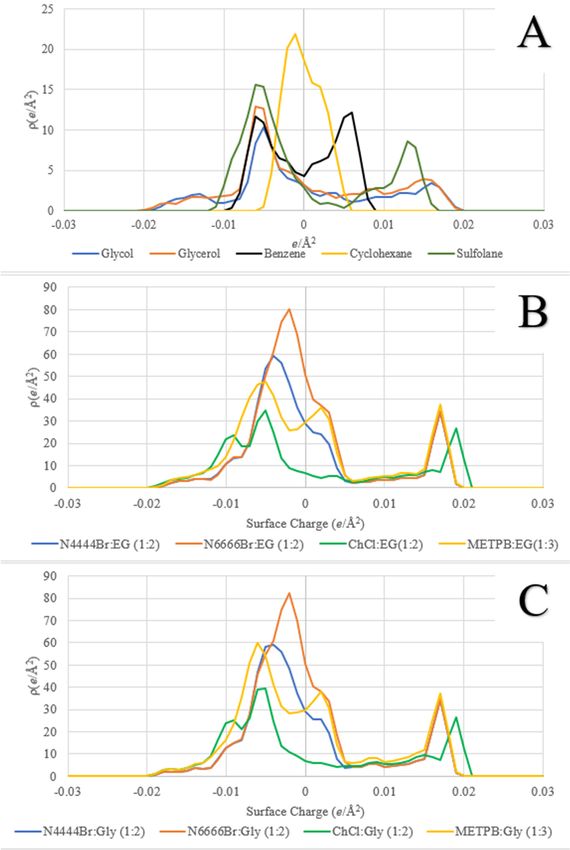
3.4. Mass in Transfer
Mass Fraction.
Kinetics
The
3.4. Mass mass transfer
Transfer Kinetics kinetics of benzene moving from the cyclohexane phase into the DES
phase
The were
mass determined by fitting
transfer kinetics first order
of benzene moving equilibrium kinetics described
from the cyclohexane phase intointhe
Equation (5).
Figure
DES phase4 were
shows the linearbyfitfitting
determined of each firstDES
orderusing Equation
equilibrium (5), where
kinetics theinslope
described Equa-is the mass
transfer
tion coefficient
(5). Figure 4 shows k.the
Each coefficient,
linear fit of each along
DES with
usingthe predicted
Equation and measured
(5), where equilibrium
the slope is
concentration,
the mass transfer is shown ink.Table
coefficient 4. A sample
Each coefficient, set of
along data
with theusing an initial
predicted mass concentration
and measured
of 2% benzene
equilibrium is shownis in
concentration, Figure
shown 5 alongside
in Table the predicted
4. A sample concentration
set of data using using the time
an initial mass
concentration
coefficientsofof2% benzene
each DES.isOverall,
shown infirst Figure 5 alongside
order kineticsthe fitpredicted concentration
each examined DES well with
using
eachthe time
one coefficients
showing of each
a linear fitDES. Overall,
in Figure 5.first
Theorder
range kinetics
of timefit each examined DES
to equilibrium is consistent
well
withwith eachstudies
other one showing
looking a linear fit in transfer
at mass Figure 5. into
The range
DES. of Atime to equilibrium
similar is
study examining the
consistent with other studies looking at mass transfer into DES. A similar
removal of polyphenol species from solid biomass using glycerol-based DES was shown to study examining
the removal of polyphenol species from solid biomass using glycerol-based DES was
have extraction times of 40–60 min to reach equilibrium, but with a second order kinetics
shown to have extraction times of 40–60 min to reach equilibrium, but with a second order
model [26].
kinetics model [26].
All other DES had lower amounts of overall benzene removal then N4444Br:EG.
METPB:Gly reached equilibrium the fastest with a time constant of 0.180 min−1.Processes 2021, 9, 1169 12 of 15
Processes 2021, 9, x FOR PEER REVIEW 14 of 17
-1
-2
A
-3
ln(Cn-Ce)
-4
-5
-6
0 5 10 15 20 25 30
Time (Minutes)
N4444Br:Gly METPB:EG
Linear (N4444Br:Gly) Linear (METPB:EG)
-1
-2
B
-3
ln(Cn-Ce)
-4
-5
-6
-7
0 5 10 15 20
Time (Minutes)
N4444Br:EG METPB:Gly
Linear (N4444Br:EG) Linear (METPB:Gly)
Figure4.4. First
Figure OrderKinetic
First Order KineticFitFit
forfor
(A)(A) N4444Br:Gly
N4444Br:Gly and and METPB:EG
METPB:EG and
and (B) (B) N4444Br:EG
N4444Br:EG and and
METPB:Gly.
METPB:Gly.
Table 4. Time Coefficient and Error Times for Benzene Mass Transfer into DES from Cyclohexane
at 25 ◦ C.
Predicted Ce /Ci Measured Ce /Ci
DES k (min−1 )
(Benzene in Cyclohexane) * (Benzene in Cyclohexane)
N4444Br:EG (1:2) 0.143 0.70 0.70 ± 0.01
N4444Br:Gly (1:2) 0.096 0.80 0.80 ± 0.02
METPB:EG (1:3) 0.084 0.81 0.81 ± 0.02
METPB:Gly (1:3) 0.180 0.91 0.91 ± 0.01
* Values for predicted Ce /Ci varied byProcesses 2021, 9, 1169
Processes 2021, 9, x FOR PEER REVIEW 13 of 15 15 of 1
1
0.95
Benzene Concentration
in Cyclohexane (Cn)
0.9
0.85
0.8
0.75
0.7
0 5 10 15 20 25 30 35 40
Time (minutes)
N4444Br:EG N4444Br:Gly METPB:EG
METPB:Gly N4444Br:EG Model N4444Br:Gly Model
METPB:EG Model METPB:Gly
Figure 5. Normalized Benzene Concentration in Cyclohexane; Sample Kinetics for Initial Concentra-
Figure 5. Normalized Benzene Concentration in Cyclohexane; Sample Kinetics for Initial Concentration of 2 Mass% Ben-
tion of 2 Mass% Benzene.
zene.
All other DES had lower amounts of overall benzene removal then N4444Br:EG.
4. Conclusions
METPB:Gly reached equilibrium the fastest with a time constant of 0.180 min−1 . N4444Br:Gly
and METPB:EG hadCOSMO modeling
lower time wasatused
coefficients 0.096toand
both determine
0.084 the electron N4444Br:Gly
min−1 respectively. density distribution o
various DES and to predict liquid-liquid equilibrium between
and METPB:EG have similar behavior in most regards from the kinetics shown here benzene, cyclohexane,
and an
DES. Separate modeling of the HBA cation and anion, along with usage of the TZVP bas
benzene removal (20 and 19% respectively), but had a significant difference in the amount of
set resulted in more accurate predictions of LLE. Hydrogen bond donors of ethylene gly
cyclohexane leached into the DES phase (9 and 2 mass% respectively).
col and glycerol were found to dominate the total area considered positive and negativel
Interestingly, METPB:Gly reaches equilibrium faster than METPB:EG, while N4444Br
charged. Meanwhile, the DES containing the hydrogen bond acceptor choline chlorid
has the opposite with N4444Br:EG having faster transfer than N4444Br:Gly. METPB:Gly
was far lower in neutrally charged surface area than tetrabutylammonium bromide, te
containing DES removed the least amount of benzene, but had the highest time coeffi-
rahexylammonium bromide, and methyltriphenylphosphonium bromide containin
cient. It is possible that METPB:Gly having such a low affinity for cyclohexane makes up
DES. This resulted in a far lower solubility of benzene for choline chloride containing DE
for the lesser initial and equilibrium concentration difference (shown as the intercept of
than all other DES, confirming that nonpolar interactions are more dominant in determin
ln(Cn − Ce ) ining
Figure 4). This
benzene suggests
solubility thanthat mass
polar transfer
forces. Phaseisequilibrium
not dependent solely on the
measurements taken of mix
HBA or the HBD, tures between DES and cyclohexane solutions with 2–10 mass% benzenefrom
but rather the DES. While this makes predicting DES performance demonstrate
just HBA or HBD properties
that the COSMOmore modeldifficult, it also
had a very highjustifies
accuracythein continued usefinal
predicting the of experi-
LLE if given th
mental methodologies for evaluating
initial conditions. DES
Overall, even
the COSMOif equilibrium conditions
predictions can be
for ethylene accurately DES wer
glycol-based
estimated by modeling methods
very accurate, with such
RMSD asbelow
the COSMO method
1% for both used in this
N4444Br:EG andwork.
METPB:EG. The LLLE o
glycerol systems were less accurately modeled by COSMO, with RMSD’s of 4% fo
4. Conclusions
N4444Br:Glycerol and 6% for METPB:Glycerol.
COSMO modeling Futurewas
work used to both determine
in applying DES shouldthe electron
utilize density distribution
the methodologies outlinedofin this wor
various DES and to aid in the selection and evaluation of candidate solvents. Given the wide and
to predict liquid-liquid equilibrium between benzene, cyclohexane, variety of DE
DES. Separate available,
modelingand of the
newHBA
DEScation and continue
that will anion, along
to bewith usage ofthere
discovered, the TZVP
should basis
be a focus o
set resulted in first
moredeveloping
accurate predictions
methodology of LLE. Hydrogen the
for evaluating bond donors
unique of ethylene
challenges glycol by usin
presented
and glycerol were
DES andfound toevaluation
then dominatein the total area
specific considered
applications. For positive
aromatic and negatively
extraction, the selection o
DES thatthe
charged. Meanwhile, haveDESa mixture of polar
containing theand non-polar
hydrogen character
bond withcholine
acceptor high polarizability
chloride shoul
was far lower inbe neutrally
a priority.charged
DES such as METPB:EG
surface area thanseem the most promising,
tetrabutylammonium with a high
bromide, tetra-single pas
hexylammonium removal rate ofand
bromide, 20 mass% benzene, and a relatively low
methyltriphenylphosphonium uptake
bromide of cyclohexane.
containing DES.
This resulted in a far lower solubility of benzene for choline chloride containing DES than
all other DES, confirming that nonpolar interactions are more dominant in determining
benzene solubility than polar forces. Phase equilibrium measurements taken of mixtures
between DES and cyclohexane solutions with 2–10 mass% benzene demonstrated that theProcesses 2021, 9, 1169 14 of 15
COSMO model had a very high accuracy in predicting the final LLE if given the initial
conditions. Overall, the COSMO predictions for ethylene glycol-based DES were very
accurate, with RMSD below 1% for both N4444Br:EG and METPB:EG. The LLLE of glycerol
systems were less accurately modeled by COSMO, with RMSD’s of 4% for N4444 Br:Glycerol
and 6% for METPB:Glycerol.
Future work in applying DES should utilize the methodologies outlined in this work
to aid in the selection and evaluation of candidate solvents. Given the wide variety of DES
available, and new DES that will continue to be discovered, there should be a focus on
first developing methodology for evaluating the unique challenges presented by using
DES and then evaluation in specific applications. For aromatic extraction, the selection of
DES that have a mixture of polar and non-polar character with high polarizability should
be a priority. DES such as METPB:EG seem the most promising, with a high single pass
removal rate of 20 mass% benzene, and a relatively low uptake of cyclohexane.
Supplementary Materials: The following are available online at https://www.mdpi.com/article/
10.3390/pr9071169/s1, Figure S1. Beer-Lambert Relation for Benzene in Cyclohexane at Notable
Absorbance Peaks; Figure S2. UV-Vis Spectra for Benzene in Cyclohexane; Figure S3. Predicted
LLE of N6666Br:EG (1:2), Cyclohexane and Benzene at 25 ◦ C. Concentrations in Mass Fraction;
Figure S4. Predicted LLE of N6666Br:Gly (1:2), Cyclohexane and Benzene at 25 ◦ C. Concentrations
in Mass Fraction; Figure S5. Predicted LLE of METPB:EG (1:3), Cyclohexane and Benzene at 25 ◦ C.
Concentrations in Mass Fraction; Figure S6. Predicted LLE of METPB:Gly (1:3), Cyclohexane and
Benzene at 25 ◦ C. Concentrations in Mass Fraction; Figure S7. Predicted LLE of ChCl:EG (1:2),
Cyclohexane and Benzene at 25 ◦ C. Concentrations in Mass Fraction; Figure S8. Predicted LLE
of ChCl:Gly (1:2), Cyclohexane and Benzene at 25 ◦ C. Concentrations in Mass Fraction; Figure S9.
Predicted LLE of N4444Br:EG (1:2), Cyclohexane and Benzene at 25 ◦ C. Concentrations in Mass
Fraction; Figure S10. Predicted LLE of N4444Br:Gly (1:2), Cyclohexane and Benzene at 25 ◦ C.
Concentrations in Mass Fraction.
Author Contributions: Conceptualization, K.M. and M.T.R.; methodology, K.M. and M.T.R.; soft-
ware, K.M.; validation, K.M.; formal analysis, K.M.; investigation, K.M.; writing—original draft
preparation, K.M.; writing—review and editing K.M and M.T.R.; supervision, M.T.R.; project ad-
ministration, M.T.R.; funding acquisition, M.T.R. All authors have read and agreed to the published
version of the manuscript.
Funding: This research was funded by the American Chemical Society’s Petroleum Research Fund
(PRF # 60342-DNI9).
Institutional Review Board Statement: Not applicable.
Informed Consent Statement: Not applicable.
Data Availability Statement: Not applicable.
Acknowledgments: The authors are thankful to Thomas Quaid from Florida Institute of Technology
for his assistance with experimental measurements.
Conflicts of Interest: The authors declare no conflict of interest. The funders had no role in the design
of the study; in the collection, analyses, or interpretation of data; in the writing of the manuscript, or
in the decision to publish the results.
References
1. Stewart, O. Sulfolane Technical Assistance and Evaluation Report; Alaska Department of Environmental Conservation: Juneau, AK,
USA, 2010.
2. Agatonovic, V.; Vaisman, E. Sulfolane impacted soil and groundwater treatability study. In Proceedings of the Remediation
Technologies Symposium 2005, Banff, AB, Canada, 19–21 October 2005.
3. Bak, A.; Kozik, V.; Dybal, P.; Kus, S.; Swietlicka, A.; Jampilek, J. Sulfolane: Magic Extractor or Bad Actor? Pilot-Scale Study on
Solvent Corrosion Potential. Sustainability 2018, 10, 3677. [CrossRef]
4. Ali, S.H.; Lababidi, H.M.S.; Merchant, S.Q.; Fahim, M.A. Extraction of Aromatics from Naphtha Reformate Using Propylene
Carbonate. Fluid Phase Equilibria 2003, 214, 25–38. [CrossRef]
5. Dai, F.; Xin, K.; Song, Y.; Shi, M.; Zhang, H.; Li, Q. Liquid–Liquid Equilibria for the Extraction of Phenols from Alkane Using
Ethylene Glycol. Fluid Phase Equilibria 2016, 419, 50–56. [CrossRef]Processes 2021, 9, 1169 15 of 15
6. Aspi, K.K.; Surana, N.M.; Ethirajulu, K.; Vennila, V. Liquid−Liquid Equilibria for the Cyclohexane + Benzene + Dimethylfor-
mamide + Ethylene Glycol System. J. Chem. Eng. Data 1998, 43, 925–927. [CrossRef]
7. Abbott, A.P.; Capper, G.; Davies, D.L.; McKenzie, K.J.; Obi, S.U. Solubility of Metal Oxides in Deep Eutectic Solvents Based on
Choline Chloride. J. Chem. Eng. Data 2006, 51, 1280–1282. [CrossRef]
8. Shahbaz, K.; Baroutian, S.; Mjalli, F.S.; Hashim, M.A.; AlNashef, I.M. Densities of Ammonium and Phosphonium Based Deep
Eutectic Solvents: Prediction Using Artificial Intelligence and Group Contribution Techniques. Thermochim. Acta 2012, 527, 59–66.
[CrossRef]
9. Ribeiro, B.D.; Florindo, C.; Iff, L.C.; Coelho, M.A.Z.; Marrucho, I.M. Menthol-Based Eutectic Mixtures: Hydrophobic Low
Viscosity Solvents. ACS Sustain. Chem. Eng. 2015, 3, 2469–2477. [CrossRef]
10. Kareem, M.A.; Mjalli, F.S.; Hashim, M.A.; AlNashef, I.M. Liquid–Liquid Equilibria for the Ternary System (Phosphonium Based
Deep Eutectic Solvent–Benzene–Hexane) at Different Temperatures: A New Solvent Introduced. Fluid Phase Equilibria 2012, 314,
52–59. [CrossRef]
11. Hadj-Kali, M.K.; Salleh, Z.; Ali, E.; Khan, R.; Hashim, M.A. Separation of Aromatic and Aliphatic Hydrocarbons Using Deep
Eutectic Solvents: A Critical Review. Fluid Phase Equilibria 2017, 448, 152–167. [CrossRef]
12. Ghareh Bagh, F.S.; Hadj-Kali, M.K.O.; Mjalli, F.S.; Hashim, M.A.; AlNashef, I.M. Solubility of Sodium Chloride in Phosphonium-
Based Deep Eutectic Solvents. J. Mol. Liq. 2014, 199, 344–351. [CrossRef]
13. Ashworth, C.R.; Matthews, R.P.; Welton, T.; Hunt, P.A. Doubly Ionic Hydrogen Bond Interactions within the Choline Chloride–
Urea Deep Eutectic Solvent. Phys. Chem. Chem. Phys. 2016, 18, 18145–18160. [CrossRef] [PubMed]
14. Faraone, A.; Wagle, D.V.; Baker, G.A.; Novak, E.C.; Ohl, M.; Reuter, D.; Lunkenheimer, P.; Loidl, A.; Mamontov, E. Glycerol
Hydrogen-Bonding Network Dominates Structure and Collective Dynamics in a Deep Eutectic Solvent. J. Phys. Chem. B 2018,
122, 1261–1267. [CrossRef] [PubMed]
15. Pandey, A.; Rai, R.; Pal, M.; Pandey, S. How Polar Are Choline Chloride-Based Deep Eutectic Solvents? Phys. Chem. Chem. Phys.
2013, 16, 1559–1568. [CrossRef] [PubMed]
16. Eckert, F.; Klamt, A. Fast Solvent Screening via Quantum Chemistry: COSMO-RS Approach. AIChE J. 2002, 48, 369–385.
[CrossRef]
17. Rodriguez, N.R.; Gerlach, T.; Scheepers, D.; Kroon, M.C.; Smirnova, I. Experimental Determination of the LLE Data of Systems
Consisting of {hexane+benzene+deep Eutectic Solvent} and Prediction Using the Conductor-like Screening Model for Real
Solvents. J. Chem. Thermodyn. 2017, 104, 128–137. [CrossRef]
18. Salleh, Z.; Wazeer, I.; Mulyono, S.; El-blidi, L.; Hashim, M.A.; Hadj-Kali, M.K. Efficient Removal of Benzene from Cyclohexane-
Benzene Mixtures Using Deep Eutectic Solvents—COSMO-RS Screening and Experimental Validation. J. Chem. Thermodyn. 2017,
104, 33–44. [CrossRef]
19. McGaughy, K.; Reza, M.T. Liquid–Liquid Extraction of Furfural from Water by Hydrophobic Deep Eutectic Solvents: Improvement
of Density Function Theory Modeling with Experimental Validations. ACS Omega 2020, 5, 22305–22313. [CrossRef]
20. Florindo, C.; McIntosh, A.J.S.; Welton, T.; Branco, L.C.; Marrucho, I.M. A Closer Look into Deep Eutectic Solvents: Exploring
Intermolecular Interactions Using Solvatochromic Probes. Phys. Chem. Chem. Phys. 2018, 20, 206–213. [CrossRef] [PubMed]
21. Gutiérrez, A.; Atilhan, M.; Aparicio, S. Microscopic Characterization of CO2 and H2S Removal by Sulfolane. Energy Fuels 2017,
31, 9800–9813. [CrossRef]
22. Klamt, A.; Eckert, F. COSMO-RS: A Novel and Efficient Method for the a Priori Prediction of Thermophysical Data of Liquids.
Fluid Phase Equilibria 2000, 172, 43–72. [CrossRef]
23. Kumar, N.; Naik, P.K.; Banerjee, T. Molecular Modeling Insights in the Extraction of Benzene from Hydrocarbon Stream Using
Deep Eutectic Solvent. J. Mol. Liq. 2020, 317, 113909. [CrossRef]
24. Kant Shukla, S.; Mikkola, J.-P. Intermolecular Interactions upon Carbon Dioxide Capture in Deep-Eutectic Solvents. Phys. Chem.
Chem. Phys. 2018, 20, 24591–24601. [CrossRef] [PubMed]
25. Ren, H.; Chen, C.; Wang, Q.; Zhao, D.; Guo, S. The Properties of Choline Chloride-Based Deep Eutectic Solvents and Their
Performance in the Dissolution of Cellulose. BioResources 2016, 11, 5435–5451. [CrossRef]
26. Lakka, A.; Karageorgou, I.; Kaltsa, O.; Batra, G.; Bozinou, E.; Lalas, S.; Makris, D. Polyphenol Extraction from Humulus Lupulus
(Hop) Using a Neoteric Glycerol/L-Alanine Deep Eutectic Solvent: Optimisation, Kinetics and the Effect of Ultrasound-Assisted
Pretreatment. AgriEngineering 2019, 1, 403–417. [CrossRef]You can also read