Review of drugs part two: prevention, treatment and recovery: annexes - Dame Carol Black July 2021 - GOV.UK
←
→
Page content transcription
If your browser does not render page correctly, please read the page content below
Dame Carol Black's Independent Review of Drugs

Review of drugs part two:
prevention, treatment and recovery:
annexes

Dame Carol Black

July 2021

                   1
Dame Carol Black's Independent Review of Drugs
Annex A: trends in prevalence of drug
use and the associated harms
Summary
The following evidence section presents an overview of the trends in the prevalence of
drug use and the associated harms, as well as the treatment response. It also includes
information on how these harms are very much associated with deprivation and often
concentrated in the poorest areas of the country.
In summary, all the main indicators have worsened in the last 5 to 10 years, with:
• the use of opiates and crack increasing significantly
• the use of other drugs by adults and children also increasing significantly
• drug misuse deaths now at a record high
• fewer people that need treatment receiving it and poorer treatment outcomes for those
that do receive it
• a clear divide between north and south having emerged in terms of problematic use
and harms
The high cost of illicit drug use
It is estimated that the costs associated with illicit drug use are over £19 billion per year.
Drug-related crime is the main driver of these costs, making up nearly half. The harms
from drug-related deaths and homicides make up the next largest cost. Expenditure on
drug treatment and prevention is only a small proportion of the total costs. The estimated
costs per year associated with drug use are:
• £9.3 billion for crime and the criminal justice system
• £6.3 billion for drug related deaths
• £1 billion for adult family and carers of drug users
• £0.7 billion for enforcement
• £0.6 billion for children’s social care
2Dame Carol Black's Independent Review of Drugs
• £0.6 billion for drug treatment and prevention
• £0.9 billion for other costs (including social care, drug-driving, drug-related secondary
care, prison treatment)
Most of these costs (86%) are incurred by the 300,000 users of illicit opiates and crack
cocaine estimated by PHE. The average annual cost of someone using these drugs is
estimated to be approximately £58,000. This compares to an average annual cost of less
than £1,000 each for the 3 million users of other drugs.
Drug-related deaths are currently at the highest level since records began. ONS reports
that these have increased by nearly 80% since 2012. Figure A1 below shows the upward
trend in drug poisoning deaths between 1993 and 2019. Drug misuse deaths in England in
2019 were the highest ever. This increase is largely due to a sharp rise in heroin deaths,
which have doubled over this this time.
Most areas of the country have seen increases in drug deaths. Figure A2 below shows the
death rate per million people for all English regions. The North East has seen a particularly
large rise. The rate of deaths per million population in this region is now by far the highest
in the country and is almost 3 times that of London and other areas of the south.
Most drug deaths occur in people aged 40 to 50 and data is expected to show that drug
poisonings and other drug-related deaths killed more people under 50 during 2020 than
COVID-19.
3Dame Carol Black's Independent Review of Drugs
Figure A1: number of drug misuse poisonings in England between 1993 and
2019
3,000
Number of drug misuse poisonings
2,500
2,000
1,500
1,000
500
0
1993
1994
1995
1996
1997
1998
1999
2000
2001
2002
2003
2004
2005
2006
2007
2008
2009
2010
2011
2012
2013
2014
2015
2016
2017
2018
2019
Figure A2: drug misuse deaths rate per million people in English regions in 2019
North East 89.9
North West 63.7
Yorkshire and the Humber 60.0
South West 47.6
England 47.4
West Midlands 47.4
East 39.3
South East 37.7
East Midlands 36.8
London 35.0
0 20 40 60 80 100
Note: 2019 drug misuse poisonings against 2019 mid-year population estimates
4Dame Carol Black's Independent Review of Drugs
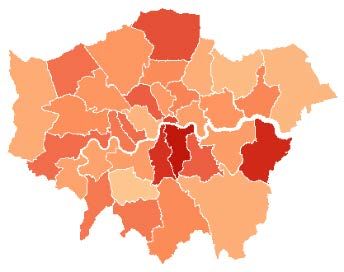
The map in figure A3 below shows the change in number of drug misuse poisonings by
local authority between 2010 to 2012 and 2017 to 2019. The darker-red areas indicate
large increases over this time period. Most of the local authorities showing an increase in
drug poisonings are in the north of the country and the South West.
Figure A3: map showing the change in number of drug misuse poisoning deaths
between 2010 to 2012 and 2017 to 2019 (% change)
Greater London
Note:
The areas were capped at 300%.
Grey areas show low numbers or missing data
5Dame Carol Black's Independent Review of Drugs
Figure A4 shows the correlation between the rate of drug deaths per 100,000 people and
the deprivation score for the local authority. The trend line shows that the rate of deaths
tends to increase with increased levels of deprivation.
Figure A4: drug misuse deaths per 100,000 population according to index of
multiple deprivation (IMD) between 2017 and 2019
20
18
16
Deaths per 100,000
14
12
10
8
6
4
2
0
0 10 20 30 40 50
Average IMD
Prevalence of drug use
Prevalence of opiate and crack use
Figure A5 shows the estimated prevalence of opiate and crack use (OCU), between 2004
to 2005 and 2016 to 2017. OCU prevalence fell between 2005 and 2012. This is in part as
a result of the rapid expansion of the drug treatment system. Since 2013 there has been a
significant increase in the number of opiate and crack users. This is likely to be a result of
the increase in crack cocaine use and the number of new younger users of this drug.
Figure A6 shows the rates of opiate and crack use per 100,000 people in 9 regions across
England. London has seen a sharp decline in the estimated number of OCUs since 2005,
whereas prevalence in the North East has risen steadily during this time. The North East
now has the highest rates of use in the country. Generally, OCU prevalence tends to
correlate closely with deprivation.
6Dame Carol Black's Independent Review of Drugs
Figure A5: prevalence of illicit opiate and crack use
350,000
OCU
300,000
Opiates
250,000
200,000
Crack
150,000
100,000
2004-05
2005-06
2006-07
2008-09
2009-10
2010-11
2011-12
2012-13
2013-14
2014-15
2016-17
Rapid treatment expansion
7Dame Carol Black's Independent Review of Drugs
Figure A6: rates of opiate and crack use per 100,000 people
16.00
14.00
12.00
Rate per 100,000 people
10.00
8.00
6.00
4.00
2.00
0.00
East East of North East North West South East South West West Yorkshire & London
Midlands England Midlands the Humber
2004-05 2005-06 2006-07 2008-09 2009-10 2010-11 2011-12 2012-13 2013-14 2014-15 2016-17
8Dame Carol Black's Independent Review of Drugs
Prevalence of other drug use
The use of other drugs ebbs and flows over time depending on many factors including:
• availability
• purity
• price
• the cultural backdrop
• the economy
Other drug use has increased across most substances over the last 5 years reported.
However, recreational use is lower than it was 20 years ago, and powder cocaine use is
currently at similar levels as 10 years ago. Most people that use these drugs do so
infrequently and recreationally. However, a small but significant minority will develop
problems and will then need treatment and other support.
Figure A7 shows the percentage of adults reporting use of specific drugs between the
years 1996 and 2018 to 2019. The trend lines show a decline in cannabis use to around
2013, then a slight rise. It also shows a slight decrease across the years for amphetamines
and ecstasy and slight rise for cocaine.
9Dame Carol Black's Independent Review of Drugs
Figure A7: percentage of adults reporting use of specific drugs in the last year
between 1996 and 2018 to 2019
14
12
10 Any drug use
% of adults
8 Cannabis
6
4
Cocaine
2 Amphetamines
and ecstasy
0
1996
1998
2000
2010/11
2011/12
2001/02
2002/03
2003/04
2004/05
2005/06
2006/07
2007/08
2008/09
2009/10
2012/13
2013/14
2014/15
2015/16
2016/17
2017/18
2018/19
Unlike with opiate and crack, people who use drugs recreationally are not concentrated in
the most deprived areas of the country. They are equally as likely to live in the least
deprived communities and in households with higher incomes. The rates of use of
recreational drugs are higher in the south of country, particularly in London and in the
South East and South West. Recreational drug use tends to be concentrated in people
under 30 and is often associated with pubs and clubs, so, it is common for these
substances to be taken alongside alcohol.
The percentage of 16 to 59 year olds reporting any drug use in the last year between 2016
to 2017 and 2018 to 2019 were:
• 10.8% in the South West
• 10.2% in the South East
• 9.7% in London
• 9% in the North West
• 8.4% in the East of England
• 8.2% in the East Midlands
• 8% in Yorkshire and The Humber
10Dame Carol Black's Independent Review of Drugs
• 7.2% in the West Midlands
• 7.1% in the North East
Prevalence of drug use among children and young people
Drug use among school aged children has also increased over the last few years. Table
A1 shows the proportions of children who reported using drugs in the last year, comparing
2014 and 2018. There is an overall 41% rise in any drug use, and there are rises in the
use of most individual drugs.
However, drug use among children remains below the peak of 20 years ago. Increases
have been seen for both boys and girls and also for most substance types, with notable
increases in the use of cocaine, ecstasy and ketamine.
Figure A8 shows the percentage of children (aged 11 to 16) who reported using drugs in
the last year (excluding volatile substance), by sex, between the years 2001 and 2018.
There is a downward trend from 2001 to 2014 for both sexes, then increases in 2016 and
2018.
Table A1: proportion of children who reported using drugs in the last year in
2014 and 2018
2014 (%) 2018 (%) % change
Any drug use 10.3 14.5 +41%
Cannabis 6.7 8.1 +20%
Glues or solvents 2.9 4.2 +45%
Cocaine 0.9 1.4 +66%
Ecstasy 0.8 1.3 +62%
Ketamine 0.4 1.0 +156%
LSD 0.5 0.8 +62%
Magic mushrooms 0.8 0.7 -19%
Amphetamines 0.7 0.7 -3%
Tranquilisers 0.4 0.6 +67%
Poppers 0.7 0.6 -13%
Mephedrone 0.5 0.2 -67%
Other drugs 0.3 0.8 +122%
11Dame Carol Black's Independent Review of Drugs
Figure A8: percentage of children (children aged 11 to 16) who reported using
drugs in the last year (excluding volatile substance), by sex
20
18
16
14
% of children
12
10
8
6
4
2
-
2001
2002
2003
2004
2005
2006
2007
2008
2009
2010
2011
2012
2013
2014
2016
2018
Boys Girls
Treatment funding and workforce
Treatment funding
Against the backdrop of increasing drug use among adults and young people, as well as
the significant rise in drug deaths and other harms, the funding of, and expenditure on,
drug treatment has fallen substantially since 2014.
The expenditure on adult drug and alcohol prevention and treatment has decreased by
nearly a fifth (17%) in nominal terms during this time, with the expenditure on treatment for
young people falling by 28%. Overall, the public health grant funding has fallen by 19%
since 2014. The reduction in local authority expenditure has resulted in a substantial
reduction in the numbers in treatment for both adults and young people.
Figure A9 shows this decrease in the overall nominal expenditure adult treatment from the
public health grant (PHG), alongside the numbers of people in treatment, which has also
decreased or remained at a similar level. Figure A10 shows similar decreases in
expenditure in young people’s treatment and falls in the numbers of young people in
treatment. The main difference being that spending on young people’s treatment increased
slightly in 2019 to 2020.
12Dame Carol Black's Independent Review of Drugs
Figure A9: amount spent on drug and alcohol treatment and number of people in
treatment between 2014 to 2015 and 2019 to 2020 for adults
350 £800
£700
No. in treatment (thousands)
300
Spend in treatment (millions)
£600
250 £500
£400
200 £300
£200
150
£100
100 £0
2014-15 2015-16 2016-17 2017-18 2018-19 2019-20
Nominal PHG spend substance misuse Number in treatment
Figure A10: amount spent on drug and alcohol treatment and number of people
in treatment between 2014 to 2015 and 2019 to 2020 for young people
20 £60
18
£50 Spend in treatment (millions)
No. in treatment (thousands)
16
14
£40
12
10 £30
8
£20
6
4
£10
2
0 £0
2014-15 2015-16 2016-17 2017-18 2018-19 2019-20
Nominal PHG spend substance misuse Number in treatment
13Dame Carol Black's Independent Review of Drugs
Effect of funding reductions on the workforce
To understand the impact of this funding reduction on the workforce, a survey of treatment
providers was commissioned as part of this review and carried out over summer 2020.
Table A2 below shows the results from this survey. Three hundred treatment providers
responded, and these returns were then extrapolated to give a national picture. The table
includes the number of people employed by each profession and also the ratio of each
staff type per 1000 people in treatment.
The survey also asked about average caseload numbers and figure A11 shows the
response to this question. The average caseload of a drug and alcohol keyworker was
approximately 50 at any given time and over 10% of providers had average caseloads of
80 patients or more. Caseloads of this size have both safety risks and mean that
practitioners will not be able to provide the intensive support needed by some of those in
treatment.
Average caseload sizes range from 20 to 100, but the majority range between 40 and 60.
In over a quarter of services (27%), the keyworkers’ average caseload is 60, 22% have 40
and 21% have 50.
The lack of psychiatrists and psychologists with cognitive behavioural and
psychotherapeutic skills limits the amount of support that can be given to people. This
results in very high levels of unmet psychological need among people in treatment.
Table A2: staff employed by profession (extrapolated) in treatment services
Current ratio per 1000 Current numbers
people in treatment employed (extrapolated)
Social workers 0.38 96
Pharmacists (including non- 0.31 79
medical prescribers)
Nurses 6.49 1665
Psychiatrists 0.43 110
Doctors 0.90 231
Consultant psychologists 0.20 51
Practitioner psychologists - 0.12 32
assistant
Practitioner psychologists 0.64 164
Drug and alcohol workers Not known 6935
Total 9363
14Dame Carol Black's Independent Review of Drugs
Figure A11: average caseload size per keyworker
30%
25%
Proportion of providers
20%
15%
10%
5%
0%
20 30 40 50 60 70 80 90 100
Caseload size
Treatment outcomes and unmet need
The increases in drug use prevalence and the fall in numbers in treatment have resulted in
fewer people who need treatment for heroin or other opiates receiving it now than 10 years
ago. Alongside this, successful completion rates have fallen significantly, particularly for
opiate users, with the proportion completing treatment each year now nearly half what it
was 8 years ago.
Figure A12 shows the proportion of people using opiates who were in treatment between
2005 to 2006 and 2019 to 2020. The proportion climbs steadily from 49% in 2005 to 2006,
reaching a high in 2008 to 2009 of 65%. The proportion goes down slightly to 64% in 2009
to 2010 but goes back up to 65% in 2010 to 2011. Since then, the proportion falls each
year until it reaches 54% in 2019 to 2020.
15Dame Carol Black's Independent Review of Drugs
Figure A12: the proportion of people using opiates who were in treatment
between 2005 to 2006 and 2019 to 2020
70%
Proportion of people using opiates in
60%
50%
treatment
40%
30%
20%
10%
0%
2005-06
2006-07
2007-08
2008-09
2009-10
2010-11
2011-12
2012-13
2013-14
2014-15
2015-16
2016-17
2017-18
2018-19
2019-20
Year
Figure A13 shows the proportion of people using opiates and non-opiate drugs who
completed treatment successfully between 2009 to 2010 and 2019 to 2020. The proportion
of opiate users completing treatment is much less than that for non-opiate users.
The proportion of opiate users successfully completing treatment peaked at 9% in 2011 to
2012 and has been declining since (it was 6% in 2019 to 2020). The proportion of non-
opiate users successfully completing treatment peaked at 40% in 2013 to 2014 and has
been declining since (it was 35% in 2019 to 2020).
16Dame Carol Black's Independent Review of Drugs
Figure A13: the proportion of people using opiates and non-opiates who
completed treatment successfully between 2009 to 2010 and 2019 to 2020
45%
Proportion of people successfully
40%
35%
completing treatment
30%
25%
20%
15%
10%
5%
0%
Opiate Non-opiate
2009-10 2010-11 2011-12 2012-13 2013-14 2014-15
2015-16 2016-17 2017-18 2018-19 2019-20
Deaths in treatment have also sadly increased over the last 7 years with both the number
and the rates of opiate deaths now over twice what they were in 2012 to 2013. Although
they are much lower, the number and rate of deaths for users of other substance have
also increased significantly during this time.
Figure A14 shows the number people who use opiates and the numbers of people who
use non-opiates who died while they were in treatment between 2009 to 2010 and 2019 to
2020. The number of opiate users who died increased from 1040 in 2009 to 2010, to a
peak of 2010 in 2019 to 2020. The numbers of non-opiate users who died while they were
in treatment has also been increasing, but at a much lower level. They have had a general
rise from 53 in 2009 to 2010 to 179 in 2019 to 2020.
Figure A15 is a similar chart, showing the proportion of people who use opiates and the
proportion of people who use non-opiates who died while they were in treatment between
2009 to 2010 and 2019 to 2020. This is a proportion of all people in treatment. The
proportion of opiate users who died increased from 0.6% in 2009 to 2010, to a peak of
1.43% in 2019 to 2020. The proportions of non-opiate users who died while they were in
treatment has also been increasing, but at a much lower level. They rose from 0.2% in
2009 to 2010 to 0.37% in 2018 to 2019, before falling slightly to 0.32% in 2019 to 2020.
17Dame Carol Black's Independent Review of Drugs
Figure A14: number of deaths of people who use opiates and people who use
non-opiates during treatment between 2009 to 2010 and 2019 to 2020
2500
2000
Number of deaths
1500
1000
500
0
Opiate Non-opiate
2009-10 2010-11 2011-12 2012-13 2013-14 2014-15
2015-16 2016-17 2017-18 2018-19 2019-20
Figure A15: the proportion of people in treatment using opiates and using non-
opiates who died between 2009 to 2010 and 2019 to 2020
1.6%
Proportion of people in treatment who
1.4%
1.2%
1.0%
0.8%
died
0.6%
0.4%
0.2%
0.0%
Opiate Non-opiate
2009-10 2010-11 2011-12 2012-13 2013-14 2014-15
2015-16 2016-17 2017-18 2018-19 2019-20
18Dame Carol Black's Independent Review of Drugs
Poorer treatment outcomes are often associated with deprivation. Figure A16 shows how
lower rates of successful completion of treatment by opiate users correlate with higher
levels of deprivation. There is a gradual decline in the proportion of people successfully
completing treatment as the index of multiple deprivation rises.
Figure A16: proportion of people in treatment for opiate use successfully
completing treatment, by index of multiple deprivation (IMD)
14%
12%
10%
Percentage
8%
6%
4%
2%
0%
0 10 20 30 40 50
Average IMD
Figure A17 presents the ratio of observed to expected numbers of deaths in treatment.
The expected number of deaths adjusts for the substances used and age to estimate the
number of deaths you would predict in each local authority based on the profile of people
in treatment. The areas that are over 1 (darker red) have more deaths than would be
expected and the lighter areas fewer deaths.
It can be seen clearly that most of London has fewer deaths than expected whereas many
areas in the north as well as the South West have more deaths than would be expected
based on the profile of the treatment population. Overall, just under half of all deaths of
people who die while they are in treatment occur in communities in the most deprived
quintile of the country.
19Dame Carol Black's Independent Review of Drugs
Figure A17: map showing the ratio of observed to expected numbers of deaths
in treatment for each local authority in 2018 to 2019
Observed/expected
Greater London
Note: grey areas indicate low numbers or missing data.
20Dame Carol Black's Independent Review of Drugs
Annex B: methodology
The review drew together evidence from a range of sources, which are described below.
Call for evidence
The call for evidence was made on the government consultation portal and responses
were invited from any individual or organisation who wished to respond. It ran for a month
from 2 July 2020 until 6 August 2020. The call for evidence asked for responses to 27
questions covering four broad categories, which were:
• prevention and harm reduction
• young people
• treatment and recovery
• cross-cutting issues
The review received 156 responses to the call for evidence. These came from individual
members of the public, and from organisations working in the sector or with an interest in
drug misuse and treatment from all regions of England. All the responses were read and
summarised to draw out the key themes raised, along with any wider evidence cited or
examples of best practice. The main themes and areas of consensus or debate for each
question were compiled, before summarising into a final report which focussed on the
responses which fell within the scope of the review.
Expert reference group
Dame Carol Black invited a group of experts from across the drug misuse sector to inform
and guide the review. Members of the expert reference group were selected and invited
based on their ability to fulfil some or all the following criteria:
1. Expertise in areas relevant to the review.
2. Seniority or relevant roles in organisations with strategic or national roles relevant
to the review.
3. Representatives of government departments involved in implementing the review’s
recommendations.
4. Experts by experience
21Dame Carol Black's Independent Review of Drugs
Three meetings were held, in which the group provided the review team with advice on
which stakeholders to engage, helped the review team to access relevant information and
reviewed and commented on findings and draft recommendations. Ultimately, however,
the views expressed in this report are those of Dame Carol Black. The full list of expert
reference group members was:
• Karen Biggs, Chief Executive, Phoenix Futures
• David Buck, Senior Fellow, King’s Fund
• Samantha Cole, lived experience ambassador
• Phil Copple, Director General, HM Prison and Probation Service
• Adrian Crossley, Head of Addiction at the Centre for Social Justice
• Dr Ed Day, UK government’s Drug Recovery Champion and Birmingham University
• Sunny Dhadley, lived experience ambassador
• Danny Hames, Chair, NHS Addictions Provider Alliance
• Jason Harwin, Deputy Chief Constable, Lincolnshire Police
• Rachael Hope, Drug Strategy Coordinator, Newcastle City Council
• Ben Hughes, Head of Wellbeing and Public Health, Essex County Council
• Professor Keith Humphreys, Stanford University
• Professor Tim Kendall, NHS England, National Clinical Director for Mental Health
• Dr Euan Lawson, Lancaster University; Acting Editor, British Journal of General
Practice
• Jo Lenaghan, Director of Strategy, Health Education England
• John-Paul Marks, Director General for Universal Credit, Department for Work and
Pensions
• Noreen Oliver MBE, Founder and manager of BAC O'Connor
• Justin Russell, HM Chief Inspector of Probation
• Professor Sir John Strang, King’s College London
22Dame Carol Black's Independent Review of Drugs
• Paul Townsley, Chair, Collective Voice; CEO, Humankind
• Mike Trace, CEO, Forward Trust
• Robin Tuddenham, Chief Executive, Calderdale Council
• Raj Ubhi, National Head of Operations (Young People’s Services), Change Grow Live
• Dr Roya Vaziri, Medical Director, Humankind
• Mark Vickers, CEO, Olive Academies
• Donna Ward, Policy Director for Children, Families and Disadvantage, Department for
Work and Pensions
• Dominic Williamson, Executive Director of Strategy and Policy, St Mungo’s
• Dr Alice Wiseman, Director of Public Health, Gateshead Council
• Councillor Sue Woolley, Bourne North and Morton
List of meetings
Due to COVID-19 restrictions, all meetings were held online. Some were one-to-one, and
others were group meetings. Broadly, the review team engaged with organisations working
in the sector. This included:
• NHS and third sector organisations
• professional bodies
• mutual aid groups
• individuals with lived experience of substance misuse
• academics who specialised in drug treatment and recovery
• representatives from government departments
The meetings involved the following people:
• Mike Barton, former Chief Constable of Durham Police
• Karen Biggs, Chief Executive of Phoenix Futures
23Dame Carol Black's Independent Review of Drugs
• David Burrows, former MP for Enfield Southgate
• Dame Louise Casey, government advisor on homelessness and Chair of the rough
sleeping taskforce
• Adrian Crossley, Head of Addiction at the Centre for Social Justice
• Dr Ed Day, Drug Recovery Champion
• Sunny Dhadley, expert by experience
• Paul Farmer, CEO of Mind
• Dr Michael J Kelleher, Consultant Addictions Psychiatrist and Clinical Lead for
Lambeth Addictions and Clinical Advisor to Public Health England on drug and alcohol
treatment
• Noreen Oliver MBE, Founder and manager of BAC O'Connor
• Sarah Martin-Denham, Senior Lecturer at the University of Sunderland
• Dr Luke Mitcheson, Consultant Clinical Psychologist, South London and Maudsley
NHS Foundation Trust, and Clinical Advisor to Public Health England on drug and
alcohol treatment
• Trevor Pearce, Chair of UK Anti-Doping
• Fiona Spargo-Mabbs, Director and Founder of the Daniel Spargo-Mabbs Foundation
• Professor Sir John Strang, Head of the National Addiction Centre at King’s College
London
The meetings also included representatives from:
• British Psychological Society
• Centre for Social Justice
• Change Grow Live
• Commission on Race and Ethnic Disparities
• Department for Digital, Culture, Media and Sport
• Department for Education
24Dame Carol Black's Independent Review of Drugs
• Health Education England
• The Health Foundation
• Her Majesty’s Prison and Probation Service
• Ministry of Housing, Communities and Local Government
• Nelson Trust
• NHS Addictions Provider Alliance
• NHS England
• Public Health England
• Royal College of Emergency Medicine
• Royal College of Nursing
• Royal College of General Practitioners
• Royal College of Physicians
• Welsh Government (Substance misuse team)
Themed roundtable discussions
In July and August 2020, a series of 11 online roundtable discussions were held, based on
the following themes:
Commissioning, outcomes, mechanisms and levers
This roundtable included representatives from Public Health Dorset, London Borough of
Tower Hamlets, Calderdale Council, DWP, Recovery Group UK, Greater Manchester
Combined Authority, Burton Addiction Centre, Forward Trust, Barnet and Harrow Public
Health, Centre for Social Justice, SLAM, Brighton and Hove Children, Young People and
PH Schools, Newcastle University and The King’s Fund.
Criminal justice system
This roundtable included representatives from Public Health England, Hampshire Police,
Avon and Somerset Police, Derbyshire PCC, Thames Valley Police, Lincolnshire Police,
25Dame Carol Black's Independent Review of Drugs
West Midlands PCC, HMPPS Probation, HMPPS Prisons, Greater Manchester,
Merseyside and Cheshire Prison Group, Delphi Health, User Voice, RECONNECT NHS
England, NHS England, Stanford University and the Cabinet Office.
Employment
This roundtable included representatives from Blackpool Council, Royal Mail, Barclays,
Blackpool Council, IPS Grow, Foundation for Change, Jobcentre Plus, University of York,
DWP, Employment Related Services Association, and Humankind.
Health and mental health
This roundtable included representatives from NHS England and NHS Improvement,
Hepatitis C Trust, Greater London Authority, King's College London, Cumbria,
Northumberland, Tyne and Wear NHS Foundation Trust, Staffordshire Council, Thameside
and Westminster Drugs Project.
Housing
This roundtable included representatives from Voices of Stoke, Greater London Authority,
Ministry of Housing, Communities and Local Government and Liverpool City Council.
Recovery networks
This roundtable included representatives from Recovery Group UK, Birmingham
University, Hep CU Later, Narcotics Anonymous, Stanford University, Smart Recovery,
Lancashire County Council, Aurora Peer mentoring, Cocaine Anonymous, King’s College
London, The Bridge, Changing Lives, Scottish Recovery Forum, Pushing Change and
Faces of Recovery.
Research developments
This roundtable included representatives from South London and Maudsley NHS
Foundation Trust, Haringey Council, Single Homeless Project, Homeless Link.
Treatment
This roundtable included representatives from King’s College London, Change Grow Live,
Humankind, Collective Voice, Greater Manchester Mental Health NHS Foundation Trust,
Phoenix Futures, Turning Point, Cumbria, Northumberland, Tyne and Wear NHS
Foundation Trust, Bristol Drugs Project, Sefton Council, Recovery Group UK, South
26Dame Carol Black's Independent Review of Drugs
London and Maudsley NHS Foundation Trust, NHS SMPA (now APA), Birmingham
University and the British Psychological Society.
Vulnerable children and parental drug use
This roundtable included representatives from DWP, OASIS Project, Early Break,
Staffordshire County Council, Olive Academies, Prime Minister’s Policy Unit, Adfam,
Deputy Chief Medical Officer, What Works for Children’s Social Care, Core Education,
Manchester Metropolitan University, Essex County Council, Change Grow Live, the
Department of Health and Social Care, Adolescent Substance Misuse.
Workforce
This roundtable included representatives from Recovery Connections, Health Education
England, We Are With You, Turning Point, Manchester Metropolitan University, Surrey and
Borders Partnership NHS Foundation Trust, South London and Maudsley NHS Foundation
Trust, Humankind and the Royal College of Physicians.
Young people treatment and targeted prevention
This roundtable included representatives from Cumbria, Northumberland, Tyne and Wear
NHS Foundation Trust, We Are With You, Home Office, Early Break, DWP, Office for Civil
Society, Devon Y-Smart, Daniel Spargo-Mabbs Foundation, Youth Justice Board, Kent
County Council and Change Grow Live.
Attendees were invited to join the roundtables based on expertise and experience
(professional or personal) in the theme under discussion.
Lived experience
Throughout the review, Dame Carol met with a number of groups of people with lived
experience. These included meetings hosted by organisations such as:
• Expert Link
• Fulfilling Lives programme, National Experts Citizens Group (NECG), facilitated by
Revolving Doors
• Leaders Unlocked
• The Nelson Trust
• One Recovery Bucks
27Dame Carol Black's Independent Review of Drugs
• Recovery Connectors
• Recovery Group UK
• WDP
Leaders Unlocked, generously funded by the Health Foundation, also ran 2 youth panels.
The King's Fund rapid evidence assessment
The Department of Health and Social Care (DHSC) commissioned The King’s Fund to
conduct a rapid evidence synthesis of the likely strengths and weaknesses of different
models of commissioning and accountability for drug treatment services in England, to
inform the review.
In the rapid evidence synthesis, 5 research questions were explored:
1. What are the strengths and limitations of different approaches to commissioning
drug treatment services in England?
2. What are the strengths and limitations of different approaches to accountability for
drug treatment commissioning?
3. What can be learned from other services with comparable commissioning and
accountability arrangements – such as sexual health services in England - about
the overall design of commissioning and accountability arrangements for drug
services?
4. What does current practice tell us about wider conditions needed at a system level
to ensure the effectiveness of commissioning and accountability mechanisms
generally and what does this imply for drugs?
5. How would different approaches to commissioning and accountability align with the
broader policy direction of integrated care systems in England and what are the
broad implications of this for drugs?
The King's Fund team conducted several targeted literature searches using bibliographic
databases (The King’s Fund database, Medline and Psychinfo) and the internet. Relevant
organisational websites and the references of key documents were also checked for
further relevant material.
The team examined evidence submitted to the Department of Health and Social Care as
part of the call for evidence on the review and drew on insights from experts at The King’s
Fund, plus a small number of conversations with commissioners and representatives from
28Dame Carol Black's Independent Review of Drugs
national bodies. As part of the evidence assessment they identified case studies and
models, and developed further insights through discussion.
The rapid evidence assessment is published on the King’s Fund and University of York
PREPARE website.
Workforce survey
A survey of drug and alcohol treatment providers and commissioners was carried out to
gain an understanding of the capacity and competencies of the workforce. There were 240
responses from treatment providers, including organisations with a network of providers,
and single providers. This information has been used to model the gaps in the workforce,
particularly in relation to health professionals, and to better understand the size of the
caseloads carried by individual workers.
Official statistics, research reports, and academic literature
Wherever possible, the review ensured that the recommendations are evidence-based and
are supported by the available academic literature, relevant statistical data and research
findings.
29Dame Carol Black's Independent Review of Drugs
Annex C: costs and benefits of the review
recommendations to improve the
coverage and quality of treatment,
prevention and recovery
Summary
The following presents an overview of the costs and benefits of a proposed 5-year plan to
respond to the recommendations in this review. The plan outlined will:
• improve the quality and capacity of the treatment system for both adults and young
people
• increase the workforce numbers as well as training and skills, and bring in more
qualified health professionals, particularly from mental health backgrounds
• increase the uptake and provision of residential and inpatient detoxification treatment
• ensure that there are well-resourced recovery communities in every area
• increase the provision of harm reduction interventions such as naloxone and needle
and syringe exchange programmes
• increase the provision of employment support, housing support, and support for
offenders
• create an innovation fund to help tackle recreational use
Additional investment
Table C1 below presents the total additional investment that would be required to
implement and deliver the treatment and workforce expansion, as well as the other
interventions and support listed above. This additional investment would be needed above
the current baseline annual expenditure of £680 million by local authorities on drug and
alcohol treatment, prevention and recovery from the public health grant. These estimates
are based on a range of factors including staff numbers, stipends and support costs.
Year one would see additional costs of about £120 million rising to £550 million by the last
year of the proposed plan. For every £1 invested in the first year, it is estimated there
30Dame Carol Black's Independent Review of Drugs
would be a return on investment of over £2. By the last year this increases to over £5 as
more recovery benefits are accrued each year.
Table C1: additional treatment, prevention and recovery costs and benefits
across the 5 years of the plan
Year 1 Year 2 Year 3 Year 4 Year 5
Total costs £119 million £231 million £396 million £484 million £552 million
Total £261 million £692 million £1.315 billion £1.875 billion £2.381 billion
benefits
Net present £146 million £476 million £958 million £1.453 billion £1.917 billion
value
Benefit cost 2.3 3.2 3.7 4.4 5.1
ratio
Additional treatment capacity and workforce
Table C2 below presents the additional numbers we would expect to see enter treatment
over the 5 years as well as the increase in the number of inpatient and residential beds
that would be used. The initial focus would be on opiate and crack users as well as
referrals from the criminal justice system for users of other drugs and alcohol. As the
professionalism of the workforce improves, we would then see more referrals for users of
non-opiates because effective psychosocial treatments would be more readily available.
Table C2: extra numbers of people expected to enter treatment across the 5
years of the plan
Year 1 Year 2 Year 3 Year 4 Year 5
Opiate users 3,200 11,000 24,000 29,000 37,000
Crack users 660 1,700 3,300 5,000 6,600
Non-opiate users 1,500 7,300 14,000 19,000 19,000
Alcohol 4,000 9,900 25,000 32,000 32,000
31Dame Carol Black's Independent Review of Drugs
Year 1 Year 2 Year 3 Year 4 Year 5
Young people 1,600 4,000 8,000 8,000 8,000
Inpatient 1,000 2,800 5,900 7,300 7,900
Residential rehab 610 1,900 4,200 5,200 5,700
The workforce survey referenced in Annex A (commissioned as part of this review)
provided information on the current level of provision. It identified that the treatment
workforce had been significantly depleted both in terms of overall numbers and specifically
when it came to particular profession types.
Table C3 below presents the workforce required across England as part of a 5-year
transformation strategy to ensure that caseloads are at manageable and safe levels and
that the professionalism of the workforce is increased substantially. This will allow services
to achieve better recovery rates and other outcomes for heroin and crack users. It will also
provide appropriate interventions to users of other drugs to achieve better recovery rates
and outcomes. Recovery rates for non-opiate users are usually higher.
Table C3: workforce required across the 5 years of the plan
Year 1 Year 2 Year 3 Year 4 Year 5
Social workers 11 28 52 65 78
Pharmacists 3 9 18 23 27
Nurses 100 200 300 375 450
Psychiatrists 20 40 60 75 90
Doctors 33 83 133 167 200
Lead clinical
20 45 70 88 105
psychologists
Practitioner
50 100 200 250 300
psychologists
Practitioner
psychologists – 80 180 280 350 420
assistants or graduates
Drug and alcohol
workers (generic and 600 900 1200 1500 1500
criminal justice system)
Commissioners or
150 150 150 150 150
coordinators
32Dame Carol Black's Independent Review of Drugs
Additional outcomes to be achieved with this investment
Drug treatment already provides a wide range of benefits. The proposed 5-year expansion
of the treatment system and workforce will build on these benefits, providing more
treatment to those that need it as well as better outcomes for both existing and new
service users.
These outcomes will include:
• reduced health harms and mortality
• fewer children in care
• reduced offending and reoffending
• more people achieving long term recovery
The biggest impact of these improvements will be seen among individuals, families and
communities in the poorest areas of the country.
Preventing drug deaths
Drug-related deaths are at the highest levels since records began with the majority in
those aged under 50. The rate of deaths is 4 times higher in the most deprived areas
compared to the least.
We estimate that using this investment to increase the number of opiate users in treatment
as well as to increase the provision of harm reduction interventions will have a significant
impact on preventing overdose deaths.
If the 5-year plan is implemented from the financial year 2022 to 2023, it is estimated that
this would reverse the current upward trend of drug misuse poisoning deaths within 2
years and start to show significant reductions in the following 3 years. Table C4 shows the
estimated number of opioid overdose deaths that would be prevented.
33Dame Carol Black's Independent Review of Drugs
Table C4: numbers of opiate overdose deaths prevented across the 5 years of
the plan
Year 1 Year 2 Year 3 Year 4 Year 5 Total
Number of opiate 133 339 641 842 1,128 3,084
overdose deaths
prevented
Increasing long term recovery
With the increased numbers in treatment, expansion of the workforce and improvements to
the quality of the workforce, it is estimated that over the 5 years nearly 100,000 adults and
young people will achieve recovery and sustain it in the long-term. Table C5 shows the
estimated additional people in recovery throughout this time.
Table C5: numbers of extra people in recovery across the 5 years of the plan
Year 1 Year 2 Year 3 Year 4 Year 5
Cumulative 4,000 13,000 32,000 57,000 95,000
additional people in
recovery
Reducing crime
Crime benefits are realised immediately for most people entering treatment and are
maintained for all the time that they remain in treatment. Crime benefits also accrue for
people who leave treatment successfully and sustain recovery.
Table C6 below presents the estimated number of crimes prevented over 5 years for those
in treatment and those in recovery during this time. Crimes such as possession or low-
level dealing have been excluded. 1 A large proportion of the estimates below would be
acquisitive crimes such as shop theft or stealing from vehicles.
1
Possession offences have been excluded as they are high in volume but almost consist entirely of low level
buying and selling of drugs and possession offences. These crimes would still be prevented but as they are
technically victimless and the majority would go unreported, there would be no real savings realised.
34Dame Carol Black's Independent Review of Drugs
Table C6: estimated number of crimes prevented across the 5 years of the plan
Year 1 Year 2 Year 3 Year 4 Year 5 Total
Estimate of 100,000 340,000 630,000 800,000 940,000 2,810,000
crimes prevented
(excluding minor
possession
offences)
Wraparound support costs and benefits
Individual Placement and Support
Employment and meaningful activity are one of the key tenets in enabling people to
achieve and sustain recovery. Traditional employment interventions have not proven to be
that successful with people with drug problems or dependence. Individual Placement and
Support (IPS) is an approach that has been demonstrated to be effective with people with
mental health issues, but the evidence was weaker for the drug treatment sector.
To improve the evidence for this sector, a randomised control trial of IPS for drug and
alcohol users (IPS-AD) was commissioned in 2018. The trial will conclude this year (2021)
with early self-reported results looking promising. So, it is proposed that IPS is expanded
to all areas of the country over a 3-year period.
Table C7 shows the costs of this expansion and the estimated benefits of doing so.
Table C7: estimated costs and benefits of expanding IPS across the 5 years of
the plan
Year 1 Year 2 Year 3 Year 4 Year 5
Number of local 37 94 150 150 150
authorities
(cumulative)
Total cost £6.2 million £11.4 £16.5 £15.9 £15.1
(inflated million million million million
discount)
35Dame Carol Black's Independent Review of Drugs
Year 1 Year 2 Year 3 Year 4 Year 5
Total benefits £7.6 million £19.5 £29.2 £28.8 £28.4
(inflated million million million million
discount)
Net present £1.4 million £8.1 million £12.7 £12.9 £13.4
value million million million
Cost benefit 1.23 1.72 1.77 1.81 1.89
ration
Housing support
We estimate that an additional investment of £150m over a 5-year period is needed to
provide housing support services to individuals in treatment with a housing problem
alongside the expansion of IPS.
This estimate is based on a model of embedding specialist housing support workers within
substance misuse treatment to provide ‘floating support’ services. In this analysis, these
services are rolled out to all local authorities alongside IPS over a 5-year period and the
capacity of treatment services is expanded according to the 5-year plan described above.
The average costs of providing these services are based on assumptions of an average
caseload for a housing support worker.
The estimated number of individuals requiring housing support each year is based on the
current number of adults and young people (under 18) in entering treatment with a housing
problem and the number of adults with an urgent housing problem that have been in
treatment for opiate use for over a year, as measured by the National Drug Treatment
Monitoring System (NDTMS) for 2019 to 2020. Fifteen per cent of people entering
treatment for the first time are assumed to drop out.
People in treatment who have a housing problem are assumed to have low support needs
and those with an urgent housing problem (no fixed abode) are assumed to have high
support needs. The analysis also assumes that only 50% of these individuals require
housing support and that only 80% of these will take up the services.
36Dame Carol Black's Independent Review of Drugs
Table C8: estimated number of individuals receiving housing support services
across the 5 years of the plan
Housing need Year 1 Year 2 Year 3 Year 4 Year 5
Clients with low-support 2,275 4,738 6,688 6,688 6,688
needs
Clients with high- 2,498 4,447 6,026 5,660 5,660
support needs
Table C9: estimated total housing support costs across the 5 years of the plan
(£ million)
Cost Year 1 Year 2 Year 3 Year 4 Year 5 Total
Clients with low-support 3.4 7.1 10.0 10.0 10.0 40.6
needs
Clients with high-support 9.4 18.5 25.9 25.7 25.5 105.1
needs
Programme costs 0.6 0.7 0.7 0.7 0.7 3.4
Evaluation 0.3 0.3 0.0 0.0 0.0 0.6
Total 13.7 26.7 36.7 36.5 36.2 149.7
These cost estimates are based on high-level assumptions about the current need for
housing support services among individuals in substance misuse treatment. So as a result,
the additional funding that would be needed to provide housing support may differ.
Further work is needed to improve evidence on the gap between housing need and the
available housing and housing support for people with alcohol and drug dependency.
37Dame Carol Black's Independent Review of Drugs
Annex D: areas to be covered by the
national Commissioning Quality Standard
Based on the findings of the review, the following areas should be covered by the National
Commissioning Quality Standard.
1. Thorough data and evidence-based local needs assessments.
2. Multi-agency place-based strategic and commissioning plans are agreed by local
health, criminal justice and local authority partners (including housing and
employment).
3. Experts by experience are engaged in planning, commissioning and service
delivery processes
4. The drug and alcohol treatment workforce is multidisciplinary.
5. Harm reduction services and outreach are a well-resourced part of the system,
including needle and syringe programmes and naloxone provision.
6. Non-opiate users are targeted though dedicated capacity based on local need,
including younger crack only users, cannabis and powder cocaine users.
7. Specialist young people’s services deliver evidence-based treatment interventions,
brief and early intervention, and targeted early identification.
8. There is family involvement in treatment and family support needs are met.
9. Every area has a professionalised and psychology led programme of psychosocial
interventions.
10. Broader recovery, including housing and employment support, is a core part of the
integrated system of care.
11. Aftercare support is sustained and meaningful.
12. Mechanisms and incentives are introduced to ensure that the NHS (particularly
mental health trusts) works with drug and alcohol users with multiple and complex
needs.
13. Drug and alcohol services provide access to healthcare, such as smoking
cessation, lung health and hepatology clinics.
38Dame Carol Black's Independent Review of Drugs
14. Healthcare services target drug and alcohol users with long-term chronic health
conditions, including through outreach work in drug and alcohol services.
15. Drug and alcohol services for children and young people work with wider health
and social care services to meet complex needs.
16. There are effective pathways into treatment from the criminal justice system
including prisons; police custody suites and courts.
17. Each local area encourages the development of (and supports) a recovery
community and grass roots organisations which target local populations, including
BAME communities, according to local need.
18. Service contracts include capacity to train specialists, support research and
implement new interventions.
39Dame Carol Black's Independent Review of Drugs
Annex E: reference documents
The following reports, reviews, guidance and data were important reference documents for
this review.
Advisory Council on the Misuse of Drugs. 2021. Drug-related harms in homeless
populations.
Dame Carol Black. 2020. Review of drugs: phase one report.
Dame Carol Black. 2020. Review of drugs: evidence relating to drug use, supply and
effects, including current trends and future risks
Department of Health. 2017. Drug misuse and dependence: UK guidelines on clinical
management.
Home Office. 2021. UK government Drug Recovery Champion annual report.
Home Office, Prime Minister’s Office, 10 Downing Street, Department of Health and Social
Care. 2021. Press release: £148 million to cut drugs crime.
Ministry of Housing, Communities, and Local Government. 2020. Extra help for rough
sleepers with drug and alcohol dependency.
Ministry of Housing, Communities, and Local Government. 2020. Rough sleeping
questionnaire: initial findings.
Ministry of Justice. 2020. A Smarter Approach to Sentencing.
National Health Service. 2019. NHS Mental Health Implementation Plan 2019/20 –
2023/24.
National Health Service. 2019. The community mental health framework for adults and
older adults.
National Health Service. 2021. NHS mental health dashboard.
Public Health England. 2018. Alcohol and drug prevention, treatment and recovery: why
invest?
Public Health England. 2020. Substance misuse treatment for young people: statistics
2019 to 2020.
40Dame Carol Black's Independent Review of Drugs
Public Health England. 2020. Substance misuse treatment for adults: statistics 2019 to
2020.
The Health Foundation. 2020. Press release: Today's public health grant announcement
provides some certainty, but more investment is needed over the longer-term (Health
Foundation response to the public health grant allocations).
41You can also read