SONAR Monthly Market Update - A deep dive into the freight markets with unprecedented - FreightWaves
←
→
Page content transcription
If your browser does not render page correctly, please read the page content below
SONAR Monthly Market Update
  A deep dive into the freight markets with unprecedented
         charts, analysis and market commentary.

                 February 2019 Edition

For distribution and use by FreightWaves SONAR seat licensed users only.

                          sonar.freightwaves.com

                                    1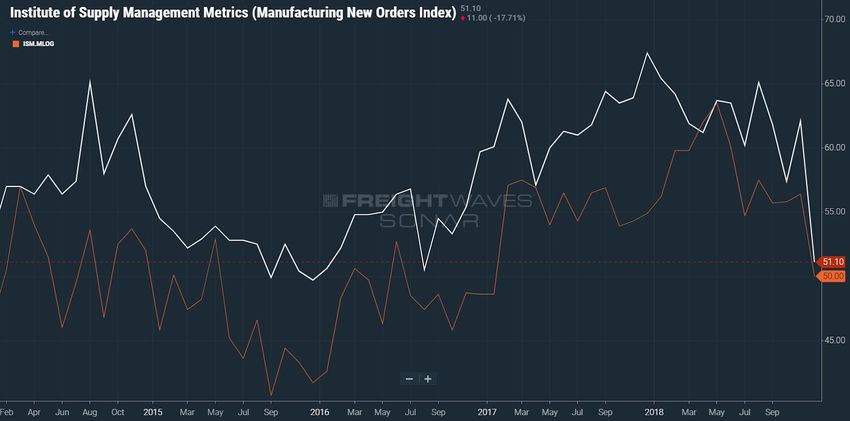
Table of Contents

1.   Economic Outlook…….…………………………….……………………………….……………………………….………………...Page 3-4

2.   Manufacturing……………………………..……………………..….……………………………….………………………………….Pages 5-6

3.   Retail and Inventories…..………………..…………..……...……………………………….……………...…………..……….Pages 7-8

4. Labor Markets………………………...……………...……………………..….………….…………………….……………..……...Pages 9-10

5.   Housing and Construction………..…………………………….…………………….……………….……………..…..…Pages 11-12

6. International Trade………...……………………………..……………………………………...……………..…………...…Pages 13-14

7. Pricing and Inflation…………………………………….………………………….…….……………..……….………..…….……...Page 15

8. Policy & Risks………………………………….………………………….………………………………...…………………….….….Pages 16-17

9. Freight Market Overview…………………….…………………….……………….………...…….…………….………Pages 18-25

                               sonar.freightwaves.com

                                           2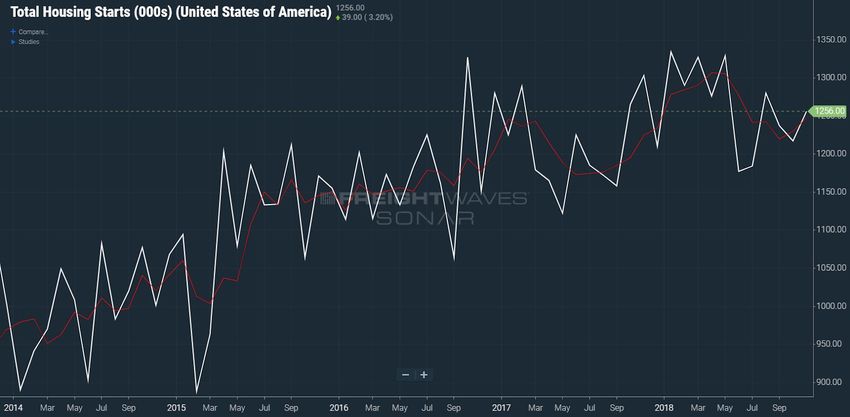
Economic Outlook

Source: Survey of Professional Forecasters, FreightWaves Economics

Current Environment: Government shutdown clouds economic performance

Signs continue to point towards a slowdown in growth over the next couple of months, and
the recent government shutdown has added some additional uncertainty into the mix at the
start of 2019. The U.S. economy likely slowed during the 4th quarter of 2018 after impressive
growth in the middle of the year. Consumer spending is estimated to have continued to
drive growth during the quarter, but a smaller contribution from inventories likely caused
growth to moderate to round out the year.

In total though, 2018 impressed with full-year GDP growth estimated at 2.9%, matching 2015
as the strongest year of growth since the recession ended. More importantly, many of the
areas of the economy that drive freight demand did particularly well. Growth in industrial
output, retail sales, and trade all hit multi-year highs during the course of the year,
contributing to one of the strongest years for freight movements in recent memory

                                         sonar.freightwaves.com

                                                       3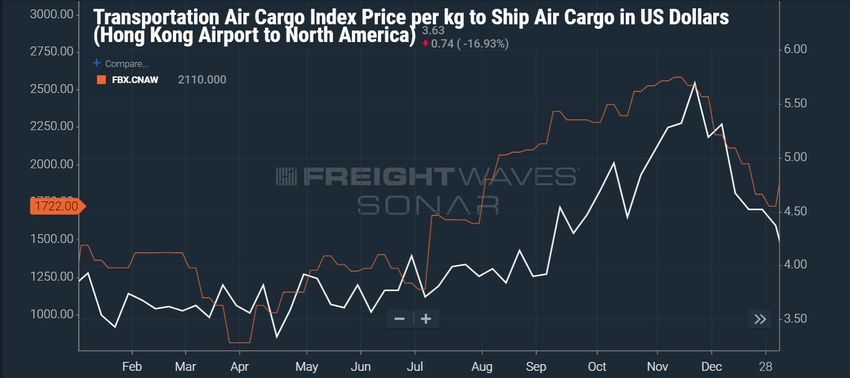
However, signs are already beginning to mount that suggest that economy is slowing down
at the start of 2019. Concerns over tariffs, global growth, and the strength of the U.S. Dollar
have darkened the outlook for export growth in 2019. Business investment demand appears
to have slowed significantly after strong growth, and will likely contribute little to growth
during the 1st quarter. Some of this is also likely connected to concerns over tariff policy, and
the recent plunge in oil prices should make matters worse for investment in the energy
sector.

Consumer spending remains the primary engine of demand in the economy, but even that is
showing some signs of slowing. After three straight quarters where real consumer spending
grew above 3.5%, household purchases are expected to take a hit during the 1st quarter. The
plunge in the stock market in December has taken some of the wind out of the sails of U.S.
households. Consumer confidence is starting to show some signs of concerns, and as a
result, consumers should spend at a more modest pace to start the year.

The recent government shutdown further complicates things during the 1st quarter. For one,
there is a direct impact on economic activity stemming from lost wages and productivity
from affected government workers. With the government reopened, some of this activity will
be made up in upcoming months as the government issues back pay. However, we still
expect that the shutdown cost the economy approximately 0.2% of GDP growth during the
quarter.

In addition, some of the government’s most important statistical agencies were forced to
stop releasing data during the shutdown. While many agencies, such as the Federal Reserve
and Bureau of Labor Statistics, secured their funding for the year before the shutdown took
effect, releases from both the Census Bureau and the Bureau of Economic Analysis were put
on hiatus. This affects several key indicators related to freight demand, including retail sales,
inventories, trade, and factory orders.

As a result, policymakers and market analysts have been forced to operate with an
incomplete view of the economy. This is a particularly challenging time to be without data,
with the economy shifting from the high pace of growth in 2018. Policymakers are currently
trying to assess the impact that tariffs are having on the economy and determine the
appropriate level of fiscal and monetary policy, and the lack of available data has complicated
the outlook. With the shutdown temporarily resolved, these agencies will begin releasing
data updates, but will likely be delayed in the near future as they deal with a backlog of work.

                                    sonar.freightwaves.com

                                                4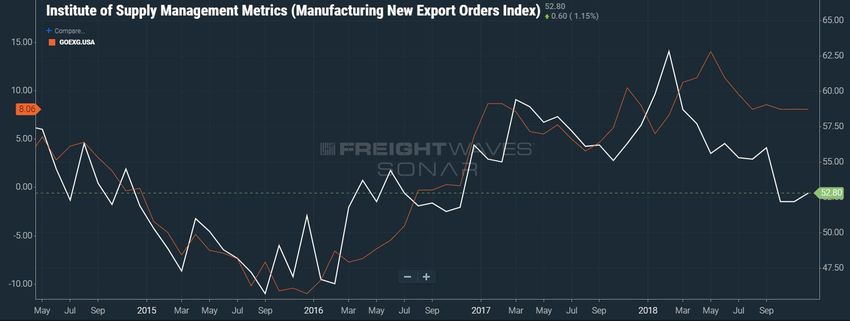
Manufacturing
In the industrial sector, i ndustrial production (IPROG.USA) growth again beat expectations
in December by advancing 0.3% from November’s levels. Year-over-year growth improved to
4.0%, down from the rapid pace of growth in the 3rd quarter but up slightly from November’s
results. Perhaps even more
impressive is that this gain came
despite a sizeable decline in
utilities production during the
month. Temperatures were
abnormally cold in November,
leading to a surge in heating
utilities during the month.
December’s decline is largely just
a normalization as the weather
returned to more regular
seasonal patterns.
Manufacturing industrial production, which excludes utility and mining production from
the total, surged in December. up 1.1% from November’s levels. This marks the largest
monthly gain in the manufacturing sector since February of 2018, and provides some relief
for a sector that looked to be stalling in the early parts of the 4th quarter. Year-over-year
growth in manufacturing production (IPROG.MFTG) jumped up to 3.2% in December, after
tumbling to 2% in the previous month.
It is not quite all clear for the manufacturing sector, however. Survey data from the Institute
of Supply Management’ (ISM)
purchasing managers’ index
(ISM.PMI) from the
manufacturing sector
declined sharply in December,
falling 5.2 points to 54.1 during
the month. This marks the
lowest reading in the ISM
headline index since
December of 2016, and the
largest monthly decline since
October of 2008 when the
economy was in the throes of
the financial crisis.
sonar.freightwaves.com
5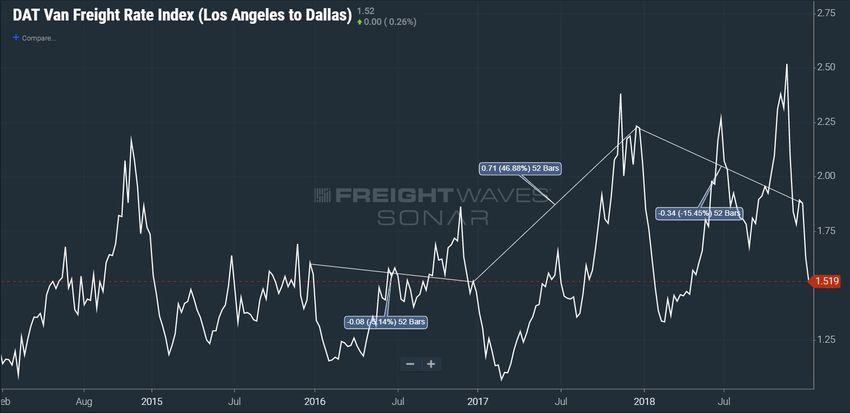
Manufacturing (cont.)
Results from PMI data represent the percentage of survey respondents that report that
business activity is expanding, so numbers above 50 signal expansion in the manufacturing
sector. PMI data historically has a tight correlation with year-over-year growth in
manufacturing production, with readings above 55 signaling above average growth.
December’s results suggest that activity is still expanding in manufacturing overall, but the
sector has lost considerable momentum as we head into 2019.
A look at the details in the ISM
data gives some insight into
where this loss in momentum is
coming from. The biggest
decline in December came from
the N ew Orders c omponent of
the index (ISM.MNEW), which
dropped 11.1 points during the
month. This would suggest that
upcoming demand for
manufacturing production is
going to be growing, but at a
below-average pace. Backlogs of Orders (ISM.MLOG) also saw a significant drop during the
month, falling to the break-even reading of 50.0.
Putting together the pieces, this would suggest that much of the current production that
occurred in December was devoted to fulfilling previous orders and reducing the amount of
backlogs faced by U.S. manufacturers. The sharp decline in new orders points to slowing
demand growth in upcoming months.
It is worth reiterating that none of these readings point to a contraction. The manufacturing
sector still faces a number of headwinds for 2019, with slowing global growth, continued
policy uncertainty, and softening business investment demand, but general strength
throughout the year from consumer demand should keep growth positive in 2019. Moreover,
if the trade dispute with China is resolved favorably and in a timely fashion, there could be
some upside risk to the outlook.
sonar.freightwaves.com
6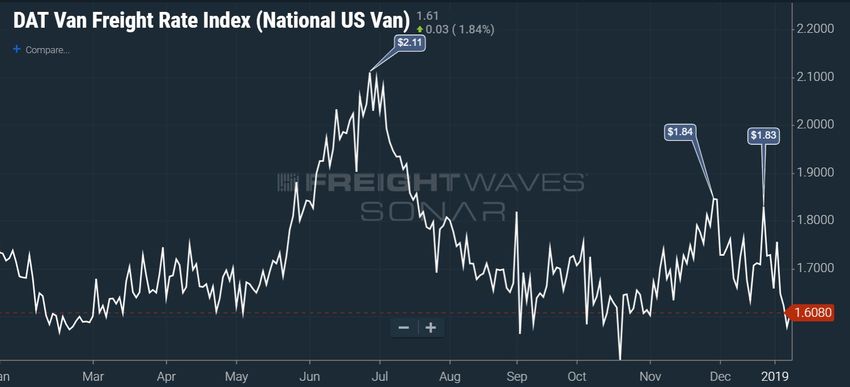
Retail and Inventories
Updates on the retail and inventory environment were sparse throughout the month, as the
government shutdown led to delays in the release of retail sales and retail, wholesale, and
manufacturing inventories. This is particularly disappointing for retail performance, because
January’s scheduled release would have covered December activity, which is the busiest
month of the year for retail.
In the absence of hard data
on holiday season
performance, the longer term
outlook for the retail sector
remains largely the same.
year-over-year growth in
retail sales (RESLG.USA) has
come down from the
multi-year highs seen in
mid-2018, but remains
generally solid at 4.2%.
Most of the fundamentals for consumer spending remain generally strong at the start of
2019. Job growth surged in December of 2018, and weekly results from jobless claims
suggest that the labor market remains tight in January. Wage growth has also been
impressive in recent months, and should accelerate further as businesses look for workers in
a sparse worker pool. This combination of solid job growth and healthy wage gains has driven
retail performance throughout the past year, and should continue to underpin consumer
spending going forward.
There are a few reasons to be concerned about retail activity however, particularly in the
short-term. The recent collapse in equity markets in December has negatively affected
household wealth, and may lead to weaker consumer spending at the start of the year
There are also signs that suggest that this recent drop in the stock market is starting to affect
consumer confidence. The Conference Board’s consumer confidence index experienced the
largest monthly drop in over three years in December, and pushed down further in January.
The recent government shutdown likely played a role in pushing consumer confidence even
lower in January, as households are beginning to get concerned about the future state of
policy under a divided Congress.
There are also some longer-term headwinds that consumers will face in 2019. The Federal
Reserve has paused on interest hikes at the start of the year, but consumers will likely be
affected by all of the 2018 rate hikes this year. This is particularly true for larger purchases in
sonar.freightwaves.com
7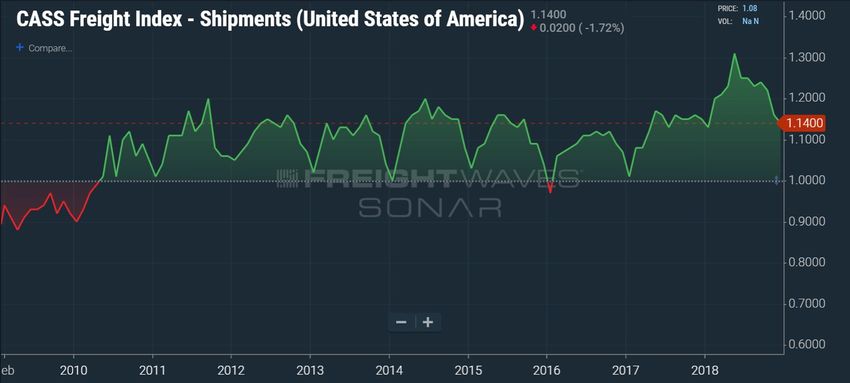
Retail and Inventories (cont.)

retail, such as automobiles and appliances, which are more sensitive to interest rate
movements.

In addition, the tariff situation with China is still unclear. Right now, much of the cost of
existing tariffs is absorbed by producers, but there remains the threat that the range of
targeted goods could broaden to include more consumer goods. The margins on these types
of goods are normally smally, and consumers would likely bear the brunt of these tariffs
should they go into place.

As a result of these factors, we still expect retail spending to be fairly strong in 2019, but will
likely not reach the pace seen in 2018. Consumers got a big boost in 2018 from favorable
conditions and a cut in taxes, but growth should return to a more normal pace in 2019.

                                                                 On the inventory side, levels
                                                                 have climbed steadily over the
                                                                 past couple of months after
                                                                 falling in the 2nd quarter of
                                                                 the year. Due to tariff concerns
                                                                 much of this inventory build
                                                                 has been driven by US
                                                                 businesses importing more
                                                                 goods than they traditionally
                                                                 would. This has caused
                                                                 inventory/sales ratios to creep
                                                                 up from the lows seen earlier
                                                                 in the year. The total business
                                                                 inventory-sales ratio
(TBIS.USA) reached 1.35 in October after hitting a multi-year low of 1.33 in the middle of the
year.

With the tariff situation still unresolved, companies are likely to be cautious about drawing
down at the start of the year. Once tariffs hit there should be a shift away from port volumes
and a rise in shipments from warehouses to retailers or manufacturers. When this happens,
inventory/sales ratios should continue to drift downward, resuming the trend seen in the first
half of 2018.

                                     sonar.freightwaves.com

                                                  8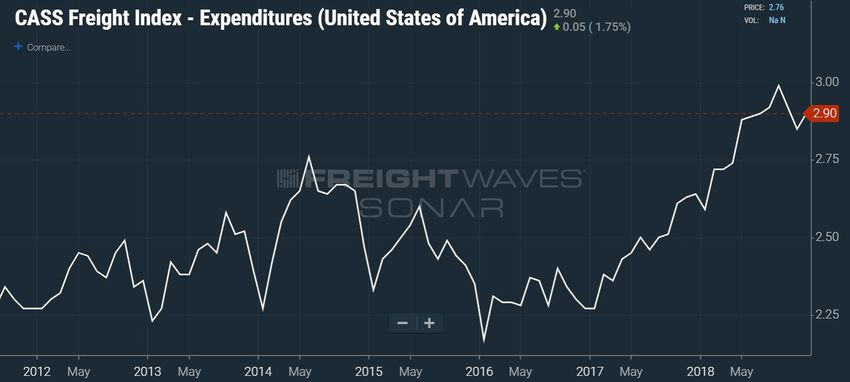
Labor Markets
As mentioned earlier, the primary support for consumer spending comes from strength in
the labor market. Healthy job growth fuels income gains in the economy, which in turn gives
households a foundation for spending.
The economy added an impressive 312,000 workers to payrolls in December, up from 179,000
in the previous month. This far exceeded consensus estimates of a gain of 184,000 and is the
strongest monthly gain since the 324,000 jobs added in February of this year. In addition,
data from both November and October were revised upward by a combined 95,000 jobs,
bringing up the average job growth for the fourth quarter to 254,000 jobs per month. During
2018, over 2.6 million workers were added to payrolls in the U.S. economy. That is up from the
nearly 2.2 million jobs added in
2017, and marks the best year of
job growth since 2015.
The results from 2018 are even
more impressive when you
consider that the labor market
was already fairly tight headed
into the year. The
unemployment rate has been at
or below 4% throughout most of
the past year, and well below
what most economist would consider the “natural” rate of employment in the economy.
Normally, as the labor market gets tight, employment growth tends to slow down as wages
rise. However, total employment (EMPS.NFRM) has risen at a fairly steady place over the last
several years, and has showed no signs of slowing down.
Much of this has been accomplished by drawing previously marginalized workers back into
the workforce. During the recession and early recovery years, many workers effectively
dropped out the workforce because they were so discouraged by job prospects. As wage
growth improved, these marginalized workers have rejoined the labor force and found
employment.
Going forward, the economy is going to transition from a high job growth, modest wage
growth environment to one with more modest job gains but better wage growth. As long as
economic growth in the economy remains at or above trend, labor market conditions will
remain tight and this shift should continue in upcoming quarters.
sonar.freightwaves.com
9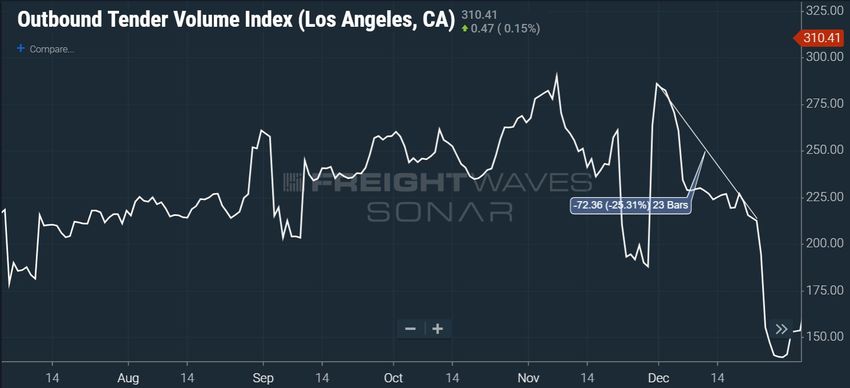
Labor Markets (cont.)
It is worth noting, however, that employment is typically a lagging indicator of economic
activity. With trouble in some of the other areas of the economy and policy uncertainty still
quite high, the economy is expected to cool and could bring the pace of hiring down with it.
Despite the general strength in hiring in the economy, job growth in the transportation and
logistics sector stumbled in December, as employment grew by just 2,200 during the month.
The main culprit was a 5,200 job decline among couriers and messenger services, which is
mostly parcel companies such as UPS and FedEx. However, several transportation industries
struggled during the month, with most registering job growth below 1,000 in December.
Within the transportation sector,
the trucking industry performed
relatively well by adding 2,900
workers to payrolls during the
month. This marks the eighth
consecutive month with positive
job growth and puts trucking
employment (EMPS.TRUK) 2.5%
higher than at this point last year.
For the year, the trucking
industry added 36,600 jobs in
2018, up from 9,400 added in 2017
and is the best year for hiring within trucking since the 50,400 jobs added in 2014.
The pace of hiring in the trucking industry has outpaced the rest of the economy for several
months now, which has helped to ease the capacity crunch from where it was earlier in the
year. In fact, with the economy expected to slow, the concern i s that the industry may be
adding capacity for demand growth that may not be there much longer.
The drop in hiring by parcel companies probably does not mean much in the grand scheme
of things. The decline comes on the heels of strong hiring in the previous couple of months,
which would suggest that parcel companies simply ramped up their hiring for the holidays
earlier than they normally would. Parcel companies did well with on-time delivery during the
holiday surge, and an earlier holiday ramp up in hiring would have helped achieve that.
Courier and messenger employment is still over 9% higher than it was at this point last year
and is one of the fastest growing industries in the entire economy.
sonar.freightwaves.com
10Housing and Construction
Housing and construction data has been another area that has been impacted by the
government shutdown, as updates on the value of construction put into place, housing
starts, and new home sales were all delayed in January. The little data that has been available
has not been positive, leaving little reason for optimism about the housing sector in 2019
On the construction side, h
ousing starts (HOUS.USA) have been significantly affected by
weather related disruptions
over the past few months.
Hurricane season followed by
wildfires in California have
caused some significant
swings from month-to-month,
making it difficult to discern
the underlying trends in
construction. For the
short-term future, we expect
that there is still some
significant pent up
construction that will be
taking place over the next couple of months, as weather-affected areas continue to rebuild.
However, home building activity still faces some significant structural challenges that will
constrain activity going forward. Potential builders still face constraints from a lack of skilled
workers and a shortage of developed lots to build on. Once the weather-related fluctuations
settle, these longer term constraints will continue to affect the pace of home building. We
expect that the pace of housing starts will gradually improve in 2019, but should remain
relatively subdued.
On the demand side, sales have also been generally disappointing over the past year. Sales of
new home sales from December are not yet available, but existing home sales plummeted
to end the year, raising some real concerns about the state of home buying going forward.
Sales of previously-owned homes fell 6.4% in December from November’s levels to a 4.99
million annualized pace. This marks the first time that the pace has fallen below 5 million
units in over three years and is a whopping 10.3% from December 2017.
The lack of available inventory for purchase remains a key issue for existing home sales.
Home building activity has been weak, so potential buyers are having a hard time finding
homes for
sonar.freightwaves.com
11Housing and Construction (cont.)
purchase. This, in turn, has pushed up prices in the economy throughout the course of the
year and further affected demand. Rising mortgage rates may also be curbing activity. The
pace of home price appreciation has eased in recent months but the 30-year mortgage rate
has increased by 60 basis points throughout the course of the year. This has further affected
the ability of potential consumers to purchase a home.
Lastly, the recent change in the tax code contained some provisions that were unfavorable to
homeowners. Specifically, the limits placed on the amount of property taxes that can be
deducted from taxable income have removed some of the incentives for purchasing
higher-end homes, particularly in high property tax states in the Northeast.
This combination of rising home prices, higher mortgage rates, and unfavorable changes to
the tax code have created a difficult environment for home buying activity. As with
construction, these issues are not disappearing any time soon, so expect home purchasing
behavior to advance at a slow pace in upcoming quarters. The H ome Purchase Sentiment
Index (HPSI) collected by Fannie Mae has trended steadily downward since early-2018, falling
to the lowest level since the start of 2017 in December. This would suggest that the problems
facing the housing industry
The softness in home buying has begun to affect some of the connected industries in retail.
Home buying typically drives remodeling and renovation spending, as well as additional
spending on home furniture and household appliances. Retail spending on building
materials and appliances have seen growth in 2018, but have lagged behind overall retail
spending in the economy. It is through these channel that home sales affects freight
demand in the trucking industry, and weakness on the home sales front combined with
softness in home building has negative implications going forward.
sonar.freightwaves.com
12International Trade
Like housing, much of the data updates on the state of trade have been delayed by the
government shutdown. Monthly trade figures are captured by the Census Bureau, while the
Bureau of Economic Analysis reports quarterly results on real exports and imports as part of
the GDP release. The shutdown began just days before a scheduled release of November’s
trade results, so for now, the official trade data runs only through October.
This is an unfortunate development for the trade sector, because the lack of data comes just
as analysts are looking for signs of tariff-induced swings in global trade patterns. Data from
on both goods imports growth (GOIMG.USA) and goods exports growth (GOEXG.USA) has
been volatile over the past several months, as buyers and shippers in the international trade
arena have shifted away from normal season in an attempt to minimize the impact of tariffs.
Despite these abnormal
fluctuations, growth in trade has
remained generally strong
throughout the past year, with
both import and export growth
remaining elevated after
moderating from multi-year
highs earlier in 2018
Signs are emerging that suggest
that the pace of trade growth is
slowing at the start of the year,
however. Data from both China
and Europe point to a slowdown in economic growth in those two regions, particularly within
the manufacturing sectors. As a result the International Monetary Fund (IMF) r ecently
lowered projections for global growth for 2019. A global slowdown in economic activity is bad
news for U.S. exports, as this would translate into softer demand for U.S.-made products. In
addition, the general strength of the U.S. dollar has hampered export demand by making U.S.
products relatively more expensive for potential foreign buyers.
Survey data backs up this notion of slowing trade growth going forward. Within the ISM
manufacturing index, data on N ew Export Orders improved slightly in December, but
remains far below the levels seen early in 2018. This subcomponent in the ISM data has been
hovering around 52 over the past few months, signaling positive, but subdued growth.
sonar.freightwaves.com
13International Trade (cont.)
Historically, the New Export Orders component of the ISM (ISM.MEXP) index has a fairly tight
correlation with year-over-year growth in goods exports, and leads export performance by 1-2
months. The surge in export
growth in the middle of the
year was preceded by a similar
surge in export orders a
couple months earlier.
What this means is that there
may be a moderation in
export activity once
government data releases
resume in the trade sector.
Growth will likely remain
positive barring some sort of global growth meltdown, but the pace of growth should be
slower in 2019.
On the import side, import growth should be slightly stronger than exports, as the U.S.
economy is performing better than much of the rest of the developed world, and the strong
U.S. encourages imports into the country. Like exports, import volume has been subject to
considerable volatility, but given the fact that the U.S. economy itself is expected to moderate
throughout the course of the year, import activity should also be weaker in 2019 than it was in
2018.
For freight markets, this suggests weaker demand growth overall from the trade sector. Like
many other aspects of freight demand, 2018 was an overall impressive year for trade activity,
and as growth in the U.S. and the rest of the world slows and potentially protectionist policies
take hold, there should be less movement of goods between economies in 2018
sonar.freightwaves.com
14Prices and Inflation
Overall, signs from nearly every areas of freight demand point to softening growth headed
into next year. In addition, hiring trends within the industry suggest that trucking has been
adding capacity at a decent clip. As a result, trucking will likely feel less capacity-constrained
in 2019 than it did in 2018.
As a result, rate increases should calm somewhat within trucking. Year-over-year rate
inflation in the trucking industry is facing increasingly tough comparisons to last year, which
is going to put downward pressure on yearly gains going forward. Freight rates began their
surge last in August in the aftermath of Hurricane Harvey, and continued through the
impressive holiday season of 2017 and the ELD mandate. As a result, the tough comparisons
should lead moderating yearly
rate growth even if rates
continue to climb.
Despite this, data from the
Producer Price Index (PPI)
suggests that rate gains
continue in the trucking
industry. Producer prices for
General Freight Trucking
(PPIG.GFTK) rose 0.6 percent
in December on the heels of
another 1.3 percent gain in the
previous month. This pace has been enough to keep year-over-year rate inflation at or above
8.0 percent in recent months, registering 8.0 percent in December despite increasingly
tough comparisons to last year.
Gains during the month were almost entirely driven by long-distance truckload services,
which posted a third consecutive monthly gain above 1 percent with a 1.3 percent gain in
December. Long-distance less-than-truckload (LTL) and local trucking rates both
experienced declines during the month, though year-over-year growth held relatively stable
relative to recent performance at 9.8 percent and 4.7 percent, respectively.
This would suggest that carriers still retain some pricing power in this environment of
moderating demand,and have been able to extract higher rates across many different types
of freight. Year-over-year rate inflation probably will not reach the highs seen in the middle of
last year for quite some time, but the pace of rate increases is still well above average as we
head into next year. Longer-term, we expect that rate increases will settle in around 5%
year-over-year through 2019, though much of this depends on if the economy is able to
sustain a slightly above average pace of growth throughout the year
sonar.freightwaves.com
15Policy and Risks
Much of this outlook for above-average but moderating growth going forward hinges on the
policy environment in 2019, which at this point remains largely unsettled. Fiscal, monetary,
and trade policy have all entered into a period of uncertainty over the past view months, and
the path that policymakers choose will go a long way to determining growth during the year.
The p
artial shutdown of government operations thrust fiscal policy into the forefront early in
2019. The shutdown started in late-December and lasted a record 35 days before President
Trump signed a temporary funding agreement. This temporary agreement allows the
government to function as normal until February 15th, at which point either a more
permanent solution will be reached or the government will shut back down
As it stands, the shutdown in January already disrupted economic activity during the month.
Affected worked were either furloughed or forced to work without pay for the duration of the
shutdown. These federal workers will be receiving back pay now that the government has
reopened, but there are hundreds of thousands of contractors and businesses that interact
with the government that must simply deal with the lost business and wages during the
shutdown. In addition, the economy suffers from the lost productivity for workers that are
furloughed. The combination of lost productivity from federal workers and lost wages from
entities that interact with the government likely subtracted approximately 0.2% from 1st
quarter growth.
It is also worth noting that there was not much compromise involved in this temporary
agreement. President Trump agreed to reopen the government shortly after LaGuardia
airport was forced to shut down because federal air traffic controllers did not show for work.
However, the President seemly remains committed to his stance of requiring border wall
funding for any permanent funding agreement. As a result, we may soon find ourselves with
the same problems we had at the end of December when the shutdown first began.
Because of the drama surrounding the government shutdown, tariff policy took a bit of a
backseat in January. The U.S. and China entered into a temporary moratorium on escalating
their t rade conflict at the end of December. Negotiations have continued throughout the
month of January, but the two nations still apparently remain far from an agreement.
Chinese officials unofficially made an offer to eliminate their trade surplus with the U.S. by
ramping up purchases of U.S.-made goods, but concerns over intellectual property
protection and other non-tariff barriers have kept the two sides relatively far apart on a more
comprehensive agreement.
Unfortunately, the lack of a trade deal only serves to keep policy uncertainty high in 2019.
Survey data suggests that manufacturers and business owners are beginning to alter their
sonar.freightwaves.com
16Policy and Risks (cont.)
hiring and investment plans due to the lack of clarity on the trade front. The longer this drags
on without a resolution, to bigger the effect it will have on economic activity.
Oddly enough, the recent slowdown in activity in both China and the U.S. should help
negotiations going forward. As mentioned throughout, there are a number of different
factors that suggest that the U.S. economy is slowing down from the rapid pace seen in 2018.
By the end of 2019, the economy will likely be growing at a trend-like pace a will be less
capable of absorbing negative shocks from trade policy.
Conditions in China are far worse, as the Chinese economy slowed throughout 2018. For the
year, 2018’s growth of 6.6% was the worst performance in 28 years. China faces significant
structural challenges after years of debt-fueled overinvestment in their industrial capacity.
Manufacturing appears to be contracting already in the world’s second largest economy, and
export performance turned sharply negative at the end of the year. Against this backdrop,
China can ill afford additional complications connected to a trade dispute with the U.S.
Because of these concerns about fiscal and trade policy, the F ederal Reserve held interest
rates steady in the first meeting of 2019 for the Federal Open Market Committee (FOMC).
With inflation low, unemployment near historical lows, and signs emerging that growth is
slowing, the Fed may decide to hold off on rate increases entirely in 2019. For now, we still
estimate 1-2 rate hikes throughout the course of 2019 after four rate increases in 2018.
It is worth noting that there is a considerable lag between when monetary policy is enacted
and when it actually takes hold on economic activity in the economy. What this means is that
the economy next year will be affected by the rate increases that were put into place
throughout 2018, particularly for the housing and automotive sectors. Even if there are not
further increases from this point, much of the impact on 2019 growth have already been put
into place. Still, if the Federal Reserve decides to hold off on rate increases altogether, it
would give a slight boost to the economic outlook towards the end of 2019 into 2020.
sonar.freightwaves.com
17Freight Market Update
2018 may have started with a bang, but it ended with a fizzle as freight volume slid from the
beginning of December to the end. The Cass Freight Index for shipments was down
year-over-year for the first time since September of 2016 – December 2017 was 1.15 vs
December 2018 at 1.142. Though it was not a dramatic drop, it ended the longest streak of
consecutive monthly YoY increases this millennium of 26 months. It was the first 20-month
expansion since 2010-11 as the economy recovered from the recession. Prior to that there was
a 25-month streak from 2003-5. It should also be noted that the 1.142 value was the second
highest for the month of December in the last decade. December of 2017 being the highest.
Even though volumes fell freight costs increased sequentially over November. The CASS
Freight Expenditure Index that measures the average total cost of freight including things
like fuel and other accessorial charges increased to $2.90 from $2.85. The index also measures
rail cost. It was the first monthly increase in the index since September. Holiday surges and
increased import volume due to tariff concerns and holiday inventory replenishments
certainly had an impact. The movement is a bit unusual, as it marks the second time in the
past six years for December to be higher than November. Last year being the other
occurrence as the market was heating.
sonar.freightwaves.com
18The National Tender Volume Index (OTVI.USA) fell over 11% from December 1st to the 23rd.
Characterized by a relatively smooth trendline, the OTVI did not take an erratic path to the
bottom. Volumes fell gradually and did not spike or drop significantly in a short time. With no
major occurrences in the market there was little disruption.
December freight volume is traditionally driven by retail demand and keeping store shelves
and distribution centers full. December of 2017 was characterized by unusually high freight
volume due to a busier than expected retail season and parcel carriers like UPS being caught
off-guard as capacity was already thin due to hurricanes and strong economic growth. On
sonar.freightwaves.com
19this note, seeing some contraction on a year-over-year basis was inevitable, but market
participants were far more prepared in 2018 as the general economy was also not quite as
bullish as it was a year ago.
With volume sliding, capacity was readily available outside of the week and a half leading up
to Christmas as drivers positioned themselves closer to home. The National Tender Rejection
Index dropped to 12.31% -- the second lowest value of the year at this point next to October
27th -- by the second week of December, and gradually increased to 13.25% over the next
seven days before shooting up to peak above 16.2% on Christmas. It is important to note that
the rejection rates climbed on lower volume, meaning that capacity would have been doubly
constrained had there been any late month surges.
Weather did not have a significant long-term impact in the U.S. freight market in December
with it being relatively warm in the eastern half of the country. This meant less snow cover for
trucks to deal with and less volatility in the market. Most of the disruption originated from
holiday availability as drivers were positioned closer to home for Christmas which drove
tender rejection rates higher around Christmas even though volume was declining.
sonar.freightwaves.com
20Spot market rates were lower than a year ago as the DAT Van Freight Rate Index showed an
average rate for dry van truckload moves peaking around Christmas at $1.83 versus $1.941 in
2017. Another difference from a year ago is the fact the index shows us that spot rates
remained elevated for several weeks after Christmas whereas this year rates fell back
immediately following the holiday, another indication the freight market is much more
stable than a year ago.
The Los Angeles to Dallas spot rate, which has been extremely volatile over the past 18
months, had a muted December peak value of $1.89 – 18% lower than 2017 at $2.23 per mile.
L.A. had been the hot market this fall as volumes surged from the overwhelming amount of
inbound container volume being pulled into the country in front of the tariff deadline that
was January 1st before being extended to March. While most of the country had been seeing
volume decline L.A. was still very active. December was the first month to have sequential
contraction in volumes since the June to July. Volume dropped roughly 12% from November
to December on average.
sonar.freightwaves.com
21The spot market for container rates which had been heated into mid-November also cooled
throughout December. The average rate for a 40-foot container from China to the North
American West Coast dropped 21% in December. The drop is not terribly unusual late in the
year, but it normally occurs earlier in the season with holiday inventories having already been
brought into the country in early November.
Pairing with the container flows, air cargo rates followed a similar pattern dropping about
18% in the Hong Kong to North America lane (AIRUSD.HKGNOA). Air cargo is a much more
expensive mode of transport than maritime shipping, so the freight tends to be more
sonar.freightwaves.com
22expensive so that it can absorb the cost. Items such as electronics and pharmaceuticals tend
to be correlated in this lane. The maritime lane got going earlier than air cargo which
traditionally peaks in November. This year the peak price was roughly 2.3% higher than in
2017.
With L.A. settling in December the Northwest corner of the country picked up the slack in
terms of volatility. Tender rejection rates in the region (OTRI.URNW) were extremely volatile
as the bulk of their produce season occurs in late fall. Christmas trees also move in earnest
around this time. One of the biggest factors leading to this was the fact L.A. had been the
place for carriers to go to find freight, pulling a lot of capacity south as reflected by the
steadily declining rejection rate in the West region (OTRI.URWT). West Coast rejection rates
had the smoothest decline in the country in December.
The Midwest was the other region of the country experiencing elevated tender rejection
rates, hitting above 20% most of the month, while the rest of the U.S. averaged 14-15%.
Volumes slid in the Columbus and Indianapolis markets, falling roughly 8% and 3 %
respectively. but the Chicago and Joliet markets fell much more severely throughout the
month, declining 22 and 14% respectively. Drivers being positioned for home-time were a big
factor in keeping tender rejections high on lower volume.
sonar.freightwaves.com
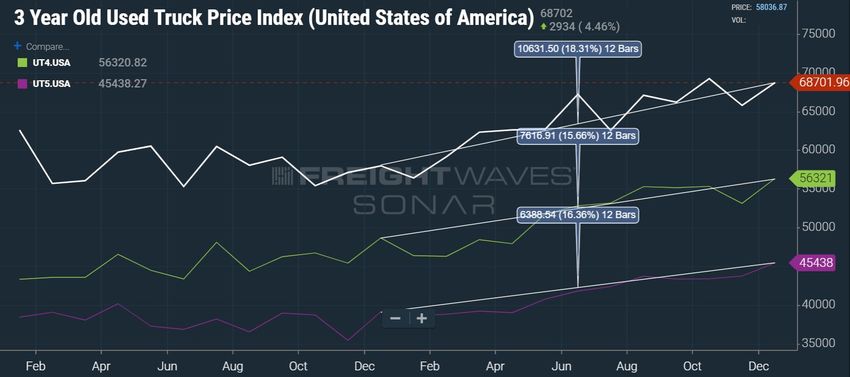
23Used Truck prices for 3 (UT3.USA) 4 (UT4.USA) and 5 (UT5.USA) year old models all increased
sequentially in December after 3 and 4-year models fell in November. This caps off a year
where all 3 values increased by 15-19% as demand for equipment went higher due to tax
break benefits and increased demand for capacity. Most large carriers reported very
profitable years, some even hitting record low operating ratios. This additional cash
combined with tax cuts increased demand for trucks that have lower maintenance expense.
Prices are expected to come back down as the market cools and tax breaks expire.
sonar.freightwaves.com
24Looking into early 2019, January has been a much quieter month than it was in 2018. Tender
rejection rates have fallen throughout the month even though volume was strong early.
There has been no indication of any significant additional inbound volume in front of the
tariff implementation to this point. Chinese New Year is just around the corner and
international shippers are running out of time, but they may have already made their move.
sonar.freightwaves.com
25You can also read