SOLAR SECTOR UPDATE - MAC Global Solar Energy Index
←
→
Page content transcription
If your browser does not render page correctly, please read the page content below
AUGUST 12, 2021

                                                                                                                                   M AC S O L A R I N D E X . CO M

                                              S O L A R S E C T O R U P D AT E
           The MAC Global Solar Energy Stock Index (SUNIDX) is licensed as the tracking index for the Invesco Solar ETF* (NYSE ARCA: TAN)
                               Note: Index performance does not reflect transaction costs, fees or expenses of TAN.
                                                 For more information, visit: www.Invesco.com*

             MAC Global Solar Energy Index (SUNIDX)                                                   (4) broadening solar growth in India, Turkey, Latin America, Middle
                                                                                                      East, and Southeast Asia, and (5) strong demand for renewable
                                                                                                      energy as countries seek to meet their carbon-reduction targets
                                                                                                      under the Paris COP21 global climate agreement.

                                                                                                      Bearish factors for solar stocks include (1) the temporary increase
                                                                                                      in polysilicon and solar module costs being caused by polysilicon
                                                                                                      factory disruptions and pandemic-related supply chain shortages
                                                                                                      and costs, (2) the transition in China to unsubsidized solar, (3)
                                                                                                      the continued negative effect on U.S. solar from the Section 201
                                                                                                      tariff on imported cells and modules that took effect in February
                                                                                                      2018, and (4) temporary obstacles to India's solar growth from the
                                                                                                      pandemic and the government's solar tariffs.

                                                                                                        Solar stocks settle back on industry bottlenecks
                                                                                                        but see support from strong growth and policy
                                                                                                                            prospects
                                                                                                      Solar stocks are sharply higher from their pandemic lows seen in
       SOLAR INDEX PERFORMANCE                                                                        spring-2020 due to (1) the overall recovery in global stocks seen
                                                                                                      since the pandemic-induced dip in spring 2020, (2) the realization
The MAC Global Solar Energy Stock Index, the tracking index for                                       that solar is emerging as a key solution to climate change as
the Invesco Solar ETF (NYSE ARCA: TAN), has settled back in                                           it becomes the cheapest source of new electricity generation
recent months after posting a 12-year high in January 2021. The                                       and is paired with battery storage for 24/7 electricity, (3) the
Index is currently down by -14% on a year-to-date basis, giving                                       Democratic sweep of Washington in the November 2020 election
back some of the extraordinary +235% annual gain seen in 2020.                                        and expectations for a strong solar push from Washington, (4)
                                                                                                      the extension of the solar ITC by two years in December 2020,
The MAC Solar Index in 2020 rallied sharply as the industry                                           and (5) a big European renewable energy push to stimulate the
shook off the impact of the pandemic and looked ahead to more                                         pandemic-ravaged economy and meet its Paris climate goals.
favorable solar policy support as Joe Biden won the November
2020 U.S. presidential election and Democrats took control of both                                    Global solar installs in 2020 grew at a very strong rate of +21%
the House and Senate. The Index has since fallen back as solar                                        despite the pandemic, according to Bloomberg New Energy
stocks hit some short-term roadblocks caused by a temporary                                           Finance (BNEF). Moreover, global solar growth is expected to
polysilicon shortage and various pandemic-related supply chain                                        have an even bigger year in 2021 with growth of +28%, according
disruptions and costs.                                                                                to forecasts by BNEF.

Bullish longer-term factors for solar stocks include (1) expectations                                 Solar growth is currently running strong in China, the U.S., Europe,
for a global dash to reduce carbon emissions now that the U.S.                                        and many other countries around the world. China's solar installs
has reclaimed its leadership role in the global Paris climate effort,                                 in 2021 will grow by +32%, U.S. solar installs will grow by +39%,
(2) the strong global solar demand picture that has resulted from                                     and EU installs will grow by +23%, according to BNEF forecasts.
the fact that solar has now reached unsubsidized grid parity in                                       India's solar installs in 2021 are expected to soar by +137% on a
more than two-thirds of the world, (3) the pairing of solar with                                      recovery from 2020's slump of -63%.
large-scale battery systems to provide a 24/7 electricity solution,

 Copyright, 2021. All rights reserved. MAC Solar Index. www.macsolarindex.com. The information contained herein is not guaranteed as to its accuracy or completeness. No express or implied
 warranties nor guarantees are made. No responsibility is assumed for the use of this material and those individuals acting on this information are responsible for their own actions. Any opinions
 expressed herein are subject to change without notice. Nothing contained herein should be construed as an offer to buy or sell, or as a solicitation to buy or sell, any securities or derivative
 instruments. Security and derivatives trading may not be suitable for all recipients of this information. Please consult with your investment advisor before investing.
 *Please note: This material is provided solely by MAC Global Solar Energy Index, not by Invesco which bears no responsibility for the content or use of this material.
S O L A R S E C T O R U P D AT E AUGUST 12, 2021
SOLAR PV GROWTH OUTLOOK
Global solar growth is expected to show another very strong year China's transition to subsidy-free solar is
in 2021 despite ongoing disruptions from the Covid pandemic. progressing well
Bloomberg New Energy Finance (BNEF) is forecasting that solar
installs in 2021 will grow by +28% to 182 GW from 143 GW in There is strong optimism about the Chinese solar market as it
2020. shakes off the Covid pandemic and shifts toward a subsidy-free
market in the coming years.
In 2020, world solar growth soared by +21% to 143 GW,
accelerating from the +9% growth rates seen in both 2018 and The markets are also optimistic about the Chinese government's
2019, according to BNEF. Solar growth in 2018 and 2019 was intent to rely heavily on solar to meet increasingly aggressive
hindered by a temporary pull-back in Chinese solar installs and climate targets. In September 2020, China's President Xi
two years of global retrenchment after two very strong global surprised the world by announcing at the UN General Assembly
solar growth years in 2016 (+34%) and 2017 (+32%). Over the that China intends to be carbon-neutral by 2060, which is the first
past five years (2015-20), global solar has grown by a very strong time China has set such a target.
compounded annual growth rate of +21%.
In December 2020, President Xi then announced a more specific
Solar growth soared in 2020 despite the pandemic, which slowed target of 1,200 GW of solar, wind, and biomass capacity by
planning, construction, and supply-chain deliveries. Solar is being 2030, which is nearly triple the current capacity of 450 GW. The
installed at a torrid clip across the globe due to its low cost and Chinese government also proposed a new clean power mandate
attractiveness as a long-term solution for a sustainable energy that would require grid operators, power retailers, and large
future. Solar's low cost means that it is now on a strong long-term consumers to source 25.9% of their output from solar, wind, or
growth path without the need for government subsidies. biomass by 2030. BNEF estimates that meeting that mandate
would require 1,580 GW of cumulative capacity by 2030, or a third
Solar will account for 28% of all electricity capacity additions, and higher than President Xi's earlier goal of 1,200 GW.
there will be a massive $4.2 trillion of spending on solar through
2050, according to BNEF's 2020 New Energy Outlook. BNEF The Chinese government in March 2021 then announced a draft
forecasts that solar PV will account for 38% of world electricity of the 14th Five-year Plan for 2021-2025. That plan reiterated the
capacity by 2050, up sharply from the 2019 level of 11%. targets for carbon emissions to peak before 2030 and achieve
carbon-neutrality by 2060. The plan also contained some details
Solar will easily be the largest source of electricity generation in on how those targets will be met. One of the key targets in the
2050 at 38%, far outpacing wind at 20% and gas at 15%. BNEF plan was a goal of generating 20% of its electricity from non-fossil
expects coal to fall to 7% of electricity generation by 2050 from fuel sources by 2025, which is just a few years away. The 20%
28% in 2019, and for nuclear to drop to 2% in 2050 from 5% in target was up from the previous target of 15.9%.
2019.
Turning to solar growth rates, Chinese solar installs in 2020
"I see solar becoming the king of the world's electricity markets, soared by +57% to 52.1 GW from 33.1 GW in 2019. The 2020
Fatih Birol, executive director of the International Energy Agency install level of 52 GW was just slightly below the record high of
(IEA), said upon the release of the IEA's flagship World Energy 53.0 GW posted in 2017.
Outlook report. In that report, the IEA forecasts that solar will
easily become the largest source of electricity generation by Solar installs were undercut in early 2020 by the Covid pandemic
2040. The report goes on to say: but finished the year on a very strong note as developers sought
to beat the expiration of some subsidies at the end of 2020.
"Solar PV becomes the new king of electricity supply and
looks set for massive expansion. From 2020 to 2030, solar BNEF is forecasting that Chinese solar installs in 2021 will have
PV grows by an average of 13% per year, meeting almost another big year with growth of +32% to 69.0 GW. Strength in
one-third of electricity demand growth over that period. Global 2021 is expected to be driven in part by the completion of projects
solar PV deployment exceeds pre-crisis levels by 2021 and that were started in 2020 to qualify for subsidies.
sets new records each year after 2022 thanks to widely
available resources, declining costs and policy support in over Chinese solar installs are expected to remain strong even though
130 countries." the Chinese government is transitioning to a solar market without
national subsidies. Developers are showing strong interest in
Demand for solar should surge in the coming years as solar costs subsidy-free solar projects since they can still earn attractive
continue to fall and as solar becomes even more competitive internal rates of return. The Chinese government has also added
against fossil fuels and nuclear. Solar's levelized cost has already benefits to subsidy-free projects, such as a guaranteed price for
plunged by an overall -85% since 2010 and by an average -11% solar electricity output and priority on the grid. Solar projects can
per year over the last five years, according to Lazard (see p. 9). still qualify for subsidies at the local level.
M AC S O L A R I N D E X . CO M 2S O L A R S E C T O R U P D AT E AUGUST 12, 2021
SOLAR PV GROWTH OUTLOOK (CONTINUED)
The move away from national subsidies should be a long-term There is concern that the ban could hamper the ability of U.S.
positive factor for the Chinese solar industry since the industry developers to import solar products or raise the price of imported
should be able to grow in a more predictable manner with more solar panels, thus curbing the U.S. solar growth rate. However,
stable profit margins, as opposed to the boom-bust days of the a Citigroup analyst quoted by Bloomberg said he expects the
past that were caused by erratic government subsidy policies. impact from the ban will be "mild" since the U.S. only buys a small
portion of China's solar module output. The U.S. in recent years
Without subsidy distortions, the solar industry should be able to has had tariffs on Chinese solar products, which means that U.S.
more closely match end-user demand, thus eliminating the small imports of Chinese solar products are relatively small.
and less competitive players that can only compete when there
are generous subsidies. The current trend should accelerate Also, the U.S. accounted for only 14% of global solar installs in
whereby the solar industry is dominated by large players with the 2020, which means that the impact of the U.S. ban is likely to have
best technology and the lowest production costs. only a minor impact on the overall global solar growth rate even if
it impedes the U.S. solar install rate.
In recent years, the Chinese solar market has been buffeted by
erratic subsidy policies that previously caused upheaval in the Global solar companies have been aware of the Xinjiang risk for
industry. For example, Chinese solar installs in 2017 soared by months and have already been taking steps to divert supplies
76% to a record high of 53.0 GW as developers took advantage away from Xinjiang and do a better job of ensuring transparency
of very generous government subsidies. in their supply chains.
However, in response to that 2017 install surge, the Chinese The global solar industry as a whole is also taking steps to
government, on May 31, 2018, announced a sharp cut in most of address allegations of forced labor. About 175 solar companies
its solar subsidies, with utility-scale solar capped at 40 GW and from around the world signed a pledge sponsored by the Solar
roof-top distributed generation (DG) capped at 10 GW in 2018. Energy Industries Association (SEIA) to ensure that their supply
China's subsidy phase-out plan was referred to in the industry as chains are free of any forced-labor products (see "Solar Companies
the "China-531" order after the date of the announcement. Unite to Prevent Forced Labor in the Solar Supply Chain"). The SEIA
also released a Supply Chain Traceability Protocol that helps
The government was forced into its China-531 action partly by the companies prove that their supply chain is free of any products that
big backlog of unpaid subsidies that reached $23 billion by the are potentially connected with forced labor (see "New Traceability
end of 2018. The China-531 curtailment of subsidies caused a Protocol Allows Solar Companies to Ensure Ethical Supply Chain").
sharp drop in Chinese solar installs by -17% to 44.3 GW in 2018
and -25% to 33.1 GW in 2019. U.S. solar is seeing blockbuster growth
Regarding Chinese labor issues, the U.S. government in June U.S. solar growth is seeing blockbuster growth due to its low cost
2021 imposed a "withhold release order" that blocked the import and strong policy support. U.S. solar installs in 2020 soared by
of polysilicon products produced by five companies based in +64% to 18.9 GW, adding to 2019's strong +15% growth rate to
China's Xinjiang province due to allegations the companies 11.5 GW. BNEF is forecasting another strong year for U.S. solar
were involved with forced labor programs of the Uyghur Muslim in 2021 with growth of +39% to 26.2 GW.
minority. The Biden administration also placed those companies
on the Treasury's Entity List, which blocks U.S. exports to those Solar accounted for a hefty 43% of U.S. electricity installs in 2020,
companies. which was a record high and up from 40% in 2019, according to
Wood Mackenzie. Solar remained first among all the electricity
One of the targeted companies denied the use of forced labor. In generation technologies for the second straight year, beating the
order to rebut the claims, the company hired a global auditor to 38% share for wind and 18% share for natural gas. The share of
study its workforce practices and opened its Xinjiang factory to natural gas electricity additions fell sharply to 18% in 2020 from
tours by global equity analysts and investors. 32% in 2019 and 57% in 2018 as solar and wind took the lion's
share of new installs and shoved aside natural gas.
The markets were relieved that the U.S. order was narrowly
focused and did not involve a blanket prohibition on the import Solar showed very strong growth in 2020 despite the pandemic,
of polysilicon from the Xinjiang region. Factories in the Xinjiang which turned out to have only a minor impact on the overall install
region produced about 45% of the world's solar-grade polysilicon rates. The residential sector was negatively impacted by the
in 2020, according to Bernreuter Research. Polysilicon plants pandemic in Q2-2020 but then came roaring back in the second
consume a large amount of electricity, which makes Xinjiang half of the year and still showed strong yearly growth of +11% to
an attractive location for those plants due to the region's cheap 3.1 GW.
electricity prices.
Solar installs in the non-residential sector (commercial,
M AC S O L A R I N D E X . CO M 3S O L A R S E C T O R U P D AT E AUGUST 12, 2021
SOLAR PV GROWTH OUTLOOK (CONTINUED)
government, nonprofit, and community solar) showed a -4% carbon U.S. electricity sector by 2035. The federal Clean Energy
decline in 2020 to 2 GW, according to Wood Mackenzie. Non- Standard would be similar to the state-level CES standards that
residential installs were undercut by the pandemic, which slowed already exist in thirty states, which are used to pressure utilities to
development timelines and delayed project interconnections. move towards clean electricity and reduce their emissions.
By contrast, U.S. utility solar installs in 2020 soared by +60% to a The markets are waiting until autumn 2021 to see exactly what
new record of just under 14 GW, according to Wood Mackenzie. clean energy legislation Congress will pass. The Senate in
Moreover, Wood Mackenzie expects strong growth to continue early August 2021 passed a $550 billion bipartisan infrastructure
into 2021 due to a massive utility-solar pipeline of 69 GW. The bill that contained funds for clean energy research, power grid
firm expects utility solar to show continued strong growth due to upgrades and support for building a nationwide network of power
"the expansion of state-level renewable energy targets, utilities' charging stations for electric vehicles, some of which may be
self-enforced carbon reduction plans, a renewed focus on clean solar-powered. However, House Speaker Pelosi said that the
energy deployment at the federal level, and large corporate off- Senate's infrastructure bill will not receive a vote in the House
takers looking to meet net-zero carbon emissions goals." until the Senate passes the $3.5 trillion reconciliation bill.
Solar installs in 2020 also showed strength as developers sought The bulk of the Democrats' clean energy legislation is expected to
to take advantage of the 26% solar investment tax credit (ITC) be contained in the $3.5 trillion reconciliation bill, which Congress
in 2020 before it was to step down to 22% in 2021 and 10% in will consider this autumn. The Democrats do not need to gain
2022 for utility PV projects, non-residential, and third-party-owned any support from any Republican Senators for that bill because it
residential solar projects (but to zero for direct-owned residential is being considered under the special budget reconciliation rules
projects). that do not allow a filibuster by the minority party.
However, the solar industry received a pleasant surprise in The Biden administration has already taken executive actions
December 2020 when Congress extended the solar ITC for on the climate front. President Biden, on his first day in office,
another two years as part of the combined passage of the $900 announced that the U.S. would rejoin the international Paris
billion pandemic aid bill and the $1.4 trillion omnibus spending Climate Accord. That confirmed that the U.S. would resume its
bill. The 2-year extension of the ITC caused Wood Mackenzie global leadership position in trying to meet the Paris Climate
to increase its U.S. solar install figure by a total of +17% for its Accord's goal of keeping global warming to less than 2 degrees
2021-25 forecast. Celsius above the pre-industrial level, and preferably below 1.5
degrees Celsius. President Biden also pledged to reach a 100%
The ITC is currently set at 26% for 2021 and 2022. The ITC will carbon-free electricity sector by 2035 and to reach net-zero
then fall to 22% in 2023 and then in 2024 to 10% indefinitely greenhouse gas emissions by 2050.
for large-scale solar projects and to zero for small-scale solar
projects. Mr. Biden named former Senator John Kerry as his Presidential
climate envoy. Mr. Kerry said that meeting the current Paris
The U.S. solar industry received even better news in March 2021 emissions goals is not enough and that tighter restrictions are
when the Biden administration announced that its $2.25 trillion needed. Mr. Kerry said that even if every country delivered on
infrastructure plan includes a proposal for a 10-year extension its current commitments, there would still be a warming of planet
of the ITC and a hike in the ITC rate to 30% from the current Earth of about 3.7 degrees Celsius, which he said would be "just
26%. Also, the ITC proposal would have a "direct pay" provision, catastrophic."
which would allow tax credits to be converted into direct payments
from the federal government, rather than as an offset by investors The Biden administration in April 2021 announced a new target
against tax liabilities, which a shortage of tax equity can hinder. for the U.S. to reduced greenhouse gas emissions by 50-52%
The solar industry is waiting to see whether Congress will pass by 2030 from 2005 levels. That is nearly double the previous
the 10-year solar ITC as proposed by the Biden administration. commitment made by President Obama of a 26-28% cut in
greenhouse gas emissions by 2025 from 2005 levels.
The Biden infrastructure proposal also contains $100 billion for
the electricity sector and energy programs over the next eight The BIden administration made the announcement of the new
years. The program included tax credits for storage and for grid U.S. "Nationally Determined Contribution" ahead of the highly-
modernization that would benefit the solar industry. The program important United National Climate Change Conference (COP26),
also designated $180 billion for climate-related research, pilot which will be held this November in Glasgow.
projects, and other R&D efforts in advanced technologies.
The markets are waiting to see how the Biden administration
The Biden infrastructure plan also contains a Clean Energy will handle the tariffs on the solar industry that were previously
Standard (CES) proposal that would require a 100% zero- imposed by the Trump administration. There is concern that Mr.
M AC S O L A R I N D E X . CO M 4S O L A R S E C T O R U P D AT E AUGUST 12, 2021
SOLAR PV GROWTH OUTLOOK (CONTINUED)
Biden will take a continued aggressive approach to China on solar China supplies less than 5% of the batteries used in large-scale
tariffs. Indeed, the Biden administration in March argued in court U.S. energy storage products, according to BNEF, which means
that the Trump Administration's reimposition of tariffs on bifacial that the U.S. tariff on Chinese batteries did not have much impact
solar panels was legal and should remain in effect. on the U.S. solar-plus-storage market.
The U.S. solar market in recent years has been negatively U.S. solar growth has been very volatile in recent years, mainly
impacted by solar tariffs imposed by the Trump administration. Mr. because of changes by the U.S. government in tax credits and
Trump, in January 2018, announced a Section 201 tariff of 30% on tariffs. In 2016, solar growth spiked higher by +92% to beat the
imported solar cells and modules, which hurt solar install growth scheduled expiration of the investment tax credit (ITC) at the end
because of the higher price of solar panels for U.S. solar projects. of 2016, although Congress in December 2015 then extended the
The markets are waiting to see if the Biden administration might ITC by 5 years.
raise or extend that tariff.
However, U.S. solar installs then fell by -23% in 2017 and by -2%
The initial Section 201 import tariff of 30% for 2018 already in 2018 on a let-down after the 2016 spike and on the solar tariffs
stepped down to 25% as of February 2019, 20% as of February imposed by the Trump Administration in January 2018.
2020, and 15% as of February 2021. The tariff is set to drop to
zero in February 2022, when it expires. The first 2.5 GW of solar In 2019, U.S. solar growth showed a more stable growth rate of
imports are exempt from the tariff. Thin-film solar modules, such +8.0% after the volatility seen in the previous several years. Solar
as those produced by First Solar, are exempt from the tariff even growth in 2020 then soared by +64% on strong demand and the
if those modules are imported from overseas factories. The only desire to beat the scheduled step-down of the ITC at the end of
significant solar-producing countries that are exempt from the 2020.
tariff are Turkey, Brazil, and South Africa. However, imports from
those exempted nations are capped each year at 300 MW each European solar expected to show strong growth
and at 900 MW as a group. in 2021
The former Trump administration in June 2019 surprised the European solar growth remained relatively strong in 2020 despite
solar industry by exempting bifacial (two-sided) solar panels the pandemic. European solar installs in 2020 rose by +8.0% to
from the Section 201 tariff, which resulted in a surge in imports about 16.6 GW from 15.3 GW in 2019, according to BNEF. That
of those panels during summer 2019. The Trump administration added to the extremely strong growth years of +48% in 2018 and
then reversed its decision, but it took time to reimpose the tariff +98% in 2019.
because of procedural requirements.
In 2020, the largest PV install amounts were in Germany with 4.9
On the tariff front, the U.S. solar sector is also dealing with some GW (+22% yr/yr), Netherlands 3.0 GW (+19% yr/yr), Spain 2.8
disruptions in the solar inverter market. Solar inverters are GW (-45% yr/yr), France 875 MW (-9% yr/yr), and Italy 645 GW
electrical devices that convert the direct current (DC) from solar (-13% yr/yr), according to BNEF.
panels into the alternating current (AC) used on the grid.
European solar growth in 2020 continued to see support from
The Trump administration in May 2019 raised the tariff on inverters the spread of subsidy-free solar throughout Europe and the EU's
imported from China to 25% from the 10% level that was first elimination in late 2018 of the minimum-price scheme. Also,
imposed in September 2018 as part of the U.S. move to impose Europe is mandating increasing amounts of solar power to meet
tariffs on $200 billion of Chinese products. its aggressive targets for cutting emissions.
However, the inverter tariff is not having much direct impact on Much of Europe's solar install growth in 2020 was driven by
the U.S. solar sector because inverters can easily be sourced auctions for utility-scale solar in Germany, France, and Poland.
outside of China. Yet, the inverter tariff makes it difficult for the Solar growth in Spain is being driven by subsidy-free power
big Chinese inverter companies such as Huawei Technologies purchase agreements with both utilities and corporations.
and Sungrow Power Supply to build their market share in the U.S.
European solar installs are expected to show strong growth in the
On another tariff issue, the Trump administration, on September coming years, with BNEF forecasting a +23% rise to 20.4 GW in
1, 2019, imposed a 15% tariff on about $110 billion of Chinese 2021 and +12% to 22.7 GW in 2022.
goods that included Chinese lithium-ion batteries. Before the
tariff, the U.S. imported about 40% of its lithium-ion batteries from A very large pipeline of subsidy-free solar projects in Europe will
China, although most of those batteries were for end-markets contribute to installs in 2021 and 2022. BNEF reports that there is
other than grid storage. a huge 37.2 GW pipeline of unsubsidized solar projects in Europe
that are scheduled to be built, with 6.6 GW of that due in 2021.
M AC S O L A R I N D E X . CO M 5S O L A R S E C T O R U P D AT E AUGUST 12, 2021
SOLAR PV GROWTH OUTLOOK (CONTINUED)
BNEF reports that there are particularly large pipelines in Spain in 2020 were hurt mainly by the Covid pandemic, which caused
and Portugal. planning and construction delays and supply-chain disruptions.
Also, solar developers pulled back due to the poor financial
European solar growth should receive a solid boost in coming condition of electric utilities and their delayed payments to
years after the EU in July 2020 approved a big pandemic stimulus developers.
plan of 750 billion euros since almost one-third of those funds
are targeted for fighting climate change. That added to the EU's However, India's solar installs are expected to show a major
7-year budget that has 1 trillion euros of funding to help EU recovery in 2021 and 2022 as delayed projects come online and
countries meet their EU's Paris Agreement goals for reducing as the government continues to push hard for more solar. India's
carbon emissions. solar installs in 2021 will grow by +137% to 10.0 GW, and will then
grow by another 27% in 2022 to 12.7 GW, according to forecasts
European solar growth improved significantly after the EU in by BNEF.
September 2018 ended its anti-dumping duties against solar
modules imported from China and ended the associated minimum India's solar sector has seen serious disruptions over the past
import price (MIP) scheme. The EU's MIP scheme had been in several years from the government's use of tariffs to encourage
place since 2013 when the EU tried unsuccessfully to protect local the development of domestic solar panel manufacturing capacity.
European solar manufacturers from Chinese competition. The The government tariff has made it difficult for solar installers to
MIP scheme succeeded only in raising the cost of solar modules obtain reasonably-priced solar panels to meet their installation
for European solar installers and caused several years of very plans. However, the tariff has been sidestepped to some extent
slow solar growth in Europe. by sourcing panels from non-tariffed countries and by having solar
plant owners pay the tariff for imported panels to get their plants
The end of the MIP scheme, combined with the sharp drop in finished on schedule.
solar module prices that resulted from the China-531 order in
2018, allowed solar to reach grid-parity in a growing portion of The Indian government first implemented the 25% safeguard tariff
Europe. Many solar projects in Europe are now being installed on on July 30, 2018, covering modules imported from developed
an unsubsidized basis. countries, China, or Malaysia. The 2-year tariff started at 25% for
the first year (30-Jul-2018 to 29-Jul-2019) but then stepped down
European solar growth is expected to show solid growth in the to 20% for the next 6-month period (30-Jul-2019 to 29-Jan-2020)
coming years due to the need to meet renewable energy targets. and to 15% for the next 6-month period (30-Jan-2020 to 29-Jul-
The European Parliament in 2018 raised the EU renewable 2020).
energy target for 2030 to 32% from 27% and also made the
target binding on EU members. The European Commission in The safeguard tariff was imposed to prevent the "threat of
July 2021 proposed raising that renewable energy target to 40%, serious injury" to domestic solar module producers from import
with that proposal going to the European Parliament and its competition. Prior to the tariff, India imported 90% of its modules
members for approval. The EU is relying on its renewables target from China and Malaysia.
to meet its pledge under the UN Paris climate agreement to cut
its greenhouse gas emissions by at least 55% by 2030 from 1990 The government then extended the tariff for another year at
levels, and to become carbon neutral by 2050. 14.9% for the 6-month period of July 30, 2020 to January 29,
2021, stepping down slightly to 14.5% for the next 6-month period
India's solar expected to recover after weak 2020 of January 30, 2021 to July 29, 2021. In addition to developed
countries and China, the 2020-21 tariff also applied to Thailand
India's government is pushing solar very hard as a means and Vietnam. India dropped Malaysia as a country covered by
to modernize India's infrastructure, boost its global business the tariff.
competitiveness, expand electricity access in rural areas, and
meet its climate goals. The government's current plan is to have no import tariffs from
July 2021 through March 2022. However, the government then
The Indian government has set a goal of installing a cumulative plans to impose a large 40% basic customs duty on solar modules,
100 GW of solar by 2022, consisting of 60 GW of large-scale solar and a 25% duty on solar cells, starting in April 2022. That duty
and 40 GW of rooftop solar. However, India is unlikely to meet will be a further attempt to promote the development of solar
that goal due in part to the pandemic disruptions in 2020. The 100 panel and cell manufacturing capacity within India. However,
GW target is more than twice India's cumulative installed solar India's solar manufacturing base remains far smaller than solar
capacity of 48 GW as of the end of 2020. demand, meaning the duty is likely to hurt solar installers' ability
to find enough reasonably-priced solar panels to meet the strong
India's solar installs in 2020 slowed sharply by -64% to 4.2 GW demand.
from 11.6 GW in 2019, according to BNEF. India's solar installs
M AC S O L A R I N D E X . CO M 6S O L A R S E C T O R U P D AT E AUGUST 12, 2021
SOLAR PV GROWTH OUTLOOK (CONTINUED)
Japan's solar sees strong growth in 2020 electricity laws to allow clean energy developers to sell electricity
directly to corporations with power purchase agreements. The
Solar installs in Japan in 2020 rose sharply by +20% to 8.1 GW South Korean government in February also raised its mandate to
from 6.7 GW in 2019, according to BNEF. Solar growth was 25% from 10% for the amount of annual renewable energy that
strong as developers sought to meet project completion deadlines electric utilities must source by 2030.
in 2020 and 2021 to qualify for the solar feed-in-tariff (FIT), which
is progressively stepping down.
Solar installs in Japan are expected to be negatively impacted
by the phase-out of the government's generous FIT program
for large-scale solar projects in 2022. BNEF is forecasting that
Japan's solar installs will fall by -31% to 5.6 GW in 2021 and by
-34% to 3.7 GW in 2022.
However, the Japanese government's support for solar will
continue in the coming years. The government's FIT program
will continue to support smaller-scale solar projects while the
government is developing a new feed-in-premium (FIP) support
program for large-scale projects starting in 2022.
The Japanese government in July 2021 almost doubled its solar
target to a cumulative capacity of 108 GW by 2030. In order
to meet that target, Japan would need to install 37 GW of solar
by 2030, or an average of 3.7 GW per year. The government
raised its solar target to help meet Japan's carbon target of cutting
greenhouse gas emissions by 46% by 2030 from 2013 levels.
Solar in Japan should also see support in coming years from
Japanese corporations looking to acquire solar power purchase
agreements to meet their corporate renewable energy goals.
Corporate demand is expected to drive the development of
subsidy-free solar in Japan in the coming years.
Elsewhere in Asia, Taiwan is expected to see strong solar installs
in the coming years as the government promotes solar to meet its
climate goals. Solar installs in Taiwan grew sharply by +41% to
1.4 GW in 2019 but then fell by -22% to 1.1 GW in 2020, according
to BNEF.
Solar is seeing strong demand in Taiwan from corporations
looking to meet their renewable energy goals. Also, there is rising
demand for solar power in Taiwan to replace the coming closure
of coal and nuclear plants. Taiwan's government is targeting a
25% renewable energy supply by 2025 and has announced an
aggressive solar cumulative-capacity target of 20 GW by 2025,
which would be four times the current cumulative capacity of
about 5 GW.
South Korea is another bright spot for solar in Asia. Solar installs
in South Korea grew sharply by +70% in 2018 and +62% in 2019,
before tailing off to +5% growth in 2020 to 3.8 GW, according to
BNEF.
Corporate demand for solar power is expected to grow sharply
after South Korea's government in January 2021 revised its
M AC S O L A R I N D E X . CO M 7S O L A R S E C T O R U P D AT E AUGUST 12, 2021
SOLAR PV ANNUAL NEW INSTALLATIONS
New global solar PV installations in 2020 grew by +21% yr/yr than the 7 such countries seen as recently as 2016-17. The
to a record 143 gigawatts (GW), according to Bloomberg New global spread of solar illustrates how the industry is becoming
Energy Finance (BNEF). PV growth improved in 2020 from the more diversified and less dependent on growth rates in a few
weaker growth rates of +9% in 2018 and 2019 that were caused countries. Fitch forecasts that 36 nations will install more than 1
by temporary weakness in Chinese installs in 2018-19. Global GW of solar by 2029.
solar PV installations have grown by a compounded annual rate
of +21% over the last 5 years and have risen 8-fold from 2010. Solar growth in Europe in 2020 grew by +8% yr/yr. The largest
PV install amounts were in Germany with 4.9 GW (+22% yr/yr),
In 2020, China led the world for annual new solar PV installs for Netherlands 3.0 GW (+19%), Spain 2.8 GW (-45%), France 875
the seventh straight year with 52 GW of installs, up 57% from 2019 MW (-9%), and Italy 645 GW (-13%), according to BNEF.
and just below the record of 53 GW posted in 2017, according to
BNEF. The U.S. had a big year in 2020 with +64% growth to U.S. solar PV installations in the five years through 2020 grew at
18.9 GW, moving into second place for the most annual installs. a compounded annual rate of +21% and rose 25-fold from 2010,
Japan moved up to third place from fourth place with 8.1 GW of according to BNEF. The states with the largest amount of new PV
installs, up +20% yr/yr. Germany was in fourth place with 4.9 solar installations in 2020 were California with 3.9 GW (+26% yr/
GW of installs (+22% yr/yr). India in 2020 fell to fifth place from yr), Texas 3.4 GW (+143%), Florida 2.8 GW (+107%), Virginia 1.4
second place, with 4.2 GW of installs (-63% yr/yr). GW (+965%), North Carolina 785 MW (-19%), South Carolina 617
MW (+20%), New York 544 MW (+15%), Arizona 503 MW (-45%),
There were 12 countries in 2020 with installs above 1 GW, more and Utah 427 GW (+250%), according to Wood Mackenzie.
Global Solar PV Annual New Installations Top 20 Ranked Country Solar PV Annual Installs (2020)
160 China 52.1
143.2 USA 18.9
5-year CAGR Growth Rate: +21% Japan 8.1
140 Germany 4.9
Annual Growth Rates: India 4.2
118.0 Country Market Shares
2015: +24% 120 South Korea 3.8
108.0 Australia 3.5 2019 2020
2016: +34% 99.0 Netherlands 3.0 China 28% 36%
2017: +32% 100 Spain 2.8 USA 9% 13%
Gigawatts
2018: +9% Poland 2.6 Japan 6% 6%
2019: +9% 75.0 80 Israel 1.7 Germany 3.4% 3.4%
2020: +21% Taiwan 1.1 India 10% 3.0%
56.0
Turkey 0.9 S.Korea 2.7% 2.7%
60 France 0.9 Australia 3.0% 2.5%
45.0 South Africa 0.9
Source: Bloomberg 41.0 Netherlands 1.9% 2.1%
40 Belgium 0.8 Spain 4.3% 2.0%
New Energy Finance 28.8 30.6 Italy 0.6
Poland 1.9% 1.8%
18.3 Ukraine 0.6
20 Source: Bloomberg New Israel 0.5% 1.2%
Greece 0.4
6.5 8.3 UK 0.3 Energy Finance Taiwan 1.2% 0.8%
1.5 1.5 2.8
0 0 5 10 15 20 25 30 35 40 45 50 55
05 06 07 08 09 10 11 12 13 14 15 16 17 18 19 20 Gigawatts
U.S. Solar PV Annual New Installations Solar PV Annual New Installations - China, India, U.S., Japan
18.9 20 60
Japan
5-year CAGR Growth Rate: +21% 18
U.S. 50
16
Annual Growth Rates: India
14.1
2015: +9% 14 China
2016: +92% 40
11.5 12
2017: -23% 10.9
Gigawatts
Gigawatts
2018: -9% 10.0
2019: +15% 10 30
2020: +64% 7.4 8
6.7
5.7 Source: Bloomberg New 20
6 Energy Finance
Source: Bloomberg 3.5
New Energy Finance 4
10
1.5 2
0.7
0.1 0.1 0.2 0.3 0.4
0 0
05 06 07 08 09 10 11 12 13 14 15 16 17 18 19 20 10 11 12 13 14 15 16 17 18 19 20
M AC S O L A R I N D E X . CO M 8S O L A R S E C T O R U P D AT E AUGUST 12, 2021
SOLAR PV CUMULATIVE INSTALLATIONS
The amount of cumulative PV electricity generation capacity 92 GW, representing 12% of world capacity. Over the past five
across the world in 2020 grew sharply by +22% yr/yr to 787 GW, years, U.S. cumulative solar electricity capacity rose by more than
according to Bloomberg New Energy Finance (BNEF). In the 3-fold to 92 GW from 26 GW in 2015 and showed a compounded
last five years, global cumulative solar PV electricity generation annual growth rate of +28%.
capacity increased by more than 3-fold from 244 GW in 2015 to
787 GW in 2020, representing a compounded annual growth rate Japan remained in third place for the seventh straight year.
of +26%. Japan’s cumulative solar capacity in 2020 rose by +13% to 71
GW, representing 9% of world capacity. Japan's cumulative solar
China in 2020 continued to be the world's leader for cumulative capacity in the past five years has risen by 2.1-fold to 71 GW
solar capacity at 265 GW, according to BNEF. China at the end from 34 GW in 2015, representing a 5-year compounded annual
of 2019 accounted for 34% of the world's solar PV capacity. In growth rate of +16%.
the past five years, China's cumulative installed solar capacity
soared by 5-fold from 52 GW in 2015 to the 2020 level of 265 GW, Germany in 2020 remained in fourth place with 55 GW of
representing a 5-year compounded annual growth rate of +38%. cumulative solar PV capacity, up +10% yr/yr. Germany’s
cumulative solar capacity in the past five years has risen 1.4-fold
The U.S. in 2020 remained in second place for cumulative solar to 54 GW from 39 GW in 2015. Germany, at the end of 2020,
installs. U.S. solar electricity capacity in 2020 rose by +26% to accounted for 7% of the world's total solar PV capacity.
Global Solar PV Cumulative Installations Top 20 Country Solar PV Cumulative Capacity (thru 2020)
900 China 265.0
United States 91.8
787 Japan 70.9
800
Germany 54.8
India 47.8
644 700 Italy 21.5
Australia 18.2
600 South Korea 15.6
526 UK 13.7
Gigawatts
500 Spain 13.0 Percent of World Total
418 France 10.9 34% China
Netherlands 10.0 12% USA
400
319 Brazil 9.6 9% Japan
Turkey 6.9 7% Germany
244 300 Ukraine
Source: Bloomberg 5.9 6% India
New Energy Finance 188 Belgium 5.3
143 200 Taiwan 5.1
102 Poland 3.9
71 100 South Africa 3.9
43 Source: Bloomberg New Energy Finance
5 7 9 16 24 Thailand 3.7
0
0 20 40 60 80 100 120 140 160 180 200 220 240 260 280
05 06 07 08 09 10 11 12 13 14 15 16 17 18 19 20
Gigawatts
U.S. Solar PV Cumulative Installations Solar Cumulative Installation - China, U.S., Japan, India
100 280
91.8
260
90
India 240
80 220
73.0 Japan
70 200
U.S.
61.5 180
60 China
Gigawatts
Gigawatts
51.5 160
50 140
40.6 120
40
100
26.4 30 80
Source: Bloomberg
New Energy Finance 19.1 Source: Bloomberg 60
20 New Energy Finance
12.4
40
6.7 10
3.2 20
0.2 0.3 0.5 0.8 1.2 1.7
0 0
05 06 07 08 09 10 11 12 13 14 15 16 17 18 19 20 10 11 12 13 14 15 16 17 18 19 20
M AC S O L A R I N D E X . CO M 9S O L A R S E C T O R U P D AT E AUGUST 12, 2021
LEVELIZED COST OF SOLAR ELECTRICITY
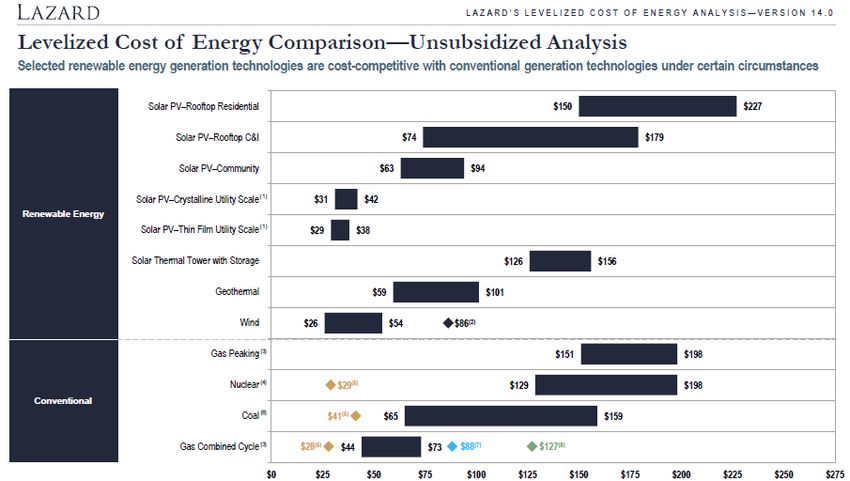
Solar's electricity cost falls -9% and beats fossil cheaper than the $174.5/MWh mid-point cost for gas-peaking
fuels and nuclear by even larger amounts plants, and 38% cheaper than the mid-point cost of $58.5/MWh
for natural gas plants.
The levelized cost of electricity (LCOE) for newly-built U.S. utility-
The Lazard data shows that, on average, it is no longer economical
scale crystalline solar PV plants in late-2020 fell by -9% yr/yr to
a midpoint of $36.5 per MWh ($31-42 range) on an unsubsidized for a utility to build any new coal, nuclear, or natural gas plants.
basis, according to Lazard in the latest annual edition of its
comprehensive "Levelized Cost of Energy Analysis-Version 14.0" Moreover, solar has become so inexpensive that it is now cheaper
to build a brand new PV utility-scale solar plant from scratch for
released in November 2020. That added to the declines of -7% in
2019 and -13% in 2018. $36.5/MWh than it is to keep an existing coal plant running at a
marginal cost of $41/MWh. However, installing a new solar plant
does not yet beat the marginal cost of keeping an existing nuclear
The LCOE for utility-scale PV has now plunged by an overall
-85% from $248/MWh in 2010, and has fallen by an average of plant running of $29/MWh or a natural gas plant of $28/MWh.
-11% per year over the past five years.
Solar has big potential as a replacement technology since many
coal and nuclear plants are reaching the end of their useful lives,
The cost of community solar and residential PV systems also fell.
Lazard reports that the unsubsidized mid-point LCOEs in 2020 fell with an average age of 40 years for U.S. coal plants and 38 years
by -26% yr/yr for Community Solar to $78.5/MWh ($63-94 range) for U.S. nuclear plants. As coal and nuclear plants are retired,
and -4% yr/yr for Rooftop Residential to $188.5/MWh ($150-227). utilities will decide to switch to building new solar, wind, and gas
The mid-point LCOE for Rooftop Commercial and Industrial rose plants based on economics, with gas having some preference for
by +10% to $126.5/MWh ($74-179 range), but that was caused by baseload until storage starts to play a bigger role in supporting
solar as a 24/7 baseload electricity resource.
a rise in the upper range to $179 from $154 in 2019. The lower
range for Rooftop C&I fell slightly to $74/MWh from $75 in 2019.
Solar has become cheaper than new fossil fuel plants, not just in
The Lazard report found that the mid-point cost for utility-scale the U.S., but also globally. BNEF reports that it is already cheaper
crystalline solar PV of $36.5/MWh is now 67% cheaper than the for two-thirds of the world's population to get new power from
$109/MWh mid-point cost for newly-built coal plants, 78% cheaper solar or wind than from new fossil fuel plants.1
than the $163.5/MWh mid-point cost for nuclear plants, 79%
1 BNEF, "The First Phase of the Transition is about Electricity, 1/28/2020.
Source: Lazard's Levelized Cost of Energy Analysis - November 2020, Version 14.0.
M AC S O L A R I N D E X . CO M 10S O L A R S E C T O R U P D AT E AUGUST 12, 2021
PRICING - SOLAR MODULES, CELLS, AND POLYSILICON
Solar module prices have been moving mostly sideways since Polysilicon prices fell to a record low during the worst of the
mid-2020. The price of silicon solar modules fell to a new record pandemic shutdowns in spring 2020, but then rebounded higher
low of 16.3 cents per watt in July 2020 but has since recovered after several polysilicon manufacturers were forced to temporarily
to the current level of 19.6 cents, according to PV Insights. Since close down their plants due to disruptions such as fires and
2010, silicon module prices have plunged by a total of -88%. flooding. The rise in polysilicon prices has recently put some
upward pressure on solar module prices.
The price of thin-film modules fell to a record low of 20.7 cents per
watt in July 2020 but has since recovered to 22.5 cents, according Solar module pricing since the beginning of 2019 has stabilized
to PV Insights. Since 2010, thin-film module prices have plunged following previous sharp declines. In 2018, solar pricing fell
by a total of -83%. sharply due to the oversupply situation caused by the Chinese
government's sharp cutback of subsidies with its May 31, 2018
Solar module prices have moved mildly lower in recent years order (China-531). Separately, solar prices fell sharply in the
due to the natural decline in solar pricing that results from second half of 2016 because of a module oversupply situation
lower production costs caused by technology advances and that followed solar install spikes in China and the U.S. caused
manufacturing economies of scale. by developers trying to beat respective national subsidy-reduction
deadlines. Solar pricing has become more stable in the past
Spot polysilicon prices fell to a record low of $6.90 per kg in May few years as solar subsidies are phased out, reducing the risk of
2020 but have since spiked higher to $26.95, according to PV previous subsidy-related boom-bust cycles.
Insights. Polysilicon prices have plunged by -62% since 2010.
Solar PV Silicon Module ($/watt) (weekly data) Polysilicon Spot Price ($/kg) (monthly data)
1.6 $100
$90
1.4
$80
1.2
$70
1
$60
0.8 $50
Average Silicon Module Price
(19.6 cents/watt) $40
0.6 Aug-2021: $26.95 per kg
$30
0.4
$20
0.2
Source: PV Insights $10
Source: PV Insights Record low: $6.91 in June-2020
0 $0
2011 2012 2013 2014 2015 2016 2017 2018 2019 2020 2021 09 10 11 12 13 14 15 16 17 18 19 20 21
Solar PV Thin-Film Module ($/watt) (weekly data) Polysilicon Spot Price ($/kg) (annual data)
1.4 $350
1.2 $300
1 $250
0.8 $200
Thin-film Module Price
0.6 $150
(22.5 cents/watt)
Source: PV Insights
0.4 $100
0.2 $50
Source: PV Insights
0 $0
2011 2012 2013 2014 2015 2016 2017 2018 2019 2020 2021 00 01 02 03 04 05 06 07 08 09 10 11 12 13 14 15 16 17 18 19 20 21
M AC S O L A R I N D E X . CO M 11S O L A R S E C T O R U P D AT E AUGUST 12, 2021
SOLAR JOBS
U.S. solar jobs in 2020 fell by -6.7% to 231,474 from 248,034
U.S. solar jobs already surpass jobs in oil/gas and coal
in 2019, according to the "National Solar Jobs Census 2020"
300,000
published by The Solar Foundation in May 2021. Solar jobs fell in U.S. Solar Jobs
2020 due to pandemic disruptions and were well below the record
250,000
high of 260,077 jobs seen in 2016.
200,000
Despite the drop in 2020, the U.S. solar industry during the 10- U.S. Oil & Gas
year period of 2010-2020 added a net total of 137,972 jobs to the Extraction Jobs
150,000
U.S. economy, rising by a total of +148% over that period.
Solar employment in the ten years through 2020 grew five times 100,000
faster than the +1.8% annual growth rate of the U.S. economy, U.S. Coal Mining Jobs
according to the Solar Foundation. That illustrates how the solar Sources: Solar jobs data from "National Solar Jobs Census 50,000
industry has made a substantial contribution to the U.S. labor 2020" from www.thesolarfoundataion.org;
U.S. Oil/Gas and Coal jobs data from U.S. Bureau of Labor Statistics
market and economy. 0
05 06 07 08 09 10 11 12 13 14 15 16 17 18 19 20 21
About two-thirds of U.S. solar jobs are in the demand-side sectors
such as installation, sales/distribution, and project development.
Meanwhile, manufacturing accounts for only about 14% of total
solar jobs, according to the Solar Foundation.
Solar jobs in the U.S. substantially exceed those in the fossil fuel
industries. Specifically, the 231,474 jobs in the solar sector far
exceed the 139,500 direct jobs in the oil/gas extraction industry
and 42,200 direct jobs in the coal mining industry at the end of
2020, according to figures from the U.S. Bureau of Labor Statistics
(see chart on the right).
Globally, solar PV is a huge employer, with 3.75 million solar jobs
worldwide at the end of 2019, up by +2% from 3.68 million in 2018,
according to the " Renewable Energy and Jobs--Annual Review
2020" from the International Renewable Energy Agency (IRENA).
China is far ahead of the U.S. in solar PV jobs, with a total of
about 2.2 million jobs due to its much larger installation and
manufacturing solar sector, according to the IRENA report.
Countries other than China and the U.S. with large solar PV
employment include Japan with 241,000 jobs, India with 204,000
jobs, and the EU with 127,300 jobs, according to IRENA.
M AC S O L A R I N D E X . CO M 12You can also read