GROWTH TRENDS 2019 REVIEW - Clarington
←
→
Page content transcription
If your browser does not render page correctly, please read the page content below
GROWTH TRENDS 2019 REVIEW
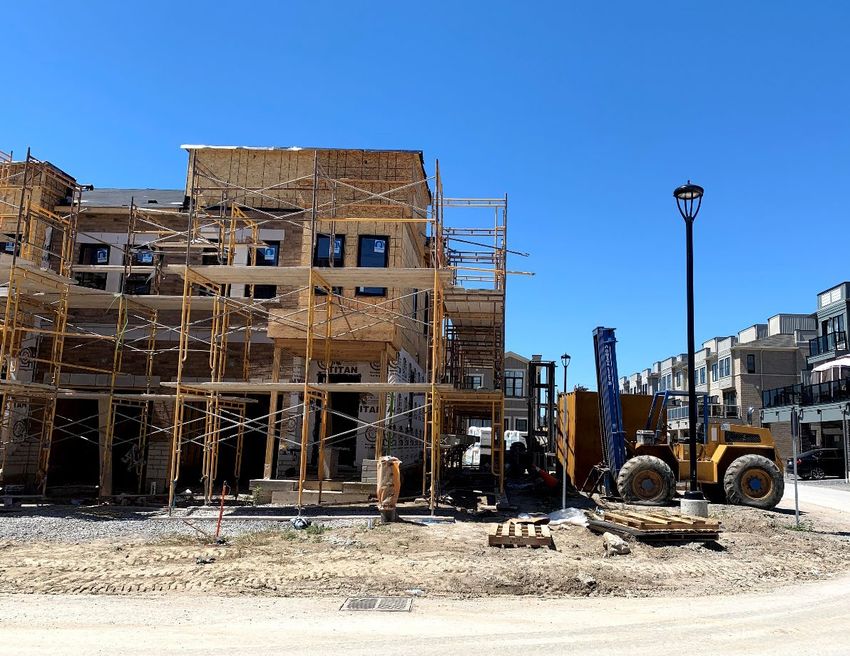
Table of Contents
1.0    Introduction .....................................................................................................................................................................................1
          Purpose of the Growth Trends Review ..........................................................................................................................................1
          Information Sources .......................................................................................................................................................................1
          Publishing of Growth Trends Review .............................................................................................................................................1
          Contact Information........................................................................................................................................................................1

2.0    Overall Growth Trends ...................................................................................................................................................................2
          Total Building Permit Value in Clarington.......................................................................................................................................2
          Total Building Permit Value in Durham Region ..............................................................................................................................3
          Share of Total Building Permit Value in Durham Region ...............................................................................................................4
          Policy Updates ...............................................................................................................................................................................5

3.0    Residential Growth .........................................................................................................................................................................6
         Total Residential Building Permit Value in Clarington ....................................................................................................................6
         Building Challenges .......................................................................................................................................................................6
          Residential Unit Production in Clarington......................................................................................................................................7
         Built Boundary .............................................................................................................................................................................10
         Share of Residential Building Permit Value in Durham Region....................................................................................................13
         Share of New Residential Unit Permits in Durham Region .........................................................................................................14
         Housing Market Indicators ...........................................................................................................................................................15
      3.7.1     Clarington Housing Trends ................................................................................................................................................15
      3.7.2     Regional Housing Trends...................................................................................................................................................16
      3.7.3     GTA Housing Trends .........................................................................................................................................................16
      3.7.4     National and Provincial Housing Trends ............................................................................................................................17
      3.7.5     Economic Conditions .........................................................................................................................................................17
         Short-Term Population Forecast ..................................................................................................................................................18
         Planning for Intensification ...........................................................................................................................................................19

                                                                                                                                                                                                         i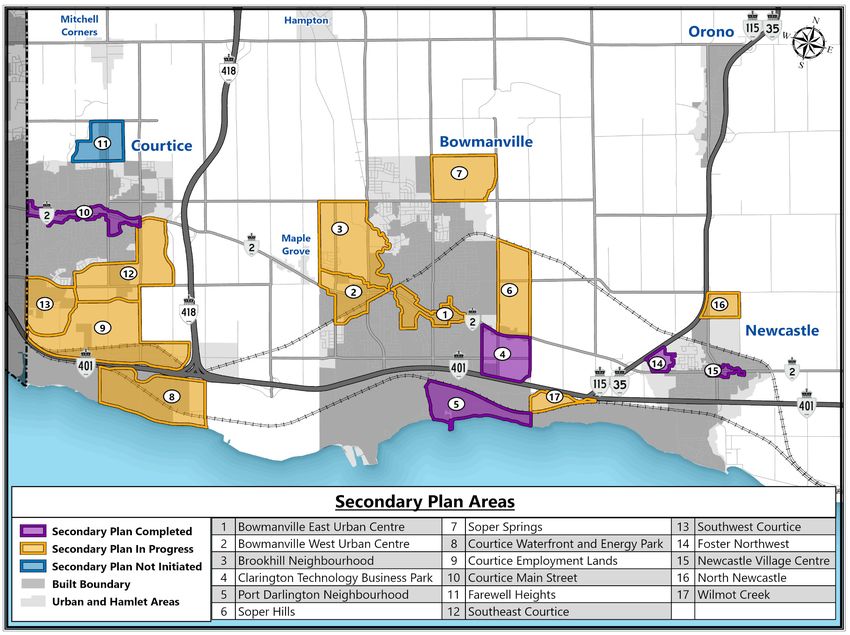
4.0   Non-Residential Growth ...............................................................................................................................................................22
        Total Non-Residential Building Permit Value in Clarington ..........................................................................................................22
        Share of Non-Residential Building Permit Value in Durham Region ............................................................................................24
        Non-Residential Floor Space Production in Durham....................................................................................................................25

5.0   Key Projects and Initiatives..........................................................................................................................................................26
        Climate Change ...........................................................................................................................................................................26
        Secondary Plans ..........................................................................................................................................................................28
        Affordable Housing ......................................................................................................................................................................30
        Neighbourhood Character Study .................................................................................................................................................31
        Zone Clarington ...........................................................................................................................................................................31

6.0   Synopsis and Short-Term Outlook ..............................................................................................................................................32
        Residential Building Permit Activity ..............................................................................................................................................32
        Non-Residential Building Permit Activity ......................................................................................................................................32
        Short Term Forecast ....................................................................................................................................................................33

                                                                                                                                                                                                   ii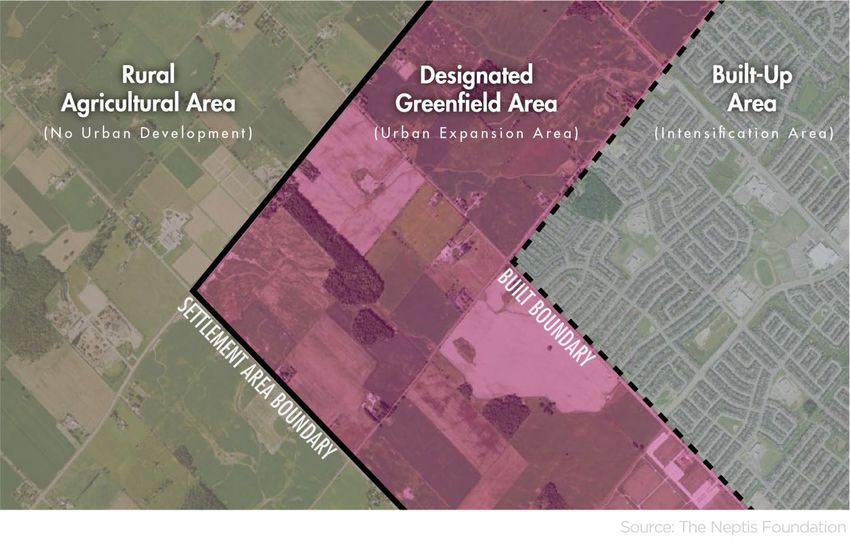
List of Figures
Figure 1: Total Building Permit Value in Clarington, 2009-2019................................................................................................................. 2
Figure 2: Proportion of the Total Building Permit Value by Residential/Non-Residential Sectors in Clarington, 2009-2019 ...................... 3
Figure 3: Total Building Permit Value in Durham Region, 2009-2019 ........................................................................................................ 3
Figure 4: Clarington’s Share of Total Building Permit Value in Durham Region, 2009-2019 ..................................................................... 4
Figure 5: Total Residential Building Permit Value in Clarington, 2009-2019 .............................................................................................. 6
Figure 6: New Building Permits Issued for Residential Units in Clarington, 2009-2019 ............................................................................. 7
Figure 7: Residential Unit Permits in Clarington by Type, 2009-2019 ........................................................................................................ 9
Figure 8: Map of Distribution of Building Permits in Clarington, Inside and Outside the Built Boundary, 2019 ........................................ 11
Figure 9: Percentage of New Residential Units Issued Inside and Outside the Built Boundary of Clarington, 2015-2019 ....................... 12
Figure 10: Share of Total Residential Building Permit Value in Durham Region, 2019 ............................................................................ 13
Figure 11: Average House Price in Clarington by Type, 2015-2019 ........................................................................................................ 15
Figure 12: Average Value of Single Detached Dwellings Versus Number of New Residential Units in Clarington, 2009-2019 ............... 15
Figure 13: Average Cost of a New Single Detached Dwelling in Durham Region, 2009-2019 ................................................................ 16
Figure 14: Map of the Greater Golden Horseshoe showing inner & outer ring municipalities; built-up areas; Greenbelt; Durham Region
and Clarington.......................................................................................................................................................................................... 20
Figure 15: Intensification Targets and Boundaries from A Place to Grow (2019)..................................................................................... 21
Figure 16: Total Non- Residential Building Permit Value by Sector, 2015-2019 ...................................................................................... 22
Figure 17: Percentage Breakdown of Non- Residential Sector Building Permit Value, 2009-2019 .......................................................... 22
Figure 18: Share of Total Non-Residential Building Permit Value in Durham Region, 2019 .................................................................... 24
Figure 19: Production of Non-Residential Floor Space in Durham Region, by Municipality, 2015-2019 .................................................. 25
Figure 20 Secondary Plans in Clarington, 2019 ....................................................................................................................................... 29

                                                                                                                                                                                                        iii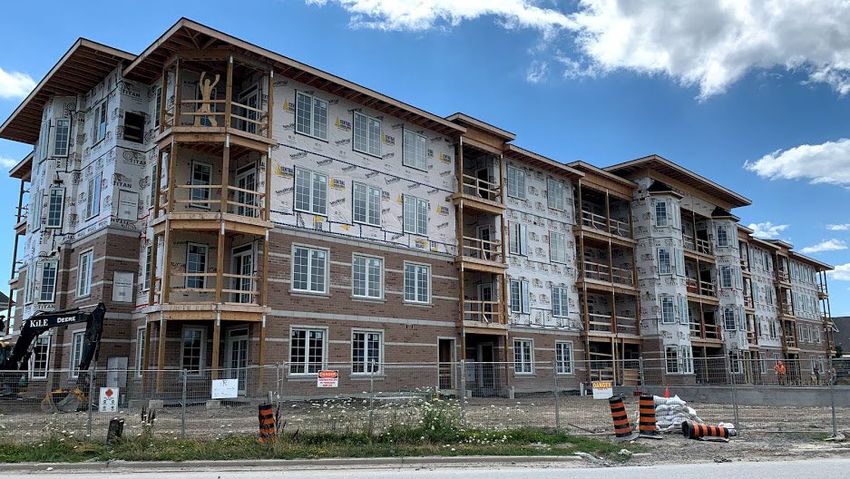
List of Tables
Table 1: Five Year Average of Residential and Non-Residential Building Permit Values .......................................................................... 3
Table 2: Residential Unit Permits Issued by Area in Clarington, 2015-2019 .............................................................................................. 8
Table 3: Residential Unit Permits Issued in Clarington by Type, 2009-2019 ............................................................................................. 9
Table 4: Number of New Residential Units Issued Within and Outside the Built Boundary of Clarington by Area, 2019 ......................... 10
Table 5: Total Building Permit Values in Durham Region by Municipality, 2015-2019 (in millions) .......................................................... 13
Table 6: New Residential Unit Permits in Durham by Municipality, 2015-2019 ........................................................................................ 14
Table 7: Average House Prices in Clarington by Location, 2019 ............................................................................................................. 15
Table 8: Population Growth for Clarington and Durham Region .............................................................................................................. 18
Table 9: Household Growth for Clarington and Durham Region .............................................................................................................. 18
Table 10: Non-Residential Building Permits Issued in 2019 Over $1 Million ............................................................................................ 23

                                                                                                                                                                            iv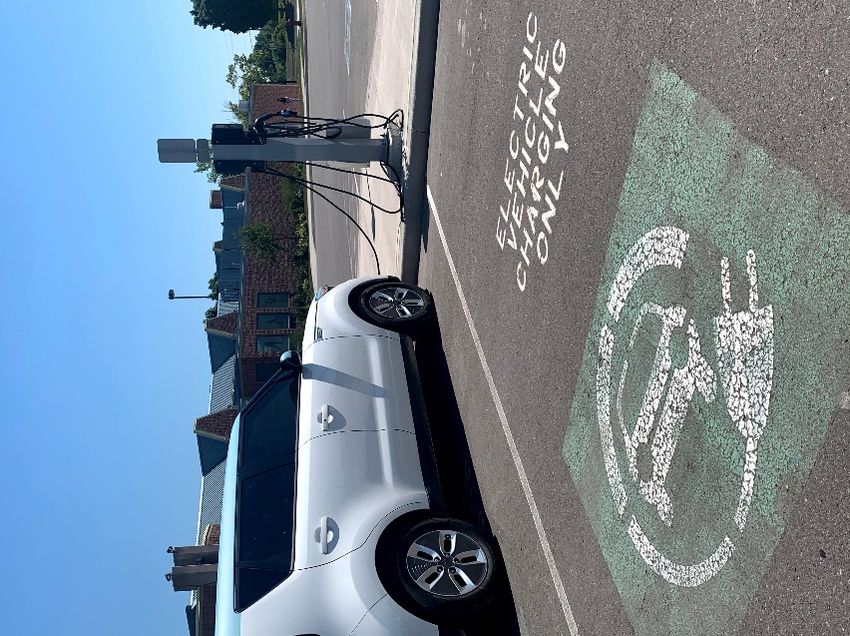
1.0 Introduction
       Purpose of the Growth Trends Review                            Unless otherwise noted, data in this report regarding the
                                                                      Region of Durham or Clarington within the Region is from 2019
The Planning Services Department conducts on-going
                                                                      Annual Building Activity Review.
monitoring activities to assess the effectiveness of the
Municipality of Clarington Official Plan policies, as well as other   The information sources in this report were released prior to the
Municipal and Durham Region policies. The Growth Trends               global COVID-19 pandemic. As a result, all projections
Review reports on these monitoring activities to identify             discussed may be impacted due to the unprecedented
emerging development-related issues and trends within the             economic environment caused by the COVID-19 pandemic.
Municipality of Clarington. Building permit activity and other
related data are used as indicators of housing and employment                Publishing of Growth Trends Review
activity within Clarington, the level of local investment and         The Planning Services Department
economic performance.                                                 has published the Growth Trends
                                                                      Review on an annual basis since
       Information Sources                                            2005. Copies of the document are
The data collected and analyzed in this report is based on            available from the Planning
building permit and housing market information gathered from a        Services Department directly or can
variety of sources that include:                                      be accessed online by visiting
                                                                      www.clarington.net.
   •   Municipality of Clarington;
   •   Region of Durham;                                              If this information is required in an alternate format, please
                                                                      contact the Accessibility Coordinator at 905-623-3379 ext.
   •   Ministry of Municipal Affairs and Housing;
                                                                      2131.
   •   Statistics Canada;
   •   The Bank of Canada;
                                                                             Contact Information
   •   Canada Mortgage and Housing Corporation and;
   •   Toronto Real Estate Board.                                     Should you have any questions, comments, and/or suggestions
Unless otherwise noted, data in this report regarding the             concerning the Growth Trends Review, please contact the
Municipality of Clarington is from Building Activity Update           Planning Services Department by telephone at
January 1 to December 31, 2019.                                       905-623-3379 or by email at planning@clarington.net.

                                                                                                                                       1
Other compounding factors affecting the building permit decline
2.0 Overall Growth Trends                                                                                                   in 2019 include new requirements in the Building Code, causing
                                                                                                                            many builders pulled permits at the end of 2018. Additionally,
                                         Total Building Permit Value in Clarington                                          new tests for mortgages such as the percentage of down
                                                                                                                            payment and the increase in mortgage rates resulted in some
Clarington’s total building permit value decreased by 69.3 per                                                              housing being beyond the means of new buyers.
cent from $422.6 million in 2018 to $129.7 million in 2019
(Figure 1). Residential building permit values declined by 73.9                                                             Overall, building permit values reflect fluctuations in both the
per cent in 2019, from $343.4 million to $89.7 million. The value                                                           economy and one-time projects. Major building projects in the
of non-residential building permits in 2019 decreased by 49.5                                                               non-residential sector cause significant fluctuation in building
per cent from $79.1 million to $39.9 million.                                                                               permit values year- to-year. Section 4.1 highlights major non-
                                                                                                                            residential building projects reported in 2019 – these are
While these declines are significant, Clarington’s numbers are                                                              examples of projects that cause yearly fluctuations. It should be
consistent with market trends that suggest that building                                                                    noted that building permit fees increase by three per cent each
construction peaked in 2017 with declining trends through 2019                                                              year, effective on the first day of January, and therefore, a
and stabilizing trends forecasted through 2021. 1                                                                           minor increase in annual building permit value occurs naturally.
                                        $450
     Building Permit Value (Millions)

                                        $400
                                        $350
                                        $300
                                        $250
                                                                                                              $423
                                                                                                       $380

                                        $200
                                                                                         $362

                                                                                                $341
                                                             $327

                                                                                  $291
                                                                    $290

                                        $150
                                                      $203

                                                                           $187

                                        $100
                                               $132

                                                                                                                     $130

                                         $50
                                          $0
                                               2009

                                                      2010

                                                             2011

                                                                    2012

                                                                           2013

                                                                                  2014

                                                                                         2015

                                                                                                2016

                                                                                                       2017

                                                                                                              2018

                                                                                                                     2019

                                                                    5 Year Moving Average

Figure 1: Total Building Permit Value in Clarington, 2009-2019
                                                                                                                              New apartment building located at 290 Liberty St. N., Bowmanville

1
    CMHC. (2019). Housing Market Outlook Fall 2019.

                                                                                                                                                                                                  2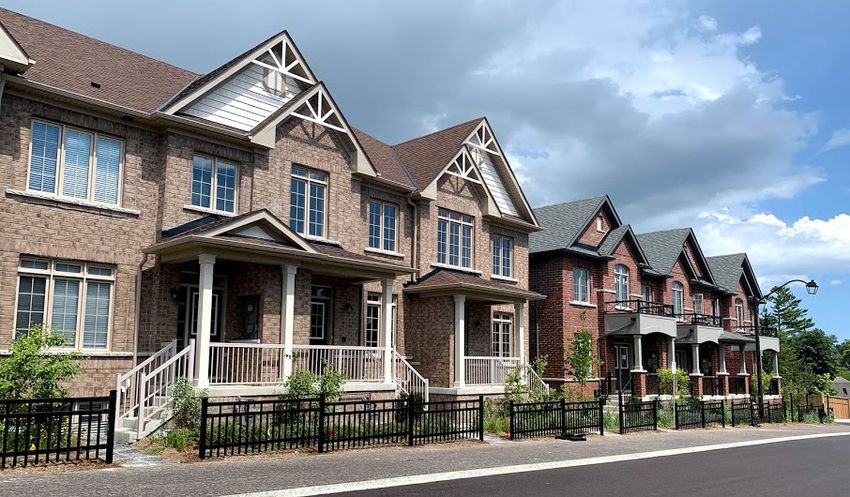
Overall, the five-year moving average depicted in Figure 1 is Table 1: Five Year Average of Residential and Non-Residential
the best indicator of growth trends. Here it shows a sustained Building Permit Values
rise in Clarington’s building permit values from 2013-2018 with
Residential Non-Residential
a drop in 2019. The yearly fluctuations of both residential and
5 Year Average 82.4% 17.6%
total non-residential building permit values can be seen in
2019 69.2% 30.8%
Figure 2.
Total Building Permit Value in Durham Region
2019 $89,709,141
2018 $343,472,347 Durham Region’s total building permit value decreased by
2017 $330,300,324 $84.5 million between 2018 and 2019, from 2.1 billion to 1.9
2016 $320,328,005
billion. The five-year average, depicted as the trend line in
Figure 3, shows that values are slowly increasing and have
2015 $291,322,557
remained relatively stable for the past decade.
2014 $217,649,678
2013 $119,417,902
$2,500
2012 $163,432,307
2011 $237,405,670
Building Permit Value (Millions)
$2,000
2010 $154,857,538
2009 $80,592,782 $1,500
0% 10% 20% 30% 40% 50% 60% 70% 80% 90% 100%
$2,059
$1,974
$1,961
$1,000
$1,630
$1,526
$1,524
$1,485
$1,460
Proportion of Building Permit Value
$1,391
$1,300
$1,064
Non-Residential Residential
$500
Figure 2: Proportion of the Total Building Permit Value by
Residential/Non-Residential Sectors in Clarington, 2009-2019 $0
2009
2010
2011
2012
2013
2014
2015
2016
2017
2018
2019
The proportion of residential building permit value for 2019,
compared to non-residential, has fallen below the average of 5 Year Moving Average
the past five years. However, the proportion of non-residential
Figure 3: Total Building Permit Value in Durham Region, 2009-2019
building permits is 42.8 per cent higher than the five-year
average.
3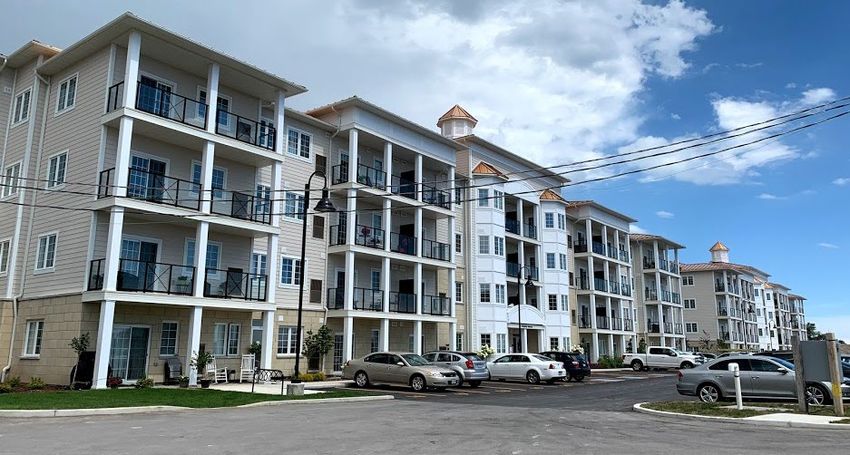
Residential building permits accounted for 54.4 per cent while                                                   Share of Total Building Permit Value in Durham
non-residential building permits accounted for 45.6 per cent.                                                    Region
The total value of residential building permits in 2019
decreased by $403.1 million or 27.3 per cent, reaching a total                              Clarington made up 6.6 per cent of Durham Region’s total
value of $1.1 billion. Non-residential building permit values                               building permit value in 2019, a decrease of 68.0 per cent from
increased by $318.7 million or 55.9 per cent, reaching $899.4                               2018. Clarington’s share of total building permit value in
million in 2019.                                                                            Durham varies year-to-year. Overall, the trend shows stability in
                                                                                            Clarington’s share of total building permit value in Durham
                  Residential                        Non- Residential                       Region (Figure 4).
                    -27.3%                               +55.9%
                                                                                                                      25%

Development in any municipality will fluctuate due to specific                                                        20%

                                                                                              Building Permit Value
projects but these balance out over the larger region. The trend

                                                                                                Share of Durham
across Durham Region is stable and reflects general economic                                                          15%
conditions in the Greater Toronto Area (GTA). 2 The region-wide
total permit values reached an all-time high of approximately 2                                                       10%
billion in 2018; 2019 has the second highest total building
permit value since 2009 (Figure 3).                                                                                   5%

                                                                                                                      0%

                                                                                                                            2009

                                                                                                                                   2010

                                                                                                                                          2011

                                                                                                                                                 2012

                                                                                                                                                        2013

                                                                                                                                                               2014

                                                                                                                                                                      2015

                                                                                                                                                                             2016

                                                                                                                                                                                    2017

                                                                                                                                                                                           2018

                                                                                                                                                                                                  2019
                                                                                                                                                 5 Year Moving Average

                                                                                            Figure 4: Clarington’s Share of Total Building Permit Value in
      Durham Region                                                                         Durham Region, 2009-2019
     made up 7% of the
       total building
     activity in GTHA.2

2
    Statistics Canada Table 32.2 (unpublished) 2019. Taken from York Region (2020). 2019 Growth and Development Review.

                                                                                                                                                                                                         4
Policy Updates                                               In July 2019, in response to the Ontario’s More Homes, More
                                                                   Choice: Ontario’s Housing Supply Action Plan, proposed
Provincial efforts to review Ontario’s land use planning           changes to the Provincial Policy Statement were released for
legislation and policy framework continued throughout 2019.        consultation. The goals of the proposed changes included
The resulting changes will have a significant impact on the        encouraging an increase in the mix and supply of housing and
development process and on how the Municipality plans for and      reducing barriers and costs for development and providing
provides facilities and services for new development.              greater certainty.

In January, proposed changes to A Place to Grow, the Growth        In addition to provincial policy change,
Plan for the Greater Golden Horseshoe, were released. These        regional policy change is also underway.
changes sought to address potential barriers to new housing,       In 2019 the Region of Durham launched
job creation and business attraction, and to streamline the        Envision Durham – a comprehensive
process for transit growth. The new Growth Plan took effect on     review of the Region of Durham Official
May 16, 2019, replacing the previous version.                      Plan. This review seeks to plan for a
                                                                   progressive and forward-looking land use
Through Bill 108, More Homes, More Choice Act, 2019, the
                                                                   planning vision for the region to 2041.
Province introduced a range of changes across numerous
statutes in an effort to cut red tape, reduce costs and increase   At the Municipal level, the current Clarington Official Plan was
housing supply. Bill 108 received Royal Assent in June 2019.       adopted by Council (November 2016) and subsequently
                                                                   approved by the Region of Durham on June 19, 2017. Since
                                                                   that time, staff have been working on implementing the adopted
                                                                   Plan through new and updated Secondary Plans. Secondary
                                                                   Plans are the detailed land use and policy framework for
                                                                   specific geographic locations (more detail see Section 5.2).
                                                                   They implement the policies of the Official Plan at a
                                                                   neighbourhood level and provide more specific direction than
                                                                   the general designations of the Official Plan.

                                                                   As of the end of 2019, Staff are coordinating 11 Secondary
                                                                   Plans and 2 Subwatershed Plans. The total land area that is
                                                                   represented by these projects is approximately 1,930 ha of
                                                                   industrial, commercial and residential lands.
          Housing backing on to a stormwater management pond in
                  Southwest Courtice Secondary Plan Area.

                                                                                                                                  5
3.0 Residential Growth
Total Residential Building Permit Value in
Clarington
Residential building permit values in Clarington have slowly
risen from 2013-2018, reaching a high of $343.4 million in
2018. 2019 saw a significant decline in building permit values at
$90.0 million, a decrease of 74.0 per cent. Fluctuation in
building permit values occur because of economic conditions,
changes to the Ontario Building Code and construction
inflationary costs. Figure 5 illustrates the decline and
Four storey condominium under construction at 65 Shipway Ave., Newcastle.
resurgence of the residential building market over a 10-year
period.
Building Challenges
$400 From a residential perspective, the servicing issues in
$350 Bowmanville have been resolved. However, development in the
Building Permit Value (in millions)
Clarington Technology Park (Secondary Plan area) cannot
$300 proceed without significant upgrades to and additional
$250 extension of the sanitary sewer system from the Port Darlington
Water Pollution Control Plant to the East, North and South
$200
limits of the lands.
$343
$330
$320
$291
$150
In Newcastle, the Municipality issued Site Plan Approval early
$237
$218
$100 in 2020 and the Region is moving forward with plans to build a
$163
$155
$119
$50
new Water Supply Plant to address future growth
$90
$81
needs. Developers in North Newcastle have been working with
$0 the Region on addressing the North Street sanitary sewer trunk
2009
2010
2011
2012
2013
2014
2015
2016
2017
2018
2019
extension to service their draft approved plans; servicing should
be available within two years. In addition, a sanitary sewer
5 Year Moving Average
trunk to service the west side of Newcastle was recently
Figure 5: Total Residential Building Permit Value in Clarington, extended across the 401 and will be extended to King Ave
2009-2019 West, west of Rudell Road, within 2020 and 2021.
6In Courtice, the lands subject to Secondary Plans (South West, Of the total number of residential unit permits approved in
South East, and Courtice Employment Lands) will be serviced 2019, the majority (91.0 per cent) were issued in the urban
in part by a sanitary sewer trunk and watermain that the Region centres of Bowmanville and Newcastle (Table 2). Bowmanville
is currently constructing from the Courtice Water Pollution contributed the highest share with 63.7 per cent. The number of
Control Plant. rural residential building permits has averaged 30 per year over
the past decade. The bulk of permits issued have typically been
Residential Unit Production in Clarington in the rural areas of Darlington and Clarke, outside of the
hamlets.
In 2019, a total of 284 new residential unit permits were issued
in the Municipality of Clarington. This is a 65.0 per cent
In Clarington, there were 6 residential projects
decrease from 2018, following an approximate decrease of
valued at over $1 million in 2019.
16.8 per cent from 2017 to 2018 and a 2.3 per cent decrease
from 2016 to 2017 (Figure 6).
This is consistent with objectives in Clarington’s Official Plan,
1000 which direct the majority of urban development within
Clarington’s three lakeshore urban areas while limiting
Number of Building Permits Issued
900
800
residential growth in rural areas. This pattern of development is
expected to continue, enabling the urban areas of Clarington to
700
increase gradually in population. 3
600
995
500
972
Clarington is affected by both growth-related Provincial policy
931
863
809
400 and legislation as well as trends in the GTA. The number of
657
593
300 permits issued in 2011 was higher due to changes to the
537
439
200 Ontario Building Code. Building permits were lower in 2019 as
284
273
100 a result of leveling of the market coupled with higher mortgage
0 rates and stricter mortgage stress tests which reduced demand,
2009
2010
2011
2012
2013
2014
2015
2016
2017
2018
2019
ultimately driving down the number of residential transactions.
The number of housing starts is expected to see a stabilizing
5 Year Moving Average
trend until 2021, matching the historical average. 4 House sales
Figure 6: New Building Permits Issued for Residential Units in are forecast to improve in 2020 and 2021. 5
Clarington, 2009-2019
3
Municipality of Clarington. (2017). Clarington Official Plan 2017 - “Chapter 4: Managing Our Growth”.
4
CMHC. (2019). Housing Market Outlook Fall 2019.
5
CMHC. (2019). Housing Market Outlook Fall 2019.
7Despite the market stressors, increased immigration across the Clarington anticipates growth in all sectors of construction
GTA and at the national level has created an overall rise in activity in 2020 as various Secondary Plans approach
demand for housing over the last 10 years. completion, providing the land needed to support this growth.
Table 2: Residential Unit Permits Issued by Area in Clarington, 2015-2019
2015 2016 2017 2018 2019
Units % Share Units % Share Units % Share Units % Share Units % Share
Bowmanville 461 49% 521 52% 589 61% 724 89% 184 63.7%
Courtice 292 31% 294 30% 112 12% 14 2% 12 4.2%
Newcastle 154 17% 149 15% 227 23% 42 5% 67 23.2%
Orono 0 0% 0 0% 0 0% 1 0% 1 0.3%
Wilmot Creek 0 0% 0 0% 0 0% 0 0% 0 0.0%
Darlington 8 1% 7 1% 13 1% 11 1% 10 3.5%
Clarke 11 1% 15 2% 11 1% 6 1% 6 2.1%
Burketon 0 0% 0 0% 0 0% 0 0% 0 0.0%
Enfield 0 0% 0 0% 0 0% 0 0% 0 0.0%
Enniskillen 0 0% 2 0% 15 2% 4 0% 4 1.4%
Hampton 2 0% 1 0% 2 0% 0 0% 1 0.3%
Haydon 0 0% 0 0% 0 0% 0 0% 0 0.0%
Kendal 1 0% 0 0% 0 0% 0 0% 1 0.3%
Kirby 1 0% 0 0% 0 0% 0 0% 0 0.0%
Leskard 0 0% 0 0% 0 0% 0 0% 0 0.0%
Maple Grove 0 0% 0 0% 0 0% 0 0% 0 0.0%
Mitchell Corners 0 0% 0 0% 2 0% 0 0% 0 0.0%
Newtonville 3 0% 3 0% 0 0% 5 1% 3 1.0%
Solina 0 0% 3 0% 2 0% 2 0% 0 0.0%
Tyrone 0 0% 0 0% 0 0% 1 0% 0 0.0%
Total 933 100.0% 995 100.0% 973 100.0% 810 100.0% 289 100.0%
8Because of the decline in the number of residential unit permits The most noteworthy change was in apartments, which grew by
issued in 2019, almost all dwelling unit types saw a decline in 250 per cent from 28 units to 98 units. This housing mix
the number of units as well. However, it can be noted that the supports new provincial and regional policy for densification
mix of residential unit types was much different in 2019 than and overall intensification of built-up areas.
any year prior. As seen in Figure 7, single detached,
townhouses, and apartments each make up about one third of Table 3: Residential Unit Permits Issued in Clarington by Type,
the housing mix. 2009-2019
2019 Single Semi-
Single Detached Semi-Detached Townhouse Apartment Townhouse Apartments Total
Detached Detached
27% 2% 36% 35%
2009 208 46 7 12 273
2010 347 114 111 21 593
2019
2011 527 110 137 89 863
2018
2012 327 88 108 14 537
2017
2013 217 86 121 15 439
2016
2014 411 142 89 15 657
2015
2015 490 78 99 264 931
2014
2013 2016 480 2 182 331 995
2012 2017 488 22 70 392 972
2011 2018 551 76 154 28 809
2010 2019 77 6 103 98 284
2009
Development charges by-laws must be updated every five
0% 20% 40% 60% 80% 100%
years. Clarington will be enacting an updated development
Single Detached Semi-detached Townhouse Apartment charges bylaw in 2020. Clarington’s Development Charges By-
Figure 7: Residential Unit Permits in Clarington by Type, 2009-2019 law, 2015-035, which came into effect July 1, 2015, supported
apartment growth.
This housing mix was possible because the number of single
detached units in Clarington reached a historic low in 2019 Clarington’s development charges by-law provides incentives
(Table 3). The number of semi-detached units was the second for midrise residential development in the Revitalization Areas
lowest it has been since 2009. The number of townhouse units of Bowmanville, Courtice, Newcastle, and Orono.
saw a small decline.
9Built Boundary
Incentives are designed to encourage more compact mid-rise
residential development. Clarington is positioning itself such The Built Boundary is part of the intensification targets set by
that it will attract future residential developments that are of the Province of Ontario. As of 2015, the Region of Durham
higher density. The Municipality’s objective is to provide must meet the goal of 40 per cent intensification for all
opportunities for residential intensification and a broad range of residential development occurring within defined built-up areas
housing types within the built-up areas to meet the changing across the Region. Intensification targets may be difficult to
needs of residents. 6 achieve in some municipalities due to servicing issues and the
extent of the built-up area.
In 2019, 75% of Clarington’s residential
growth was within the built boundary.
Overall, the Region is meeting its targets as local
municipalities, such as Clarington, are largely building within
the built boundary. Table 4 shows the number of permits issued
within and outside the built boundary in Clarington while Figure
Rendering of proposed residential development along the Courtice Main Street. 8 shows their distribution in the Municipality.
Table 4: Number of New Residential Units Issued Within and
Council approved the Courtice Main Street Community Outside the Built Boundary of Clarington by Area, 2019
Improvement Plan (CIP) in November 2016. The CIP includes
incentives to spur higher density projects along the Highway 2 2019 Within Outside Total
corridor. It is anticipated that the impact of these incentives will Courtice 11 1 12
be seen in future building activity. The Bowmanville East and Bowmanville 138 43 181
Bowmanville West Secondary Plans are also striving for higher Newcastle 66 0 66
density development. Rural 0 26 26
Total 215 70 285
In 2019, the number of residential
apartment units in Clarington increased
by 250% from 28 units to 98.
6
Municipality of Clarington. (2017). Clarington Official Plan 2017 - “Chapter 6: Encouraging Housing Diversity”.
10Figure 8: Map of Distribution of Building Permits in Clarington, Inside and Outside the Built Boundary, 2019
11The intensification target for Clarington is 32.0 per cent 7. While 100%
Clarington has been consistently exceeding this target, in 2019,
90%
the Municipality had an all time high of 75.0 per cent of all new 25%
Percentage of New Residential
80%
residential development occurring within the defined built-up 46%
53%
Building Permits Issued
areas (Figure 9). In 2019, Clarington also surpassed the 70% 64% 60%
minimum intensification target of 1,770 residential units built 60%
within the built boundary by 2021. 8 50%
It is expected that the ratio of building permits within and 40%
75%
outside of the built boundary will fluctuate on a year-to-year 30%
54%
basis. However, developments within the built boundary are 20% 40%
47%
36%
likely to increase as policies in the Official Plan state that
10%
priority will be given to those capital projects that are within the
built-up areas. Furthermore, the percentage within the built 0%
2015 2016 2017 2018 2019
boundary is anticipated to increase over time as a result of
higher intensification targets and environmental protection Within Built Boundary Outside Built Boundary
areas and fewer options for greenfield development. Figure 9: Percentage of New Residential Units Issued Inside and
Outside the Built Boundary of Clarington, 2015-2019
Newly completed four-storey residential building at
Six-storey mixed use building under construction at 109 King Ave E, Newcastle..
290 Liberty St. N., Bowmanville
7
Municipality of Clarington. (2017). Clarington Official Plan 2017 - “Chapter 4: Managing Our Growth”.
8
Municipality of Clarington. (2017). Clarington Official Plan 2017 - “Chapter 4: Managing Our Growth”.
12Share of Residential Building Permit Value in
Durham Region
Ajax
6.4%
Brock
7.9%
Clarington
8.4%
Whitby
41.5%
Newly completed residential units at 1599 Green Rd., Bowmanville
Table 5: Total Building Permit Values in Durham Region by
Oshawa Municipality, 2015-2019 (in millions)
14.3%
Ajax Clarington Oshawa Pickering Whitby Durham
2015 $124.7 $290.9 $454.4 $130.5 $127.9 $1198.9
Uxbridge
2.9% Scugog Pickering 2016 $188.6 $319.5 $332.3 $170.8 $180.6 $1268.1
2.2% 16.3%
Figure 10: Share of Total Residential Building Permit Value in 2017 $149.7 $329.4 $483.6 $189.0 $109.4 $1378.1
Durham Region, 2019
2018 $100.2 $343.5 $308.6 $365.0 $273.3 $1478.1
Durham Region’s total residential building permit value declined
from $1.5 billion in 2018 to $1.1 billion in 2019. Clarington
2019 $69.0 $90.1 $154.0 $175.7 $446.5 $1075.0
made up 8.4 per cent of the Region’s total residential building
permit values in 2019 (Figure 10). While Clarington’s value has
dropped after a steadily increasing trend, all other lakeshore Change
2018 to -31.0% -74.0% -50.0% -52.0% 63.0% -27.0%
municipalities except for Whitby, also saw a declining trend in 2019
2019 (Table 5).
13Share of New Residential Unit Permits in
Durham Region
Within the Region of Durham, a total of 3,130 new residential
unit permits were issued in 2019, a decrease of 34.0 per cent
from the previous year. Of this total, Clarington’s share of units
was 9.3 per cent. While this is a significant decrease from last
year, all other lakeshore municipalities except for Whitby, also
saw a declining trend in 2019 (Table 6). Scugog, Uxbridge, and
Brock saw slight increases, while Whitby made up 40 per cent
of Durham’s total, a reflection of the building permit values
discussed in Section 3.3.
2019 Residential units under construction at Green Rd. and Prince William Blvd.
Ajax Clarington Oshawa Pickering Whitby
7.6% 9.3% 17.6% 16.3% 39.4% Between 2015 and 2019, 20% of the new
Table 6: New Residential Unit Permits in Durham by residential construction in Durham Region
Municipality, 2015-2019 occurred in Clarington.
Ajax Clarington Oshawa Pickering Whitby Durham
2015 384 931 1388 379 458 3700
2016 805 994 903 347 668 3845
2017 438 976 1736 540 571 4468
2018 568 808 1263 1272 629 4729
2019 239 291 552 511 1232 3130
Change
2018 to -58.0% -64.0% -56.0% -60.0% 96.0% -34.0%
2019
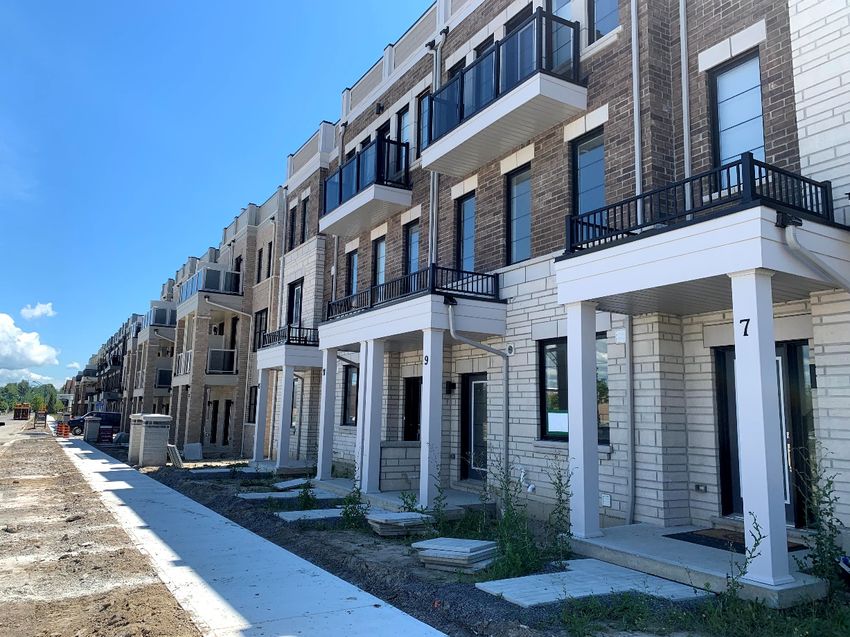
Newly completed condo townhouses at 37 Donald Powell Cres., Newcastle
14Housing Market Indicators $900,000 1200
New Residential Units Approved
Price of Single Detached Dwelling
$800,000
3.7.1 Clarington Housing Trends 1000
$700,000
$600,000 800
Clarington’s housing prices have increased steadily from 2015
$500,000
to 2019 (Figure 11). Detached dwellings have consistently held 600
$400,000
their value and been sold for more than any other type of $300,000 400
dwelling even though the number of new residential units has $200,000
fluctuated (Figure 12). However, all dwelling types have been 200
$100,000
increasing in value at relatively the same rate. The average $0 0
price of a single detached dwelling in Clarington increased in
2009
2010
2011
2012
2013
2014
2015
2016
2017
2018
2019
2019 to $616,000, a 2 per cent increase. In comparison, the
average price of townhouses and condo apartments have each Average Price of Single Detached
increased by 9 per cent. Number of New Residential Units Approved
$650 Figure 12: Average Value of Single Detached Dwellings Versus
Average House Prices (Thousands)
Number of New Residential Units in Clarington, 2009-2019
$600
$550 In Clarington, the average house prices by type also varies by
$500
location. Table 7 shows a wide range in average single
detached house prices while townhouse and condo-town prices
$450 are consistent across locations.
$400
Table 7: Average House Prices in Clarington by Location,
$350 2019 9
$300
Single Townhouse Condo-Town
$250 Detached
Bowmanville $601,000 $475,000 $416,000
$200
2015 2016 2017 2018 2019 Courtice $625,000 $475,000 $421,000
Detached Semi-Detached Townhouse Newcastle $544,000 - -
Condo-Town Condo Apt Other Orono $491,000 - -
Rural $819,000 - -
Figure 11: Average House Price in Clarington by Type, 2015-2019
Average $616,000 $475,000 $418,500
9
Toronto Real Estate Board. (2019). Community Housing Market Report Durham Region: Clarington Fourth Quarter 2019. Transactions below two are not recorded.
153.7.2 Regional Housing Trends 3.7.3 GTA Housing Trends 10
The housing sector is growing in Durham Region as buyers The Toronto Regional Real Estate Board (TRREB) states that
from other regions look for larger homes at lower price points. 2019 saw a 12.6 per cent increase in GTA home sales compared
In 2019, the average cost of a resale home in Durham to 2018. The sales growth was particularly strong in the second
increased by 3 per cent from $593,902 to $611,342. The half of 2019. There was a steady increase of four per cent in
average cost of new single detached dwelling in Durham average home price as a result of a decrease in new listings
Region increased 9.5 per cent from $739,821 in 2018 to which increased competition between buyers. TRREB forecasts
$810,424 in 2019. Ajax had the highest average cost of a new strong home ownership demand through 2020 as a result of
single-detached dwelling ($1,222,907) followed by Whitby positive labour market conditions and low borrowing costs.
($906,034) (Figure 13). In 2019, the average price for a single
detached dwelling in Clarington was $616, 000. The increase in In 2019, the average price for a home in the
housing prices is fueled by a high demand for homes coupled GTA increased 12.6%.
with a shortage of listings.
The total sales and the average selling price are expected to rise
$1,400
by approximately 10% on a year-over-year basis. TRREB
$1,200 suggests that new listings will not keep up with sales growth,
widening the imbalance between housing supply and demand.
Cost (Thousands)
$1,000
This will result in continued competition, leading to challenges of
$800 housing affordability. TRREB notes that price growth will be most
prominent in higher density low rise homes, such as semi-
$600
detached and townhouses, as many home buyers seek more
$400 affordable housing options.
$200 The demand for rental housing has been strong in 2019 due to
2009
2010
2011
2012
2013
2014
2015
2016
2017
2018
2019
increased job creation leading to increased immigration, as well
as seniors and young people entering the rental market as it is
Ajax Clarington Oshawa
more affordable than home ownership. In 2019, there was
Pickering Whitby
improvement in the number of listings to the demand. This is
Figure 13: Average Cost of a New Single Detached Dwelling in however not a likely trend and policymakers at all levels must be
Durham Region, 2009-2019 aware of rental supply needs to support housing needs.
10
Toronto Regional Real Estate Board. (2020). Market Year in Review & Outlook Report 2020. Publication forecasts pre-date the onset of the CO-VID-19 pandemic.
16Both young home buyers and seniors are driving the demand Labour markets have been strong in Ontario, leading it to be
for multi-unit housing in urban centres to meet their lifestyle one of the main drivers of residential growth in Canada. In
demands. Although the growth rate of the Canadian population 2019, Ontario saw a robust growth in housing starts and
aged 25-34 is expected to slow, the GTA is expected to remain resales. This growth in residential investment is anticipated to
the youngest aged region in the province. Changing continue in 2020 as a result of lower mortgage rates, a larger
demographics are anticipated to alter market demand in the working population and growth of disposable income. 13
coming decade. 11
3.7.5 Economic Conditions 14
The Bank of Canada projects Canada’s economy will grow by
1.2 per cent in 2019 and 2.1 per cent in 2020. Global
economic growth is “expected to slow to below 3 per cent in
2019, its weakest pace since the 2007-09 global economic
and financial crisis.”
In 2016, the Bank of Canada and the Government of Canada
renewed Canada’s Agreement on the Inflation Control
Target. Canada continues to remain close to the two per cent
target which is measured by the total Consumer Price Index
Completed section of Lakebreeze Subdivision at East Beach Rd, Bowmanville.
(CPI). The CPI inflation rate declined from 2.3 per cent in
2018 to two per cent in 2019. It is expected to reduce to 1.8
3.7.4 National and Provincial Housing Trends 12 per cent in 2020 and return to 2 per cent in 2021.
Housing starts in Canada are expected to stabilize in 2020 As expected, 2019 saw a fall in average annual real gross
and 2021, after a peak in 2017, followed by a decline in 2018 domestic product growth, from 1.9 per cent in 2018 to 1.5 per
and 2019. Home sales are expected to strengthen in 2020 cent in 2019. The numbers are expected to see a gradual
and 2021 after a decline in 2019. Housing prices are also rise through 2020 and 2021.
expected to grow steadily in 2020 and 2021 after a decline in
2019.
11
Pembina Institute and the Royal Bank of Canada. (2013). Priced Out: Understanding the factors affecting home prices in the GTA.
12
CMHC. (2019). Housing Market Outlook Fall 2019.
13
Bank of Canada. (2019). Monetary Policy Report – October 2019.
14
Bank of Canada. (2019). Monetary Policy Report – October 2019.
17Short-Term Population Forecast 15 As seen Tables 8 and 9, Clarington’s total population and total
number of households are expected to grow at a stable rate.
Clarington’s population is projected to grow to 113,900 by 2023 However, Clarington and Durham both show a declining trend
(Table 8). This translates to approximately 39,950 households in rates of change in population and household growth after
(Table 9), with an anticipated ratio of 2.8 persons per peaking in 2020.
household. From 2015 to 2023, Clarington consistently makes
up about 14.5 per cent of Durham’s population and households. Table 9: Household Growth for Clarington and Durham Region
Interestingly, Clarington’s rates of change are consistently
Clarington % Change Durham % Change
forecasted as lower than Durham Region’s, but Clarington’s
2015 94860 1.1% 666755 0.9%
actual rates of range from 2015 to 2019, show rates of change
higher than Durham Region. 2016 96490 1.7% 673040 0.9%
2017 98550 2.1% 682250 1.4%
Table 8: Population Growth for Clarington and Durham Region 2018 100290 1.8% 691580 1.4%
Clarington % Change Durham % Change 2019 102110 1.8% 699460 1.1%
2015 32580 1.38% 226480 1.07% Forecasted Numbers
2016 33225 1.98% 229005 1.11% 2020 105400 3.2% 723500 3.4%
2017 34020 2.39% 232495 1.52% 2021 108200 2.7% 745800 3.1%
2018 34710 2.03% 236040 1.52% 2022 111100 2.7% 769800 3.2%
2019 35435 2.09% 239100 1.30% 2023 113900 2.5% 793700 3.1%
Forecasted Numbers
2020 36680 3.51% 247540 3.53% Clarington has the highest percentage of homeownership
versus rental in Durham Region, reaching 88.1 per cent owners
2021 37750 2.92% 255520 3.22%
in the 2016 Census of Population. Durham has steadily
2022 38870 2.97% 264100 3.36%
increased in population and households and has also seen a
2023 39950 2.78% 272860 3.32%
slight increase in the proportion of immigrant population.
Clarington’s share of Durham’s jobs and businesses in 2019
Clarington has the highest percentage of was 10.8 per cent and 11.7 per cent respectively. Durham has
experienced an increase of 0.8 per cent in businesses and 3.1
homeownership within Durham Region.
per cent in jobs from 2018. 16
15
Region of Durham. (2019). Monitoring of Growth Trends: Commissioner’s Report #2019-INFO-90
16
Region of Durham. (2019). The Region of Durham Business Count (Highlights) 2019.
18Planning for Intensification These density targets and policies will be integrated into the
Region’s policies; however, they are currently based on the
The 2014 Provincial Policy Statement (PPS) requires planning requirements in the 2006 Growth Plan (Figure 21).
authorities to identify appropriate locations for intensification
opportunities, as well as establish minimum intensification Based on the Growth Plan and current targets in the Region’s
targets based on local conditions. According to the PPS, Official Plan, upper and single-tier municipalities, such as the
“intensification” is defined as the development of a property, Region of Durham, are to direct a minimum of 40 per cent of all
site or area at a higher density than currently exists, through: new residential units to the built-up area. Durham Region set
Clarington’s minimum intensification allocation to 32 per cent,
a) Redevelopment, including the reuse of brownfield sites; which is 13 per cent of the Regional total.
b) The development of vacant and/or underutilized lots
within previously developed areas; Clarington has surpassed its
c) Infill development; and intensification target of 32%.
d) The expansion or conversion of existing buildings.
The policies in Clarington’s Official Plan require a minimum
The Growth Plan for the intensification target of 32 per cent for all residential
Greater Golden Horseshoe, development in the built-up area by 2021, and 40 per cent
A Place to Grow, was thereafter. Figures 14 shows the Municipality of Clarington, its
updated in 2019 and came urban areas and designated greenfields, within the context of
into effect on May 16, 2019. the Greater Golden Horseshoe. Figure 15 shows a conceptual
A Place to Grow (2019), is a example of rural/agricultural, designated greenfield, and built
provincial policy that boundary areas. The growth targets are optimistic compared to
prioritizes intensification past trends. The Municipality is required to plan on this basis
through density targets for and is required to update these policies in keeping with the
built-up areas and 2019 Growth Plan.
greenfields. The density
Directing new residential development to existing urbanized
targets ensure that land is
lands, the 2019 Growth Plan requires a greenfield density
utilized efficiently to
target of 50 residents and jobs per hectare – the minimum
accommodate future growth
density needed to support frequent transit service. These
while protecting natural
intensification objectives focus on complete communities that
areas and providing for
support active transportation and encourage the integration and
complete communities. This Plan projects 1.19 million residents
sustained viability of transit services.
and 430,000 jobs in the Region of Durham by 2041.
19Figure 14: Map of the Greater Golden Horseshoe showing inner & outer ring municipalities; built-up areas;
Greenbelt; Durham Region and Clarington
202006 Growth Plan:
• A minimum of 40% of all residential
development within the delineated
2006 Growth Plan: built-up area
Greenfield Density • Intensification minimum of 32% after
• 50 residents/jobs per ha 2021, 40% by 2031
2019 Growth Plan: 2019 Growth Plan:
Greenfield Density • A minimum of 50% of all residential
• 50 residents/jobs per ha development within the delineated
built-up area
• 200 residents/jobs per ha in urban
growth centres
Figure 15: Intensification Targets and Boundaries from A Place to Grow (2019)
214.0 Non-Residential Growth Within the non-residential sector in 2019, the percentage share
of building permit values by sector were:
Total Non-Residential Building Permit Value in Industrial Government Commercial Institutional Agricultural
Clarington 11.3% 1.5% 11.6% 2.2% 4.2%
The total value of non-residential building permits issued in
Clarington was $39.9 million in 2019. Industrial development 2019
largely dominates the non-residential building permit values in 2018
Clarington; the total non-residential building permit values 2017
reflect the changes in the industrial building permit value 2016
(Figure 16). There was a significant spike in industrial building 2015
permit values in 2018 as a result of building permits issued to 2014
Toyota Canada Inc. for the Parts Distribution Centre, totalling 2013
$39.0 million. 2012
2011
$80 2010
2009
$70
Building Permit Value (Millions)
0% 20% 40% 60% 80% 100%
$60
Percentage Share of Non-Residential Sector
$50 Building Pemit Values
$40 Industrial Commercial Government Institutional Agricultural
$30
Figure 16: Percentage Breakdown of Non- Residential Sector Building
$20 Permit Value, 2009-2019
$10
Non-residential building permit values fluctuate greatly year-to-
$0 year. Additionally, the total permit values for all non-residential
2015 2016 2017 2018 2019 projects vary due to major projects requiring permits to be paid
Industrial Government at the beginning but construction occurring over the next
Commercial Institutional several years. In Figure 17, agricultural, government, and
Agricultural Total Non-Residential institutional building permit values remain fairly stable due to
the lower scale and cost of structures when compared to other
Figure 17: Total Non- Residential Building Permit Value by Sector, building projects. 2019 had a total of 14 non-residential projects
2015-2019 with building permits over $1 million (see Table 10).
22Table 10: Non-Residential Building Permits Issued in 2019 Over $1 Million
Owner Location Description Value ($) Type
Algoma Orchards Ltd. 201 Regional Road 42, Clarke Additions to Cold Storage & $2,500,000 Agricultural
Packing Facility
Almet Farms Ltd. 2575 Concession Road 7, Poultry Barn $1,700,000 Agricultural
Darlington
2500030 Ontario Inc. 11 Spicer Square, Bowmanville Car Dealership (Hyundai) $3,991,012 Commercial
Courtice Development Group Inc. 1405 Bloor Street, Courtice 2 Storey Retail and Office Building $2,896,149 Commercial
2649328 Ontario Inc. 330 Lake Road, Bowmanville Assembly Shell Building with $1,439,460 Commercial
Industrial Portion (Joey's World)
Valiant Rental Inc. 1565 Green Road, Bowmanville Tim Horton's Restaurant $1,100,000 Commercial
Newcastle Marina Villa Ltd. 65 Shipway Avenue, Newcastle Parking Garage $3,175,200 Industrial
Goldmanco Inc. (1728589 On Inc.) 2805 Trulls Road, Courtice Site Servicing $2,100,000 Industrial
Toyota Canada Inc. 1050 Lambs Road, Bowmanville Shelf & Racking $1,500,000 Industrial
Regional Municipality of Durham 1998 Bowmanville Avenue, Hazardous Waste Depot & Office $1,300,000 Industrial
Bowmanville
Ontario Power Generation 2151 Energy Drive, Darlington Transport & Work Equipment $1,000,000 Industrial
Storage
Ontario Power Generation 2151 Energy Drive, Darlington Salt & Sand Storage $1,000,000 Industrial
Ontario Power Generation 2151 Energy Drive, Darlington HVAC Upgrade $1,000,000 Industrial
Kawartha Pine Ridge District 1717 Nash Road, Courtice Interior Renovations $1,200,000 Institutional
School Board (Manufacturing, Carpentry Shops
& Science
23Share of Non-Residential Building Permit Value
in Durham Region
Non-residential building permit values in Durham Region rose
to $899.4 million in 2019, a 54.9 per cent increase from $580.7
million in 2018. Clarington’s share of the total non-residential
building permit value was 4.4 per cent in 2019 (Figure 218),
following a share of 6.5 per cent in 2018. From 2018 to 2019,
Pickering saw a remarkable share value gain of 45 per cent.
This is due to the construction of the Durham Live project- a
new entertainment and tourism hub including a hotel, casino,
event venues, and other amenities. All other local municipalities
experienced a significant decline in their share.
Newly completed Tim Hortons at 1565 Green Rd., Bowmanville
Ajax Brock
Whitby Clarington
1.6% 0.5%
10.7% 4.4%
Uxbridge
2.8%
Scugog Oshawa
1.2% 19.3%
Pickering Newly completed company office, shop, and washbay for Boyle
59.5% Excavating at 210 Baseline Rd. E., Bowmanville
Figure 18: Share of Total Non-Residential Building Permit Value in
Durham Region, 2019
24Non-Residential Floor Space Production in
Durham
The past few years have shown varying levels of non-
residential floor space production in the lakeshore
municipalities of Durham (Figure 19). The total non-residential
floor space production in Durham declined by 40 per cent from
4,235,000 square feet in 2018 to 2,541,400 square feet in
2019. As a result, all local municipalities except for Oshawa
saw a decline. Oshawa saw a significant increase by 66 per
cent. Despite the decline, Clarington still had third largest share
Region wide at 393,600 square footage. Rendering of a mixed-use development that will include commercial space,
Shell gas station, Tim Hortons, and eight storey residential building, at Bloor
St and Townline Rd. S. in Courtice.
1200
The year-over-year change in non-residential floor space
1000 production for the Region increased by 70.3 per cent in 2018, a
Square Footage (Thousands)
steady recovery from a low in 2015. Much of Clarington’s floor
800 space has been related to the energy and industrial sectors.
Major contributors of this growth include Toyota Canada Inc.,
600
and Ontario Power Generation.
400
200
0
2015 2016 2017 2018 2019
Ajax Clarington Oshawa
Pickering Whitby
Figure 19: Production of Non-Residential Floor Space in Durham
Region, by Municipality, 2015-2019
Toyota Eastern Canada Parts Distribution Centre.
Completed in 2019; located at 1050 Lambs Rd., Bowmanville
255.0 Key Projects and Initiatives The Strategy will help to define the role of the Municipality,
partner organizations and the private sector in providing EV
Climate Change infrastructure and services and promote EVs adoption in the
community.
The Municipality of Clarington is taking actions to respond to a
changing climate. In May 2019, the Municipality hired a Concurrent with the
Climate Change Response Coordinator and formed an inter- development of the
departmental staff working group to develop the Clarington Strategy, the
Climate Action Plan. The group is working to strengthen Municipality sought
municipal policies and practices to reduce greenhouse gas Federal funding as part
pollution, identify and reduce the risks and vulnerabilities of a region-wide
associated with climate change, improve corporate resilience to collaborative to
climate change, and safeguard community wellbeing. The establish a network of
Clarington Climate Action Plan is currently under development Level 2 EV charging
and is slated for completion in late 2020. stations across
Durham Region.
Funding was awarded
in December 2019 and
will contribute to the
installation of 60 Level
2 EV chargers across
21 municipally owned,
publicly accessible
sites across Durham EV Charging station at Garnet B. Rickard
Recreation Complex in Bowmanville.
by Fall 2020.
The Municipality is collaborating with the Region to support
community-level climate action through the Durham Community
Sandbagging during flooding at Cedar Crest Beach, Bowmanville.
Climate Adaptation Plan (DCCAP) and the Durham Community
Collaboration is an important component of Municipal climate Energy Plan (DCEP). Both the DCCAP and DCEP are being
action planning. The Municipality has partnered with Trent led by the Region and were endorsed in principle by Clarington
University Durham Campus to develop the Clarington Council in 2017 and 2019, respectively.
Community Electric Vehicle (EV) Infrastructure Strategy.
26You can also read