INVESTOR PRESENTATION - January 2020 - Icade
←
→
Page content transcription
If your browser does not render page correctly, please read the page content below
ORIGINE
(Paris La Défense - Nanterre, Hauts-de-Seine)

                                                INVESTOR PRESENTATION
                                                        January 2020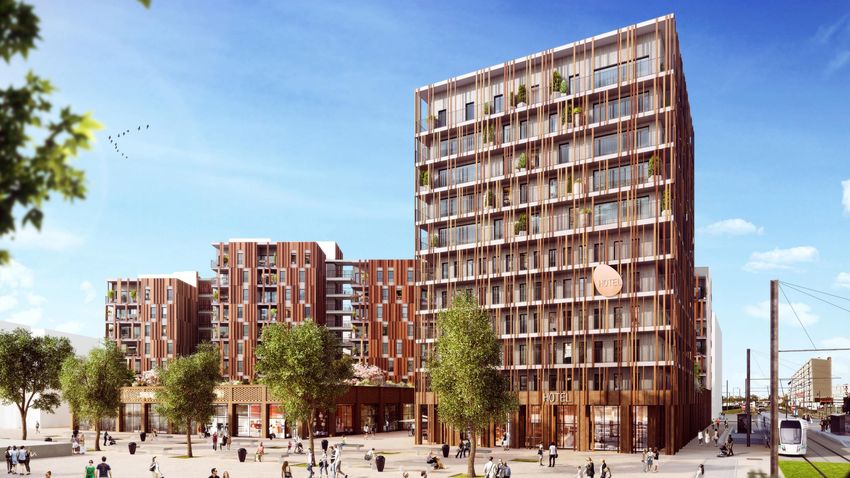
ICADE AT A GLANCE
ICADE AT A GLANCE: ONE OF THE LEADING FRENCH LISTED REITS
€11.7bn property portfolio
OFFICE INVESTMENT: (as of 06/30/2019, excluding duties, group share)
Icade, the leading real estate player in Greater Paris
Portfolio as of 06/30/2019: 9.3bn (100%) Office
€2.3 bn development pipeline (389,000 sq.m) Investment Healthcare
900,000 sq.m land bank 78% Investment
22%
HEALTHCARE INVESTMENT: Cash-Flow by division
Icade: leading player in France, diversifying in Europe (as of 06/30/2019)
Development
Portfolio as of end of November: >5.0bn (100%) 7%
Dedicated subsidiary with minority shareholders - Healthcare
all French life insurance companies (43%) Investment
Office
128 healthcare facilities in France (90% short, medium care)
33% Investment
60%
32 long-term care facilities in Europe (Italy, Germany)
DEVELOPMENT: Among the leaders in France Icade shareholding structure
as of 06/30/2019 (in %)
Limited and profitable exposure
(less than 10% of Group equity (1)) Free float (3)
A full-service developer (offices, homes, etc.) with extensive 37.13% Caisse des dépôts
national coverage (21 regional offices) 38.77%
2018 FY economic revenue (2): €1,251m; ROE : 15%
ICAMAP Crédit Agricole
GIC and Future Fund Assurances Group
acting in concert
18.92%
Notes: (1) Property Development equity attributable to the Group (before restatement of investments
in subsidiaries / Consolidated equity attributable to the Group) 5.18%
(2) Economic revenue: revenue including entities accounted for using the equity method
(3) Including 0.27% for Icade’s “FCPE” employee-shareholding fund and 0.85% of treasury shares I 2
ICADE AT A GLANCE

  ATTRACTIVE FUNDAMENTALS FOR THE ICADE SHARE
                                                                                                      Dividend history (in €)
       Market capitalisation:                    Average daily
                                                                            Dividend yield:                                          4,60
          €6.0bn (1)                          trading volume (2):
                                                                                                                             4,30
                                                                             C.6%
                                                                                      (1)
                                                                                                                4,00
         Free float: 37%                         ~ €11m                                       3,73   3,73

                                                                                              2014   2015        2016        2017     2018

                                                                                                            NAV TSR (in %)
       Strong financial structure:                                                                              12,7%        12,8%
                                                                                                                                     11,0%
                                                                  Strong 2016/2018
       LTV ratio of around 40%
                                                                 performance and TSR
            BBB+ S&P rating                                                                   2,0%   2,2%

                                                                                              2014   2015        2016        2017     2018

             (1) As of June 30, 2019
             (2) 6-month average daily trading volume as of June 30, 2019                                                                    I 3
ICADE AT A GLANCE

                     SHAREHOLDERS, BOARD OF DIRECTORS
                          & MANAGEMENT ALIGNED

                      Strategic Plan approved unanimously by the Board of Directors

                                Strengthened governance since April 2019

                               Icade’s two leading shareholders are aligned

                    A committed Board of Directors, geared toward growth,
                       supporting management in implementing the plan

                                                                                      I 4
ICADE AT A GLANCE
2019–2022 PLAN: A CLEAR AND AMBITIOUS PLAN
1. 2. 3.
Leader in the office 4.
market in the Greater European leader Key player in Best-in-class CSR
Paris area and major in healthcare property and innovation
cities outside Paris real estate development
Sales of mature assets Diversification into Positive performance Priority: low carbon
Reinvestment the long-term care segment in competitive processes Target: a nearly 1.5°C
in development International expansion Replenishing pathway
Opportunistic acquisitions Investment target: €2.5bn the office pipeline
A plan aimed at delivering attractive
recurring yields & value creation I 5
ICADE AT A GLANCE

  2019: IMPLEMENTATION WELL UNDERWAY

                                  2019
                         1st   year of the plan                           2020                     2021                2022

                                         Office             Acceleration and
           Sales of                   investments         diversification within         Improved
         mature assets                                  the healthcare segment          ESG ratings
                                       €380m                                                              Icade Santé’s inaugural
           ~€1.1bn                                              €735m               Ranked as a                 bond issue
                                  70% in the pipeline
           +67% YoY                                                                sector leader             10 years, €500m,
                                                                                     by GRESB                coupon of 0.875%
                                                                                      (84/100)

                                    Icade fully committed
                                    to implementing its 2019–2022 plan…                                                             I 6
ICADE AT A GLANCE
ICADE VS. PEERS SHARE PRICE EVOLUTION JAN. 2016 DEC. 2019
200
Evolution ICADE-EPRA Europe et pairs en dividendes réinvestis du 31/12/2015 au 31/12/2019
190 (Base 100 cours d'Icade au 31/12/2015)
96,43%
Icade +96.4%
180
170 71,51%
EPRA
160 +26.7%
50,05% Europe
150
46,74%
140
130 26,68% Covivio +50.1%
120
110
100
Gecina +71.5%
90
80
CAC 40 +46.7%
Icade Base 100 EPRA Europe Gecina Covivio CAC40
(Basis 100 / share price of Icade as at Jan 12/31/15 – incl. reinvested dividend)
I 7
Sources : Bloomberg, Rothschild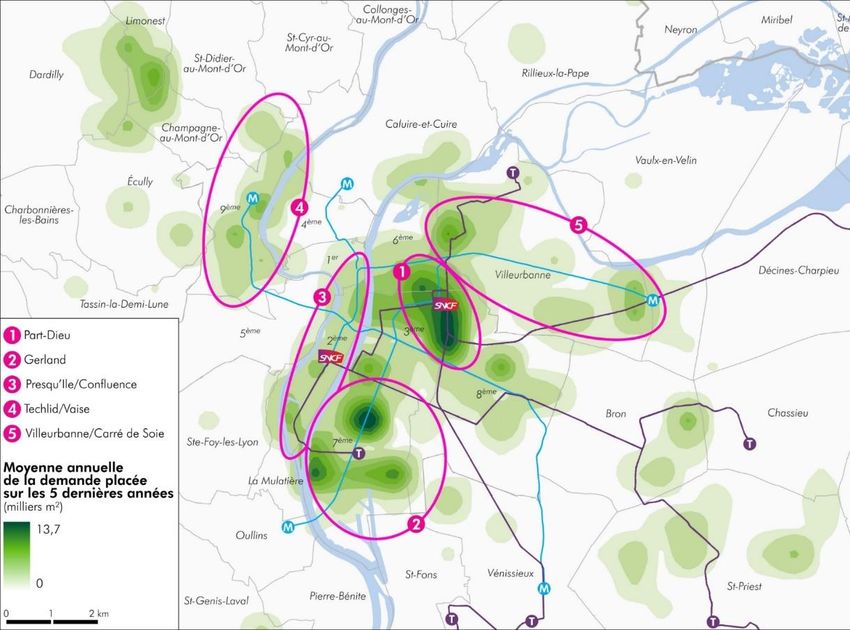
ICADE AT A GLANCE
ICADE VS. PEERS SHARE PRICE EVOLUTION JAN. 2019 DEC. 2019
Icade +54.8%
EPRA
+29.4%
Europe
Covivio +26.2%
Gecina +47.3%
(Basis 100 / share price of Icade as at Jan 12/31/18 – incl. reinvested dividend) I 8
Sources : Bloomberg, Rothschild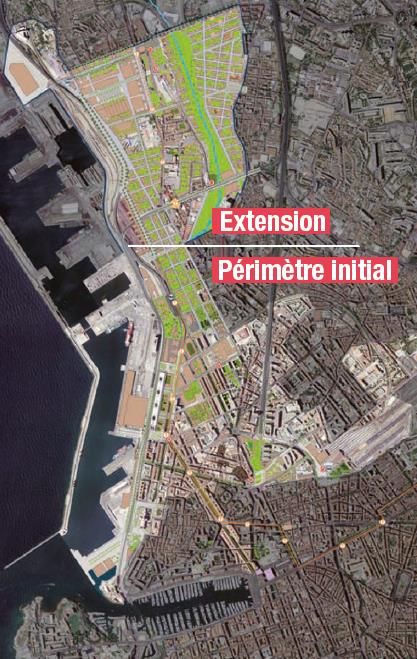
ICADE AT A GLANCE

                                        SOLID FINANCIAL RESULTS
                                      REFLECTING STRONG ACTIVITY

             Positive H1 2019 results (EPRA NAV: +2.7%; NCCF: +4.5%)

             Good momentum confirmed in Q3 with notably a solid leasing activity:
             • Office Rental income up 1.7% on a like-for-like basis
             • Healthcare: Rental income soars by 10.5% on a reported basis
             • Property development : business indicators in line with H1; Residential backlog up: +14.9%

             NCCF guidance for FY 2019 raised at the occasion of the Investor Day (11/25/2019)
                            NCCF (in € per share) stable including the impact of 2019 disposals
                                    (vs. initial guidance: stable excluding the impact of 2019 disposals)

                                                              …Good momentum since 2016
                                                                                                            I 9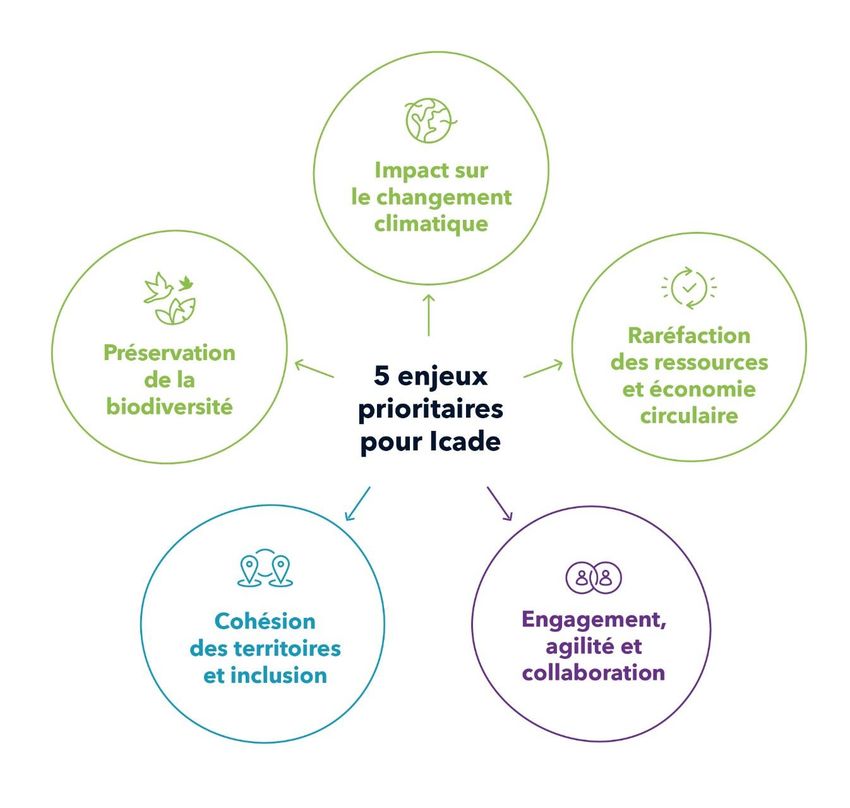
PARK VIEW PROJECT – TÊTE D’OR AREA
                                                   (Lyon, Rhône)

OFFICE PROPERTY INVESTMENT
OFFICE INVESTMENT
OFFICES: A RESILIENT MARKET
Paris region rental Stabilised Strong absorption
market normalising vacancy rate in of new supply
the Paris Region in the Paris region
1.1 million sq.m in H1 2019
(-19% vs. H1 2018 and
+1% vs. 10-year average) 5.3% at the end only 15% of vacant space is new
and 39% of space under construction
of June 2019
after two record years
for large occupiers Only 2% in Paris is already pre-let
Source: ImmoStat Source: JLL Source: JLL
Strong activity in major cities Increased attractiveness
outside Paris of property investment
1.2 million sq.m taken up over a rolling 12-month €13.7bn invested in H1 2019
period in Q1 2019 (+9% YoY, +18% vs. 5-year average) (71% in offices with the return of acquisitions over €500m)
Lyon stands out with an estimate Persistent low interest rate environment
of 350,000-sq.m take-up in 2019 Strong presence of foreign investors
Source: BNPP RE, in Aix/Marseille, Bordeaux, Lille, Lyon, Nantes and Toulouse Source: BNPP RE
I 11OFFICE INVESTMENT
ICADE’S OFFICE PORTFOLIO AT THE HEART OF THE GREATER PARIS AREA
Paris region portfolio 1,568,207 sq.m (2)
Portfolio outside the Paris region 197,164 sq.m
(2)
(1) €7,408m TGV
17
€754m (1)
PORTES DE PARIS
334,240 sq.m
SAINT-DENIS
62,330 sq.m BORDEAUX LYON
Go Spring – Nanterre Origine – Nanterre
GENEVILLIERS
23,520 sq.m 49,741 sq.m 96,886 sq.m
LA DÉFENSE-
NANTERRE
279,180 sq.m 17 16
MAUVIN BUSINESS PARK Pulse – Saint-Denis MARSEILLE
21,980 sq.m
14 15 34,388 sq.m Le Castel – Marseille Quai 8.2 – Bordeaux
PONT DE FLANDRE
MILLÉNAIRE
90,690 sq.m
TOULOUSE
RUEIL-MALMAISON
21,730 sq.m
144,670 sq.m 11 16,150 sq.m
PARIS, 20th DISTRICT
PARIS, 8th DISTRICT
20,030 sq.m
9,880 sq.m
LAND BANK: 900,000 sq.m
NEUILLY-SUR-SEINE
3,600 sq.m PARIS, 15th DISTRICT
11 16 Gambetta – Paris
33,400 sq.m
15
BOULOGNE-BILLANCOURT
15
4,980 sq.m VILLEJUIF PORTES DE PARIS BUSINESS PARK
ISSY-LES-MOULINEAUX
18,270 sq.m
29,770 sq.m 277,000 sq.m
18
GENTILLY
13,710 sq.m
Fresk – Issy-les-Moulineaux
GRAND PARIS EXPRESS LINES
PORTE DE GENTILLY
18 14
14
6,000 sq.m
TGV 15
ORLY-RUNGIS BUSINESS PARK Monaco – Rungis business park 16, 17 ORLY-RUNGIS BUSINESS PARK
388,380 sq.m 18 18 Beyond 2030
610,000 sq.m
Notes: (1) Value of the property portfolio excl. duties, Group share, ASSETS CENTRAL BUSINESS HIGH-SPEED TRAIN STATIONS
DISTRICT
as of the end of September 2019 (excl. residential)
TGV Existing high-speed train station
based on appraised values as of June 30, 2019
(2) Total floor area excl. housing units, hotels and PPPs GRAND PARIS HIGH-SPEED
EXPRESS LINES TGV TRAIN STATION TGV Planned high-speed train station I 12OFFICE INVESTMENT
OFFICE INVESTMENT: KEY FIGURES
Like-for-like changes in rental income
12/31/2018 06/30/2019 (in %)
PORTFOLIO VALUE (100% basis, excluding duties) €8.9bn €9.3bn 4.9%
Offices
PORTFOLIO VALUE (Group share, excluding duties) €8.7bn €9.1bn 3.9%
WEIGHTED AVERAGE UNEXPIRED 3.1%
4.7 years 5.0 years 2.9%
LEASE TERM
FINANCIAL OCCUPANCY RATE 93.4% 91.8%
0.4%
AVERAGE NET INITIAL YIELD TOTAL
5.9% 5.7%
(Group share, excluding duties) H1 2016 H1 2017 H1 2018 H1 2019
TOTAL FLOOR AREA (in millions of sq.m) 1.8 1.8
AVERAGE PRICE PER SQ.M (1) 4,500 4,700 -3.1%
PARIS REGION OFFICES 7,500 8,000 Business parks
OFFICES OUTSIDE THE PARIS REGION 3,150 3,200
BUSINESS PARKS 2,100 2,300
CONTINUED LFL GROWTH IN RENTAL INCOME
STILL ATTRACTIVE YIELDS AND PRICES PER SQ.M IN A BULLISH MARKET
Note: 100% basis - (1) For buildings in operation I 13OFFICE INVESTMENT
DYNAMIC ASSET ROTATION IN THE OFFICE INVESTMENT
PORTFOLIO SINCE 2015
€2.9bn in cumulative disposals since 2015, Disposals completed on average 12.3%
fully reinvested in the portfolio above appraised value
4,0 9,5
Net cumulative investments and portfolio valuation Difference between sale price and appraised value
(in €bn, Group
3,0€bn, Groupshare)
share) 2.9 (difference vs. appraised value as of 12/31 before the sale, in %)
2.5 9,0
2.0 8.7
2,0
2017 20.7%
8.5
8,5
1,0 0.9
0.8 0.7 8.3 (1)
0.2 2018 8.8%
0.0
0,0
-0.2
0.0 8,0
+11.2%
-0.4 -1.0 2019 YTD 12.6%
-1,0
7.7 -1.2
7,5
7.4
-2,0
-1.8 2017-2019 +12.3%
Cessions
Disposals 7,0
Cumulative
-3,0 Investments (acquisitions,
Investissements (Acquisition,capex,
Capex,etc.)
etc.) since 2015
Net investments
Investissement netsince 2015
depuis 2015 -2.9
Valuation ofdu
Valorisation thepatrimoine
Office Investment
FT (en QP,portfolio
en Md€)(Group share, in €bn) Further momentum gained in 2018-2019
-4,0 6,5
2015 2016 2017 2018 Q1-Q3 2019
2019 T1-T3 2018–2019 disposals: €1.6bn
11.2% above appraised value on average
On a Group share basis
Notes: (1) Values as of 06/30/2019, after taking into account the sale of Crystal Park and 49% of the Eqho Tower
Rental income related to sold assets: €73.8m (2)
and capex recorded in Q3 2019
(2) Annualised IFRS rental income for the quarter preceding the disposal I 14OFFICE INVESTMENT
PORTFOLIO REPOSITIONED,
VALUE CREATION DELIVERED
December 2015 June 2019 (1)
Other large Other large
French cities French cities
1% 9%
Paris region Paris 13%
excl. Paris Paris region Paris 22%
20% excl. Paris
Continuous improvement
12%
in asset quality and
portfolio positioning
La Défense /
Peri-Défense Increased exposure to
27% major cities outside Paris
La Défense / (vs. reduced weight
Inner Ring Inner Ring Peri-Défense
27% 28% 26%
of the Outer Ring)
Western Crescent Western Crescent
12% 3%
Total value creation of nearly €900m
In 4 years, achieved through
Dynamic asset management
On a Group share basis
Note: (1) Includes disposals carried out since June 2019, i.e. Crystal Park and 49% of the Eqho Tower (€1,055m) I 15OFFICE INVESTMENT
DEVELOPMENT: A KEY CONTRIBUTOR TO VALUE CREATION (60 %)
16 projects completed (5) since 2015
(~260,000 sq.m)
Investment amount on completion €1.2bn
Value creation: €0.5bn
(37% of the invested amount)
Fair value on completion (1) (2) €1.7bn
YoC (3) 6.5%
Attractive YoC: 6.5%
Yields (4) as of Sept. 30, 2019 4.8%
ERV as of Sept. 30, 2019 €80m Additional rental income: €80m (6)
Financial occupancy rate as of Sept. 30, 2019 82%
On a 100% basis
Notes: (1) First appraised value after project completion, excluding properties sold since their completion
(2) Including sales of properties which have been completed since 2015: €98.8m
A proven track record
(3) Average estimated YoCs before project completion, excluding properties sold since their completion
(4) Annualised net rental income from leased space plus potential net rental income from vacant space
Higher goals for development
at estimated rental value, divided by the appraised value excluding duties of leasable space
(5) Including 1 disposal
(6) Potential rental income: headline for leased space + ERV for vacant space I 16OFFICE INVESTMENT
2019 COMPLETIONS: ~€180M (1) IN ADDITIONAL VALUE CREATION
Spring A Le Castel 3 completions expected in Q4
Completed Nanterre Completed Marseille Completed • Eko Active (Marseille)
in Q1 2019 in Q1 2019 in Q4 2019
• Financial occupancy • Financial occupancy • Monaco
rate: 100% rate: 100% • B007 (Pont de Flandre)
• Floor area: • Floor area: • Total floor area: 16,040 sq.m
18,540 sq.m 5,960 sq.m
• Total pre-let space to date: 77%
Pulse Factor E
Completed Saint-Denis Completed Bordeaux
in Q1 2019 in Q2 2019
• Financial occupancy • Financial occupancy
rate: 0% rate: 79%
• Floor area: • Floor area:
28,869 sq.m 10,922 sq.m Value creation: 33% of total
investment (€549m (2))
Potential rental income (4) of €36m
Gambetta Lafayette B-C
Completed Paris, 20th district Completed Lyon
in Q1 2019 in Q3 2019 • Financial occupancy
• Financial occupancy
rate: 98% rate: 81% (3)
• Floor area: • Floor area:
20,033 sq.m 7,206 sq.m
2019 pipeline remains solid
Notes: (1) Calculation based on valuations as of June 30, 2019 – excl. Lafayette (valuation as of 06/30/19 + investments recognised in Q3 2019)
and excl. Q4 completions (Icade estimates)
(2) Initial value + investments recognised or estimated between the beginning of the project and its completion
(3) Including leases signed but scheduled to start at a later date
(4) Potential rental income: headline for leased space + ERV for vacant space I 17OFFICE INVESTMENT
A GROWING 2019-2024 DEVELOPMENT PIPELINE
Projects started Projects not committed Total pipeline
Number of projects 13 6 19
Investment amount (1) €1.4bn €0.9bn €2.3bn
Floor area 244,000 sq.m 145,000 sq.m 389,000 sq.m
Expected rental income
€89m €56m €144m
(annualised)
Yield on Cost (2) 6.4% 6.2% 6.3%
€0.4bn added to the pipeline of non-committed projects
Average fair value-based YoC of 6.3% vs. an average capitalisation rate of 4.6%, i.e. a 170-bp difference
Estimated value creation increases to €0.7bn (vs. €0.5bn as of 06/30/2019)
On a 100% basis
Notes: (1) Includes the fair value of the asset at project start, cost of works (incl. expenses, fees and tenant improvements) and carrying costs
(2) Fair value-based YoC = headline rental income / cost of the project. This cost includes the fair value of the asset at project start, cost of works (incl. expenses, fees and tenant improvements) and carrying costs I 18OFFICE INVESTMENT
… GENERATING STRONG CASH FLOWS: €144M OF FUTURE RENTAL INCOME
Expected additional rental income
(headline, annualised, in €m)
Pre-let space for 2019-2020: 70%
€84m
€37m
€18m
€25m
€7m
€7m
€44m in additional rental income
€5m
expected in 2019–2020
2019 2020 2021 >2021
Total pre-let space represents 41%,
pre-let
incl. 70% for projects to be completed by the end
of 2020
Expected additional rental income, by geography, until 2024
(in %)
Other large French cities 8%
Paris 9%
Outer RingOFFICE INVESTMENT
RECAP
OUR STRATEGY: ASSET ROTATION AND DEVELOPMENT PIPELINE
DELIVERING AN ATTRACTIVE TSR
A €2.3bn development pipeline,
€1.6bn including €1.4m for started projects
Yield-on-Cost for started projects stands at 6.4%
of disposals
in 2018–2019
(+11.2% above
appraised value) Pre-let space (1)
€0.7bn value creation represents 41%,
potential in the pipeline including 70% for
(incl. €0.2bn captured projects to be
Additional rental income from as of June 30, 2019) completed by the
the pipeline of €144m end of 2020
Note: (1) Percentage of pre-let space relating to projects already started I 20SANTÉ ATLANTIQUE
(Saint-Herblain, Nantes)
ELSAN
HEALTHCARE INVESTMENTHEALTHCARE INVESTMENT
MARKET CONDITIONS CONTINUE TO BE
VERY FAVOURABLE BOTH IN FRANCE AND ABROAD
Fundamentals remain The healthcare real estate market
attractive remains active in France
2019 expected investment volume:
Sustained growth in healthcare expenditure
€750m (€730m in 2018)
driven by medical standards and (including €385m in acquisitions by Icade Santé)
an ageing population
Private acute care fees up in France
for the first time in 5 years A deep European market
Over 9M, investments totalled €5.2bn
Healthcare operators very active with close to €6bn expected in 2019
both in France and internationally (€6bn in investments in 2018)
Source: RCA 2019
Long-term care has become a major healthcare need...
I 22HEALTHCARE INVESTMENT
AN OUTSTANDING PORTFOLIO
CURRENTLY WORTH OVER €5bn
The Healthcare Investment Division currently owns 128 healthcare facilities in France
Rapid portfolio growth Well-respected, high-quality facilities
80 acute care facilities +13 facilities (+11% in 2019) Le Point’s ranking of the best
public and private hospitals in France
incl. 1 under construction
19 post-acute care facilities
incl. 1 under construction
100% Occupancy rate Icade Santé’s private hospitals
8 mental health facilities 3 in the top 4
~5.8 Net initial yield 36% in the top 50
21 nursing homes (out of the 352 private
Extensive national coverage hospitals that were assessed)
in France
New opportunities
… and 32 facilities in Europe ~20 years Investments made
(excl. France) Weighted average > 5%
32 long-term care facilities unexpired lease term yield
incl. 7 off-plan projects
Number of beds
3,800
I 23HEALTHCARE INVESTMENT
STRATEGY IMPLEMENTATION:
AHEAD OF SCHEDULE ON OUR ROADMAP
Consolidation of Icade Santé’s
Very robust market-leading position in acute care
leasing activity Acquisition of the Confluent
private hospital for €194m
Gross rental income: +10.5%
in Q3 2019
Continued implementation Increased international presence
Very strong LFL growth of the expansion strategy Investments: >€300m
+2.6% LFL in Q3 YTD investments Germany added to the portfolio
~€735m
Positive impact of completed
projects and acquisitions Further diversification into
2018 & 2019 projects: long-term care facilities
>€15m of rental income
Acquisition of 12 facilities
incl. 7 nursing homes for €191m
I 24HEALTHCARE INVESTMENT
FURTHER STRENGTHENING OF RELATIONSHIPS WITH OPERATORS
AND ONGOING DIVERSIFICATION
Atlantique polyclinic, Saint Herblain - Elsan
Reflet de Loire nursing home,
Côte Normande PAC facility, Ifs (Caen) - Korian La Chapelle Saint-Mesmin (Orléans) - Korian
Confluent private hospital, Rezé (Nantes) – Vivalto Santé
New acquisitions of 6 healthcare facilities Completed projects which have consolidated our long-term
and 7 nursing homes for €385m relationships: Elsan and Ramsay Santé
Strengthened relationships with our partners: 9 projects under construction (with 1 completion scheduled for Q4)
Ramsay Santé, Korian, Vivalto Santé €48m in completed investments (incl. an estimated €8m in Q4)
€3m in additional rental income (incl. an estimated €0.5m in Q4)
New operators: SGMR and Inicea
7 leases renewed with Elsan, SISIO and Clinipole:
win-win partnerships with >€12m in annual rental income
I 25HEALTHCARE INVESTMENT
LONG-TERM PARTNERSHIPS CREATE VALUE
A development pipeline of nearly €270m, representing close to €15m in additional rental income until 2022
Start of construction on the Start of construction on the Completion of the Planned construction of a
new Mornay post-acute care future post-acute care facility refurbishment of the new Joncs Marins post-acute
facility in Saintes in Lunel Atlantique polyclinic care facility in Le Perreux-sur-
in Saint Herblain Marne
(Loire-Atlantique)
Investment: €10.2m excl. taxes Investment: €11.5m excl. taxes Investment: €8.2m incl. taxes Investment: €21.7m excl. taxes
Operator: Korian Operator: Pôle Santé Lunellois Operator: Elsan
(partnership between Clinipole Operator: Korian
and a public hospital)
Icade Santé has the skill and ability
to develop new assets
I 26HEALTHCARE INVESTMENT
INTERNATIONAL EXPANSION:
WELL ON THE WAY TO OUR 2022 TARGET
Off-plan acquisition Acquisition of Acquisition of 5 nursing Acquisition of
of 7 nursing homes 1 nursing home in Jesolo homes in October 2019 19 long-term care
in October 2018 in February 2019 facilities in November 2022 target
2019 maintained:
Investment: €112m Investment: €12m Investment: €25m Investment: €266m
excl. taxes excl. taxes incl. duties excl. taxes €1.5bn
Operator: Gheron Operator: Universiis Operator: Sereni Orizzonti Operator: EMVIA Living
A strategy which was implemented less than 18 months ago...
~€420m in investments to date
I 27HEALTHCARE INVESTMENT
VERY FAVOURABLE
FINANCING CONDITIONS
Icade Santé issues its first bond
“Investment Grade” rating Benchmark size Long-term Pricing
Fixed rate:
BBB+, 0.94%
stable outlook €500m 10 years Annual coupon:
Standard & Poor’s
0.875%
Very well received by the market
Attractiveness of Icade Santé’s credit quality recognised...
making it easier to finance its expansion plan
Very positive leverage I 28HEALTHCARE INVESTMENT
RECAP
A 2019-2022 STRATEGIC PLAN REAFFIRMED
The Healthcare Investment Division is on track to meet its goals
Objective: to become the leading healthcare REIT in Europe
Leadership position in France further strengthened:
close to €430m invested in 2019,
i.e. 40% of its 2022 investment plan
A buoyant and liquid international market:
close to €420m invested to date/a large number of projects
under study
Liquidity of Icade Santé: 2020/2022
I 29QUAI 8.2, BUILDING E
(Bordeaux, Gironde)
DEVELOPMENTPROPERTY DEVELOPMENT
UNDERLYING MEGATRENDS...
Increasing
importance of
metropolitan Demographic growth,
areas Climate migration flows and
change ageing population
Digitalisation
Growing circular
economy
... impacting our property development business I 31PROPERTY DEVELOPMENT
MARKET INSIGHT: STRONG DEMAND,
INCREASING CONSTRAINTS
A more challenging environment
Intensified competition for land
Sharp rise in construction costs
Decrease in the number of building permits issued and still significant third-party objections
relating to permits
Uncertain outcome of the 2020 municipal elections
New expectation Strong demand buoyed by:
from local authorities: Demographic trends
comprehensive proposal Favourable home loan interest rates
(retail space, attractiveness,
mix of uses) Advantageous government schemes
I 32PROPERTY DEVELOPMENT
ICADE PROMOTION’S MARKET POSITIONING
Decline in revenue in 2019-2020,
1 Our strategic positioning 3 expected to rise again by 2021
A nationwide player across all 3 segments–Residential, Icade’s Property Development revenue
Office and Medical-Social–with proven expertise in Healthcare 22,000
000
Mass-market player 11,500
500
(wide range of solutions from “standard” to “comfort”)
11,000
000
At the forefront of CSR
500
2
-
2018 revenue ranking (2) 2015 2017 2019 2021 2023
Potential revenue (1) of €7.4bn to be generated in the medium term
3,5
3
Growth strategy - Focus on the Office segment
- Strengthened teams
2,5
2
1,5
1 Solid positioning and brand image
0,5
A roadmap centred on growth
0
1 2 3 4 5 Icade 7 8 9 Significant revenue potential in the medium term
Notes: (1) Revenue excl. taxes on a Group share basis incl. backlog, contracts won, stock of units currently for sale and land portfolio
(2) Ranking based on data published in 2018, in €bn I 33PROPERTY DEVELOPMENT
OUTLOOK FOR 2024
2 economic goals 4 business performance indicators
1 Growth in the residential development business 1 Economic revenue: €1.4bn in 2024,
Target sales of c. 6,000 homes including €1,000m for Residential, €350m for Office
and €50m for Public Amenities and Healthcare
2 Growth in the office and medical-social segments 2 Residential and Office representing 25% of revenue
Target of 30% of total sales volume in 2021
3 Return on equity (1) at 15% in 2024
4 Current economic operating margin >7.0% in 2024
Note: (1) ROE (market guidance of 15%) I 34LA CARTOUCHERIE
(Toulouse, Haute-Garonne)
CSRCSR
5 HIGH-PRIORITY ISSUES TO ADDRESS THE PLANET’S
ENVIRONMENTAL AND SOCIAL CHALLENGES
2019 priority: low carbon
Impact on
climate
change
Scarcity of
Preserving resources and
biodiversity Icade’s
circular economy
5 CSR priority
issues
Territorial Employee
cohesion and engagement,
inclusion agility and
collaboration
I 36CSR
STRENGTHENED LOW-CARBON COMMITMENTS
2025 OBJECTIVES
Office Investment
-45% in CO2 intensity between 2015 and 2025
Reviewing the calculation method
meeting the highest standards
Development Defining new targets consistent with
100% of new offices > 5,000 sq.m and an ambitious pathway of “nearly 1.5°C”
33% of new homes with the E+C- label by 2022
Following up the actions taken through
the development of new modelling tools
Healthcare Investment
made available to operational teams
Assisting at least 75% of
healthcare facility operators in optimising
their energy performance starting in 2019
I 37CSR
CONCRETE ACHIEVEMENTS IN 2019 ACROSS OUR THREE BUSINESS LINES
HQE certification BREEAM certification Labels
Office Investment
Factor E – Bordeaux
Excellent Very good
Floor area: 10,922 sq.m
-
Gambetta – Paris, 20th district
Excellent Very good
Floor area: 20,033 sq.m
Healthcare Invest.
Greater Narbonne private hospital
Montredon-des-Corbières Excellent
Elsan group
Atlantique polyclinic
- -
Saint-Herblain Very good
Elsan group
Reinventing Paris 2 – Gobelins train station E2C2 rating from the E+C- label
Development
TBD TBD for 12,300 sq.m of office space
Floor area: 19,800 sq.m
Wood Up – Montpellier BBCA label
Very efficient biosourced building, level 2
Floor area: 10,142 sq.m
I 38CSR
ICADE: INVOLVED IN REGULATORY DISCUSSIONS
Icade’s involvement
in the discussions Icade’s position
Buildings’ energy and carbon performance
Property Investment Divisions: Decree relating to Icade involved in testing the E+C- label with
the energy renovation of office buildings by 2030, Thémis (17th district of Paris), one of the first
published in July 2019 Decree scheduled for Q1 2020 office developments to obtain the label with
Property Development Division: 2020 French Environmental the highest rating (E2C2)
Regulations (basis of the E+C- label) Order scheduled for 2020
Creation of Cycle Up, a digital platform
Law on circular economy dedicated to the reuse of building materials
(50/50 JV with Egis)
New legal framework for the analysis of the use of waste
and reuse materials Law scheduled before the end of 2019 Around 30 tonnes of waste and 200 tonnes
of CO2 emissions avoided, 85% costs savings
Carbon neutrality Developing tools and methods
Methodological framework for the calculation of carbon implementing solutions such as
sequestration by sector (forestry, agriculture, construction, etc.) renovation or reuse
Active involvement, through the Corporate
EU Sustainable Finance Initiative / Taxonomy Forum and EPRA, in responding an EU public
consultation
Establishment of a framework defining green assets Icade is the only French real estate company
and projects Delegated acts scheduled for Q1 2020 to be a member of the Corporate Forum
on Sustainable Finance
I 39CSR
RECAP
Achievements
Low carbon: that make us confident
at the core of our CSR strategy in our ability to fulfil
our commitments
Strong practical involvement in Commitments and initiatives
discussions on new standards on all of our CSR issues:
in order to promote biodiversity, circular economy,
best practices inclusion, air quality, ecomobility, etc.
I 40PORTES DE PARIS BUSINESS PARK
(Saint-Denis, Aubervilliers, Seine-Saint-Denis)
7.
CONCLUSIONCONCLUSION
2019 PRIORITIES ARE BEING MET
Achieved as of 11/25/19
Office development pipeline €1.1bn in disposals
1 70% of the investments made dedicated
and “opportunistic” disposals of core offices to the pipeline
International expansion of the Healthcare Further investments in Italy and
2 Investment Division the first acquisition in Germany (€266m)
Icade Promotion: launch of the large projects 27 new projects in 2019 >€20m
3 won in 2018 Additional potential revenue: €1.5bn
KPIs aligned with a 1.5°C pathway;
4 2019 CSR priority: low carbon clear-cut operational implementation
Continued liability optimisation Icade Santé issues its first bond
5 (LTV ratio, maturity) (€500m, 10-year maturity, coupon of 0.875%)
Note: (1) Under a preliminary agreement I 42CONCLUSION
RIGOROUS FINANCIAL MANAGEMENT OF OUR STRATEGIC PLAN
On the asset Attractive disposals (~4.3% on average)
side +
Capital reallocated Proceeds reinvested in offices (>6%)… and healthcare assets (>5%)
to higher-yielding =
assets Disciplined use of our capital
On the liability Optimised timing of bond repurchases (not followed by a new issue) (€160m)
side
Strong efforts to optimise Icade Santé’s financing
Financing
optimisation Conservative hedging policy (99% (1) of debt hedged at the end of 2019)
Cash Anticipated cash position as of December 31, 2019: > €600m
Remain liquid €1.7bn of undrawn credit lines
and opportunistic Financial capacity to invest intact
Financial policy in line
Notes: (1) Projected estimate at the end of the year LTV ratio ~40% I 43CONCLUSION
AFTER THE PLAN’S SUCCESSFUL FIRST YEAR,
ICADE IS WELL POSITIONED TO ACHIEVE
ITS 2022 OBJECTIVES
Around €5bn
of investments over 4 years Active asset rotation:
€1.2 bn volume of disposals doubled
with c. 25% invested to date
€1.1bn i.e. c. 40% of the targets
Healthcare Investment
€2.5bn in net investments
>30% of the objectives met to date 2019–2022 NCCF CAGR:
c. +4.5%
European presence (1)
2 of our 3 target countries
already added to the portfolio
Note: (1) Excluding France I 44CONCLUSION
2019 GUIDANCE RAISED
Initial guidance New guidance
NCCF (in € per share) As a reminder, impact of 2019 disposals: c. -4%
Stable NCCF (in € per share)
excluding the impact
of 2019 disposals Stable including
the impact of 2019 disposals
2019 dividend: c. +4.5%
(payout ratio of 90% and distribution of part of the gains on disposals)
2019 Full Year Results: Monday, February 17, 2020
I 45APPENDICES
APPENDICES – THE FRENCH OFFICE MARKET

  ATTRACTIVENESS OF THE PROPERTY INVESTMENT MARKET
  A dynamic property investment market (excluding residential)                                                                                            Converging yields
  40                                                                                                                                                        8%
                                                                                                              35
                                                                                                      34     expected                                       7%
  35
                   31                                                                  32

  30                                                                 28                       27
                                                                                                                                                            6%
       26                                                                                                                                                                     Avg. outside
                                                                                                      14,3                                                  5%                Paris region 4.6%
  25
                                                                                                                                                                              Logistics 4.2%
                                                              19                                                                                            4%                Inner Ring 3.8%
  20
                                                                                                               9,6                                                            Lyon 3.7%
                                                                                                       6,1                                                  3%                Paris CBD 3%
  15
                                                                                                                                                            2%
                                  9
  10

                                                                                                                        Source: BNP Paribas Real Estate
                                                                                                       9,1     9,5
                                                                                                                                                            1%
   5
                                                                                                       4,6     4,7                                          0%                10Y gov. bond: -0.3%
   0
       2006        2007   2008   2009   2010   2011    2012   2013   2014       2015   2016   2017    2018    2019                                          -1%

              T1
              Q1            T2
                            Q2          T3
                                        Q3            T4
                                                      Q4         Prévisionnel
                                                                 Forecast                Volume moy.
                                                                                         2014-2018     2014-2018
                                                                                                   average volume

                                        Highly attractive property yields against a background of low interest rates
                                        A very active French market in 2019 as the supply of core products
                                        meets international investors’ demand for safer investments
                                                                                                                                                                                                     I 47
APPENDICES – THE OFFICE MARKET – MARKET UPDATE
GROWING METROPOLITAN AREAS OUTSIDE THE PARIS REGION
Leasing activity outside the Paris region Dynamic Deeper markets
resilient to the slowdown prime rents thanks to high-quality supply
3,0
Prime rent Change from Leasing activity vs. 5-year % of vacant
Take-up (rolling 12 months) in millions of sq.m
in mid-2019 the end of 2016 (rolling 12M to end of Q3) average space that is new
2,5
Paris region
Paris CBD 880 +7% 454,000 +2% 20%
2,0
Inner Ring 390 +5% 486,000 +50% 14%
1,5
Lyon 325 +10% 414,000 +46% 30% (1)
1,0 Marseille 310 +17% 127,000 -4% 8% (1)
0,5
6 largest cities outside Paris Bordeaux 260 +13% 160,000 (1) +28% 28% (1)
Toulouse 222 +11% 157,000 +4% 12% (1)
0,0
Lille 240 +9% 304,000 (1) +44% 23% (1)
Note: (1) In Q2
Rents boosted by the increasing importance of business districts
such as Part-Dieu or Euro-Méditerranée
Sources: BNPPRE / JLL
Diversification benefits the Office Investment business I 48APPENDICES – OFFICE INVESTMENT
MARKET OPPORTUNITIES OUTSIDE PARIS CBD
Western
Paris CBD La Défense Crescent Inner Ring Outer Ring Icade’s Office Investment portfolio
Physical vacancy rate 1.3% ▼ 4.9% ≈ 10.0% ▼ 6.3% ▼ 5.4% ≈
in the Paris region as of September 30, 2019
(end of Sept. 2019 and YoY change)
Take-up 314,000 sq.m 96,000 sq.m 336,000 sq.m 341,000 sq.m 168,000 sq.m
(9M 2019 and vs. same period in 2018) (-3%) (-21%) (-28%) (+31%) (-37%) SAINT-DENIS
GENEVILLIERS 62,330 sq.m
23,520 sq.m
Transactions > 5,000 sq.m 22% 29% 27% 56% 25% MAUVIN BUSINESS PARK
PORTES DE PARIS
(% 9M 2019) LA DÉFENSE-NANTERRE
BUSINESS PARK 21,980 sq.m
279,180 sq.m
334,240 sq.m
Prime rent PONT DE FLANDRE
(€/sq.m/year excl. taxes and service charges, €926/sq.m ▲ €550/sq.m ≈ €600/sq.m ▼ €430/sq.m ≈ €300/sq.m ≈ La Défense MILLÉNAIRE 90,690 sq.m
end of Sept. 2019 and YoY change) 144,670 sq.m
NEUILLY-SUR-SEINE
Paris CBD
Average rent for new space
€737/sq.m ▲ €471/sq.m ≈ €392/sq.m ▲ €334/sq.m ▲ €215/sq.m ▲ RUEIL-MALMAISON 3,600 sq.m PARIS, 8th DISTRICT PARIS, 20th DISTRICT
(€/sq.m/year excl. taxes and service charges,
21,730 sq.m 9,880 sq.m 20,030 sq.m
end of Sept. 2019 and YoY change)
Price Western Crescent PARIS, 15th DISTRICT
(€ incl. duties/sq.m, end of Sept. 2019 €16,996/sq.m ▲ €8,963/sq.m ▲ €5,517/sq.m ≈ €4,827/sq.m ▲ €2,913/sq.m▲ 33,400 sq.m Rest of
and YoY change)
Paris
BOULOGNE-BILLANCOURT
4,980 sq.m Inner Ring
Supply under construction
to be completed within 3 years GENTILLY
125,677 sq.m ▲ 398,963 sq.m ▲ 228,189 sq.m ▼ 328,380 sq.m ▲ 130,851 sq.m ▲ ISSY-LES-MOULINEAUX
13,710 sq.m
(in sq.m at the end of Sept. 2019 18,270 sq.m
and YoY change)
VILLEJUIF
29,770 sq.m
Prime yields 3.0% ≈ 4.0% ≈ 3.25% ≈ 3.80% ≈ 5.15% ▼
(end of Sept. 2019 and YoY change) Outer Ring
Office investments €1,588m €2,458m €2,043m €1,998m €1,040m ORLY-RUNGIS BUSINESS PARK
(9M 2019 and vs. same period in 2018) (-47%) (x4.8) (-26%) (+48%) (x1.2) 388,380 sq.m
Very limited available supply in Paris
Sources: ImmoStat, JLL
Demand from large occupiers shifting faster to other office markets
Value creation opportunities in these markets
for large new or refurbished units I 49APPENDICES – THE OFFICE MARKET – MARKET UPDATE
NANTERRE AND LA DÉFENSE, THE FIRST AREAS
TO BENEFIT FROM MAJOR TRANSPORT INFRASTRUCTURE
Nanterre—a deep, highly Already the best option Eole, the 1st large-scale public transport project
segmented office market in terms of accessibility soon to be completed in the Paris region
Office stock in the Hauts-de-Seine department Number of people living less
(Q1 2019, millions of sq.m) than 45 minutes away in 2018
La Défense
Nanterre 1,4
3,3
incl. 30% for
Les Terrasses de Nanterre
3 new stations
Porte Maillot, La Défense
Extension of
to the west
and Nanterre la Folie
Boulogne-Billancourt 1,2 The only area outside
Paris accessible to a
Issy-les-Moulineaux 1,1
workforce numbering
> 3 million 2022
1st major transport infrastructure
Levallois-Perret 1,0 project to be completed
after the northern section of Line 14 (2020/2021)
Rueil-Malmaison 0,8
Neuilly-sur-Seine 0,6 A workforce of over 250,000
will live less than 45 min away
starting in 2024 thanks to the EOLE
Source: MBE Conseil according to CBRE and ORIE Source: Price Hubble
extension 55 km to the west
A well-developed area supported by the completion
of a large-scale infrastructure project I 50APPENDICES – THE OFFICE MARKET – MARKET UPDATE
LES TERRASSES DE NANTERRE: AN INCREASINGLY ATTRACTIVE AREA
RIGHT NEXT TO LA DÉFENSE
A key market in the Peri-Défense area Attractive rents compared to Paris and La Défense
Take-up in Nanterre since 2001 Average headline rent for transactions for new or refurbished space
< 5 000 sq.m > 5 000 sq.m Nanterre's % of Peri-Défense's leasing activity 750
Largest occupiers in Nanterre (dark grey = Terrasses de Nanterre) Paris CBD
TECHNIP
700
VINCI +
Department Council
GROUPAMA
BNP + AXA
+ FAURECIA
650
180
Hauts-de-Seine
100%
-35%
EDF + SFR
160 90% 600
SG + TOTAL
80%
140 550
FRANFINANCE
120 61% 70%
AXA
56% 500 Rest of Paris
MANPOWER
60%
VEOLIA
100 46% La Défense
-22%
44% 450
41%
HSBC
50%
BNP ≈ 70k
-26%
80
34%
-20%
40% Terrasses de Nanterre
-26%
sq.m/year 400
60
VINCI
23% 22% 30%
Peri-Défense
40 20%
350
20 Nanterre – other areas
10%
300
0 0%
250
200
Sources: ImmoStat and MBE Conseil for Nanterre
Large corporate occupiers have steadily moved into the area
Acceleration since 2017 as new transport links are scheduled I 51APPENDICES – THE OFFICE MARKET – MARKET UPDATE
ICADE’S PORTFOLIO IN LA DÉFENSE
Q3 2019 NANTERRE
data* LA DÉFENSE PRÉFECTURE TOTAL
Number of
assets
Leasable floor
area
(sq.m)
PB5 TOWER INITIALE TOWER IN PUTEAUX (1)(2)
Headline Architect: Balladur Architects: Mailly –Depussé –Prouvé
rental Leasable floor area: 30,209 sq.m Architecture firm: Valode & Pistre
income (€m) 276 parking spaces Leasable floor area: 31,122 sq.m
Main tenants: PwC, Enedis, 337 parking spaces
CESI, Ubiqus, Mov’in Main tenants: Tarkett, DS SMITH,
Services: eating area, cafeteria, SACEM
concierge service, fitness centre Services: eating area, cafeteria,
WALB Label: W ired concierge service, auditorium
Environmental certification:
NF HQE Exploitation
Physical
occupancy
rate EQHO TOWER IN LA DÉFENSE
Architects: Willerval - Urquijo
Refurbishment architect: Hubert & Roy
Leasable floor area: 78,974 sq.m
Financial
1,110 parking spaces
occupancy Main tenants: KPMG, Air Liquide,
rate Banque de France
Services: 3 eating areas, cafeteria,
1,300-sq.m fitness centre,concierge
Fair value service, 330-seat auditorium
asof Environmental certifications:
06/30/2019 BBC Renovation - BREEAM Very Good -
NF HQE Exploitation & BREEAM In-Use
Sale of a 49.0% interest in the
company holding the Eqho Tower
(79,000 sq.m). An option to acquire
the remaining 51% by the end of 2020.
I 52APPENDICES – THE OFFICE MARKET – MARKET UPDATE
LYON—A RECORD-BREAKING, FLUID MARKET
414k sq.m Leasing activity in Lyon
taken up in the rolling 12 months
to the end of Q3 2019
after a record 2018 with 310k sq.m
and 280k sq.m on average over 5 years
A fluid market
% of 1-year supply that is new
49%
€192
/sq.m
Markets that €195
/sq.m
complement each other
Gerland, Vaise and Carré de Soie:
alternatives to tight supply
in Confluence and La Part-Dieu €300
/sq.m
3.7%
€325
/sq.m
Attractive market
depth €220
Vacancy rate at 4%
/sq.m
6.6 million sq.m
in continuous decline since mid-2016 Average annual take-up
including second-hand supply over the last 5 years
(thousands of sq.m)
No. 1 destination
13.7 Prime
rent
for office investments Prime
yield
outside the Paris region
€760m/year over 2013-2018
Deep, self-sustaining occupier demand
supporting speculative developments
Source: CBRE Research (Le grand pari des régions – October 2019) I 53APPENDICES – THE OFFICE MARKET – MARKET UPDATE
EUROMÉDITERRANÉE, IN THE HEART OF THE MARSEILLE OFFICE MARKET
Leasing activity in Marseille 700,000 sq.m of offices
in Euroméditerranée, which is recent
compared to Marseille’s overall ageing
property stock of 2.4 million sq.m ≈126k sq.m taken up/year
on average over 2013-2018
in the metropolitan area
A stable market for small-
3rd largest business district and medium-sized units,
mainly driven by EuroMed
Extension in France after La Défense and Part-Dieu
€300
/sq.m A key driver of the metropolitan
Initial area area’s development
Rent of €310/sq.m in La Marseillaise,
€180 a high-rise building
/sq.m 4.6%
High % of pre-let space
€240 in EuroMed 1
/sq.m
1-year new-build supply
Average annual take-up €212m represents only 17%
over the last 2 years of the vacant stock in Marseille
(thousands of sq.m)
13.5 Prime
in office assets acquired
rent in Aix-Marseille, per year over 2013-2018
Prime
yield
>70% in Euroméditerranée
A renowned business district
Sources: CBRE Research (Le grand pari des régions – Oct. 2019) | with limited new supply in EuroMed 1
C&W (Euroméditerranée study – Dec. 2018) I 54APPENDICES – DEVELOPMENT PIPELINE FOR THE OFFICE INVESTMENT DIVI SION
PROJECTS IN THE PIPELINE AS OF 09/30/2019
Remaining
Estimated Rental to be invested
Type Property date of Floor area income Cost (2) > Q3 2019
(1)
Project name Location of works type completion (sq.m) (€m) YoC (€m) (€m) Pre-let
B007 Flandre Construction Office Q4 2019 8,540 39 7 100%
EKO ACTIVE Marseille Construction Office Q4 2019 8,300 30 4 34%
MONACO Rungis Refurbishment Hotel Q4 2019 4,628 19 3 100%
19 QUAI RIVE NEUVE Marseille Redevelopment Office Q1 2020 3,112 15 4 100%
70%
LATÉCOÈRE Toulouse Construction Office Q2 2020 12,717 41 17 100%
PARK VIEW Lyon Redevelopment Office Q3 2020 22,980 81 36 0%
ORIGINE Nanterre Redevelopment Office Q4 2020 65,000 447 156 78%
FONTANOT Nanterre Refurbishment Office Q4 2020 16,350 108 31 100%
B034 Flandre Refurbishment Hotel Q1 2021 4,519 30 19 100%
FRESK South Loop Refurbishment Office Q1 2021 20,542 219 55.2 0%
PÔLE NUMÉRIQUE Portes de Paris Construction Office Q3 2022 9,400 45 40 0%
ÎLOT B32 Millénaire Construction Office Q4 2023 27,695 130 102 0%
ÎLOT B2 Millénaire Construction Office Q4 2023 40,582 190 150 0%
TOTAL PROJECTS STARTED 244,365 88.7 6.4% 1,395 624 40%
TOTAL PROJECTS NOT COMMITTED 144,929 55.7 6.2% 901 728
TOTAL PIPELINE 389,294 144.5 6.3% 2,296 1,352
On a 100% basis
Notes: (1) Fair value-based YoC = headline rental income / cost of the project. This cost includes the fair value of the asset at project start,
cost of works (incl. expenses, fees and tenant improvements) and carrying costs
(2) Includes the fair value of the asset at project start, cost of works (incl. expenses, fees and tenant improvements) and carrying costs I 55APPENDICES – HEALTHCARE INVESTMENT
SOLID FUNDAMENTALS FOR HEALTHCARE REAL ESTATE
Current health expenditure growing steadily in France
(consumption of care and medical goods (CSBM) + other costs)
7% 6%
Health expenditure rising constantly
5%
4%
Explanatory factors
4% 4% 4%
Ageing population 3%
3% 2%
2% 2% 2% 2%
2%
Improved technologies and increased requirements 1%
Source: DREES
Increase in long-term medical conditions 2002 2003 2004 2005 2006 2007 2008 2009 2010 2011 2012 2013 2014 2015 2016 2017
Current health expenditure (current €bn) Annual growth rate (%)
A highly regulated sector
Health expenditure as a % of GDP generally increasing
17,2%
80% government-funded in France
2002 2007 2012 2017
Efforts to reduce the national health insurance deficit 14,0% 11,5% 11,3%
10,1% 10,0% 9,6%
8,9% 8,8%
10,0% 10,1%
Reform to the funding of health facilities 8,0% 8,3% 7,9%
6,8% 6,6%
Source: OECD
USA France Germany Netherlands Belgium Italy Spain United
Kingdom
A less cyclical industry
growing faster than GDP I 56APPENDICES – HEALTHCARE INVESTMENT
CONDITIONS ARE FAVOURABLE TO HALT THE DECLINE OF MEDICAL FEES
Average private medical fees since 2008 (private acute care)
Social security in surplus for the 1st time since 2001 (€0.5bn)
Strong recovery of the “sickness” division (deficit of €0.8bn vs. €4.9bn in 2017)
+2.5%: sharper increase in the ONDAM 0,8%
0,5%
0.5% incl. 0.3 pp
from quality incentive
healthcare spending limit (1) 0,2%
Extra increase of +0.2 pp for 2019 0,0%
-0,1%
2.3% until 2022 vs. 2.1% on average for 2014-2018 -0,2% -0,2% -0,2%
Marked rise for healthcare and medical-social facilities
Medical fees grew slower than expected -1,4%
in 2018 with +1.4% vs. prediction of +2.6%, allowing for an additional, Change in fees
targeted allocation of €300m for 2018 Prudential coefficient fully applied
-2,0%
Actual change after redistribution
-2,3%
+0.5% in private acute care fees in 2019
+0.2-pp increase, +0.3 pp relating to the distribution of €300m in IFAQ incentives (2) 2008 2009 2010 2011 2012 2013 2014 2015 2016 2017 2018 2019
1/3 of eligible facilities received the €50m in 2018 IFAQ
Prudential coefficient maintained at 0.7%
for all public and private facilities. PAC and mental health care fees published mid-April
In 6 years, only 1 major deduction applied in 2016 PAC: +0.1% for a total funding allocation up +2%
Mental health: +0.7% for a total funding allocation up +2.7%
Sources: Hospimedia / Les Échos / French Official Journal
Notes: (1) National Healthcare Spending Limit (ONDAM)
(2) Quality incentive (IFAQ) – criteria currently being revised: indicators included for 2019 and calculation methods for the allocation to be published in May I 57APPENDICES – HEALTHCARE INVESTMENT
ATTRACTIVE YIELDS
An attractive risk premium in France Prime yield compression stronger in Germany
Stable prime yields in H1 2019 in healthcare Compression of about 250 bps in 6 years
Attractive yield with a risk premium of over 125 bps with the German 10-year gov. bond well below its French counterpart
compared to Paris CBD offices Italy and Spain still have prime yields of at least 5.5%
Prime yields (at period end) Nursing home prime yields (at year end)
7%
Nursing home
6% 2012 prime yield 2018
5% Prime acute care 5% 7.5 - 8%
PAC/mental health 4.50%
4% Prime nursing homes 4.25%
7 - 7.5%
6.5 - 7%
3% Paris CBD offices 3.0%
6 - 6.5%
2%
5.5 - 6%
1%
5 - 5.5%
0% 10-year gov. bond 0.0%
2008 2009 2010 2011 2012 2013 2014 2015 2016 2017 2018 H1 4.5 - 5%
2019
4 - 4.5%
I 58APPENDICES – HEALTHCARE INVESTMENT
A STEADILY GROWING DEVELOPMENT PIPELINE
Number of Total Remaining to
beds and investment (1) be invested Yield on
Type of works Operator City places (€m) (€m) cost (2) Completion Pre-let
PROJECTS STARTED 2,288 254.8 205.5 5.7% 100%
Italy (Piedmont,
7 nursing homes Development Gheron Veneto, 1,020 113.0 113.0 2020-2021 100%
Lombardy)
Greater Narbonne Montredon-des-
private hospital Development Elsan Corbières 283 47.8 28.0 2020 100%
Joncs Marins Le Perreux-sur-
PAC facility Development Korian Marne 136 21.9 21.9 2021 100%
Atlantique Ramsay Santé
polyclinic Extension (formerly Capio) Puilboreau 100 20.0 2.1 2019 100%
Le Parc polyclinic Extension Elsan Caen 288 19.6 17.4 2021 100%
Saint-Charles Extension /
private hospital Renovation Sisio La Roche-sur-Yon 210 14.1 13.5 2022 100%
Mornay PAC facility Development Korian Saintes 82 10.2 7.6 2021 100%
Saint-Herblain
polyclinic (Bromélia) Extension Elsan Saint-Herblain 169 8.2 2.1 2019 100%
Notes: (1) Cost of project as approved by Icade’s governance bodies. This cost includes the fair value of land, cost of works and carrying costs
(2) YoC = headline rental income / cost of the project (as defined in (1)) I 59APPENDICES – OFFICE INVESTMENT
PORTFOLIO MIX Office Investment
Offices
Healthcare Investment
France
Business parks Europe
Office and Healthcare Investment Other
(on a Group share basis)
(in €m)
Product mix as of Product mix as of Product mix as of
12/31/2018 12/31/2019 12/31/2022
Healthcare Healthcare Healthcare
Investment Investment Investment
23% 26% 30%
2% 6%
23%
24%
24%
3% Office Office Office
3% 55% 49%
Investment Investment 2% Investment
15% 59% 77% 74% 70%
16% 19%
Healthcare to represent 30% of the portfolio by the end of 2022
International assets to represent 21% of the Healthcare portfolio
by the end of 2022
I 60PROPERTY DEVELOPMENT
FURTHER DOWNTURN IN NEW HOUSING SUPPLY
New housing supply and new housing orders in the rolling 12 months to the end of Q3 2019
-0.3%
Stock of homes 140 000 130,283 129,330 6
available for sale
at quarter end 129,713
120 000 107,739 5
100 000
4.1 -17.3%
New housing supply
(rolling 12 months) 3.6 4
80 000
3
Housing orders 60 000
(rolling 12 months) 2
40 000 Stock of homes available for sale 118,085 -11.4% 104,576
1
20 000
Average time
on market
for apartments 0 0
at quarter end (in Q1 Q2 Q3 Q4 Q1 Q2 Q3 Q4 Q1 Q2 Q3 Q4 Q1 Q2 Q3 Q4 Q1 Q2 Q3 Q4 Q1 Q2 Q3
number of quarters) 2014 2015 2016 2017 2018 2019
Following historical highs in 2017 and 2018, decline in new housing supply
since December 2018 (-17.3%) and orders
Source: ECLN But time on market still very short I 61PROPERTY DEVELOPMENT
SALE PRICES AND CONSTRUCTION COSTS: STRONG CORRELATION
Indices of construction costs and prices Apartment sale price (1)
in Q1 2019 In €/sq.m
Index rebased to 100 in 2015
110,0
4 300 4,259
105,0
4 200
100,0
4 100
4,056
95,0
4 000
90,0
3 900
85,0
3 800
80,0
3 700
75,0
3 600
70,0 3 500
Producer Cost Index for Construction (ICP-F)
Construction Cost Index (ICC)
Housing Maintenance and Improvement Work Index (IPEA)
Volume peaks in 2017 and 2018 have resulted Prices strongly up (+5.0% for multi-family housing
in significantly higher construction costs over the past 3 years: +8% and +5.9% for single-family housing) vs. Q2 2018
Construction cost increase partly offset by rising prices
against a backdrop of strong demand
Source: ECLN
Note: (1) National quarterly data I 62PROPERTY DEVELOPMENT
MEASURES IMPLEMENTED AS PART OF THE ROADMAP
Operational Evolving products Marketing Brand policy,
organisation and services strategy Innovation and CSR
An evolving organisational Residential: Increasingly digital and BtoB & BtoC: increase in
structure to be closer to local multi-channel Icade’s brand awareness
Diversified sources of through a dedicated
needs and divisions land/customers Continuation of the “data innovation policy for our
Creation of new management Office: driven” marketing policy assets
positions Development of
Capitalising on expertise, Distinctive CSR positioning:
1 Deputy CEO in charge of innovation and partnerships digital sales tools A key player in the
Offices in the Paris region Increased internal sales development of
Extensive upgrading of existing low-carbon cities
1 Deputy CEO in charge of properties through the opening of
Residential in the Paris region Icade Stores
2 Deputy CEOs outside the
… in line with our need Development of a “digital
Paris region to remain competitive: marketplace” platform for
Further implementation of the property advisors
procurement policy and
dedicated tools (BIM, etc.)
I 63PROPERTY DEVELOPMENT
OFFICE DEVELOPMENT: BACKLOG (1)
Q3 2019 Q4 2019 Q1 2020 Q2 2020 Q3 2020 Q1 2021 Q2 2021
Toulouse Villejuif Toulouse Miramont de Guyenne Toulouse Saintes Livry-Gargan
PAC FACILITY LEBON LAMARTINE DAURAT NURSING HOME LATECOERE PAC FACILITY PAC FACILITY
5,600 sq.m 18,000 sq.m 7,034 sq.m 5,900 sq.m 12,505 sq.m 4,702 sq.m 8,582 sq.m
Vitrolles Chambéry Lyon
BEEHIVE St-Benoît Nîmes
KAESER BIS PÔLE SPAP
4,980 sq.m 5,286 sq.m 7,440 sq.m 5,729 sq.m
Canohes
NURSING HOME
5,803 sq.m
Note: (1) Transactions completed or currently under a preliminary sales agreement I 64PROPERTY DEVELOPMENT
POTENTIAL REVENUE OF €7.4BN IN THE MEDIUM TERM
€5.4bn for the residential segment: €2.0bn for the office segment
20,000 homes (1) and 450,000 sq.m (1)
Backlog
Projects won Backlog €0.2bn
or other options €1.1bn
€1.6bn
> 6,500 units Land portfolio
Public, Office €0.5bn
Residential Stock of and Healthcare 167,000 sq.m,
units for sale
Development Group share
€5.4bn €0.7bn
> 3,400 units Projects won €2.0bn
or other options
€1.3bn
283,000 sq.m
Land portfolio
€2.0bn
> 10,000 units
Data excluding taxes, Group share. As of September 30, 2019
Note : (1) Excl. backlog I 65CSR
OFFICE INVESTMENT DIVISION ALIGNED
WITH A “NEARLY 1.5°C” PATHWAY
Target: -45% in CO2 intensity between 2015 and 2025
2016 Carbon neutrality target set in 2019
(in kg CO2/sq.m/year)
25
An attainable pathway
20 by means of a robust
organisation,
15 modelling tools and
Icade
2°C pathway, worldwide identified methods
commercial real estate sector
10 -45% vs. 2015 -50% by 2050 vs. 2015
5 2°C pathway, building sector, France
-83% by 2050 vs. 2015
1.5°C pathway, building sector, France
0
Target: 0 kg CO2e/sq.m in 2050
2015 2020 2025 2030 2035 2040 2045 2050
I 66CSR
MAIN CARBON REDUCTION METHODS IDENTIFIED
Office Investment Development
Disposals
and Low-carbon Reuse Parking Major
Renovation acquisitions Development materials optimisation renovation
pipeline
Methods
Energy Changes
in national Improved Improved Energy
switch emission emission Architecture
by Icade factor performance switch
factors
Controlled carbon Partially controlled or uncontrolled Grey energy Operational energy
reduction method carbon reduction method
Objectives
Residential Office
-45% in carbon intensity between 2015 and 2025 33% of new homes 100% of new offices > 5,000 sq.m
with the E+C- label by 2022 with the E+C- label by 2022
Example: €8.5m invested in LEDification and renewable energy
(financed by the Green Bond) I 67CSR
A POLICY RECOGNISED BY NON-FINANCIAL RATING AGENCIES
Sector leader of listed
diversified companies
in Western Europe 2 Gold Awards for the quality
Score of 84/100 of financial and non-financial reporting
A- rating
In the top 18% of leading
companies worldwide
In the top 6% of the highest scoring
listed companies in the real estate Ranks 3rd out of 81
In the top 5% of the Score of AA investment sector worldwide listed real estate companies in Europe
highest scoring companies. (on a scale ranging from CCC to AAA) and 4th out of 292 companies worldwide
“Prime” status
3rd place in the ranking of women’s representation Score of 99/100
in the governing bodies of SBF 120 companies on the gender equality index
“Paris Climate Action” charter
at the highest “Platinum” level
Score of 25/25
Atop the world’s top 10 ranking Score of b for the quality of the Green Bond
for the quality of Green Bond reporting
I 68APPENDICES – INVESTMENT
OFFICE AND HEALTHCARE PORTFOLIO:
GROWTH AND VALUE CREATION (GROUP SHARE)
(in €m)
+3.7%
on a reported basis 11,712
220
162
11,291 61
(22)
12/31/2018 Disposals (1) Acquisitions (2) Construction work (3) Like-for-like change 06/30/2019
and other (4)
LIKE-FOR-LIKE INCREASE IN PORTFOLIO VALUE: + 2.0%
ON A 100% BASIS, PORTFOLIO VALUE STOOD AT €13,844m (5) AS OF 06/30/2019 (VS. €13,397m AS OF 12/31/2018)
Notes: (1) Fair value as of 12/31/18 of assets sold during the period
(2) Includes the payments made in H1 2019 (including duties and fees) as part of ongoing off-plan acquisitions
(3) Includes, among others, maintenance works, tenant improvements, finance costs, pre-letting works and the change in Icade’s stake in Icade Santé.
(4) After restatement of transfer duties and fees, changes in the values of assets acquired during the financial year, works to properties sold and changes in the values of assets treated as financial receivables (PPP)
(5) Including assets consolidated using the equity method: Bellini tower (33%) and Bassin Nord – Millénaire shopping centre (50%) I 69You can also read