Towards 2021: Examining Alternative Growth Scenarios for Bangladesh
←
→
Page content transcription
If your browser does not render page correctly, please read the page content below
Bangladesh Development Studies
Vol. XXXVIII, March 2015, No. 1

         Towards 2021: Examining Alternative
           Growth Scenarios for Bangladesh
                                    ONIL BANERJEE*
                                  MOOGDHO M. MAHZAB**
                                   M. ASADUZZAMAN***

    Bangladesh aims to reach the middle income country status by 2021. This
    paper uses a dynamic computable general equilibrium model to evaluate the
    key drivers of growth including population, factor productivity growth and
    climate change. The results show that small changes in population and
    productivity growth have a greater impact than climate change and, in a
    business as usual scenario, 2021 targets would be reached in 2031. For
    reaching the middle-income country status by 2021, the country requires a 3.5
    per cent productivity growth yielding a GDP and GDP growth of $366.1
    billion and nearly 12 per cent respectively. It is also estimated that reducing
    the impact of climate change by 25 per cent would save $5.06 million
    annually.
Keywords:Bangladesh, Middle Income, Total Factor Productivity, Climate
           Change, Dynamic Computable General Equilibrium Model
JEL Classification: C68, D24, N5

                                   I. INTRODUCTION
    The Government of Bangladesh aspires to offer its people a comparable
standard of living to that of middle and high-income countries by 2021, 50 years
after having achieved Independence (Planning Commission 2010). The
Perspective Plan 2010–2021 aims to reduce the number of people living below
the poverty line to 25 million or to 15 per cent of the population. The government
is committed to raising per capita income to US$2,000 (Planning Comminssion
2010). Bangladesh’s population is increasing at an average annual growth rate of

*
 Corresponding author, formerly with CSIRO Ecosystem Sciences and CSIRO
custainable Agriculture Flagship, Dutton Park, Queensland, Australia; currently at the
Inter-American Development Bank, 1300 New York Avenue NW, Washington D.C.,
20577, USA.
**
   Research Associate, Bangladesh Institute of Development Studies (BIDS).
***
    Professorial Fellow, Bangladesh Institute of Development Studies (BIDS).
78 Bangladesh Development Studies
1.29 per cent and is projected to reach 247 million by 2050 (BIDS 2013b). Gross
domestic product (GDP) growth is estimated at 7.9 per cent (BIDS 2013a). This
projection is encouraging since the World Bank estimated that Bangladesh would
need to grow between 7 per cent and 8 per cent per year if it is to achieve its
development ambitions (World Bank 2011).
There are many variables that can affect Bangladesh’s progress towards the
2021 vision. Primary among these variables are population growth, total factor
productivity (TFP) growth and climate change. In this paper, we develop a
dynamic computable general equilibrium (DCGE) model to evaluate the impact
of these drivers on Bangladesh’s achievement of middle income status and a per
capita income of US$2,000.
DCGE models provide advantages over other analytical frameworks offering
a consistent theoretical lens through which socioeconomic and environmental
trade-offs may be analysed. This class of models have a high degree of
explanatory power where inter-sectoral linkages and resource constraints are
prevalent (Banerjee and Alavalapati 2010, 2014). Static or one-period models
provide information on the direction of effects and orders of magnitude of policy
or environmental shocks in the short or long-run while dynamic models enable a
more precise specification of time, illustrating economic transition paths and both
short and long-term costs and gains (Cattaneo 1999).
In this paper, a forecast baseline was developed projecting Bangladesh’s
economy to the year 2050 in the absence of any exogenous shocks. Compared
against this forecast, seven scenarios were evaluated: two population growth
scenarios, two agricultural total factor productivity growth scenarios and three
climate change scenarios. There are many other important variables that may
have a significant impact on Bangladesh’s economy in the long run. However,
the purpose of this paper is to analyse the potential impact of climate change in
the long run. Other studies have shown that climate change may be a major
concern for Bangladesh’s development and food security, given its potential
agriculture sector impacts (Banerjee et al., in press, Banerjee et al. 2014, Yu et
al. 2010).
Agricultural production technology for major agricultural products in
Bangladesh has changed significantly, particularly from the late 1980s onward.
Due to technological progress, production and efficiency have risen markedly.
While economic development and industrialisation have reduced agriculture’s
share of GDP in recent years, down to 17 per cent in 2013 (Ministry of Finance
2014), agriculture is still the largest employer, accounting for 55 per cent of theBanerjee, Mahzab & Asaduzzaman: Towards 2021 79
labour force (Bangladesh Bureau of Statistics 2012). In addition, with food self-
sufficiency a policy imperative for the Government of Bangladesh, it is critical to
understand how climate change may impact the agricultural sector and the
economy in the long run. Given the importance of TFP growth in driving
economic performance, additional analyses were conducted around the
sensitivity of outcomes to variability of agricultural and economy-wide TFP
growth.
In the first two scenarios, a low population growth estimate and a constant
fertility high population growth estimate were considered. The third and fourth
scenarios evaluated the impact of slower and faster growth in agricultural TFP.
The fifth, sixth and seventh scenarios imposed natural climate variability and
climate change on the model. The differences in macroeconomic, sectoral and
household-level indicators between the forecast baseline and each scenario
reflect the effect of each exogenous shock on Bangladesh’s economy. How these
impacts would affect the achievement of Vision 2021 was considered for each
scenario.
This paper is organised as follows. Following this introduction, section II
describes the methods and section III develops the forecast baseline and
scenarios. Section IV presents the results and their implications for meeting
Vision 2021. The final section concludes the paper with a discussion of the key
messages and trends arising from the analysis and emphasises the policy
implications of the findings.
II. METHODS
The model developed here is based on the International Food Policy
Research Institute’s (IFPRI) Standard CGE Model and Robinson and Thurlow’s
dynamic extension to the model (Robinson and Thurlow 2004). This DCGE
model is implemented in the General Algebraic Modelling System (GAMS) and
solved as a mixed complimentary problem using the PATH solver. The model is
documented in detail in Banerjee et al. (2103), Lofgren et al. (2002) and
Robinson and Thurlow (2004).
The DCGE model describes the behaviour of agents in their economic
environment; it is a system of equations describing the utility maximising
behaviour of consumers, profit maximising behaviour of producers, and the
equilibrium conditions and constraints imposed by the macroeconomic
environment. Agent behaviour is represented by linear and non-linear first order80 Bangladesh Development Studies
optimality conditions and the economic environment is described as a series of
equilibrium constraints for factors, commodities, savings and investment, the
government, and rest of the world accounts (Lofgren et al. 2002).
There are three macroeconomic balances in the model: the government
current account balance, the current account of the balance of payments and the
savings and investment balance. Decisions regarding macroeconomic balances
and factor mobility are known as closure rules and are necessary to maintain
balance in the economic environment and in factor supply and demand. The
choice of closure rules may have a significant impact on model behaviour
(Dewatripont and Michel 1987).
For the government closure, tax rates are fixed and therefore government
savings, the difference between current government revenues and expenditures,
are a flexible residual. A flexible real exchange rate is chosen for the current
account of the balance of payments closure which fixes the current account
deficit. With transfers between the rest of the world and domestic institutions
fixed, the trade balance is fixed. The savings and investment balance is driven by
savings with all non-government savings rates fixed. For factor closures, labour,
capital and land are fully employed and mobile between sectors. The domestic
price index is chosen as the numeraire, which allows for a flexible consumer
price index.
2.1 The Data: A Social Accounting Matrix for Bangladesh
The core data source for a DCGE is the Social Accounting Matrix (SAM). A
SAM is a statistical representation of an economy describing payments and
receipts between economic agents, factors, and intermediate and final goods and
services. The most recent SAM for Bangladesh (Khondker and Raihan 2011) was
customized for this study. The main adjustments included more agricultural
sector detail and greater consistency in activity payments to factors of
production. Modifications to the SAM are documented in Banerjee et al. (2013).
The SAM base year of 2006/07 was chosen since it is the most recent year for
which comprehensive data on Bangladesh’s economy were available and was
considered a relatively normal year, unaffected by the recent global economic
crisis and other shocks such as severe weather events.
The SAM was aggregated to 30 sectors, 17 of which are related to
agriculture. The sectors in the final SAM are shown in Table I.Banerjee, Mahzab & Asaduzzaman: Towards 2021 81
TABLE I
ECONOMIC SECTORS IN THE 2006/07 BANGLADESH SAM
Agricultural sectors Non-agricultural sectors
1. Boro rice 18. Forestry
2. Aman rice 19. Water
3. Aus rice 20. Electricity
4. Wheat 21. Housing
5. Other grains 22. Health
6. Potato 23. Education
7. Vegetables 24. Public administration
8. Pulses 25. Manufactured goods
9. Other crops 26. Construction
10. Fruit 27. Mining and gas
11. Livestock 28. Trade
12. Poultry 29. Transport
13. Fish 30. Services
14. Milled rice
15. Milled grain
16. Processed food
17. Oils
Factors of production in the SAM include skilled (≥ class level of 10) and
unskilled labour (classes 0 to 9) categories, capital and land. There are 11
institutions, 8 of which are households (6 rural households and 2 urban
households). Households are disaggregated according to the Household Income
and Expenditure Survey classification system. Table II details the characteristics
of the household categories in the SAM. Rural agricultural households are
described according to their land endowments; non-agricultural households are
distinguished by whether or not they are poor. The two urban households types
are disaggregated by level of education with less educated households possessing
less than or equal to 8th class education and higher educated households
possessing greater than 8th class education. The remaining three institutions are
the government, firms and the rest of the world. The final two accounts in the
SAM are public and private investment, and inventories.82 Bangladesh Development Studies
TABLE II
HOUSEHOLD ENDOWMENT CATEGORIES
Household type
1. Landless (0 ha) 5. Rural non-agricultural poor
2. Marginal (≤ 0.198 ha) 6. Rural non-agricultural non-poor
3. Small agricultural (0.202 to 1.008 ha) 7. Urban educated
4. Large agricultural (agricultural > 1.012) 8. Urban less educated
III. SCENARIO DESIGN
This section describes the forecast baseline and the seven counterfactual
scenarios evaluated with the DCGE.
3.1 Forecast Baseline
The forecast baseline modelled Bangladesh’s economy from the base year of
2006/07 to 2050. This is the benchmark trajectory of Bangladesh’s economy and
is the path against which all subsequent scenarios were evaluated. Factors,
productivity, yield and the overall economy followed a balanced growth path in
the forecast. In this baseline, TFP growth was estimated at 1 per cent for all
sectors of the economy. Labour force growth followed population growth and
was estimated by the Bangladesh Institute of Development Studies (BIDS 2013).
Bangladesh’s population was 143,158,850 in 2006/07. BIDS estimated the
population would reach 189,700,006 by 2030 and 214,789,999 by 2050 (BIDS
2013b). In the baseline, the average growth rate was taken and population and
labour force growth were estimated at 1.164 per cent.
Model elasticity parameters include the Armington elasticity, the Constant
Elasticity of Transformation for shifting production between domestic and
international markets, the elasticity of substitution between factors, elasticity of
substitution between aggregated factors and intermediate inputs, household
expenditure elasticity of demand for commodities, and the Frisch parameter. Best
estimates of these parameters were obtained from the literature, particularly those
compiled by the Global Trade Analysis Project (GTAP, Dimaranan 2006).
3.2 Population Growth Scenarios
Population and labour force growth are important drivers of economic
growth. The United Nation’s low variant estimate of population growth projected
that Bangladesh will reach a population of 165,966,000 by 2050 (figure 1; UNBanerjee, Mahzab & Asaduzzaman: Towards 2021 83
2010). In a constant fertility scenario, the population was projected to reach
235,944,000 in 2050, greater than the BIDS (2013b) estimate of 214,789,999,
which was used in the forecast baseline. In the first two scenarios, the
consequences of differing population trajectories for Bangladesh were evaluated.
Scenario 1 imposed the low variant estimate with an average rate of growth of
0.40 per cent between 2007 and 2050, while scenario 2 imposed the constant
fertility variant with an average rate of growth of 1.51 per cent for the same
period.
Figure 1: UN Population Estimates
300,000
250,000
Population
200,000
150,000
100,000
2010 2015 2020 2025 2030 2035 2040 2045 2050
Year
Constant-fertility variant High variant Medium variant Low variant
Source: Population Division of the Department of Economic and Social Affairs of the
UN.
3.3 Total Factor Productivity
Agriculture is a key driver of Bangladesh’s economic growth and for
improving the livelihoods of the country’s poor. Economic development and
growth that is inclusive and equitable is integral to Bangladesh’s 2021 Vision.
The fact that 80 per cent of Bangladesh’s population resides in rural areas and 54
per cent of the rural population is employed in agriculture emphasizes
agriculture’s importance in contributing to the livelihood opportunities of the
most marginalised (World Bank 2013).
Increasing agricultural production in the past was largely a function of
increasing: the area cultivated, irrigation, the number and length of cropping84 Bangladesh Development Studies
seasons, and yields. In many regions of Bangladesh, the number of cropping
seasons is approaching the maximum and there is little scope for increasing
cultivable areas due to urban, peri-urban, rural residential and infrastructure
developments (Faisal, Islam and Saila 2004). Consequently, increasing crop
yields will be the critical pathway to increasing output and meeting food security
targets. With increasing land and rural labour scarcity, more will have to be
produced with less (Kumar, Mittal and Hossain 2008).
TFP is the component of growth that cannot be explained by growth in factor
inputs, namely land, labour and capital (Solow 1957). TFP is a measure of
technical progress which is composed of technical change and technical progress.
Technical change is an improvement in best production practices, whereas
technical progress is a movement towards the best production practices.
Technical progress is driven by numerous factors such as human capacity,
infrastructure development, research and development and education. There is
significant scope to increase technical progress through enhanced production
efficiencies and using existing technologies more effectively (Kumar, Mittal and
Hossain 2008). With actual adoption rates of modern crop technologies in
Bangladesh reported to be approaching the maximum, more effective selection
and implementation of technology is critical (Alam, Van Huylenbroeck, Buysse
and Begum 2011, Balcombe, Fraser, Rahman and Smith 2007).
In Bangladesh, over the last few decades, TFP growth has been achieved
largely by means of the development and/or implementation of high yielding
crop varieties, fertiliser and irrigation, as well as investment in physical
infrastructure including the construction of better roads and bridges. Rice is by
far the Bangladesh’s most important staple crop accounting for over 20 per cent
of total household outlays and almost 50 per cent of household expenditures on
food (Banerjee et al. 2013). Between 1951 and 1971, TFP growth for rice was
estimated at 0.98 per cent per year. With the introduction of high yielding rice
varieties between 1973 and 1989, TFP increased on average by 1.15 per cent per
year. This TFP growth contributed to between 40 per cent and 60 per cent of the
observed increase in rice output. In the case of wheat, average TFP was estimated
at between 0.83 per cent and 0.93 per cent for the same period, though it
contributed to between 11 per cent and 19 per cent of growth in wheat production
(Dey and Evenson 1991). For the agricultural sector overall, TFP growth was
estimated at 0.9 per cent per year between 1980 and 2000 (Coelli and Prasada
Rao 2003).Banerjee, Mahzab & Asaduzzaman: Towards 2021 85
In the third scenario, the impact of a slowdown in agricultural TFP growth
was evaluated. In this scenario, TFP growth in agriculture was set to 0.5 per cent,
while TFP in non-agricultural sectors remained at 1.0 per cent as in the baseline.
In the fourth scenario, agricultural TFP growth was increased to 1.5 per cent,
again maintaining a 1.0 per cent TFP growth in all non-agricultural sectors.
3.4 Climate Change
Bangladesh’s climate is subtropical monsoonal exhibiting high seasonal
variation in precipitation and temperature (Ali 2002). Summers are hot and wet,
while winters can be quite dry, resulting in drought in some regions (Yu et al.
2010). During the monsoon season, up to two-thirds of the country may become
inundated and cyclones and storm surges occur frequently. In a country where
water would seem to be abundant, water resources, fundamental for human well-
being and economic development, are in fact under great stress (Chowdhury
2010). Sources of water for drinking, agriculture and industry are threatened by
saline intrusion in the coastal region of the country, the ingress of polluted
surface waters, and arsenic contamination of shallow groundwater (Chowdhury
2010). Major urban centres are challenged to meet rising demand with population
growth, rural to urban migration and economic development.
Exacerbating these challenges, Bangladesh is one of the most vulnerable and
exposed countries to climate change. Temperatures are projected to rise implying
greater crop evapotranspiration and yield losses (Yu et al. 2010). Sea level rise is
also projected to reduce the supply of arable land, increase storm surges and
affect settlement patterns, fisheries and tourism (IWM and CEGIS 2007).
Increased surface water inflows into Bangladesh and potentially greater
monsoonal precipitation will increase flooding risk during the wet season.
The final three scenarios impose natural climate variability and climate
change on the model (Huq 1999, IWM and CEGIS 2007, Yu et al. 2010). Natural
climate variability was imposed in all three scenarios and accounts for yield
losses estimated on the basis of an historical climate series. The impacts of
natural climate variability were drawn from Yu et al. (2010). Yu et al. (2010)
estimated climate impacts in the following way:
1. The DCGE was run from the base year to 2050. For each of those years,
a random observation from the historical climate series of 1970 to 1999
was drawn.86 Bangladesh Development Studies
2. Based on this random draw, crop yield impacts were estimated in a crop
modelling framework, which were in turn imposed on the DCGE model
as an exogenous shock.
3. The historical record also contained extreme weather events where
damages to crops were especially severe. If a severe event year was
drawn from the historical series, additional yield impacts were imposed
on the DCGE.
4. This process was repeated 50 times to simulate natural climate variability
for the entire period of analysis.
In addition to natural climate variability, climate change shocks were
imposed in each of the three climate scenarios. The climate change impacts
imposed reduced arable land supply due to sea level rise and increased annual
flooding, and reduced crop yield due to higher than average temperatures. These
shocks were informed by analysis of future climate projections and agricultural
crop modelling conducted by Yu et al. (2010).
Yu et al.’s (2010) estimates for future temperature and precipitation changes
were based on analyses of 16 Global Circulation Models (GCMs) for A1B, A2
and B1 emissions scenarios. Results indicated positive temperature changes for
every experiment and every month with a median warming of 1.1°C by 2030. No
discernible changes in precipitation were found until 2030, though by 2050, some
models predicted a trend of increased annual and wet season precipitation.
Median estimates predicted precipitation may increase by up to 4per cent over
the baseline by 2050 (Thurlow, Dorosh and Yu 2011,2012).
Yu et al. (2010) used the Crop Environment Resource Synthesis (CERES)
modelling system to estimate climate change impacts on crop output. The authors
reported the joint impact on crop output due to changes in temperature and
precipitation, coastal and inland flooding, and a carbon dioxide enrichment effect
on some crops such as wheat. In the climate change scenarios modelled in this
paper, Yu et al.’s (2010) average climate change scenario was used, which is the
average of the A2 scenarios under all GCMs and the average of the B1 scenarios
under all GCMs.
Estimates of sea level rise were generated by the Institute of Water
Modelling and the Centre for Environmental and Geographic Information
Services (IWM and CEGIS) respectively. Projections by IWM and CEGISBanerjee, Mahzab & Asaduzzaman: Towards 2021 87
estimated sea level rise of 15 cm in 2030 and 27 cm in 2050; the consequence of
these rates of rise was estimated to result in a 1.5 and 2.5 per cent loss of
agricultural land in 2030 and 2050 respectively (IWM and CEGIS 2007).
Scenario 5 is the low impact climate change scenario, where crop yield and
sea level rise impacts were estimated as 25 per cent less than Yu et al.’s (2010)
average climate change scenario. Scenario 6 is the average climate change impact
scenario. Scenario 7 is a high impact climate change scenario where crop yield
and sea level rise impacts were estimated as 25 per cent higher than the average
climate change scenario.
IV. RESULTS
Table III provides an overview of Bangladesh’s economy in the base year of
2006/07. Gross domestic product (GDP) was over US$69 billion. The investment
share of GDP was 25 per cent, while imports surpassed exports by almost US$5
billion.
TABLE III
BANGLADESH MACROECONOMIC AGGREGATES (2006/07)
GDP component Billions of US$
1. Private consumption (C) 52.18
2. Public consumption (G) 3.82
3. Investment (I) 18.02
Private 13.77
Public 3.77
Change in stock 0.48
4. Exports (X) 13.69
5. Imports (I) 18.49
GDP at current prices 69.23
Figure 2 projects Bangladesh’s economy in the baseline. The services sector
in the base year accounts for 38 per cent of GDP, increasing its share to 42 per
cent in 2050. The agricultural sector declines in importance, from 35 per cent to
13 per cent over the period of analysis. The manufacturing sector experiences a88 Bangladesh Development Studies
rapid growth, accounting for 23 per cent of GDP in the base year, increasing to
40 per cent by 2050. Energy and mining increases from just 3 per cent to 4 per
cent by 2050.
Figure 2: Structure of Bangladesh’s Economy in the Baseline
100%
90%
80%
70%
60%
50%
40%
30%
20%
10%
0%
Services Agriculture Manufacturing Energy and mining
Table IV presents the deviation in average annual growth rate (AAGR) from
the baseline for macroindicators. All macroeconomic indicators grew in the
baseline and GDP registered at 6.9 per cent.
TABLE IV
DIFFERENCE IN AAGR (%) FROM BASELINE
IN MACROINDICATORS
Indicators Base UN UN TFP TFP CC CC CC
low high slow fast low avg high
Private 6.277 -0.541 0.240 -0.104 0.101 -0.032 -0.039 -0.044
consumption
Fixed 8.268 -0.617 0.274 -0.054 0.045 0.003 0.008 0.010
investment
Exports 8.615 -0.650 0.291 0.002 -0.007 0.034 0.051 0.058
Imports 7.815 -0.642 0.289 0.002 -0.007 0.033 0.050 0.058
GDP 6.960 -0.573 0.255 -0.083 0.077 -0.017 -0.019 -0.021Banerjee, Mahzab & Asaduzzaman: Towards 2021 89
In the low fertility population projection scenario, the AAGR of GDP,
private consumption, fixed investment, exports and imports was considerably
slower than in the baseline. In the constant fertility high population projection
scenario, all indicators grew appreciably faster than in the baseline. The impact
of slow agricultural TFP growth was to depress private consumption, fixed
investment and GDP below forecast. As expected, in the fast TFP growth
scenario, all indicators, with the exception of exports and imports, grew faster
than forecast. Moving from the low to high climate change scenarios, the
negative deviation from the baseline increased for private consumption and GDP,
while fixed investment, exports and imports grew faster than in the baseline.
These high-level findings illustrate that small changes in population and TFP
growth can have a greater overall economic impact than projected climate
change.
Table V presents household income deviations in AAGR from the baseline.
In the baseline, given steady economic growth, household income grew between
4 per cent and over 5 per cent. Rural non-agricultural non-poor households saw
their income grow the fastest in the baseline.
TABLE V
DIFFERENCE IN AAGR (%) FROM BASELINE IN HOUSEHOLD INCOME
Household income Baseline Un UN TFP TFP CC CC CC
low high slow fast low avg high
Landless 4.316 -0.249 0.102 -0.309 0.298 -0.188 -0.254 -0.290
Marginal 4.584 -0.293 0.118 -0.324 0.311 -0.192 -0.256 -0.292
Small farmers 4.508 -0.291 0.117 -0.324 0.311 -0.192 -0.257 -0.293
Large farmers 4.620 -0.297 0.119 -0.326 0.312 -0.193 -0.256 -0.292
Rural non- 4.230 -0.271 0.109 -0.318 0.305 -0.192 -0.257 -0.294
agricultural poor
Rural non- 5.015 -0.336 0.134 -0.339 0.324 -0.193 -0.255 -0.290
agricultural non-poor
Urban less educated 4.114 -0.208 0.085 -0.297 0.287 -0.191 -0.261 -0.299
Urban educated 4.381 -0.328 0.131 -0.334 0.319 -0.192 -0.254 -0.29090 Bangladesh Development Studies
When the UN’s low population estimate was imposed, overall income
growth slowed considerably for all household categories, particularly in the case
of rural non-agricultural non-poor and urban educated households. Imposing the
UN’s constant fertility estimate, household income grew faster for all household
categories. Again, it was the rural non-agricultural non-poor and urban educated
that were most affected by the shock. The impact of slow TFP growth on
household income was negative and substantial for all households to a similar
degree, while faster TFP growth resulted in higher household income growth for
all household categories. With climate change impacts, household income grew
slower. The negative impact on household income increased with increasing
projected climate change impacts. All household categories appeared to
demonstrate a similar susceptibility to climate change shocks.
Given the direct relationship between climate change and agricultural
sectors, it is interesting to explore in some detail how agriculture is impacted.
Table VI presents the high climate change impacts on imports, exports, domestic
output, composite output, which is an aggregate of domestic and imported goods
and services and composite price. Most agricultural imports grew slower; one
notable exception is that of milled rice, imports of which grew over 0.7 per cent
faster. Agricultural exports grew even slower than forecast, especially those of
milled rice. Key sectors including manufacturing, construction and transportation
grew more quickly. Domestic agricultural sector output grew more slowly for all
subsectors except for forestry, while output of key non-agricultural sectors grew
more quickly. Composite output grew more slowly for most agricultural sectors
and more quickly for key non-agricultural sectors. All prices with the exception
of paddy and milled rice were negatively impacted. The results give us an idea
about the more deepening of the manufacturing and services sectors in the
economy within the 2030 period. Due to climate change, agriculture seems to
take a major drawback in terms of production and export, however, the apparent
loss is compensated largely by the increase in output and export of the industrial
and service sector. Thus the scopes and strategies of coping of the economy
towards those latter sectors would be very important in the long run.Banerjee, Mahzab & Asaduzzaman: Towards 2021 91
TABLE VI
HIGH CLIMATE CHANGE IMPACT DIFFERENCES
IN AAGR (%) FROM BASELINE
Commodity Imports Exports Domestic Composite Composite
output output Price
Paddy -0.444 -0.444 0.297
Wheat -0.022 -0.182 -0.147 -0.022 -0.282
Other grains -0.031 -0.204 -0.166 -0.032 -0.282
Potato -0.002 -0.132 -0.096 -0.029 -0.274
Vegetables -0.009 -0.108 -0.068 -0.034 -0.269
Pulses -0.008 -0.096 -0.053 -0.044 -0.254
Fruit 0.010 -0.116 -0.065 -0.029 -0.261
Other crops 0.019 -0.078 -0.051 0.015 -0.281
Livestock 0.342 -0.533 -0.196 -0.193 -0.014
Poultry 0.080 -0.101 -0.032 -0.030 -0.227
Fish -0.026 -0.019 -0.022 -0.022 -0.285
Forestry 0.004 0.004 -0.295
Milled rice 0.746 -1.363 -0.678 -0.361 0.144
Milled grain -0.035 -0.012 -0.020 -0.020 -0.288
Processed food -0.002 -0.119 -0.049 -0.045 -0.260
Oil -0.034 -0.015 -0.022 -0.029 -0.284
Electricity -0.036 -0.004 -0.010 -0.011 -0.291
Water -0.037 -0.005 -0.011 -0.013 -0.291
Housing -0.015 -0.015 -0.290
Health -0.035 -0.035 -0.290
Education -0.014 -0.014 -0.292
Public admin/def -0.017 0.010 0.003 -0.001 -0.290
Manufacturing -0.017 0.059 0.030 0.013 -0.290
Construction -0.006 0.014 0.010 0.010 -0.291
Mining and gas -0.002 0.032 0.019 0.019 -0.289
Trade 0.021 0.021 -0.292
Transportation -0.003 0.025 0.017 0.015 -0.292
Services -0.001 0.008 0.006 0.006 -0.285
Note: Values in bold indicate that rates of change were negative in the baseline.
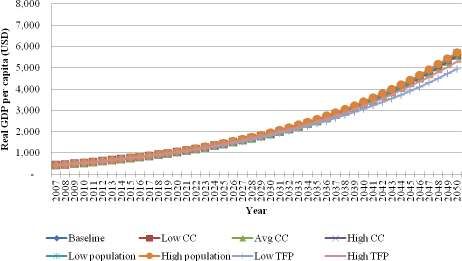
Figure 3 projects GDP per capita for each of the seven scenarios. In the
forecast baseline, the 2021 Vision is reached not in 2021, but 10 years later in
2031 with a GDP of US$385.6 billion and growth rate of 6.9 per cent.
The low population growth scenario also has the per capita income target
met slightly later in 2032 with a GDP of US$359.4 billion and rate of growth of
6.4 per cent, the lowest GDP growth rate of all scenarios considered. The high
population growth scenario has the target met in 2031 with a GDP of US$408.5
billion and rate of growth of 7.2 per cent. The higher rate of population growth,
which directly determines the size of the labour force, yielded the highest rate of
GDP growth.92 Bangladesh Development Studies
In the low agricultural TFP growth scenario, the per capita income target is
met in 2032 with a GDP of US$403.7 billion and rate of growth of 6.88 per cent,
the second lowest GDP growth rate of all scenarios considered. The high TFP
growth scenario has the target met in 2031 with a GDP of US$392.7 billion and
rate of growth of 7.04 per cent, the second highest GDP growth rate of all
scenarios considered.
In the low climate impact scenario, the target US$2,000 per capita income
was reached in 2031, with a GDP and GDP growth of US$382.4 billion and 6.9
per cent respectively. In the average and high climate impact scenarios,
attainment of the target was delayed by one year to 2032, with a GDP of
US$408.1 billion and US$407.9 billion respectively. GDP growth in the average
and high climate impact scenarios were both 6.9 per cent.
Figure 3: Real GDP per capita (US$)
Government policy and incentives as well as public and private investment
can play an important role in fostering faster TFP growth. Given the potential to
use TFP growth as a policy lever, the impact of variability in TFP growth on
achieving the 2021 was explored. Figure 4 shows per capita income for different
rates of TFP growth for the agricultural sector alone and different rates of
economy-wide TFP growth.
An agricultural sector TFP of 0.5 per cent had Vision 2021 reached in 2032.
Increasing growth in agricultural TFP to between 1 per cent and 2 per cent had
the target reached 1 year earlier. An agricultural TFP of between 3 per cent and 4Banerjee, Mahzab & Asaduzzaman: Towards 2021 93
per cent had the target per capita income reached by 2030 and a 5 per cent
agricultural TFP had the target reached by 2029.
Figure 4: Vision 2021 and TFP Growth
$180,000
$160,000
$140,000
Real GDP per capita (USD)
$120,000
$100,000
$80,000
$60,000
$40,000
$20,000
$-
Year
Agri TFP 0.5% TFP ALL 1% Agri TFP 1.5% Agri TFP 1.5% Agri TFP 2.0% Agri TFP 3.0% Agri TFP 4.0%
Agri TFP 5.0% TFP 1.5% TFP 2% TFP 2.5% TFP 3% TFP 3.5%
Small changes in economy-wide TFP growth were found to have a
significant impact on the rate at which the 2021 target was met. An economy-
wide TFP of 1 per cent had the target reached by 2031. Increasing economy-wide
growth by just 0.5 per cent had the target reached by 2028. A TFP of 2 per cent,
3 per cent and 4 per cent had the target reached by 2026, 2024 and 2023
respectively. A TFP of 5 per cent was required for the target to be met by 2021.
This rate of TFP growth yielded a GDP of US$366.1 billion and GDP growth of
11.9 per cent.
Figure 5 shows the difference in discounted cumulative net present value of
GDP to 2050 between the 7 scenarios and additional TFP experiments using a 5
per cent discount rate. There are a number of interesting features of this figure.
First, an increase from 1 per cent to 1.5 per cent in agricultural TFP would yield
US$92.07 million in economic gains by 2050. Increasing economy-wide TFP
from 1 per cent to 1.5 per cent had a much more pronounced effect, generating
US$1,237.47 million in benefits. Finally, reducing the impact of climate
variability from high to low would save the Bangladesh economy US$5.06
million.94 Bangladesh Development Studies
Figure 5: Net Present Value of Cumulative GDP from 2050 (millions of US$)
$14,000
Net present value of cumulative GDP from 2050
$12,000
at 5% discount rate, millions of USD
$10,000
$8,000
$6,000
$4,000
$2,000
$-
-$2,000
V. DISCUSSION AND CONCLUSIONS
In this paper a DCGE model was developed to explore the impact of key
drivers of change on Bangladesh’s economy and achieving the 2021 Vision of a
per capita income of US$2,000 per person. A baseline forecast projecting the
economy to 2050 was established against which seven scenarios were evaluated.
The first and second experiments modelled low and high population growth. The
impact of variability in TFP growth was explored in the third and fourth
scenarios. In the final three scenarios, low, average and high climate change
impacts were considered.
In the baseline, GDP growth was projected at 6.9 per cent which is within the
range of projections made by industry experts. In the low population growth
scenario, GDP, private consumption, fixed investment, exports and imports grew
considerably slower than forecast, while in the high population growth scenario,
all indicators grew faster. In the slower TFP growth scenario, all macroeconomic
indicators were depressed below forecast. The slower TFP growth scenario had a
more profound impact than the slow population growth scenario. All indicators
grew faster in the high TFP growth scenario. Moving from the low to high
climate change scenarios, the negative deviation from forecast increased for
private consumption and GDP, while fixed investment, exports and imports grew
faster than in the baseline. The main message that emerges from these results isBanerjee, Mahzab & Asaduzzaman: Towards 2021 95
that small changes in population and TFP growth can have a greater overall
economic impact than projected climate change.
In the baseline, steady economic growth led to rising household incomes on
the order of between 4 per cent and 5 per cent. Lower rates of population growth
slowed overall income growth, while higher population growth had income
growing more rapidly. Rural non-agricultural non-poor and urban educated
households were most sensitive to variability in population growth rates. Slower
TFP growth also slowed household income growth, while higher TFP growth led
to faster income growth, as would be expected. Increasing climate change
impacts had an increasingly negative impact on households with all household
categories appearing to be equally susceptible.
Exploring in greater detail the climate change impacts on sectoral activity,
most agricultural imports grew slower, except for milled rice. This was
symptomatic of climate impacts on the rice cultivation sector. Domestic
shortfalls in rice, Bangladesh’s most important staple crop, increasingly were
made up with imported rice. Domestic and composite agricultural sector output
grew more slowly in most cases. Factors of production were reallocated from
agriculture to other sectors generating higher returns and as a consequence,
output of these non-agricultural sectors grew more quickly. This was true in all
scenarios, with agriculture’s economic importance accounting for a declining
share of GDP. All prices, except the paddy and milled rice sectors, were
negatively impacted, again a direct result of climate impacts on the rice sector.
The results from the climate change shock reported in the present study are
comparable to other recent analyses of climate change impacts on agriculture.
For example, a study undertaken by Yu et al. (2010) reports that in an average
climate change scenario climate change reduced the GDP growth from 4.44 per
cent to 4.38 per cent for a cumulative loss in total value added of US$128.55
billion and a discounted loss of US$25.73 billion. This amount was equal to an
average drop in GDP of US$570 million per year or 1.15 per cent of total GDP.
This study shows low climate change impacts reducing GDP growth by -0.017
and high climate change impacts reducing growth by -0.021. Reducing climate
change impacts from high to low would save Bangladesh’s economy US$5.06
million in present value terms.
Key differences in the Yu et al. (2010) study and the current study were
related Yu et al.’s assumed rate of land expansion of 1 per cent per year declining
to 0.5 per cent per year by 2050; a labour supply growth and population growth
rate projection of 2 per cent, with a higher rate of skilled labour growth, and; a 296 Bangladesh Development Studies
per cent rate of agricultural TFP growth and 2.5 per cent for industry and
services. Furthermore, Yu et al. (2021) did not report on the contribution of
agricultural imports in meeting domestic shortfalls, which, in the present study,
was projected to become a very important component of domestic supply.
In the forecast baseline, the 2021 Vision of an income per capita of
US$2,000 was attained by 2031, with a GDP of US$385.6 billion and GDP
growth of 6.9 per cent. The TFP shocks had the greatest influence on the rate at
which the 2021 Vision was achieved. The low TFP growth scenario had the
target reached in 2037 with a GDP of US$432.7 billion and rate of growth of 6
per cent. The high TFP growth scenario had the target met much earlier, in 2028
with a GDP of US$375 billion and rate of growth of 7.9 per cent. For the 2021
Vision to be met in 2021, ceteris paribus, it was estimated that a TFP growth of 5
per cent would be required, yielding a GDP of US$366.1 billion and GDP growth
of 11.9 per cent.
Crop yield impacts and sea level rise are only two potential climate change
impacts that were considered in this analysis. Not evaluated was, for example,
the potential for a trend of increasing intensity and frequency of extreme weather
events. These events could include cyclonic storms, severe flooding and severe
drought. With sea level rise, saline intrusion is also a concern where saltwater
pushes its way upstream, contaminating groundwater supplies and rendering once
cultivable land unmanageable (Faisal, Islam and Saila 2004). The inclusion of
such climate change impacts would exacerbate the economy-wide and
agricultural sector responses presented here. The role of the state will be critical
in creating the right mix of regulation and incentives for greater adaptation and
resilience to climate variability and change. Furthermore, climate change
projections and their impacts on agriculture are subject to a great deal of
uncertainty with different projections leading to differential outcomes with
regards to the economy, food security and ultimately societal well-being.
A central finding of this study is that overall, population growth dynamics
and TFP growth have more profound effects on the economy than projected
climate change. Numerous other drivers of change not considered here could also
prove to have significant impacts including urbanisation, the changing age
structure of the population, external migration and remittances, infrastructure
development and exogenous shocks to the economy such as the agricultural
commodity price shock that occurred in 2008.
Bangladesh has been adapting to natural climate variability and change for
decades. As waterlogged areas have increased, for example, research efforts intoBanerjee, Mahzab & Asaduzzaman: Towards 2021 97
crop varieties tolerant of such conditions have been stepped-up. With
groundwater extraction for irrigation in some areas of the country’s northwest
beginning to show signs of stress, various policies and programmes have been
implemented to encourage water saving technologies and a shift in agricultural
development towards coastal regions. Salt-tolerant crops and appropriate
management strategies are being pursued to overcome the challenges
characteristic of coastal regions. The development of high yielding varieties and
other technological innovations will also help meet growing demand.
Nonetheless, to keep pace, public and private investment in research and
development will be critical to continue to encourage innovation (Ministry of
Food and Disaster Management 2006).
Investment in research and development and the implementation and
refinement of those technologies already known to enhance productivity will be
critical to offset potentially negative climate change impacts. As the results
presented here have indicated, small gains in factor productivity can translate to
large gains in output and growth. Greater efficiency in resource use can facilitate
factor reallocation in the economy, reallocating factors to those sectors
contributing the most to growth and enhanced well-being. The manufacturing
and service sectors are critical engines of growth in Bangladesh’s economy and
will contribute substantively towards achieving national development goals. On
the other hand, agriculture is the largest employer in the country and a critical
stepping stone for many out of poverty. A two-pronged policy approach will be
required to provide incentives to fuel the country’s engines of economic growth
while enhancing productivity in the countryside to lift the rural poor out of
poverty and increase off-farm employment opportunities.
With population growth, increased per capita consumption and increasing
resource scarcity, Bangladesh will have to do more with less (Alam et al. 2011,
Balcombe et al. 2007). Judicious planning and consideration of the trade-offs
inherent in achieving sustainable growth will test political capacity and will.
Reducing poverty by 32 per cent in the last 20 years, Bangladesh has
demonstrated it is up for the challenge.98 Bangladesh Development Studies
REFERENCES
Alam, M. J., G. Van Huylenbroeck, J. Buysse and I. A. Begum. 2011. “Technical
Efficiency Changes at the Farm-level: A Panel Data Analysis of Rice Farms in
Bangladesh.” African Journal of Business Management, 5(14): 5559-5566.
Ali, L. 2002. An Integrated Approach for the Improvement of Flood Control and
Drainage Schemes in the Coastal Belt of Bangladesh. The Netherlands: A.A.
Balkem Publishers.
Balcombe, K., I. Fraser, M. Rahman and L. Smith. 2007. “Examining the Technical
Efficiency of Rice Producers in Bangladesh.” Journal of International
Development, 19(1): 1-16.
BBS (Bangladesh Bureau of Statistics). 2012. Report on Labor Force Survey. Dhaka:
BBS.
Banerjee, O. and J. R. R. Alavalapati. 2014. “Forest Policy Modelling in an Economy-
Wide Framework.” In S. Kant and J. R. R. Alavalapati (eds.), Handbook of Forest
Resource Economics. London: Earthscan.
────2010. “Illicit Exploitation of Natural Resources: The Forest Concessions in
Brazil.” Journal of Policy Modeling, 32(4): 488-504.
Banerjee, O., M. M. Mahzab, S. Raihan and N. Islam. in press. “An Economy-wide
Analysis of Climate Change Impacts on Agriculture and Food Security in
Bangladesh.” Climate Change Economics.
Banerjee, O., M. M.Mahzab, M. Asaduzzaman, M. Kirby, K. M. N. Islam, M. K. Mujeri
and M. Alam. 2014. The Economics of Climate Change in Bangladesh. Canberra:
CSIRO. Retrieved from
https://publications.csiro.au/rpr/pub?list=ASE&pid=csiro:EP142773&expert=fals
e&sb=RECENT&n=29&rpp=50&page=1&tr=461&dr=all&csiro.flagshipOrPortf
olio=0000009550
BIDS. 2013a. “Gross Domestic Product Projections, Bangladesh.” Bangladesh Institute
of Development Studies, Dhaka.
───2013b. “Population Projections, Bangladesh.” Bangladesh Institute of Development
Studies, Dhaka.
Cattaneo, A. 1999. Technology, Migration and the Last Fronteir: A General Equilibrium
Analysis of Environmental Feedback Effects on Land Use Patterns in the
Brazilian Amazon. Baltimore: John Hopkins University.
Chowdhury, N. T. 2010. “Water Management in Bangladesh: An Analytical Review.”
Water Policy, 12(1): 32-51.
Coelli, T. J. and D. S. Prasada Rao. 2003. “Total Factor Productivity Growth in
Agriculture: A Malmquist Index Analysis of 93 Countries, 1980 - 2000.” Paper
presented at the International Association of Agricultural Economics Conference.Banerjee, Mahzab & Asaduzzaman: Towards 2021 99
Dewatripont, M. and G. Michel. 1987. “On Closure Rules, Homogeneity and Dynamics
in Applied General Equilibirum Models.” Journal of Development Economics,
26(1).
Dey, M. M. and R. E. Evenson. 1991. The Economic Impact of Rice Research in
Bangladesh. New Haven: Yale University.
Dimaranan, B. V. 2006. Global Trade, Assistance, and Production: The GTAP 6 Data
Base. West Lafayette: Purdue University.
Faisal, I. M., M. F. Islam and P. Saila. 2004. “Food Security in the Face of Climate
Change, Population Growth, and Resource Constraints: Implications for
Bangladesh.” Environmental Management, 34(4): 487-498.
Huq, S. 1999. Vulnerability and Adaptation to Climate Change for Bangladesh.
Dordrecht; Boston: Kluwer Academic Publishers.
IWM and CEGIS. 2007. Investigating the Impact of Relative Sea Level Rise on Coastal
Communities and their Livelihoods in Bangladesh (Final Report). Dhaka: Institute
of Water Modeling and Center for Environmental and Geographic Information
Services.
Khondker, B. H. and S. Raihan (eds.). 2011. “A Social Accounting for Bangladesh
2006/07: Methodology and Results” (Vol. 2, Model Structures, Simulation Results
and Related Studies, Sixth Five Year Plan of Bangladesh 2011-2015). Dhaka.
Kumar, P., S. Mittal and M. Hossain. 2008. “Agricultural Growth Accounting and Total
Factor Productivity in South Asia: A Review and Policy Implications.”
Agricultural Economics Research Review, 21: 145-172.
Lofgren, H., R. L. Harris, S. Robinson, M. Thomas and M. El-Said. 2002. A Standard
Computable General Equilibrium (CGE) Model in GAMS. Retrieved from
http://www.ifpri.org/pubs/microcom/5/mc5.pdf.
Ministry of Finance. 2014. Bangladesh Economic Review. Dhaka, Bangladesh: Ministry
of Finance.
Ministry of Food and Disaster Management. 2006. National Food Policy 2006.
Planning Commission. 2010. Outline Perspective Plan of Bangladesh 2010-2021,
Making Vision 2021 A Reality. Retrieved from www.unpei.org/.../doc.../169-pei-
bangladesh-outline-plan-2010.html.
Robinson, S. and J. Thurlow. 2004. A Recursive Dynamic Computable General
Equilibrium (CGE) Model: Extending the Standard IFPRI Static Model.
Solow, R. M. 1957. “Technical Change and the Aggregate Production Function.” Review
of Economics and Statistics, 39(3): 312-320.
Thurlow, J., P. Dorosh, and W. Yu. 2012. “A Stochastic Simulation Approach to
Estimating the Economic Impacts of Climate Change in Bangladesh.” Review of
Development Economics, 16(3): 412-428.
───2011. A Stochastic Simulation Approach to Estimating the Economic Impacts of
Climate Change in Bangladesh. Retrieved from
http://www.wider.unu.edu/publications/working-papers/2011/en_GB/wp2011-
086/.100 Bangladesh Development Studies
United Nations. 2010. World Population Prospects: The 2010 Revision. Population
Division of the Department of Economic and Social Affairs of the United Nations
Secretariat, United Nations.
World Bank. 2013. Bangladesh: Priorities for Agriculture and Rural Development.
Washington, D.C.: World Bank. Retrieved from
http://web.worldbank.org/WBSITE/EXTERNAL/COUNTRIES/SOUTHASIAEX
T/EXTSAREGTOPAGRI/0,,contentMDK:20273763~menuPK:548213~pagePK:3
4004173~piPK:34003707~theSitePK:452766,00.html
───2011. Growth in Bangladesh. Washington, D.C.: World Bank. Retrieved from
http://go.worldbank.org/BBLP60TK71
Yu, W. H., M. Alam, A.Hassan, A. S. Khan, A. C. Ruane, C. Rosenzweig, et al. 2010.
Climate Change Risks and Food Security in Bangladesh. Washington, D.C.:
Earthscan.You can also read