IDEXX Growth Strategy - Jonathan Ayers, Chairman and CEO IDEXX Investor Day I August 15, 2018

Page created by Samuel Gibbs
 
CONTINUE READING
IDEXX Growth Strategy - Jonathan Ayers, Chairman and CEO IDEXX Investor Day I August 15, 2018
IDEXX Growth Strategy
                                                Jonathan Ayers, Chairman and CEO
                                                            IDEXX Investor Day I August 15, 2018
1   © 2018 IDEXX Laboratories, Inc. All rights reserved.
IDEXX Growth Strategy - Jonathan Ayers, Chairman and CEO IDEXX Investor Day I August 15, 2018
Safe Harbor Disclaimer
     The following information contains forward-looking statements within the meaning of the Private Securities Litigation Reform Act of 1995. These forward-looking
     statements are based on management’s current expectations and beliefs, as well as a number of assumptions concerning future events. These statements are
     subject to risks, uncertainties, assumptions and other important factors. You are cautioned not to put undue reliance on such forward-looking statements because
     actual results may vary materially from those expressed or implied. The reports filed by the Company pursuant to United States securities laws contain discussions
     of these risks and uncertainties. The Company assumes no obligation to, and expressly disclaims any obligation to, update or revise any forward-looking
     statements, whether as a result of new information, future events or otherwise. You are advised to review the Company’s filings with the United States Securities
     and Exchange Commission (which are available from the SEC’s EDGAR database at www.sec.gov and via the Company’s website at www.idexx.com).

     We refer in this presentation to 2018 outlook communicated on August 1, 2018; these references speak only as of August 1, 2018 and shall not be deemed to be a
     reiteration or affirmation of the guidance or an indication that our expectations have not changed since that time.

     Non-GAAP Financial Measures
     In this presentation, we refer to some non-GAAP financial measures. For a reconciliation to the most comparable GAAP financial measures, we refer you to our
     footnotes and the Appendix to this presentation, which also refer to our Definitive Proxy Statement filed March 29, 2018 and the Company's Annual Report on Form
     10-K for the year ended December 31, 2017, both available at www.idexx.com/investors.

     Please refer to additional footnotes in the Appendix.

2   © 2018 IDEXX Laboratories, Inc. All rights reserved.
IDEXX Growth Strategy - Jonathan Ayers, Chairman and CEO IDEXX Investor Day I August 15, 2018
IDEXX – Expanding Opportunity to Advance Pet Care

    ▪ Strong market growth with favorable
      demographic trends

    ▪ Enduring recurring revenue model

    ▪ Global leadership with wide
      innovation gap

    ▪ Expanding commercial model driving
      adoption of an elevated standard of
      pet care

    ▪ Accelerated organic growth of CAG
      Diagnostics Recurring Revenue

3   © 2018 IDEXX Laboratories, Inc. All rights reserved.
IDEXX Growth Strategy - Jonathan Ayers, Chairman and CEO IDEXX Investor Day I August 15, 2018
The Core Business Model Consists of Profitable Recurring Revenue
        Recurring Revenue Comprises 88% of 2017 Total IDEXX Revenue

                   Annual IDEXX Revenue ($Billion)
                   $ 2.1                                                  $2.0B

                         1.8
                                                                                  Other Revenue

                         1.5

                         1.2                                      $1.1B

                         0.9                                                      Recurring
                                                                                  Revenue3
                         0.6

                         0.3

                         0.0
                                                                  2010    2017

        Recurring as a % of Total                                         88%
        IDEXX Revenues
                                                                  81%

    3   Please refer to the Appendix for descriptive footnotes.

4       © 2018 IDEXX Laboratories, Inc. All rights reserved.
IDEXX Growth Strategy - Jonathan Ayers, Chairman and CEO IDEXX Investor Day I August 15, 2018
IDEXX Recurring Revenue is Led by CAG Diagnostics
                                                                                                                                                                  IDEXX Recurring Revenue
                Annual Recurring Revenue                                  ($Billion)1,3                                                                           Components
                $ 2.1                                                                                                                                             (88% of IDEXX Total Revenue)

                     1.8                                                                                                                                          Water Testing
                                                                                                                                                                  Livestock Testing*
                     1.5                                                                                                                                          Veterinary Software and Services**
                                                                                                                                                                  Rapid
                                                                                                                                                            10%
                     1.2                                                                                                                                          Assay

                     0.9                                                                                                                                          IDEXX             Companion
                                                                                                                                                            30%   VetLab®***        Animal
                     0.6
                                                                                                                                                                                    Diagnostics
                     0.3                                                                                                                                          Reference         (74% of total
                                                                                                                                                            34%
                                                                                                                                                                  Labs              IDEXX Revenue)
                     0.0
                                                                2010                                                                           2017

      *     Livestock, poultry and dairy testing. ** Includes diagnostic imaging systems. *** IDEXX VetLab includes consumables, service and accessories.
      1,3   Please refer to the Appendix for descriptive footnotes.

5   © 2018 IDEXX Laboratories, Inc. All rights reserved.
IDEXX Growth Strategy - Jonathan Ayers, Chairman and CEO IDEXX Investor Day I August 15, 2018
The Global Market is ~$4.2 Billion with Strong Secular Growth Trends
     U.S. represents ~$2.6B, or ~62% and International represents ~$1.6B or ~38%
                                         Estimated 2017 Total Companion Animal Diagnostic and Veterinary Software Spending ($M)*

                                                           Canada
                                                                                                              Europe
                                                             U.S.                                             Region

                                                                                                                                                                                                    Asia Pacific
                                                                                                                                                                                                    Region

                                                                     Latin
                                                                    America

    * Revenue estimated at the manufacturer level. Includes reference lab, telemedicine, in-house instruments and consumables, rapid assay, manual microscopy, digital, ultrasound and veterinary software. Figures stated in USD, based on
      2017 average exchange rates.

6   © 2018 IDEXX Laboratories, Inc. All rights reserved.
IDEXX Growth Strategy - Jonathan Ayers, Chairman and CEO IDEXX Investor Day I August 15, 2018
Pet Owners View their Pets as Members of their Families and Can’t
    Imagine Giving them Up

            “I feel that my pet is
            an important part of                                              98%
            my family.”

            “I couldn’t imagine
            giving up my pet for                                              95%
            any reason.”

    Percentages represent those responding “Strongly agree” or “Agree”.
    Source: Pet Owner Survey conducted in 2016 by The Human Animal Bond Research Institute (HABRI) Foundation in partnership with Cohen Research Group (n = 1,995 pet owners), which had a margin of error of plus or minus 2.2%.

7   © 2018 IDEXX Laboratories, Inc. All rights reserved.
IDEXX Growth Strategy - Jonathan Ayers, Chairman and CEO IDEXX Investor Day I August 15, 2018
Pets Improve People’s Health – The Evidence Continues to Build

                     Cardiovascular Health*                                                                Mental Health                                                                      Longevity***

         American Heart Association                                                     74% of pet owners reported mental                                                     Clear correlation between dog
         issued a scientific statement                                                  health improvements from pet                                                          ownership and longer life
         that pet ownership improves                                                    ownership**
         heart health

     * Levine, Glenn N., et al. "Pet Ownership and Cardiovascular Risk A Scientific Statement From the American Heart Association." Circulation 127.23 (2013): 2353-2363. http://circ.ahajournals.org/content/early/2013/05/09/CIR.0b013e31829201e1
     ** The Human Animal Bond Research Institute (HABRI) partnered with Cohen Research Group to conduct an online survey in May 2016 of 2,000 pet owners, which had a margin of error of plus or minus 2.2%.
     *** Mubanga, Mwenya, et al. "Dog ownership and the risk of cardiovascular disease and death–a nationwide cohort study." Scientific reports 7.1 (2017): 15821. https://www.nature.com/articles/s41598-017-16118-6

8   © 2018 IDEXX Laboratories, Inc. All rights reserved.
IDEXX Growth Strategy - Jonathan Ayers, Chairman and CEO IDEXX Investor Day I August 15, 2018
Millennials have become the ‘Pet Generation’

                                                                                                         Millennial Pet Owners’ Attitudes and Behaviors:

                                                                                                         ▪ 43% Refer to their pet as their “Fur Baby”**
                                                                                                         ▪ 71% Would take a pay cut to take their pets to work
                                                                                                                  every day***

                                                                                                         ▪ 33% of first home buyers cited ‘better space/ yard for
                                                                                                                  their dog’ as a major driver of their decision to purchase -
                                                                                                                  more than the number citing marriage or children as a
                                                                                                                  driver ****
         Millennial Segment is the Largest Pet-
         Owning Demographic Segment*

    *    American Pet Products Association National Pet Owners Survey 2017-2018.
    **   Survey commissioned by Trupanion, a leader in medical insurance for cats and dogs, and conducted from October 3 to October 6, 2017. Participants were required to own a dog or cat and be at least 18 years old. The survey had 1,250
         participants. 825 were from the United States and 425 from Canada.
    *** The Millennialization of the Pet Industry - Retail’s Opportunity to Reach the Pet-Obsessed
    **** SunTrust Mortgage online survey conducted by Harris Poll, June 28-30, 2017.

9   © 2018 IDEXX Laboratories, Inc. All rights reserved.
IDEXX Growth Strategy - Jonathan Ayers, Chairman and CEO IDEXX Investor Day I August 15, 2018
Early Indications are that Gen Z Love their Pets At Least As Much

                                                                         Baby Boomers                                                    Millennials                                                     Gen Z
               U.S. Pet Owner Survey*                                                (54 yrs to 72 yrs)                                        (22 yrs to 37 yrs)                                         (Up to 21 yrs)

                           Celebrate Their Pet’s                                     48%                                                                            83%                                                          93%
                                       Birthday

               Celebrate Valentine’s Day 18%                                                                                                 44%                                                                   67%

                                                                   0%        20%       40%         60%      80%       100% 0%          20%        40%        60%       80%        100%0%         20%       40%        60%        80%       100%

     * Survey commissioned by Trupanion, a leader in medical insurance for cats and dogs, and conducted from October 3 to October 6, 2017. Participants were required to own a dog or cat and be at least 18 years old. The survey had 1,250
       participants. 825 were from the United States and 425 from Canada.

10   © 2018 IDEXX Laboratories, Inc. All rights reserved.
Millennial and Gen Z Are Highly Sensitive to the Needs of their Pets

                                                   U.S. Pet Owner Survey*:
                                                 % Agreeing with Statement
                                                                                                   Baby Boomers                                 Millennials & Gen Z
                                                                                                              (55 yrs to 74 yrs)                           (18 yrs to 39 yrs)

                       “I rely on my veterinarian for advice
                                                                                                                       65%                                                      75%
                                about medicine and pet food”

                           “My pet has special health needs”                                    19%                                                        42%

                     “My pet has special nutrition needs”                                       20%                                                        45%

                                                                                             0%        20%       40%         60%   80%   100%   0%   20%        40%         60%       80%   100%

     * Based on: Gen Z and Millennials as Pet Market Consumers: Dogs, Cats and Other Pets, Packaged Facts, February, 2018.

11   © 2018 IDEXX Laboratories, Inc. All rights reserved.
U.S. Market Backdrop: Pet-related Spending Growth has Significantly
     Outpaced Personal Consumption
                 U.S. Personal Consumption Expenditure for Key Categories*                                                                                                    CAGR**
                 Indexed (1959 = 100)                                                                                                                                        1959-2017

     30,000                                                                                                                                                Veterinary and
                                                                                                                                                          Related Services       10.3%
     25,000

     20,000

     15,000
                                                                                                                                                     Pets and Related Products 8.6%

     10,000
                                                                                                                                                               Dental Services    7.5%
      5,000
                                                                                                                                   Total Personal Consumption Expenditure (PCE) 6.7%
             0
                 1959             1964              1969     1974      1979          1984         1989         1994         1999    2004   2009    2014 2017

                                                      Yet, veterinary services, pets and related products together still
                                                            comprise only ~1% of total consumption expenditure
      * Analysis based on data from Bureau of Economic Analysis last revised on May 30, 2018.   ** Compound Annual Growth Rate.

12    © 2018 IDEXX Laboratories, Inc. All rights reserved.
U.S. Market Backdrop: Pet Healthcare Bounces Back Faster and Thrives
     during Expansions
                Year-over-year Growth (%)*                                                                                                                                          CAGR
                                                                                                                                                                                  1979-2017
                                           U.S. Veterinary and Related Services CAGR ‘Premium’ over PCE Growth
              20%
                            + 350 bps                       + 240 bps                          + 450 bps                              + 460 bps             + 320 bps             + 340 bps

              15%                                                                                            Veterinary and
                                                                                                             Related Services

              10%
                                                                                                                                                                                   9.2%
                                                                                                                                                                                   6.4%
                 5%                         Total Personal                                                                                                                         5.8%
                                            Consumption Expenditure
                                                                                                                                        Dental
                                                                                                                                        Services
                 0%

               -5%
                        1979                   1983         1987             1991            1995         1999                     2003         2007      2011         2015
                                                Expansion                                      Expansion                               Expansion                Expansion
                                              (1980 – 1989)                            (Mar. 1991 – Mar. 2001)                  (Nov. 2001 – Dec. 2007)   (Jun. 2009 - Present)

     * Analysis based on data from Bureau of Economic Analysis, Personal Consumption Expenditure, last revised on January 26, 2018.

13   © 2018 IDEXX Laboratories, Inc. All rights reserved.
All Signs Point to a Second 25-Year Generational Macro-Cycle of Global Growth
                                                                                                                                                                                                                                  Reasonable Scenario:
                                                                                                                                                                                                                          In 2042, International reaches U.S.
                                                                                                                                                                                                                              2017 level of Dx utilization**
                                  Estimated Worldwide Companion Animal Diagnostic Spending ($M)*
                                                                                                                                                                                                                                               CAGR
                                                                                                                                                                                                                                            2017 - 2042
                                                                                                                                                                                                            $24B
                                                                                                                             Reasonable Scenario:
                                                                                                                            High Single-digit Growth

                                                                                                                                             ~ 8%
                                                                                                                                              CAGR                                                                      International            ~10%

         VetTest
         Chemistry
         Analyzer
         Launched                                                                                      $3.5B
                                                                                                                                                                                                                        U.S.                    ~ 6.5%

                                     PHASE I: ‘Setting the Foundation’                                                             PHASE II: ‘Raising Standard of Care’
                                                            25 years                                                                                           25 years
     * Revenue estimated at the manufacturer level. Includes reference lab, telemedicine, in-house instruments and consumables, rapid assay, manual microscopy and ‘similar’ types of diagnostics through 2042. Excludes veterinary software, digital and ultrasound.
        Figures stated in USD, based on 2017 average exchange rates.
     ** Defined as average diagnostic revenue per practice.

14   © 2018 IDEXX Laboratories, Inc. All rights reserved.
Vet Healthcare Spending Averages 0.3% of Total Household Spending

                              2017 U.S. Total Pet Spending as a Percentage of Household Consumption Spending
                                                       by Household Income Segment*

                                                                                                                                                                             Veterinary Service
                                                                                                                                                                                 Spending
                                                                            1.1%                              1.1%                              1.0%           1.1%              ~0.3%
                                                   0.9%                                                                                                                        of Household
                                                                                                                                                                                 Spending

                                                   < $20k               $20 - 39k                           $39 - 65k                      $65k – 109k      $109k or more
                                                                                                                                               Average Consumer Unit Income per Year

           Number of                                  26M                     26M                                26M                              26M            26M
          Households

     * Analysis based on Bureau of Labor Statistics Personal Consumption Expenditure Survey, for 12 months ended June, 2017. Total Spending = $7.4T USD.

15   © 2018 IDEXX Laboratories, Inc. All rights reserved.
We Lead with Best-in-Class Offerings in Each Diagnostic and
     Software Modality and with Global Scale
                                        Estimated 2017 Total Companion Animal Diagnostic and Veterinary Software Spending ($M)*

                                                            Canada

                                                                                                                                          EMEA

                                                                                                                                                                                    China
                                                                                                                                                                                                                Japan
                                                    U.S.
                                                                                                                                                                        Other
                                                                                              ~40%                                                                      Asia
                                                                                              $1.7 B

                                                                      Latin
                                                                     America
                                                                                                                                                                              Australia &
                                                                                                                                                                              New Zealand

* Revenue estimated at the manufacturer level, adjusting to reflect distributor margin where appropriate. Includes reference lab, telemedicine, in-house instruments and consumables, rapid assay, manual microscopy.

16   © 2018 IDEXX Laboratories, Inc. All rights reserved.
IDEXX’s Innovation has Created a Highly Proprietary Diagnostic Offering

      Comparison of Annual R&D Investment of Major Veterinary Diagnostics Companies
      ($M), calendar years shown

     120
                                                                                                                                                                                                                                    109
                                                                                                                                                                                                                       98 100 101
     100
                                                                                    IDEXX Invests More than 80% of                                                                                            88
                                                                                  Identifiable Diagnostic Industry R&D                                                                                 82
       80

       60

       40

                                                                                                                                                                           19      23
                                                                                                                                                           15      18
       20                                                                                                                                   13      14

                         *        *       *          *      *                     1       2      1       2       2       2
         0
                    2012 2013 2014 2015 2016                                   2012 2013 2014 2015 2016 2017                               2012 2013 2014 2015 2016 2017                             2012 2013 2014 2015 2016 2017

                                      VCA*                                                     Heska                                                     Abaxis**                                       IDEXX Laboratories

     * VCA does not report any R&D investments in its filings with the U.S. Securities and Exchange Commission (“SEC”). Following acquisition of VCA, Inc. by Mars in 2017, there are no further public disclosures.
     ** Abaxis, Inc. was acquired by Zoetis, Inc. July 31, 2018.
     Sources: Company SEC filings; earnings releases.

17   © 2018 IDEXX Laboratories, Inc. All rights reserved.
IDEXX VetLab Instrument Suite - Innovation that Uniquely Expands Utility
     Fully-Integrated Diagnostic Solution with IDEXX Reference Lab Ordering and Results Through
     VetConnect® PLUS
                                                                            IDEXX VetLab Station                                      IDEXX
                                                                                                                                      Reference Lab
                                                                                                                                      Results
                                 Practice
                                Management
                                  System
                                                            2-Way Integration

                        Catalyst One®                           ProCyte Dx®                   SediVue Dx®         SNAP Pro®
                        Chemistry, T4,                         IDEXX CBC: Retics,              Urine Sediment   Automating the SNAP
                          Electrolytes,                         Retic-Hgb, Bands                                      Family
                     Catalyst® SDMA, CRP
18   © 2018 IDEXX Laboratories, Inc. All rights reserved.
Preventive Care Bloodwork – The Medical Evidence from Big Data

                                                                            CBC
         Wellness
          exam
                                                                          CHEM 22
                                                                           SDMA
                                                                                        Analysis
                                                                                                              ?
      268,817 visits                                                                76% dogs; 24% cats         What
     5,016 practices                                                                                       Proportion
                                                                                                             Indicate
                                                                                                         Potential Health
                                                                                                           Concerns?
      Source: Data on file at IDEXX Laboratories, Inc. Westbrook, Maine USA.

19   © 2018 IDEXX Laboratories, Inc. All rights reserved.
Preventive Care Bloodwork Frequently Uncovers Significant Findings
     268,817 visits from 5,016 practices

 1 in 7 adults
 dogs aged 3–6 years;
 cats aged 2–8 years

 1 in 5 seniors                                             Preventive care profiles (Chem 22 with CBC and
 dogs aged 7–10 years;                                      IDEXX SDMA); revealed that three or more clinically
 cats aged 9–13 years                                       significant findings and/ or 1 abnormal SDMA were
                                                            evident in patients from adult to geriatric life stages –
                                                            requiring veterinary follow-up (adults: 15%; seniors:
                                                            21%; geriatrics: 42%).

 2 in 5 geriatrics                                          Testing completed on samples from 268,817
                                                            wellness consultations from 5,016 clinics using
 dogs aged 11+ years;                                       IDEXX Reference Laboratories. Data on file at
 cats aged 14+ years                                        IDEXX Laboratories, Inc. Westbrook, Maine USA.

20   © 2018 IDEXX Laboratories, Inc. All rights reserved.
The Addition of IDEXX SDMA is Essential to the Value of
 Preventive Care Bloodwork

                                  Adults                                                                      Seniors                                                                           Geriatrics
                                                                                                                        40%                                                                                40%
                                           70%
                                                                                                                                                                                                                              43%
                                                                                                                                                                                        30%
                                                                                                                                           21%
                                                              15%                                    15%
                      9%

        Chem 22 + CBC                                       Plus SDMA                      Chem 22 + CBC                             Plus SDMA                                Chem 22 + CBC                              Plus SDMA
       Based on analyses of combined dogs and cats; 268,817 profiles; 5,016 North American veterinary clinics using IDEXX Reference Laboratories. Profiles defined as “wellness” based on invoice to pet owner. “Clinically significant changes” are those
       that would indicate the need for follow-up, further consideration, or a change in action by the clinician. Clinical significance based on rules determined by IDEXX veterinarian panel.
       Source: Data from July 2015 to March 2017. Data on file at IDEXX Laboratories, Inc. Westbrook, Maine USA.

21   © 2018 IDEXX Laboratories, Inc. All rights reserved.
IDEXX SDMA Also Adds Significant Value to Non-Wellness Testing
     Percentage of Patients with Clinically Significant Increases in Creatinine or SDMA (non-wellness visits)

                                   Adults                                                                   Seniors                                               Geriatrics
                                                                                                                                                                         109%
                                                                                                                                                                              28%
                                       110%                                                                        124%

                                                                                                                                     12%                          14%
                                                             9%
                           4%                                                                           5%

                    Creatinine                               SDMA                                Creatinine                        SDMA                          Creatinine   SDMA

       Source: Based on analyses of a sample of 1,018,286 patients, 72.8% canine and 27.2% feline, using IDEXX Reference Laboratories diagnostic results data.

22    © 2018 IDEXX Laboratories, Inc. All rights reserved.
Why Does the Addition of Just SDMA Testing Increase the Findings so Much?
An Increased SDMA Reflects Both Kidney Disease and Other Diseases that Impact Kidney Function

                                                                            Diabetes          Chronic Kidney Disease

                                                            Infections sepsis
                                                             (Lyme nephritis)                             Urinary Track Infection
                                                                                                          (pyelonephritis)
                                                                   Cancer
                                                                                       SDMA                  Obstruction
                                                                                                             (ureteral and urethral)
                                                             Hypertension

                                                                                                         Kidney stones
                                                   Cardiorenal syndrome
                                                                                                 Active Kidney Injury
                                                                        Hyperthyroidism          due to medications
23   © 2018 IDEXX Laboratories, Inc. All rights reserved.
Catalyst SDMA Launched in January, 2018

                                                                                                IDEXX SDMA® at the
               Over 50%                                                                           Reference Lab*:
     of Catalysts globally
         have already                                                                            Over 17 Million
          purchased*

                                       Increasing Recognition as an Essential Element of the Chemistry Panel
      * As of August 3, 2018.

24   © 2018 IDEXX Laboratories, Inc. All rights reserved.
SediVue Dx - Urinalysis Plays a Role in Both Sick and Wellness Visits

                                                                                                                    1 in 3 urinalyses in wellness visits have
                                                                                                                    significant findings*

                                                                                                                    Wellness urinalysis addressable market
                                                                                                                    barely penetrated today

                                                                                                                    5,200 instruments placed to date used
                                                                                                                    primarily for sick animal differential
                                               STR              STR                                                 diagnoses

     * IDEXX study of 3,000 patients coming in for a wellness visit with the inclusion of a SediVue urine sediment exam as part of a complete urinalysis.

25   © 2018 IDEXX Laboratories, Inc. All rights reserved.
Fecal Antigen Presents a ~$600 Million Total Addressable Annual Market
     Opportunity*
                                              2017 North America Companion Animal
                                                 Estimated Fecal Testing Market
                           91                                    (Millions Annually)

                                                                                                                                   Hookworm     Roundworm     Whipworm
                                                            66

                                                                                          40
                                                                                                                                              Less than 4%
                                                                                                                                               of fecal tests run
                                                                                                                                              today benefit from
                                                                                                                     1.5                        Fecal Antigen
                                                                                                                                                  Technology
                    Number                           Number of Canines             Number of                    Number of Fecal
                   of Canines                           with at Least              Fecal Tests                   Antigen Tests
                                                       1 Clinical Visit              Run**                       Run in 2017 ***
     * Assume $15 average price realized per test, and 40 million tests run in North America
     ** Estimated total number of fecal tests run in North America in-practice and at reference labs.
     *** Total fecal tests run at North America IDEXX Reference Labs that include IDEXX Fecal Antigen technology.

26   © 2018 IDEXX Laboratories, Inc. All rights reserved.
IDEXX Fecal Antigen – The Medical Evidence

                  Uncovers

                          2x                                                                                                ▪ Fecal antigen uncovers underlying
                Underlying
                                                                  3.4%                                                        intestinal parasite infections missed
                infections                                      IDEXX                                                         by microscopy used in the
                                                                 Fecal                                                        reference labs
                                                                Antigen
                                                                Panels                                                      ▪ Fecal antigen – IDEXX-proprietary
                                     1.7%
                                                                  (IDEXX
                                Traditional                      Reference                                                  ▪ A fecal test is a core element of the
                                                                   Labs)
                                Microscopy                                                                                    routine semi-annual exam
                                  Panels
                               (IDEXX Reference
                                    Labs)
                                                                                                                            ▪ Built into all IDEXX Preventive Care
                                                                                                                              Challenge panels
          Hookworm, Roundworm and Whipworm Infections*
     * Analysis based on a sample of 442,884 canines, presenting for preventive care visits with fecal exams sent to IDEXX Reference Labs between December, 2015 and June, 2018.

27   © 2018 IDEXX Laboratories, Inc. All rights reserved.
Fecal Antigen in IDEXX Reference Labs – Early Stages of Adoption
       North America Reference Lab Fecal Testing Revenue ($M)

                                                                                                    $120 Million
                                                                                                     Incremental
                                                                                                        Annual
                                                                                    Panels with        Revenue
                                                                                    IDEXX
                                                                                    Fecal Antigen   Opportunity in
                                                                                    Traditional       Five Years
                                                                                    Parasitology
                                                                                    Panels
                                                                                *

     * All references to 2018 YTD mean January 1, 2018 through June 30, 2018.

28   © 2018 IDEXX Laboratories, Inc. All rights reserved.
IDEXX U.S. Transformation Has Expanded our Presence with Customers,
     Resulting in an Accelerated Rate of Adoption of IDEXX’s Proprietary
     Innovations
                                                                                                                                                                                                                       5-Year Revenue
                                                                                                                                                                                                                          Potential
                                                                                Rate of Organic Growth
                                                                                U.S. CAG Diagnostics                                                                                                                        9% - 13%
                                                                                Recurring Revenue 2,3,5                                                          + 13%                                                     Compound Annual
                                                                                                                                                                                                                             Growth Rate
                                                                                                                                                                                        490
                                                                                                                                               435                  445
                                                                                                                          390                                                                            Total U.S. CAG Field-
                                                                                                     358                                                                                                  Based Professional
                   + 8%                                                                                                                                                                                       Headcount*
                                                            235                  248
                     215                      215

                    2011                     2012           2013                2014                 2015                2016                 2017                 2018 ** 2018E ***
                                                                                                                                                                     YTD
     * Includes all field-based sales and technical services headcount, excluding management. Figures as of December 31 of each calendar year.
     ** All references to 2018 YTD mean January 1, 2018 through June 30, 2018.       *** All references to 2018E reflect the midpoint of 2018 outlook communicated August 1, 2018. Please refer to our Safe Harbor Disclaimer.
     3 Please refer to the Appendix for descriptive footnotes. 2, 5 Non-GAAP financial measure, please refer to Appendix for descriptive footnotes.

29   © 2018 IDEXX Laboratories, Inc. All rights reserved.
Our Expanding International CAG Commercial Presence has Supported
     Accelerated CAG Dx International Recurring Revenue Growth
                                                                                                                                                                                                                    5-Year Growth Rate
                                                                                                                                                                                                                         Potential

                                                                         Rate of Organic Growth                                                                                                                           12% - 16%
                                                                                                                                                                  + 14%                                                    Compound Annual
                                                                            International CAG                                                                                                                                Growth Rate

                                                                          Diagnostics Recurring
                                                                               Revenue 2,3,5
                                                                                                                                                                                                           Total International
                                                                                                                                                                                        390                CAG Field-Based
                                                                                                                                               340                  360
                    + 7%                                                                                                                                                                                     Professional
                                                                                                                          284                                                                                 Headcount*
                                                                                                     245
                                                            202                  217
                     175                      183

                    2011                     2012           2013                2014                 2015                2016                 2017                 2018 ** 2018E ***
                                                                                                                                                                   YTD
     * Includes all field-based sales and technical services headcount, excluding management. Figures as of December 31 of each calendar year.
     ** All references to 2018 YTD mean January 1, 2018 through June 30, 2018.       *** All references to 2018E reflect the midpoint of 2018 outlook communicated August 1, 2018. Please refer to our Safe Harbor Disclaimer.
     3 Please refer to the Appendix for descriptive footnotes. 2, 5 Non-GAAP financial measure, please refer to Appendix for descriptive footnotes.

30   © 2018 IDEXX Laboratories, Inc. All rights reserved.
Catalyst Placements Continue to be the Key Growth Driver Outside of
     North America, with Strong Runway for Foreseeable Future
          Catalyst Analyzer Placements Outside North America

                                                                   Catalyst loyalty rates
                                                                   exceeding 99%!

                                                               *

      * 2018YTD reflects placements through June 30, 2018.

31   © 2018 IDEXX Laboratories, Inc. All rights reserved.
Continued 10%+ Annual Revenue Growth Potential
     Driven By Expansion of CAG Diagnostics Recurring Revenue

      IDEXX Total Company Annual Revenue Growth Potential 2023 vs. 2018E,                                                                                            ~2023
      Constant Currency*                                                                                                                                            Revenue
                                                                                                                                                       6% - 8%***
                                                                                                              8% - 12%***
                                                                        12% - 16%***                                                                                          10%+
                                                                                                                                                                         Compound Annual
                                                                                                                                                                           Growth Rate

                                                  9% - 13%***

             2018E**
             Revenue
                $2.218B

                                                     U.S.                International                     Veterinary                    CAG Capital   LPD, Water
                                                    CAG Dx                 CAG Dx                      Software & Digital                               & Other
                                                                    CAG Recurring3
      * These projections assume that foreign currency exchange rates will remain the same as in 2018.
      ** 2018E Revenue based on midpoint of guidance range communicated on August 1, 2018. Please refer to our Safe Harbor Disclaimer.
      *** Estimated potential revenue compound annual growth rate for this business segment.
      3 Please refer to the Appendix for descriptive footnotes.

32   © 2018 IDEXX Laboratories, Inc. All rights reserved.
IDEXX – Exceptional, Durable Growth
                                                            and Returns

                                                                         An Enduring Recurring
                                                                         Revenue Model with
                                                                         ... exceptionally long-run
                                                                              growth dynamics...
                                                                         ... accelerated by IDEXX’s
                                                                              unique innovation and
                                                                              growing commercial
                                                                              model...
                                                                         ... generating exceptional
                                                                              financial returns.

33   © 2018 IDEXX Laboratories, Inc. All rights reserved.
IDEXX Financial Review
Brian McKeon, Executive Vice President and CFO
34
                                IDEXX Investor Day I August 15, 2018
     © 2018 IDEXX Laboratories, Inc. All rights reserved.
Financial Review – Key Messages

     Accelerated growth, overdelivering against our
     long-term financial goals

     Tremendous, long-term potential in developing
     core CAG business

     Increasing high-return investments aligned
     with growth opportunity

     Well positioned to deliver continued strong
     long-term financial results

35   © 2018 IDEXX Laboratories, Inc. All rights reserved.
We are Over-Delivering Against our Long-term Financial Goals
     Introduced in 2015

                                                                                         Multi-Year Goals                                   2016                              2017                               2018E *

       Organic Revenue Growth5                                                                        10%+                                 11.4%                             10.4%                       11.5% - 12.5%

       Operating Margin Gain                                                                       50 bps+                               170 bps                           140 bps                         90 - 130 bps
       (Adjusted Constant Currency)7

       EPS Growth                                                                               15% - 20%                                    25%                               21%                              32% - 36%
       (Comparable Constant Currency)6

       Capital Allocation Leverage **                                                              1% - 3%                                    3%                               ~2%                                ~1%

       Free Cash Flow8 % of Net Income                                                         95% - 100%                                   130%                              114%                              70% - 75%

     *All references to 2018E reflect the midpoint of 2018 outlook communicated August 1, 2018. Please refer to our Safe Harbor Disclaimer.
     ** 2017 reflects normalized year-over-year share count reduction which adjusts for impact of adopting ASU 2016-09, Compensation-Stock Compensation (Topic 718). Reported share count reduction was 1.4%.
     5,6,7,8 Non-GAAP financial measure, please refer to Appendix for descriptive footnotes.

36    © 2018 IDEXX Laboratories, Inc. All rights reserved.
Strong Execution Yielding Outstanding Returns

                      After-Tax Return on Invested Capital, Excluding Cash & Investments9

                                                                                                                                                      48%
                                                                                                                                               42%
                                                                                                                            34%
                                       29%                                       29%

                                                                                                                                                              *
                                        2014                                      2015                                      2016               2017   2018E

     * All references to 2018E reflect the midpoint of 2018 outlook communicated August 1, 2018. Please refer to our Safe Harbor Disclaimer.
     9 Non-GAAP financial measure, please refer to Appendix for descriptive footnotes.

37    © 2018 IDEXX Laboratories, Inc. All rights reserved.
Overall Growth has Accelerated to 10%+
     Driven by CAG Diagnostics Recurring Annuity Gains

             Annual CAG Diagnostics Recurring Normalized Organic Revenue Growth2,3,5

                                                                         Growth before Normalization for Changes
                                                                       in Distributor Inventory and Margin Capture
                                                                                    Related to 2015 U.S. Go-Direct

                                                                                                                                                           *

     * All references to 2018 YTD mean January 1, 2018 through June 30, 2018.
     2,5   Non-GAAP financial measure, please refer to Appendix for descriptive footnotes.   3   Please refer to the Appendix for descriptive footnotes.

38    © 2018 IDEXX Laboratories, Inc. All rights reserved.
Durability of CAG Recurring Annuity Continues to Strengthen

          Annual U.S. Customer Revenue Retention Rates

                                                                                                                      Catalyst®
                                                                                                         98.3%
                                                                                                98.1%                 Consumables
                                                                                        97.7%
                                97.4%
                                                                                                                      Reference Lab
                                                                                                         97.2%
                                                             96.4%
                                                                                96.1%           96.7%
                                                             96.2%
                                                                                95.8%   95.8%

                                94.6%

                                                                                                                  *
                                2013                         2014               2015    2016    2017    2018YTD

     * All references to 2018 YTD mean January 1, 2018 through June 30, 2018.

39    © 2018 IDEXX Laboratories, Inc. All rights reserved.
Key Growth Drivers: Global Catalyst Installed Base Expansion

                                                             Worldwide Catalyst Installed Base
                                                              Number of Active Installed Catalysts
                                                                                   Catalyst One
                                                                                     Launch

                                                                                                         North
                                                                                                         America
                                  Catalyst Dx
                                   Launch

                                                                                                         International**

                                                                                                     *

     * 2018 YTD as of June 30, 2018.
     ** International installed base excluding Canada.

40    © 2018 IDEXX Laboratories, Inc. All rights reserved.
Key Growth Drivers: Accelerated U.S. Reference Laboratory Growth

          U.S. Reference Lab Organic Revenue Growth by Driver5,*

                                                                                                                                            15%                          15%
                                                                                                      14%
                                                               13%                                                                                                                 Price
                        11%
                                                                                                                                                                                   Net Customer
                                                                                                                                                                                   Acquisition

                                                                                                                                                                                   Same Customer
                                                                                                                                                                                   Volume

                                                                                                                                                                               *

     * Includes U.S. Reference Lab revenue. International Reference Lab organic revenue will be discussed in the IDEXX Reference Labs presentation on August 16, 2018.
     ** All references to 2018 YTD mean January 1, 2018 through June 30, 2018.
     5 Non-GAAP financial measure, please refer to Appendix for footnotes.

41    © 2018 IDEXX Laboratories, Inc. All rights reserved.
Key Growth Drivers: Greenfield Innovation
     Creating Large, New CAG Franchises …

                                                Worldwide Sedivue Dx Installed Base
                                                 Number of Active Installed SediVue Dx Instruments
                6,000

                5,000

                4,000

                3,000

                2,000

                1,000

                      0
                                Q2             Q3            Q4   Q1    Q2     Q3      Q4      Q1       Q2

                                            2016                          2017                       2018

42    © 2018 IDEXX Laboratories, Inc. All rights reserved.
Key Growth Drivers: Greenfield Innovation
     … Which Drive Enduring, High Margin Annuity Revenues

                                                                Worldwide Sedivue Dx Recurring Revenue ($M)*

                                                             2016                                                            2017                       2018
      * SediVue Dx Recurring Revenue is reported within CAG Diagnostics recurring revenue and includes Sedivue consumables, services and accessories.

43    © 2018 IDEXX Laboratories, Inc. All rights reserved.
Key Growth Drivers: Enhanced Direct Commercial Capability

                             Total U.S. and International CAG Field-Based Professional Headcount*

                                                                                                                                                        880
           900
           800                                                                                                   2x                              775
           700                                                                                                                   674
                                                                                                 603                                                               U.S.
           600
           500                   437                            465
           400
           300                                                                                                                                                     International
           200
           100
               0
                                 2013                           2014                            2015                            2016             2017   2018E **
     * Includes all field-based sales and technical services headcount, excluding management. Figures as of December 31 of each calendar year.
     ** Estimated number of U.S. and International CAG field-based reps at the end of 2018.

44    © 2018 IDEXX Laboratories, Inc. All rights reserved.
High Incremental Return on CAG Organic Growth Investments
     Global CAG Incremental Opex & Gross Profit
     2014 vs. 2018E* (Constant Currency)4

                                                                                                                                  ▪ “To Date” Incremental ROIC 120%+

                                                                                                                                  ▪ Estimated Annuity NPV => 6x
                                                                                                                                    Incremental Opex

                                             Total Opex
                                             Investment                            Gross Profit
     2014 – 2018E*                                                                                                       Incremental ROIC: Compares actual CAG Dx recurring revenue growth over period versus base growth of 8% over period.
                                                                                                                         We assume 60% gross margins on the incremental revenue growth and tax rate of 22%. The after tax gross profit is divided
     Constant Currency                           ~10%                                  ~15%                              by the after tax incremental operating expense investment over the period to obtain incremental ROIC. The incremental
                                                                                                                         OPEX is calculated by taking actual CAG Segment OPEX over period less base OPEX growth at 6% to align with 8% base
     CAGR (%)4                                                                                                           revenue growth. Estimated NPV multiple: Defined at present value of after tax gross profit net of maintenance OPEX equal
                                                                                                                         to 20% of 2018 ending OPEX over 40 year horizon (inverse of 97%-98% retention rate) discounted at 7% cost of capital.
     • 2018E Revenue based on midpoint of guidance range communicated on August 1, 2018. Please refer to our Safe Harbor Disclaimer.
     4 Non-GAAP financial measure, please refer to Appendix for footnotes.

45    © 2018 IDEXX Laboratories, Inc. All rights reserved.
Continued 10%+ Annual Revenue Growth Potential
     Driven by Expansion of CAG Diagnostics Recurring Revenue

      IDEXX Total Company Annual Revenue Growth Potential 2023 vs. 2018E,                                                                                            ~2023
      Constant Currency*                                                                                                                                            Revenue
                                                                                                                                                       6% - 8%***
                                                                                                              8% - 12%***
                                                                        12% - 16%***                                                                                          10%+
                                                                                                                                                                         Compound Annual
                                                                                                                                                                           Growth Rate

                                          9% - 13%***

            2018E**
            Revenue
              $2.218B

                                             U.S.                        International                     Veterinary                    CAG Capital   LPD, Water
                                            CAG Dx                         CAG Dx                      Software & Digital                               & Other
                                                                    CAG Recurring3
      * These projections assume that foreign currency exchange rates will remain the same as in 2018.
      ** 2018E Revenue based on midpoint of guidance range communicated on August 1, 2018. Please refer to our Safe Harbor Disclaimer.
      *** Estimated potential revenue compound annual growth rate for this business segment.
      3 Please refer to the Appendix for descriptive footnotes.

46    © 2018 IDEXX Laboratories, Inc. All rights reserved.
High U.S. CAG Diagnostics Recurring Revenue Growth Potential
Driven by Strong Market Growth, Customer Acquisition and Innovation

     IDEXX U.S. CAG Dx Recurring Revenue
                                                                                                                                                                        ~2023
     Annual Growth Potential – Next Five Years                                                                                                                         Revenue
                                                                                                                                                     2.5% - 4%***
     Constant Currency*
                                                                                                                                                                             9% - 13%
                                                                                                                                                                            Compound Annual
                                                                                                                                  1% - 2%***                                  Growth Rate

                                                                                                   1% - 2%***

                                                                         ~2%***

                                           ~2.5% - 3%***
                  2018E**
                  Revenue

                                                 Pet Visit               Price                           Dx                       Net Customer   New and Incremental
                                                 Growth                Realization                  Utilization                     Additions     Revenue Streams

     * These projections assume that foreign currency exchange rates will remain the same as in 2018.
     ** 2018E Revenue based on midpoint of guidance range communicated on August 1, 2018. Please refer to our Safe Harbor Disclaimer.
     *** Estimated contribution to U.S. CAG Dx Recurring Revenue potential compound annual growth rate from this driver.

47   © 2018 IDEXX Laboratories, Inc. All rights reserved.
Higher International CAG Diagnostics Recurring Revenue Growth Potential
     Supported by Catalyst Expansion

      IDEXX International CAG Dx Recurring Revenue                                                                                                          ~2023
      Annual Growth Potential Next Five Years                                                                                                              Revenue
                                                                                                                                            2% - 3%***
      Constant Currency*
                                                                                                                                                                 12% - 16%
                                                                                                             4% - 5%***                                          Compound Annual
                                                                                                                                                                   Growth Rate

                                                             6% - 8%***

                  2018E**
                  Revenue

                                                      “Base” Market                                          Catalyst                        New and
                                                         Growth                                             Expansion                      Incremental
                                                                                                             Benefit                     Revenue Streams
      * These projections assume that foreign currency exchange rates will remain the same as in 2018.
      ** 2018E Revenue based on midpoint of guidance range communicated on August 1, 2018. Please refer to our Safe Harbor Disclaimer.
      *** Estimated potential revenue compound annual growth rate from this driver.

48    © 2018 IDEXX Laboratories, Inc. All rights reserved.
Key Growth Drivers: Greenfield and New Innovation
     IDEXX Greenfield and New Innovation – Annual Contribution to Revenue Growth ($M)
     Estimated Achievement & Future Potential
                                                                                                                                                        Fecal
                                                                                                                                                       Antigen
                                                                                                                                                                         New
                                                                                                                                                        +1%

                                                                                                                                        SediVue
                                                                                                             IDEXX SDMA                 + 0.5%
                                                                                                              +1% - 1.5%

                                                                       Other New
                                                       Fecal           Products(1)
                                                      Antigen
                                                                        + 0.5%
                              SediVue®                + 0.5%
IDEXX SDMA®                     + 1%
    + 1%

                                        2018E* vs. 2015                                                                                      2023E vs. 2018E
                                                     ~ 3%                                                                                         2.5% to 4%
                       Average annual contribution to growth rate                                                                   Average annual contribution to growth rate
      * 2018E Revenue based on midpoint of guidance range communicated on August 1, 2018. Please refer to our Safe Harbor Disclaimer.

49    © 2018 IDEXX Laboratories, Inc. All rights reserved.
Strong Growth Supports Operating Margin Gains

           Operating Margin, Reported and Adjusted Constant Currency4,7

     23%
                                                                                                                                                      Reported7
     22%                                                                                                                                              (Adjusted for Non-Recurring Items)

     21%
                                                                                                                                                      Adjusted Constant Currency7
     20%

     19%

     18%

     17%

     16%

     15%

     14%
                            2014                                 2015                                2016                                 2017   2018E*
     * All references to 2018E reflect the midpoint of 2018 outlook communicated August 1, 2018. Please refer to our Safe Harbor Disclaimer.
     4,7 Non-GAAP financial measures, please refer to Appendix for footnotes. Operating margin includes hedges.

50    © 2018 IDEXX Laboratories, Inc. All rights reserved.
Operating Margin Outlook
     Targeting Continued Solid Gains While Increasing Growth and Enabling Investments
        Margin Drivers                                                                                               2016-2018E*                            2019 Target                          Longer-Term Potential

        Gross Margin Expansion

          CAG Recurring Annuity Growth (Price & Mix)

          Lab Scale/Productivity

          Sourcing/Manufacturing (Cost/Mix)

          Growth Investments – Customer Acquisition, Capability & Capacity

        Operating Expense Leverage

          Sales & Marketing

          R&D

          IT

          G & A / Other

        Acquisition Impact

        Average Annual Adjusted Constant Currency
                                                                                                                 ~140 bps (avg)                          ~50 - 100 bps                                50 - 100+ bps
        Operating Margin Gains7
                                           Impact on operating margin:                             Positive                      Neutral                        Negative
     * 2018E Revenue based on midpoint of guidance range communicated on August 1, 2018. Please refer to our Safe Harbor Disclaimer.   4   Non-GAAP financial measure, please refer to Appendix for footnotes.

51    © 2018 IDEXX Laboratories, Inc. All rights reserved.
Increased Organic Capital Allocation

     Capital and Instrument Program Investments ($M)
                                                                                                                                               Key Drivers

                                                                                                                                               ▪ Accelerated program instrument
                                                                                                                Instrument programs
                                                                                                                                                 placements (IDEXX 360)
                                                                                                                Other capital                  ▪ Large facility projects (German
                                                                                                                                                 core lab, Westbrook HQ)
                                                                                                                Large facility projects
                                                                                                                                               ▪ Increased lab capacity and
                                                                                                                Manufacturing capacity &         enabling IT
                                                                                                                operations
                                                                                                                Facilities
                                                                                                                                               ▪ Expanded self-manufacturing
                                                                                                                Information technology
                                                                                                                                                 capacity
                                                                                                                Reference lab capacity &
                                                                                                                operations
                                                                                                           *

     * All references to 2018E reflect the midpoint of 2018 outlook communicated August 1, 2018. Please refer to our Safe Harbor Disclaimer.

52     © 2018 IDEXX Laboratories, Inc. All rights reserved.
Substantial U.S. Tax Reform Benefits Support Increased Investment

                           Effective Corporate Tax Rate (%)
                           30.9%

                                                                                                               U.S. Tax Reform
                                                                                                                                               ▪ Raises attractiveness of U.S.
                                                                                                               8 - 9% Rate Benefit               investment

                                                                   19.0% - 20.0%                                                               ▪ 8% - 10% increase in
                                                                                                                                                 operating cash flow
                                                                                                                                               ▪ Global investment flexibility
                                                                                                                                                 (reduced tax friction)

                            2017                                            2018E *

     * All references to 2018E reflect the midpoint of 2018 outlook communicated August 1, 2018. Please refer to our Safe Harbor Disclaimer.

53     © 2018 IDEXX Laboratories, Inc. All rights reserved.
Continued Strong Free Cash Flow Outlook

                                                                                                Free Cash Flow ($M)8
          350

          300

          250

          200

          150

          100

            50

              0
                                   2014                                      2015                                     2016                    2017   2018E *
                                    Expect 2018/2019 free cash flow conversion at 70% - 75% of net income
                                    (as we advance major projects and increase growth capital deployment)

     * All references to 2018E reflect the midpoint of 2018 outlook communicated August 1, 2018. Please refer to our Safe Harbor Disclaimer
     8 Non-GAAP financial measure, please refer to Appendix for footnotes.

54     © 2018 IDEXX Laboratories, Inc. All rights reserved.
Moderated Leverage Levels (Reflects Post-Tax Reform Optimization)

             Debt to Adjusted EBITDA10 Ratio

              3.5x

             3.0x

             2.5x
                                                                                                              Gross
              2.0x

              1.5x
                                                                                                               Net
              1.0x

              0.5x

                                 2012                        2013               2014   2015   2016   2017   2018 YTD*

     * All references to 2018 YTD mean January 1, 2018 through June 30, 2018.
     10 Non-GAAP financial measure, please refer to Appendix for footnotes.

55    © 2018 IDEXX Laboratories, Inc. All rights reserved.
Capital Allocation Aligned with Focus on Core Business Growth and
     Shareholder Value Creation
                                                                                         Capital Allocated to Share Repurchases (Annually, $M)
          • Emphasis on organic growth
                                                                                         $700
            investment
                                                                                         $600
          • Support focused acquisition
                                                                                         $500
            strategy (technology, lab and
            distributor fold-in’s)                                                       $400

                                                                                         $300
          • Allocation of excess capital to
            share repurchases (varied                                                    $200

            investment pace)                                                             $100

                                                                                           $0
                                                                                                2012   2013   2014   2015   2016   2017 2018 YTD *

                                 $2.3 billion                                   30% cumulative share count               $72 average
                               capital deployed                                        reduction                        purchase price
     * All references to 2018 YTD mean January 1, 2018 through June 30, 2018.

56    © 2018 IDEXX Laboratories, Inc. All rights reserved.
Well-Positioned to Drive Sustainable, Strong Financial Performance

           Long-Term Financial Model*
           (Average Annual Constant Currency Gains)

                          Revenue                                      Operating                                 Capital       Long-Term
                          Growth                                       Margin                                    Allocation    EPS Growth
                                                                       Expansion                                 Leverage      Potential**

                          10%+                                         50-100                                    +1%-2%        15%-20%
                                                                       bps                                       Incremental
                                                                                                                 EPS Growth

     * These projections assume that foreign currency exchange rates will remain the same as in 2018.
     ** EPS growth potential outlook excludes year over year changes in share-based compensation tax benefits.

57    © 2018 IDEXX Laboratories, Inc. All rights reserved.
IDEXX Veterinary Software & Services
                                        Mike Erickson, PhD, Corporate Vice President
                                                            IDEXX Investor Day I August 15, 2018

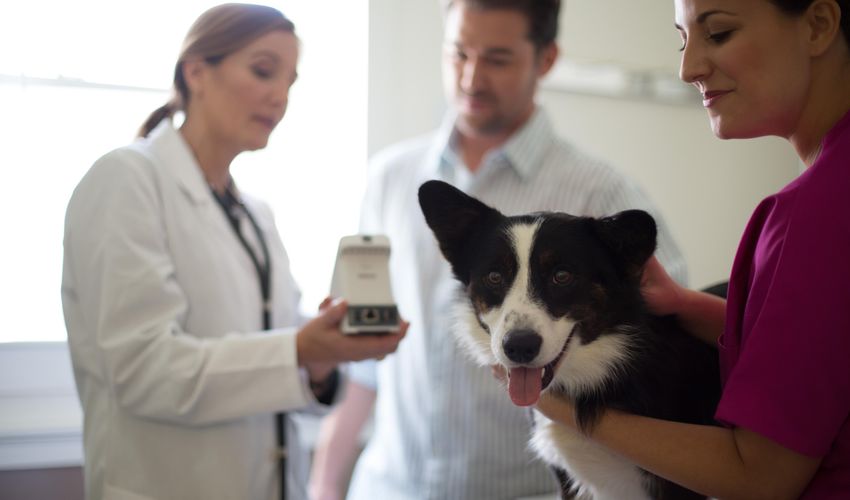
58   © 2018 IDEXX Laboratories, Inc. All rights reserved.
Veterinary Health Services are Inherently
 Information and Workflow Intensive

59   © 2018 IDEXX Laboratories, Inc. All rights reserved.
IDEXX Veterinary Software Provides Critical Tools for
 All Members of the Veterinary Team…

                              Practice Staff                                 Care Team                                 Corporate

                                   Practice Manager              Veterinarian                Technician            CIO and Group Manager

                      • Run the practice                    • Deliver care             • Run diagnostics         • Manage fragmented IT
                                                                                                                   environment
                      • Develop and manage staff            • Use tools that support   • Aid veterinarian,
                                                              care (EHR, VC+)            record care decisions   • Track performance
                      • Address technology gaps
                                                                                                                 • Evaluate and implement
                                                                                                                   tools

60   © 2018 IDEXX Laboratories, Inc. All rights reserved.
…And Supports Diagnostics Loyalty and Growth

 Our best customers
 use IDEXX software…
 • 2x IDEXX diagnostics
   per customer

 • Far more loyal to
   IDEXX diagnostics

61   © 2018 IDEXX Laboratories, Inc. All rights reserved.
IDEXX has Developed and Acquired Broad Capabilities to
     Establish Leadership in Veterinary Software
          1995                          2011                       2012             2013                2014             2015                 2016           2017           2018

                                                                                                                                         2015 Q3
                                                                                         2013 Q2                                         Launched                                         2018 Q3
                       1997                                 2011                         Cloud image                                     web-based PACS                                   250M images in
                       Acquired                             Launched                     storage &                                       and IDEXX Neo                                    cloud (~1M
                       Better Choice                        I-Vision                     web viewing                                                                                      added per day)
                       and VPM                              Mobile                                                                                                                        Acquired
                                                                                   2012 Q4                                          2015 Q2                                               Smart Flow
                       Launched
                       Cornerstone                                                 Acquired DVMAX                                   Digital images in
                                                                                   Launched Pet                                     VetConnect PLUS     2016 Q2
                                                                                   Health Network Pro                                                   VetConnect
                                                                                                                           2014 Q4                      PLUS inside                  2018 Q2
                                                                                                                           Acquired BeeFree             Cornerstone                  10,000+ SaaS
                                                                                                                           cloud PIMS                                                subscriptions
                                                                                                                    2014 Q3                                                          186,000+ SmartService™
                                                                                                                                                                                     IoT connections
                                                                                                                    Acquired Animana,
                                                                              2012 Q3                               Petly® Plans (TruePet)                                 2017 Q4
                                                                              Launched                                                                                     VetConnect PLUS
                                                                              VetConnect® PLUS                 2014 Q1                                                     crosses 20,000
                                                                                                               VetConnect PLUS mobile app
                                                                          2012 Q1                                                                                     2017 Q3
                                                                          Launched                       2013 Q4                                                      Acquired
                                                                          PetHealthNetwork.com           VetConnect PLUS                                              DataPoint
                                                                                                         crosses 10,000                                               and rVetLink

62   © 2018 IDEXX Laboratories, Inc. All rights reserved.
IDEXX Veterinary Software Strategy has Four Pillars

                                          1                              2                     3                        4
                       Leading PIMS                             Valuable Apps             Secure                Solutions for
                         Solutions                               and Services          Sanctioned API         Corporate Groups

            Critical customer real                          Value created here      Connecting PIMS and      Addressing unique
            estate                                          through recurring       Apps, ensuring patient   enterprise needs
                                                            revenue growth          privacy and security
            Store all customer and                                                                           Managing distributed IT
            patient data (EHR),                             Critical tools to run                            environments across
            scheduling and billing                          practice                                         practice network
            system

                                                                                                                                   +

63   © 2018 IDEXX Laboratories, Inc. All rights reserved.
1     Expanding Global Footprint of PIMS and Cloud Technology

64   © 2018 IDEXX Laboratories, Inc. All rights reserved.
2     PIMS + Apps/Services Together Form a Complete Solution
                                                                                                       Diagnostics & Imaging
                                                                                                                 VetConnect PLUS
                                                                                                                    WebPACS
                                                                       Wellness
                                                                                                                             Clinical
                                                                        Plans
                                                                        Petly Plans
                                                                                                                            Workflow
                                                                                                                             Smart Flow
                                                                                               PIMS

                                                                 Client                                                             Payment
                                                              Engagement                                                           Processing
                                                            Pet Health Network Pro                                                  Payments

                                                                       Referral                                             Data Security
                                                                     Management                                               Data Backup &
                                                                          rVetLink                                              Recovery

                                                                                      Metrics and Insights
                                                                                         Practice Intelligence

65   © 2018 IDEXX Laboratories, Inc. All rights reserved.
DIAGNOSTICS & IMAGING
     2       VetConnect PLUS is Veterinary’s Largest
             Global Application

                                                            • 23,000+ active practices

                                                            • 282M+ results views

                                                            • 136M+ patients

                                                            • 87% of U.S. Reference
                                                              Lab submissions

66   © 2018 IDEXX Laboratories, Inc. All rights reserved.
REFERRAL MANAGEMENT
     2      rVetLink is First-and-only Cloud Application that
            Connects Network of Specialty and GP Practices
                           Referring DVM Cloud portal        Medical records and images   Integration with PIMS

                           Automated medical notifications   eReferral tools              Mobile app

67   © 2018 IDEXX Laboratories, Inc. All rights reserved.
CLINICAL WORKFLOW
     2       Smart Flow Optimizes Clinical Workflow – Saving
             Time, Paper and Ensuring all Charges Get Captured

68   © 2018 IDEXX Laboratories, Inc. All rights reserved.
3       DataPoint Provides Differentiated Services for App
             Partners – Real-time Read/Write

                                                            ▪ Automatically validates claim and reimburses
                                                              practice during patient check-out

                                                            ▪ Enabled by DataPoint’s unique real-time
                                                              PIMS database integration functionality

69   © 2018 IDEXX Laboratories, Inc. All rights reserved.
4       Enterprise Technology Driven by Unique
             Needs of Corporate Groups

                                                  Secure API for     Enterprise Technology Stack (illustrative)
                                                  3rd-party Apps
                                                                                         Client
                                                                   PIMS                                               CRM
                                                                                         Engagement

                                                                   Diagnostics           Inventory &
                                                                                                                      HR/Payroll/Training
                                                                   & Imaging             Ordering

                                                                   Clinical              Business                 $
                                                                                                                      Financial/Audit
                                                                   Workflow              Intelligence

                                                                   Referral              Data Backup
                                                                                                                      Data Management
                                                                   Management            and Security

                                                                                                                                  +

70   © 2018 IDEXX Laboratories, Inc. All rights reserved.
A National Field Service Team that Installs, Trains,
        and Optimizes Software Tools

                                                            300+ years of experience
                                                            in veterinary practices

                                                            9,000+ practice visits
                                                            annually

                                                            60+ user group meetings
                                                            across U.S.

71   © 2018 IDEXX Laboratories, Inc. All rights reserved.
IDEXX Software is Advancing Diagnostics
     and Pet Health

        ▪ IDEXX is a leader in
          Veterinary Cloud
          Software Technologies

        ▪ Critical tools for
          veterinary team and
          corporate groups

        ▪ Drives IDEXX Diagnostics
          loyalty and growth

        ▪ Source of profitable SaaS
          recurring revenue

72   © 2018 IDEXX Laboratories, Inc. All rights reserved.
Appendix
Footnotes
     1 IDEXX      Reportable Segment Revisions and Divested Revenues: Prior to January 1, 2015, our Companion Animal Group (“CAG”) segment included herd testing diagnostic
     services processed within and managed by our CAG reference laboratories. We have transitioned the responsibility for these diagnostic services to our Livestock, Poultry and Dairy (“LPD”)
     segment to more effectively align our business with the nature and customers of these livestock services. Revenue and revenue growth calculations have been retrospectively revised to
     reflect this change in the composition of our reportable segments. The impact on CAG Diagnostics Recurring Revenue Growth was not material.

     2 Normalized         Organic Revenue Growth: Normalized organic revenue growth is a non-GAAP financial measure, and it means organic revenue growth for the relevant period(s) in
     2014 and 2015 normalized for the effects of our transition to an all-direct sales strategy in the U.S., which was effected fully by January 1, 2015, as described in this note. We incurred one-
     time transitional impacts related to the drawdown of distributor inventory in the fourth quarter of 2014, and reported revenues for 2014 have been adjusted to exclude this $25 million impact.
     Further, during the three months ended December 31, 2014, we began recognizing revenue on rapid assay kits and instrument consumables upon delivery to end users in the U.S., instead
     of at distribution. We also began to capture additional revenue that was previously earned by our distribution partners, net of other changes related to this all direct strategy, such as free
     next-day shipping and a new returns policy for expired product. We refer to this net additional revenue as distributor margin capture, and 2015 revenue has been adjusted ~$40 million to
     exclude this impact. See Exhibit A for a reconciliation of normalized organic revenue growth to reported growth for the relevant periods.

     3 Recurring        Revenue: Annual recurring revenue for LPD, Water, Veterinary Software Services and Diagnostic Imaging Systems, Rapid Assay and IDEXX VetLab include and exclude
     the following as applicable: LPD excludes government sponsored eradication programs and herd health screening revenues, Water excludes sealer and filtration instruments, Veterinary
     Software Services and Diagnostic Imaging Systems excludes client server based placements and radiography instruments, Rapid Assay excludes SNAP Pro instruments, and IDEXX
     VetLab includes consumables, service and accessories.

     4   Constant Currency: Constant currency references are non-GAAP financial measures and exclude the impact of changes in foreign currency exchange rates. Management believes
     that constant currency information provides valuable supplemental information regarding our revenue, gross profit, operating expenses, operating margin and EPS results because it is
     consistent with how management evaluates our performance and facilitates comparisons with prior and future periods. We estimated the net impacts of currency on our revenue, gross
     profit, operating expenses, operating margin, and EPS results by restating results to the average exchange rates or exchange rate assumptions for the comparative period, which includes
     adjusting for the estimated impacts of foreign currency hedging transactions and certain impacts on our effective tax rates. The periods 2010-2017 were restated to 2018 forecast rates and
     may vary from previously reported constant currency figures. Estimated currency changes are expected to increase projected 2018 revenue growth by approximately 0.5%‐1%, have an
     immaterial impact on 2018 operating profit margin growth and projected full‐year 2018 EPS growth, decrease opex 2014-2018E constant currency CAGR by 1%, decrease 2014-2018E
     gross profit constant currency CAGR by 2%, and have an immaterial impact on average annual constant currency operating margin gains for 2016-2018E .
     See Exhibit A for the impact of currency on CAG Diagnostics Recurring revenue growth for 2010-2017 and 2018 YTD results.
     See Exhibit B for the impact of currency on operating margin for 2014-2017 results and projected full-year 2018 outlook.
     See Footnote 5 Organic Revenue Growth for the impact of currency for U.S. and International CAG Diagnostics recurring revenue growth.

74       © 2018 IDEXX Laboratories, Inc. All rights reserved.
Footnotes
     5   Organic Revenue Growth: Organic revenue growth is a non-GAAP financial measure and excludes the impact of changes in foreign currency exchange rates and revenue from
     business acquisitions. Management believes that reporting organic revenue growth provides useful information to investors by facilitating easier comparisons of our revenue performance
     with prior and future periods and to the performance of our peers. The percentage change in revenue resulting from acquisitions represents incremental revenues attributable to business
     acquisitions that have occurred since the beginning of the prior year period. Effective January 1, 2018, we exclude only acquisitions that are considered to be a business (consistent with
     ASU 2017‐01, “Business Combinations: (Topic 850) Clarifying the Definition of a Business”) from organic revenue growth. For more detail on what acquisitions we consider to be a business
     in computing organic growth, please see Management’s Discussion and Analysis of Financial Conditions and Results of Operations, Non‐GAAP Financial Measures, contained in the
     Company’s Quarterly Report on Form 10‐Q for the quarter ended June 30, 2018 available at www.idexx.com/investors.
     See Exhibit A for impact of currency and acquisitions to CAG Diagnostics Recurring revenue for 2010-2018YTD.
     Currency changes reduced revenue growth in 2016 by 0.8%, and increased revenue growth by 0.3% in 2017, and the impact of revenue from acquisitions increased revenue growth in
     2016 by 0.2%, and increased revenue growth by 0.2% in 2017. For the calculation of projected 2018 organic revenue growth, the impacts of revenue from acquisitions is immaterial and
     currency changes are expected to increase projected 2018 revenue growth by approximately 0.5%‐1%.
     For U.S. CAG Diagnostics recurring revenue growth, the impact from currency and acquisitions was immaterial for 2011 and 2018YTD. For International CAG Diagnostics recurring revenue
     growth, the impact from acquisitions was immaterial for 2011 and 2018YTD, and currency changes increased growth by 9% and 8%, respectively.
     For U.S. Reference Lab organic revenue growth, the impact from currency was immaterial and the impact from acquisitions was less than 1% for all years.

     6   Comparable Constant Currency EPS growth: Comparable constant currency EPS growth is a non-GAAP financial measure. Comparable constant currency EPS growth
     represents the percentage change in earnings per share (diluted), as compared to the same period for the prior year, net of the impact of changes in foreign currency exchange rates and
     excluding non-recurring items. Management believes comparable constant currency EPS growth is a more useful way to measure the Company’s business performance than constant
     currency EPS growth because it enables better period-over-period comparisons of the fundamental financial results by excluding items that vary independent of performance and provides
     greater transparency to investors regarding a key metric used by management. Comparable constant currency EPS growth excludes the third quarter 2015 non-cash software impairment
     charge of $8.2 million, the impact of the Company’s adoption of share-based compensation accounting change (ASU 2016-09) for the periods after its adoption on January 1, 2017, a one-
     time negative impact related to the 2017 Tax Cuts and Jobs Act (“U.S. Tax Reform”), and a discrete tax benefit related to the expected utilization of foreign tax credits in 2017. The impact of
     the software impairment charge increased 2016 EPS growth by 3%. Share‐based compensation activity is expected to increase projected EPS by approximately $0.20 for the full‐year 2018
     compared to $0.30 for full‐year 2017. A one‐time negative impact related to the enactment of the U.S. Tax Reform for the fourth quarter of 2017, due to the deemed repatriation of the
     Company’s foreign profits, net of the remeasurement of deferred taxes at the lower enacted corporate tax rate, reduced full‐year 2017 EPS by $0.34. A discrete tax benefit related to the
     expected utilization of foreign tax credits in 2017 increased full‐year 2017 EPS by $0.04. These impacts and those described in the constant currency note above reconcile reported EPS
     growth to comparable constant currency EPS growth for the Company.

     7   Adjusted Constant Currency Operating Margin and Growth: Adjusted Constant currency operating profit margin and growth (or operating margin growth) is a non-GAAP
     financial measure and excludes non-recurring items and changes in foreign currency exchange rates. Management believes that reporting adjusted constant currency operating margin and
     growth provides useful information to investors by facilitating easier comparisons of our operating margin performance with prior and future periods. Management believes that reporting
     Adjusted Constant Currency Operating Margin provides useful information to investors by facilitating easier comparisons of our Operating Margin with prior and future periods.
     See Exhibit B for a reconciliation of reported to Adjusted Constant Currency Operating Margin Growth.

75   © 2018 IDEXX Laboratories, Inc. All rights reserved.
Footnotes
     8   Free Cash Flow and the Ratio of Free Cash Flow to Net Income: Free cash flow is a non-GAAP financial measure. Free cash flow means, with respect to a measurement
     period, is the cash generated from operations during that period, including tax benefits attributable to share-based compensation, reduced by the Company’s investments in property and
     equipment. Free cash flow should be considered in addition to, and not as a replacement of or a superior measure to, net cash provided by operating activities. Management believes that
     reporting free cash flow and the ratio of free cash flow to net income provide useful information to investors because free cash flow indicates the cash the operations of the business are
     generating after appropriate reinvestment for recurring investments in property and equipment that are required to operate the business and the ratio measures how effectively the
     Company is managing its cash flow relating to working capital and capital expenditures. Since adoption of ASU 2016-09 in 2017, the tax benefit from share-based compensation is included
     in cash generated from operations and will no longer be an adjustment in our free cash flow calculation.
     See Exhibit C for our calculation of free cash flow for years ending December 31, 2014 through December 31, 2017, and calculation of estimated free cash flow for year ending December
     31, 2018.

     9   After-Tax Return on Invested Capital, Excluding Cash and Investments (“ROIC”): After-Tax Return on Invested Capital, Excluding Cash and Investments is a non-GAAP
     financial measure. After-tax return on invested capital, excluding cash and investments, represents our after-tax income from operations, divided by our average invested capital, excluding
     cash and investments, using beginning and ending balance sheet values. After-tax return on invested capital represents after-tax income from operations divided by average invested
     capital using the beginning and ending balance sheet values. Management believes that reporting after-tax return on invested capital provides useful information to investors for evaluating
     the efficiency and effectiveness of our use of capital. For further information on how After Tax Return on Invested Capital, Excluding Cash and Investments is calculated, please see
     Appendix A in the Company’s Definitive Proxy Statement filed March 29, 2018 available at www.idexxproxymaterials.com. In order to facilitate easier comparison among periods, the tax
     rate used in the calculation for after-tax income from operations is adjusted for the impact from the share-based compensation accounting change (ASU 2016-09) prior to its adoption on
     January 1, 2017. Adjusting for this impact reduced the 2015 tax rate by 4% and the 2016 tax rate by 5%. In addition, the after-tax income from operations in 2017 includes two tax-related
     adjustments. A one-time negative impact related to the enactment of the Tax Cuts and Jobs Act for the fourth quarter, due to the deemed repatriation of the Company’s foreign profits, net of
     the remeasurement of deferred taxes at the lower enacted corporate tax rate, increased our 2017 tax rate by approximately 8%. A discrete tax benefit related to the expected utilization of
     foreign tax reduced our effective tax rate by approximately 1%. For further information on these adjustments to the effective tax rate, see the Company's Annual Report on Form 10-K for the
     year ended December 31, 2017 available at www.idexx.com/investors.
     See Exhibit D for our calculation of After-Tax Return on Invested Capital, Excluding Cash and Investments for years ending December 31, 2014 through December 31, 2017, and
     calculation of estimated free cash flow for year ending December 31, 2018.

     10   Debt to Adjusted EBITDA: Adjusted EBITDA, gross debt, and net debt are non-GAAP financial measures. Adjusted EBITDA is a non-GAAP financial measure of earnings before
     interest, taxes, depreciation, amortization and share-based compensation. Management believes that using Adjusted EBITDA, gross debt and net debt in the Adjusted EBITDA ratio is a
     useful and recognized measure for evaluating financial leverage. Adjusted EBITDA for 2014 is further adjusted to exclude impacts in the second half of 2014 related to the U.S. all-direct
     transition. For further information on how Adjusted EBITDA, gross debt, net debt and the Debt to Adjusted EBITDA Ratio are calculated, see the Company's Annual Report on Form 10-K
     for the year ended December 31, 2017 available at www.idexx.com/investors.

76   © 2018 IDEXX Laboratories, Inc. All rights reserved.
You can also read