TEEKAY OFFSHORE PARTNERS L.P - INVESTOR PRESENTATION - TEEKAY
←
→
Page content transcription
If your browser does not render page correctly, please read the page content below
TEEKAY
            TEEKAY

TEEKAY OFFSHORE PARTNERS L.P.
INVESTOR PRESENTATION
June 2016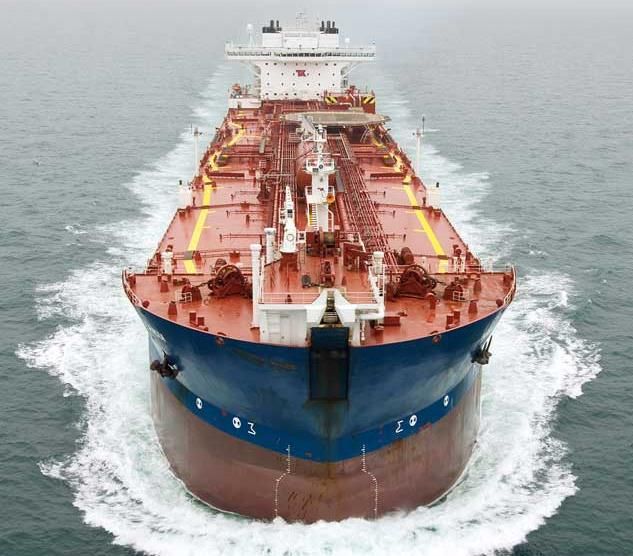
Disclaimer
This confidential presentation (the “Presentation”) has been prepared by Teekay Offshore Partners L.P. (the “Partnership”). The Presentation has been
prepared and is delivered for information purposes only and is subject to the terms of the non-disclosure agreement entered into by the recipient or its affiliates
relating to a potential investment in the Partnership. The Presentation has not been reviewed or registered with, or approved by, any regulatory authority or
stock exchange. The contents of the Presentation are not to be construed as financial, legal, business, investment, tax or other professional advice.
Each recipient should consult with its own professional advisors for any such matter and advice. The Partnership makes no representation or warranty
(whether expressed or implied) as to the correctness or completeness of the information contained herein, and neither the Partnership nor any of its affiliates,
directors, employees or advisors assumes any liability connected to the Presentation and/or the statements set out herein. This Presentation is not and does not
purport to be complete. By receiving this Presentation the recipient acknowledges that it will be solely responsible for its own assessment of the Partnership, its
financial position and prospects and that the recipient will conduct its own analysis and be solely responsible for forming its own view of any refinancing and the
potential future performance of the Partnership’s business. The information included in this Presentation contains certain forward-looking statements relating to
the business, financial performance and results of the Partnership, its subsidiaries and its affiliates and/or the industry in which it operates, including, among
others, statements about: the Partnership’s comprehensive financing plan and expected participation by various stakeholders, and completion of the financing
plan on contemplated terms and related results and benefits; expected growth in the offshore and deepwater markets; the Partnership’s access to future capital
and potential future distribution or unit price increases; future sources and uses of cash flow; the Partnership’s ability to meet future obligations; and the ability to
redeploy FPSO units. Forward-looking statements concern future circumstances and results and other statements that are not historical facts, sometimes
identified by the words “believes”, “expects”, “predicts”, “intends”, “projects”, “plans”, “estimates”, “aims”, “foresees”, “anticipates”, “targets”, and similar
expressions. The forward-looking statements contained in this Presentation, including assumptions, opinions and views of the Partnership or cited from third
party sources, are solely views, expectations and forecasts which are subject to risks, uncertainties and other factors that may cause actual events to differ
materially from any anticipated development. None of the Partnership or any of its affiliates, employees or any of its or their advisors provides any assurance
that the assumptions underlying such forward-looking statements are free from errors nor does any of them accept any responsibility for the future accuracy of
the views, expectations or forecasts included in this Presentation or the actual occurrence of the forecasted developments. The Partnership and its advisors
assume no obligation to update any forward-looking statements or to conform these forward-looking statements to the Partnership's actual results. Investors are
advised, however, to inform themselves about any further public disclosures made by the Partnership, such as filings made with the U.S. Securities and
Exchange Commission or press releases. This Presentation does not constitute any solicitation for any offer purchase or subscribe for any securities and is not
an offer or invitation to sell or issue securities for sale in any jurisdiction, including the Unites States. Distribution of the Presentation in or into any jurisdiction
where such distribution may be unlawful, is prohibited. The Partnership and its advisors require persons in possession of this Presentation to inform themselves
about, and to observe, any such restrictions and to maintain the confidentiality of this Presentation and to not distribute it without the prior consent of the
Partnership. This Presentation speaks as of the date June 16, 2016, and there may have been changes in matters which affect the Partnership, its subsidiaries
or affiliates subsequent to the date of this Presentation. Neither the issue nor delivery of this Presentation shall under any circumstance create any implication
that the information contained herein is correct as of any time subsequent to the date hereof or that the affairs of the Partnership, its subsidiaries or affiliates
have not since changed, and the Partnership does not intend, and does not assume any obligation, to update or correct any information included in this
Presentation. By receiving this Presentation, you accept to be bound by the terms above.

                                                                                                                                                                             2
Executive Summary
•   Teekay Offshore Partners L.P. (“Teekay Offshore” or the “Company”) is an international provider of marine
    transportation, oil production, storage, towage and maintenance and safety services to the oil industry
    ○   Fee-based contracts from strong customer group with $7.8 billion(1) of contracted revenue (including existing growth projects)
        and a remaining average contract duration of ~5 years(1)
    ○   Listed on the NYSE, the Company has total assets of $5.7 billion(2) and $1.6 billion(3) of growth capex in progress mostly on
        fee-based contracts, which we expect will further grow the Company’s asset base and cash flow
    ○   TOO is an MLP but treated as C-Corp for tax purposes and investors receive a form 1099 rather than K-1s

•   Teekay Offshore is nearing completion of financing initiatives to improve its liquidity and position the Company
    for future growth
    ○   Initiatives address upcoming debt amortization and maturities
    ○   Fully finances $1.6 billion(3) of growth projects through 2018

•   As part of these initiatives, Teekay Offshore raised $200 million of new capital in a combination of i) a private
    placement of Preferred Units plus common unit warrants and ii) a private investment in public equity (“PIPE”) of
    common units
    ○   Proceeds will be used to fund Teekay Offshore’s existing business plan and general working capital
    ○   Closing of transaction anticipated in June 2016

•   Attractive valuation entry point with significant upside potential
    ○   Current market valuation provides an entry point with significant upside potential
    ○   Further upside from potential future dividend increases
    ○   Conversion price on the common unit warrants set around historical share price lows and attractive quarterly distribution yield
        / coupon
           1)   As of January 1, 2016, excluding options
           2)   As of March 31, 2016
           3)   Excludes $397 million of capex related to the two UMS newbuilds that TOO plans to defer as part of TOO’s financing initiatives and are non-recourse to TOO   3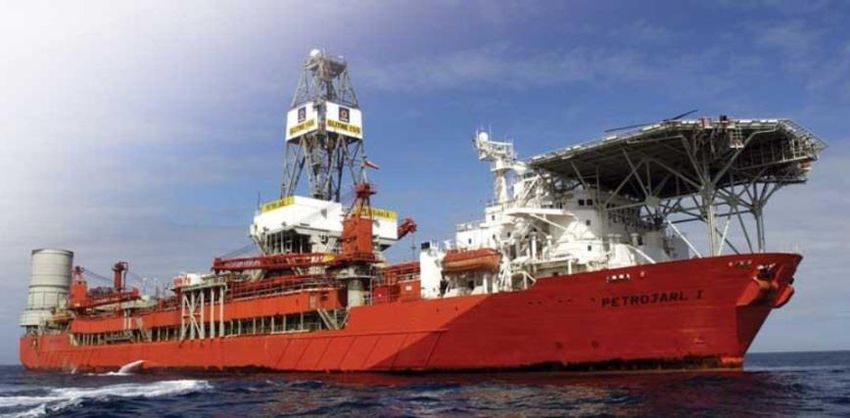
Agenda

   Section 1:   Key Investment Highlights
   Section 2:   Business update
   Appendix

                                            4
Section 1: Key Investment Highlights
TOO – Key Investment Highlights
1
Current market valuation provides an entry point with significant upside potential (current EV / EBITDA(1) of 5.6x)
Attractive valuation
Further upside from potential future dividend increases (current coverage ratio of > 5x and growing DCF(2))
entry point Warrant conversion and common unit price set around historical share price lows and attractive dividend yield / coupon
Majority blue-chip customer base and diverse revenue streams; a critical part of our customers’ oil production supply chain
2 Forward fee-based revenues of $5.2 billion(3) from existing operations and $2.6 billion(3) from growth projects
Stable operating
model with built-in Average contract length of ~5 years(3)
Contract options/extensions on 2018 rollovers provides potential incremental forward fee-based revenues and extends
growth
average contract length
Strong operating track record of delivering stable and growing cash flows
3
Leading market Market leader in harsh weather FPSOs and shuttle tanker segments
Strong track record and flexible operating platform allows for high shuttle tanker fleet utilization
positions Proven FPSO redeployment offers low break-even and lifting costs compared to newbuilds
4 55+ FPSO projects in TOO’s core regions expected to be awarded industry-wide once oil market conditions improve
Significant growth in demand for oil and declining production from conventional oilfields are expected to spur new field
Strong long-term
development, with deepwater and offshore production playing an important role
market fundamentals Deepwater production forecasted to increase by 70% from 2014 levels to 10 mb/d by 2040(4), which is expected to drive
demand for FPSOs and shuttle tankers
5 Banks committed $400 million through various initiatives
Nearing completion NOK Bondholders agreed to amend and extend maturities until late-2018 (with partial amortization)
of financing initiatives Strong de-levering profile with expected Q4-2018 leverage of 3.2x
to strengthen TOO In discussions to defer delivery of two UMS units worth $397 million and contracts remain non-recourse to TOO
(1) Earnings Before Interest Taxes Depreciation and Amortization (“EBITDA”) is a non-GAAP financial measure used by certain investors to measure the financial performance of
shipping companies. See 2015 form 20-F for a reconciliation of this non-GAAP measure to the most directly comparable GAAP financial measure. See Slide 6 for further details
(2) Distributable cash flow (“DCF”) is a non-GAAP financial measure used by certain investors to measure the financial performance of Master Limited Partnership companies.
See Teekay Offshore Partners’ quarterly earnings presentations for a reconciliation of this non-GAAP measure to the most directly comparable GAAP financial measure
(3) As of January 1, 2016, excluding options
5
(4) Source: ExxonMobil outlook report 2016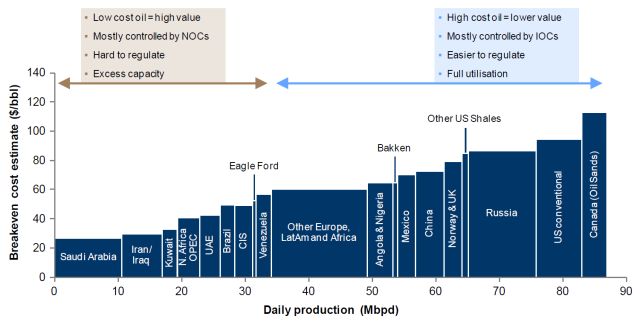
Section 1: Key Investment Highlights

1
    Teekay Offshore Valuation Metrics

                  EV / EBITDA(1)                                                     Price / DCF(6)                                                  Price / Book Value

                                                                                      17.9x                                                               5.8x
    12.0x         11.2x                                           18.0x                                                                6.0x

    10.0x                                                                                                                              5.0x
                                                                  14.0x
     8.0x                                                                                                                              4.0x
                                                                  10.0x
     6.0x                                 5.6x                                                                                         3.0x

     4.0x                                                            6.0x                                                              2.0x

     2.0x                                                                                                     2.0x                     1.0x                                      0.8x
                                                                     2.0x
        -                                                                 -                                                                  -
                              (2)(3)                  (4)(5)                                      (2)(3)                 (4)(5)                                      (2)                 (4)
              Q3 2014                  Q1 2016                                     Q3 2014                 Q1 2016                                    Q3 2014                 Q1 2016
            (1)   EBITDA is a non-GAAP financial measure used by certain investors to measure the financial performance of shipping companies. See 2015 form 20-F for a reconciliation
                  of this non-GAAP measure to the most directly comparable GAAP financial measure
            (2)   Based on September 30, 2014 book values and the market values for common and preferred equity
            (3)   EBITDA and Distributable cash flow (DCF) based on Q3-2014 annualized
            (4)   Based on March 31, 2016 book values and the market values for common and preferred equity as of June 16, 2016
            (5)   EBITDA and Distributable cash flow (DCF) based on Q1-2016 annualized
            (6)   DCF is a non-GAAP financial measure used by certain investors to measure the financial performance of Master Limited Partnership companies. See Teekay Offshore
                                                                                                                                                                                          6
                  Partners’ quarterly earnings presentations for a reconciliation of this non-GAAP measure to the most directly comparable GAAP financial measure
Section 1: Key Investment Highlights
1
Phased Approach
Objective: increase distributable cash flow per common unit
1. Complete financing initiatives with the goal of building liquidity and
strengthening balance sheet
○ Majority of financial commitments secured and final signing expected in June
2016
2. Optimize asset portfolio and balance sheet
○ Asset sales, redeployment of assets, refinancing and/or repurchasing bonds, etc.
3. Increase distributions and access to equity capital markets
○ LP distributions were reduced by 80% in December 2015 in order to provide
capital for growth capex program
7Section 1: Key Investment Highlights
1
Committed Growth Will Increase Distributable Cash Flows
Estimated Run-Rate DCF
$350
$300
In USD Millions
$250
$200
$150
2015 Run-Rate OPEX and G&A Navion Saga Recap Plan Varg Contract Four ALP Petrojarl I Gina Krog Libra (50% Two ECC 2017 Run-Rate
DCF (1) Savings Layup and Financing Termination Newbuilding Delivery (Q4- Delivery (1H- interest) Shuttle Tanker DCF (4)
Initiatives Assumed 2016 Initiatives (2H-2016) Deliveries 2016) 2017) Delivery (1H- Deliveries (2H-
Vessel Sales (2016-2017) (2016-2017) (3) 2017) 2017) (4)
(2)
Annualized Increase Annualized Decrease
(1) Annualized for Knarr FPSO and Arendal Spirit UMS deliveries, Navigator Spirit and SPT Explorer sales and shuttle tanker contract expirations during 2015. See
appendix for a reconciliation of this non-GAAP measure to the most directly comparable financial measure under GAAP.
(2) Reduction in DCF from vessel sales: Fuji Spirit (completed), Kilimanjaro Spirit (completed) and Navion Europa
(3) Assumes ALP vessels chartered at current market rates 8
(4) Excludes 1 East Coast Canada (ECC) shuttle tanker newbuilding delivering in early-2018 and 2 unchartered UMS unitsSection 1: Key Investment Highlights
1
Distribution Increase is Key to Growth in Unit Price
Implied Common Unit Price (1)
Coverage Ratio 1.10x 1.20x 1.30x 1.40x
Illustrative Run-rate Available Distribution per LP Unit
After Delivery of Known Growth Projects $1.76 $1.64 $1.51 $1.41
7% $25.20 $23.38 $21.63 $20.08
Dividend Yield
8% $22.05 $20.45 $18.92 $17.57
9% $19.60 $18.18 $16.82 $15.62
10% $17.64 $16.36 $15.14 $14.06
11% $16.04 $14.88 $13.76 $12.78
• TOO current annual distribution rate of $0.44 per unit, representing a current coverage
ratio of >5.0x
• Anticipated distributable cash flow growth from the delivery of fully financed growth
projects delivering through 2017, enables TOO to pay higher distribution in the future
• Excludes additional cash flows from redeployment of the Varg FPSO
• TOO leverage projected to reduce significantly
• No additional equity required to fund existing growing projects(2)
(1) Refer to Appendix for estimated LP units outstanding 9
(2) Except issuances through ATM and PIK. Existing growth projects excludes the two UMS newbuildingsSection 1: Key Investment Highlights
1
Attractive Investment Opportunity
Preferred Series D plus warrants offer an attractive current yield with long-term upside and
meaningful structural protection
Illustrative Investor Annual Return at Various Unit Prices over a 3-Year Investment Horizon
45%
• Preferred unit distributions are set at
historically attractive levels and are
fixed for the life of the security
40%
• Meaningful upside participation
through warrants
35%
• Seniority in capital structure relative to
common units
Investor Annual IRR
30%
• Bifurcated preferred plus warrants
structure allows for monetization at
25% different time horizons
• Preferreds are redeemable at a
20% premium to face value starting in year
five
• After year 5, investors option to
15%
exchange preferred Series D into
common units
10% • Meaningful change of control
$5.00 $7.50 $10.00 $12.50 $15.00 $17.50 $20.00 $22.50 $25.00 protections
TOO Common Unit Price at 3-Year Investment Horizon
Assumes a 10.5% preferred plus warrant security with 45 Common Unit warrants struck at Market Price and 22.5 Common Unit warrants struck at a 33% premium to
Market Price for each $1,000 of Investment Amount. Assumes TOO Market Price of $4.55 as of June 16, 2016. Assumes preferred valuation at year 3 based on a 7.25%
YTC (equal to unaffected trading yield on TOO’s Series A preferreds in 2013/14). Warrants are valued at their intrinsic value.
10Section 1: Key Investment Highlights
2
Attractive Portfolio of Fixed-Rate Contracts
• Substantial portfolio of long-term, fixed-rate contracts with high quality oil and gas companies
○ Forward fee-based revenues of $5.2 billion(1) from existing operations and $2.6 billion(1) from growth projects
○ Weighted average remaining contract life of ~5 years(1)
Shuttle Tankers FPSO Units FSO Units UMS Units
# of units 36(2) 8(3) 7(4) 1(5)
Average
Contract Life
5.3 years(1) 4.9 years(1) 4.9 years(1) 2.5 years(1)
Forward
Revenues
$2.8B(1) $4.3B(1) $0.6B(1) $0.1B(1)
(1) As of January 1, 2016, excluding options
(2) Includes six shuttle tankers owned 50% and one owned 67% by TOO and three chartered-in shuttle tankers
(3) Includes two FPSO units owned 50% by TOO
(4) Includes one FSO unit owned 89% by TOO
11
(5) Excludes $397 million of capex related to the two UMS newbuilds that TOO plans to defer as part of TOO’s financing initiativesSection 1: Key Investment Highlights
2
Strategic Customer Relationships
Teekay benefits from strong relationships with diverse group of majority blue-
chip customers
TOO Teekay (consolidated)
# Customer Share(1) Credit rating # Customer Share(1) Credit rating
1 Shell(2) 25.6% Aa2 / A+ 1 Shell(2) 16.6% Aa2 / A+
2 Petrobras 18.3% B3 / B+ 2 Petrobras 9.5% B3 / B+
3 Statoil 10.8% Aa3 / A+ 3 BP 7.4% A2 / A-
4 E.ON 10.5% Baa1 / BBB+ 4 Statoil 7.3% Aa3 / A+
5 Repsol 8.8% Baa2 / BBB- 5 E.ON 5.3% Baa1 / BBB+
6 Teekay 5.6% B3 / B+ 6 Repsol 4.4% Baa2 / BBB-
7 Chevron 3.6% Aa2 / AA- 7 Canadian Natural 4.0% Baa3 / BBB+
8 Quadrant 1.2% NA / NA 8 Centrica Energy 2.9% Baa1 / BBB+
9 Suncor 1.0% Baa1 / A- 9 RasGas 2.9% Aa3(3) / A(3)
10 Occidental 1.0% A3 / A 10 Chevron 2.7% Aa2 / AA-
(1) Based on fiscal year 2015 revenue
(2) Pro forma for acquisition of BG Group
(3) Reflects current senior secured debt ratings 12Section 1: Key Investment Highlights
2
TOO’s CFVO(1) Anticipated to Continue to Grow
Run-rate CFVO anticipated to approximate up to ~$850 million per year in 2017
Proportionally Consolidated Estimated Run-Rate CFVO
$950
$850
$750
$650
In USD Millions
$550
$450
$350
$250
$150
2015 Run-Rate OPEX and G&A Navion Saga Varg Contract Four ALP Petrojarl I Gina Krog Libra (50% Two ECC Shuttle 2017 Run-Rate
CFVO (2) Savings Layup and Termination (2H- Newbuilding Delivery (Q4- Delivery (1H- interest) Delivery Tanker CFVO (5)
Initiatives Assumed 2016 2016) Deliveries (2016- 2016) 2017) (1H-2017) Deliveries (2H-
Vessel Sales (3) 2017) (4) 2017) (5)
Annualized Increase Annualized Decrease
(1) Cash flow from vessel operations (“CFVO”) is a non-GAAP financial measure used by certain investors to measure the financial performance of shipping companies. See Teekay
Offshore Partners 2015 annual Earnings Report for a reconciliation of this non-GAAP measure to the most directly comparable financial measure under GAAP
(2) Annualized for Knarr FPSO and Arendal Spirit deliveries, Navigator Spirit and SPT Explorer sales and shuttle tanker contract expirations during 2015. See appendix for a
reconciliation of this non-GAAP measure to the most directly comparable financial measure under GAAP.
(3) Assumes vessel sales: Fuji Spirit (completed), Kilimanjaro Spirit (completed) and Navion Europa
(4) Assumes ALP vessels chartered at current market rates 13
(5) Excludes one East Coast Canada (ECC) shuttle tanker newbuilding delivering in early-2018 and two UMS newbuilds that TOO plans to defer as part of TOO’s financing
initiativesSection 1: Key Investment Highlights
2
Asset Redeployment Outcomes and Potential Opportunities
Redeployments provide incremental forward fee-based revenues and extends average contract
length
Asset Name Firm Period Status Likely Extension/Redeployment Scenario
Date
Petrojarl Varg August 2016 Completing operations on the Varg field after ~18 years of Looking at early well test (EWT) opportunities with
FPSO service on the field following delivery. The only available minimal upgrades prior to a longer-term contract.
(Repsol) FPSO that meets the strict Norwegian standards Tendering on 5 possible contracts in the North Sea (4 in
(NORSOK compliant) with oil production capacity of 57,000 the Norwegian sector and 1 in the UK sector)
bbl/day (total liquid capacity of 82,000 bbl/day)
Cidade de Rio January 2018 Since delivery, Petrobras has used the Ostras as an EWT Expected to continue to operate as EWT unit for
das Ostras FPSO unit to test various heavy oil fields prior to making a larger Petrobras
(Ostras) investment while at the same time producing positive cash
(Petrobras) flows
Voyageur Spirit April 2018 Operating on the Huntington field in the North Sea Will likely stay on Huntington field until end of field life.
FPSO (operating on its second field). Premier Oil recently Meanwhile, also pursuing another opportunity in the UK
(Premier Oil) acquired field from E.ON and has expressed desire to sector where Voyageur’s cylindrical hull design is
extend Voyageur FPSO charter considered a competitive advantage
Piranema Spirit October 2018 Operating on the Piranema field in Brazil since delivery Expected to stay on field until the end of field life
FPSO
(Petrobras)
Arendal Spirit May 2018 Gangway has been replaced and is undergoing testing and Upon recommencing charter contract, we expect to
UMS is expected to recommence charter contact in mid-June finalize a ‘blend and extend’ agreement, extending the
(Petrobras) contract firm period out to 2021
14Section 1: Key Investment Highlights
3
Market Leader in Core Segments
Controls Approximately
Number of Shuttle Tankers(1)
3
1
40%
of the World’s
33 Shuttle Tanker Fleet(3)
28 3
7 1
5 4 2
TOO (2) Knutsen NYK (3) SCF Group Viken MOL AS AET Tankers Tsakos Group
Existing Newbuildings on Order
Number of FPSOs(1)
Leading Position in leased FPSOs
1 1 2 1
Globally
3
14 14 12 10 7 5
BW Group SBM Offshore MODEC TK Corp / TOO (5) Bumi Armada Bluewater
Berhad Energy
Source: Clarkson Research Services, Fearnley Research Services, International Maritime Associates Research Services and company websites
(1) As of Q2 2016
(2) Includes six shuttle tankers owned 50% and one owned 67% by TOO and three chartered-in shuttle tankers
(3) Includes Knutsen NYK and Knutsen Offshore Partners L.P. (KNOP)
(4) Based on total tonnage as of December 31, 2015
15
(5) Includes two FPSO units owned 50% by TOOSection 1: Key Investment Highlights
4
Demand for Oil Expected to Drive New Field Development
Offshore and deepwater expected to continue to play a key role going forward
Sources of production out to 2040
• Global oil demand is expected to grow significantly in 120
the future due to the needs of a growing global Biofuels
middle class Other
100
NGLs
• Production from existing conventional oilfields is
expected to decline by two thirds by 2040, spurring Tight oil
80
the need for new sources of production Oil sands
Deepwater
• Deepwater will play an important role with production 60
expected to increase by ~70% from 2014 levels to
10 mb/d by 2040 (CAGR of 2.1%) New conventional crude
40 and condensate
development
20
Developed conventional
crude and condensate
-
2,000 2,020 2,040
Source: ExxonMobil outlook report 2016
16Section 1: Key Investment Highlights
5
Actions To-Date to Deteriorating Capital Market Environment
TOO and TK Corp have aggressively cut dividends, implemented cost
efficiency and liquidity measures, and are now completing financing initiatives
TOO
• December 2015
○ Cut dividend distributions by 80%, preserving $56 million of
cash per quarter ($225 million per year) TOO cuts
TKC repays NOK TKC cuts dividend dividend
TOO tanker sales
• January 2016
bond by 90% distributions by
80%
○ Repaid $90 million NOK bond
• December 2015 and March 2016
○ Sold non-core conventional tankers for $130 million
Oct’15 Nov’15 Dec’15 Jan’16 Feb’16 Mar’16
TK Corp
• October 2015
○ Repaid $123 million NOK bond
• November 2015 TKC raises $200
TKC pays down
million through TOO repays NOK TOO / TKC initiate
○ Repaid $250 million on equity margin revolver equity margin
add-on bond bond financing initiatives
revolver
offering
○ Raised $200 million through add-on bond offering
• December 2015
○ Cut dividends by 90%, preserving $36 million of cash per
quarter ($144 million per year)
• May 2016
○ Secured commitments for $100 million of common equity
through a PIPE offering
17Section 1: Key Investment Highlights
5
Summary of TOO’s Financing Initiatives
On track to secure remaining commitments in June 2016
Initiative Status
• $250 million debt facility for the East Coast Canada shuttle tanker
project
• $35 million of new loan financing already completed
• $40 million debt facility on un-mortgaged vessels (six shuttle tankers
Banks and FSO units) • Commitments received for all other new loan financing
• $35 million from an increased debt facility on two shuttle tankers • Majority of banks committed to Varg FPSO refinancing
• $75 million refinancing for the Varg FPSO
• Jan 2017 Bond – New maturity Nov 2018 with 30% amortization in Oct
Norwegian 2016 and Oct 2017
• Bondholders approved the plan on June 2 nd
Bondholders • Jan 2018 Bond – New maturity Dec 2018 with 20% amortization in Jan
2018
• $200 million equity raise through a combination of (i) preferred units
Equity Holders • Closing in June 2016
plus common unit warrants and (ii) common units
• In discussions to defer the delivery of the two remaining UMS
newbuildings, which would result in capex deferral of approximately $400 • UMS shipyard contract amendment in documentation
Capex million
• Conventional tanker sales completed, adding
• Sale of two conventional tankers in Q4-15 and the sale-leaseback of the approximately $60 million in liquidity
two remaining conventional tankers in Q1-16
18Section 1: Key Investment Highlights
5
TOO’s 2016 & 2017 Cash Flow Forecast
Bank Initiatives Bond Initiatives Equity Initiatives Capex
Liquidity 2016 2017
Opening(4) $280 ~$310
Ending(4) ~$310 ~$310
Minimum covenant(5) ~$165 ~$160
Note that figures assume all initiatives completed and on contemplated terms
(1) Defined as net interest expense, scheduled debt repayments and revolver amortizations, and current distributions to equity holders
(2) Includes gross CAPEX and equity investment in Joint Venture, excluding the two UMS newbuilds that TOO plans to defer as part of TOO’s financing initiatives
(3) Assumes bank maturities of $111 million for Piranema, Navion Bergen and Navion Gothenburg are refinanced for $100 million
(4) Comprised of unrestricted cash, and undrawn revolvers
19
(5) Minimum liquidity requirement, which is based on 5% of total debt as of March 31, 2016 = ~$165 millionSection 1: Key Investment Highlights
5
Anticipated Impact of Financing Initiatives on TOO’s Capex
and Debt Maturity Profile
Runway extended to late-2018
Baseline maturity profile Anticipated maturity profile
$ million $ million
450 450
400 400
350 12 350
300 300 157
250 250
208 27
(1)
200 25 300
200 397
110 300
150 101 137 150 14
11
225
100 100 102 20 27
54 9 157 176 9 154
129 20
50 114
81
51
89 8 50 30 81 30 51
89
42 30 54 30 39 54 30 30 35 30 8
23 25 23 25
0 0
Q2-16
Q3-16
Q4-16
Q1-17
Q2-17
Q3-17
Q4-17
Q1-18
Q2-18
Q3-18
Q4-18
Q1-19
Q2-19
Q3-19
Q4-19
Q2-16
Q3-16
Q4-16
Q1-17
Q2-17
Q3-17
Q4-17
Q1-18
Q2-18
Q3-18
Q4-18
Q1-19
Q2-19
Q3-19
Q4-19
Capex (net of committed financing) Bond maturities and amortizations(2) Interest rate swaps(3) Loan maturities
Note that figures assume all initiatives completed and on contemplated terms
(1) In discussions to defer the delivery of the two remaining UMS newbuilds, which is assumed to be deferred to 2019. Amount does not take into account future debt facilities
(2) Principal amounts are net of restricted cash and include cross currency swap maturities based on the mark-to-market as of March 29, 2016
(3) Deferral of interest rate swap terminations based on the mark-to-market as of March 29, 2016. Actual cash settlement amounts for interest rate swaps are expected to be 20
lower than the figures in the graphs above, based on amortization of the mark-to-market value and forward LIBOR rates as at March 29, 2016Section 1: Key Investment Highlights
5
TOO’s Balance Sheet Projected to De-lever Significantly(1)
TOO expected to be better positioned to refinance bond maturities post – 2017
with higher CFVO(2) and lower debt
Projected TOO Leverage (Net debt(3) / CFVO(4))
5,000 5.0x
Net Debt / CFVO
4.7x 4.7x
4,500
4.5x 4.5x
4.5x
4.5x
4,000
Net Debt / CFVO
3,500 3.9x
$ millions
4.0x
3,000 3.8x 3.7x
3.6x
2,500 3.5x
3.5x
3.3x
2,000 3.2x
1,500 3.0x
Q1-16A Q2-16E Q3-16E Q4-16E Q1-17E Q2-17E Q3-17E Q4-17E Q1-18E Q2-18E Q3-18E Q4-18E
Secured Debt (net of cash) Unsecured Debt TK Intercompany Loan Preferred Units Common Equity
In USD Billions Q1 – 2016 Q4 – 2018 (5)
Secured Debt (net of cash) $2.4 $1.7
TOO Expected to Delever
Unsecured Debt (5) $1.0 $0.8
Net Debt / Book Cap 72% 55%
Note that figures assume all initiatives completed and on contemplated terms
(1) Includes all financing initiatives and based on management’s estimates of contract roll-overs. No CFVO assumed for Varg in Q4-16 through 2018
(2) CFVO is a non-GAAP financial measure used by certain investors to measure the financial performance of shipping companies. See Teekay Offshore Partners 2015 annual
Earnings Report for a reconciliation of this non-GAAP measure to the most directly comparable financial measure under GAAP
(3) Net debt excludes $200 million TK Intercompany Loan
(4) Run-rate CFVO annualizes quarterly CFVO performance and excludes temporary off-hire expenses relating to Arendal Spirit gangway replacement in Q2-16 21
(5) Secured debt balance is net of cash. Unsecured debt balance is before Q4-2018 NOK bond payments and includes mark-to-market of interest rate swaps.Section 1: Key Investment Highlights
5
Multiple Ways to Refinance 2018/2019 Bond Maturities
TOO well-positioned to refinance new bond maturities when capital markets
open assuming implementation of financing initiatives
• US and Norwegian bond markets
Financing ○ TOO will be seeking third-party credit ratings as energy markets improve, a pre-requisite for
conventional US bond market access
initiatives
expected to − Optimal first issuance size in the US is $250 million +
provide a ○ Remain committed to issuing in the NOK bond market when the market reopens
liquidity runway
until the capital • US MLP equity markets
markets reopen ○ Company has the ability to issue incremental equity through an at-the-market (ATM) program on a
daily basis (subject to quarterly and any event-specific blackouts) throughout execution of the
financing initiatives
• TOO leverage projected to reduce significantly - net debt to CFVO(1) of ~3.2x by
TOO expected to year-end 2018
be in a stronger ○ Investment opportunity attractive to both debt and equity investors
financial position ○ Further de-levering anticipated from asset sales
○ Refinancing with banks remains an option
Strong sponsor • TK Corp expected to strengthen its financial position and support TOO further if
required
(1) CFVO is a non-GAAP financial measure used by certain investors to measure the financial performance of shipping companies. See Teekay Offshore Partners 2015 annual
Earnings Report for a reconciliation of this non-GAAP measure to the most directly comparable financial measure under GAAP 22Agenda
Section 1: Key Investment Highlights
Section 2: Business update
Appendix
23Section 2: Business update
2015 in Review
Strong operational performance driving CFVO(1) and DCF(2) growth
Financial CFVO and DCF 2014 vs. 2015
• Continued to generate stable and growing cash flows with $ millions
significant CFVO and DCF growth +25%
700
2014
• Raised $2.4 billion of debt and equity financings 600
2015
500
Commercial and Operational 400
+31%
• Completed $1.7 billion of growth projects 300
200
○ Acquisition of the Knarr FPSO, TOO’s largest acquisition to
date 100
0
○ TOO’s first unit for maintenance and safety, Arendal Spirit, CFVO DCF
commenced its 3-year charter contract
○ Acquisition of six long-distance towing and offshore installation
vessels
• Signed strategic East Coast Canada contract and TOO is now
the sole supplier of shuttle tanker services for the region
• High uptime and fleet utilization in all business segments
• Strong safety and key performance indicators
(1) CFVO is a non-GAAP financial measure used by certain investors to measure the financial performance of shipping companies. See Teekay Offshore Partners 2015
annual Earnings Report for a reconciliation of this non-GAAP measure to the most directly comparable financial measure under GAAP
(2) DCF is a non-GAAP financial measure used by certain investors to measure the financial performance of Master Limited Partnership companies. See Teekay Offshore 24
Partners quarterly earnings presentations for a reconciliation of this non-GAAP measure to the most directly comparable GAAP financial measureSection 2: Business update
Diversified Portfolio of Forward Revenues
Contracted forward revenues of $7.8 billion (excluding options)
Forward revenues from Forward revenues from
existing operations growth projects Average remaining contract length
by segment(1) by segment(1) by segment(1)
12 years
5.3 years
5 years
4.9 years
53% $5.2B 37%
57% $2.6B 35%
Total Forward Fee- Total Forward Fee-
Based Revenues Based Revenues
(excluding extension (excluding extension
options) options)
4.9 years
7% 8% 2.5 years
3%
FPSO Shuttle Tankers FSO UMS (2)
• Increased focus on maximizing cash • Execute on committed growth
flows from existing assets projects
○ Cost management and fleet ○ Ensure projects are delivered on-time
efficiencies and on-budget
○ Recontract and / or extend existing ○ Build book of contracts for towage
contracts newbuilds
(1) As of January 1, 2016, excluding extension options
(2) Excludes two UMS newbuilds that TOO plans to defer as part of TOO’s financing initiatives 25Section 2: Business update
TOO Earnings Relatively Insulated from Oil Price Volatility
TOO’s fee-based businesses are primarily focused on the transportation and
production side of the oil & gas value chain with no direct commodity exposure
and our assets are critical to our customers’ production chain
Shuttle
FPSOs FSOs
Tankers
Exploration – Production –
more sensitive less sensitive
to oil prices to oil prices
Exploration /
Seismic Subsea Production Storage Transportation Terminals
Drilling
DP Towing
UMS
Vessels
26Section 2: Business update
Significant Efficiency Initiatives
Shuttle tanker opex(1) FPSO opex TOO G&A expense
30,000 400 140
350 120
25,000
$ per vessel per day
300
100
20,000
250
$ millions
$ millions
80
15,000 200
60
150
10,000
40
100
5,000 20
50
0 0 0
2015A
2008
2009
2010
2011
2012
2013
2014
2015B
2016B
2015 Budget 2015 Actual 2016 Budget 2015 Budget 2015 Actual 2016 Budget
• North Sea shuttle tanker OPEX down • 2015 actual cost 15% less than 2015 • 2015 actual G&A cost 20% less than
46% from $27,800/day peak in 2008, to budget 2015 budget
less than $15,000/day in 2015
• 2016 budget 11% less than 2015 actuals • 2016 G&A budget 13% less than 2015
• Savings achieved through: actuals – would result in 30% reduction
• Total projected OPEX savings from compared to 2015 budget
○ Shift in manning model to employ more
Efficiency Project
ratings and officers from the Philippines
○ Supply chain management - $15 million • Major efficiency initiative currently
○ Greater integration of ship management underway and expected to be completed
run rate savings
with the overall business in first half 2016
○ Changes on-board FPSOs - $15 million
○ Strong focus on supply chain costs
run rate savings • Efficiency initiatives expected to result in
a significantly leaner organization,
with ~20-30% of organization to be
affected
(1) North Sea fleet only
27Section 2: Business update
Business Strategy Update
Shifting from growth to execution
• Pivot Business Development Strategy
○ In response to current macro environment, new business development is focused on extending contracts
and redeploying existing assets
○ No new organic growth projects
• Project Management and Execution
○ Execute existing growth pipeline, on time and on budget
• Seek Efficiencies, While Maintaining High HSEQ Standards
○ Increasing relevance to customers by working together to reduce production costs and find efficiencies
○ Implement various cost saving initiatives
28Section 2: Business update
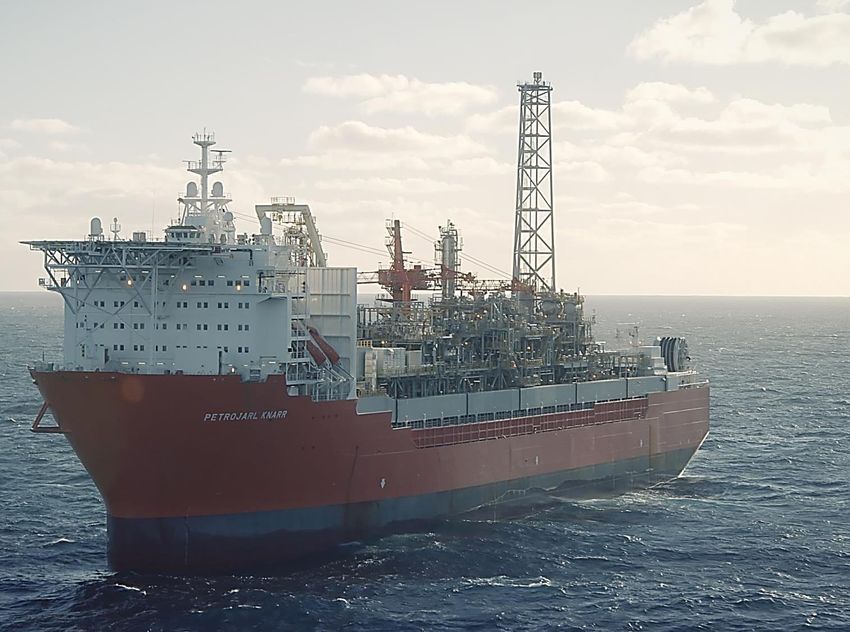
Current FPSO Fleet Contract Status
Unit Charterer Ownership 2016 2017 2018 2019 2020 2021 2022 2023
Petrojarl Varg Repsol 100%
Cidade de Rio das
Petrobras 100%
Ostras
Voyageur Spirit Premier Oil 100%
Piranema Spirit Petrobras 100% Options to 2029
Cidade de Itajai Petrobras 50% Options to 2028
Petrojarl Knarr BG / Shell 100% Firm period to 2025, options to 2035
Petrojarl I (upgrade) QGEP 100%
Petrobras / Total / Shell /
Libra (conversion) 50% Firm period to 2029
CNPC / CNOOC
Firm period Option period Available
FPSO operating fleet produces at an average cost of approximately $11 per barrel(1)
(1) Excludes the Petrojarl Varg FPSO
29Section 2: Business update
Shuttle Tanker Market Remains Tight
TOO’s shuttle tanker fleet largely sold out for 2016
• Global shuttle tanker utilization increasing
○ Combination of more lifting points and new fields coming
on-stream faster than old fields rolling off
○ North Sea shuttle tanker fleet tightly balanced
○ No uncommitted newbuildings on order
• Only two key players in the shuttle tanker segment
• Leading market positions in all three shuttle tanker
basins and strong operating platform supports higher
fleet utilization TOO’s core shuttle tanker regions
○ Flexibility to interchange assets between basins
○ CoA fleet flexibility a differentiator to win new business
− Recently awarded a 3-year firm CoA contract plus
options with an oil major for the equivalent of two
shuttle tankers commencing in H1-2017 in the North
Sea at a premium rate. Currently on subjects that are
expected to be lifted in July 2016
30Section 2: Business update
Medium-Term FPSO Opportunities
Project awards expected to increase as oil market recovers
TOO’s core FPSO regions
• There are currently 55+ potential FPSO projects in the North
Sea and Brazil
○ A number of these projects are expected to be awarded once oil
15+ potential FPSO
market conditions improve
projects
• Oil price cost break-even decreasing rapidly due to deflation
in field development and production costs
• Oil companies expected to prefer lower cost and quick-to-
market solutions
○ TOO’s FPSO units represent cost-effective, quick-to-market 40+ potential FPSO
solutions compared to newbuildings projects
Source: IEA World Energy Report published February, 2016
31Section 2: Business update
Redeployment of Existing FPSOs Economic Below $30/bbl
Oil Price
Break even range(2)
• Redeployment FBUC(1) typically 25-50% of newbuild $/bbl
50
• Reuse of existing asset offers significantly lower break-even and lifting cost than 45
comparable newbuild solution for the same field development
40
• With limited modifications TOO can offer an oil price or production linked tariff, which 35
can make marginal fields economical at oil prices in the low $20/bbl range 30
25
Varg Newbuild
Lifting cost range(3)
$/bbl
40
35
30
25
20
15
10
Varg Newbuild
Source: Alliance Bernstein
(1) FBUC = Fully built-up cost
(2) Example based on 60M bbl over 7 years with cost spread representing different specifications and investments to achieve the same production. Assumes
full depreciation of subsea, umbilicals, risers and flowlines (“SURF”) capex over the 7 year term
(3) Example lifting cost based on 30,000bbl/d average production. Lifting cost refers to the total daily running costs of producing oil after drilling is complete,
32
including FPSO cost (lease and operate), oil company’s production support, logistics and supply, standby and other daily costsSection 2: Business update
FPSO Redeployment Allows Faster Field Development
Redeployment can fast-track development timeframe by 2-3 years
Concept and FEED Transport and
Appraisal FPSO and SURF Lead Time Production
Phase Mobilization
6-12 months 3-12 months 1-2 months
Redeployment
• Short-list available candidates • Class and life extension works / • Yard location close to
○ Optimize production profiles general refurbishment field reduces
based on FPSO capacities
○ Modify FPSO to maximize • Modification of topsides to fit transportation time
production field specification
• Verification of class and life • Upgrade of existing equipment if
extension work scope required
• Process modification
• Yard and vendor selection
9-15 months 30-40 months 3-6 months
• • •
Newbuild
Several FEED teams (hull, Hull construction Construction at Asian
topsides, turret) • Topsides construction yard and
• Hull design • Hull and topsides integration.
transportation to
Europe and Brazil
• Process design Construction at several yards increases schedule
• Yard and vendor selection increases risk
33Section 2: Business update
TOO with Proven Track Record in FPSO Redeployment
Petrojarl I FPSO currently being upgraded for 10th redeployment
Max production Water
Field Country Operator Start date End date Unit availability
(barrels per day) depth
1. Oseberg Norway Norsk Hydro August 1986 June 1988 26,000 105m 98 %
2. Lyell UK Conoco June 1988 August 1988 6,400 125m 98 %
3. Fulmar UK Shell February 1989 November 1989 230,000(1) 85m 100 %
4. Troll Norway Norsk Hydro December 1989 May 1991 30,200 330m 99 %
5. Balder Norway Esso May 1991 November 1991 9,400 125m 99 %
6. Angus UK Amerada Hess December 1991 July 1993 33,500 71m 96 %
7. Hudson UK Amerada Hess July 1993 January 1995 44,000 157m 96 %
ARCO /
8. Blenheim / Bladon(2) UK March 1995 May 2000 35,000 148m 98 %
Talisman Energy
9. Kyle UK Ranger Oil May 2000 November 2000 13,500 85m 99 %
10. Glitne Norway Statoil August 2001 May 2013 47,000 110m 98 %
• Produced ~150 million bbls of oil on 10 fields
with 98% uptime
• 1,500 offloadings performed with no accidents
or oil spills
(1) Only storage and offloading
(2) Teekay Petrojarl acted as operator 34Summary
1
Current market valuation provides an entry point with significant upside potential (current EV / EBITDA(1) of 5.6x)
Attractive valuation
Further upside from potential future dividend increases (current coverage ratio of > 5x and growing DCF(2))
entry point Warrant conversion and common unit price set around historical share price lows and attractive dividend yield / coupon
Majority blue-chip customer base and diverse revenue streams; a critical part of our customers’ oil production supply chain
2 Forward fee-based revenues of $5.2 billion(3) from existing operations and $2.6 billion(3) from growth projects
Stable operating
model with built-in Average contract length of ~5 years(3)
Contract options/extensions on 2018 rollovers provides potential incremental forward fee-based revenues and extends
growth
average contract length
Strong operating track record of delivering stable and growing cash flows
3
Leading market Market leader in harsh weather FPSOs and shuttle tanker segments
Strong track record and flexible operating platform allows for high shuttle tanker fleet utilization
positions Proven FPSO redeployment offers low break-even and lifting costs compared to newbuilds
4 55+ FPSO projects in TOO’s core regions expected to be awarded industry-wide once oil market conditions improve
Significant growth in demand for oil and declining production from conventional oilfields are expected to spur new field
Strong long-term
development, with deepwater and offshore production playing an important role
market fundamentals Deepwater production forecasted to increase by 70% from 2014 levels to 10 mb/d by 2040(4), which is expected to drive
demand for FPSOs and shuttle tankers
5 Banks committed $400 million through various initiatives
Nearing completion NOK Bondholders agreed to amend and extend maturities until late-2018 (with partial amortization)
of financing initiatives Strong de-levering profile with expected Q4-2018 leverage of 3.2x
to strengthen TOO In discussions to defer delivery of two UMS units worth $397 million and contracts remain non-recourse to TOO
(1) Earnings Before Interest Taxes Depreciation and Amortization (“EBITDA”) is a non-GAAP financial measure used by certain investors to measure the financial performance of
shipping companies. See 2015 form 20-F for a reconciliation of this non-GAAP measure to the most directly comparable GAAP financial measure. See Slide 6 for further details
(2) Distributable cash flow (“DCF”) is a non-GAAP financial measure used by certain investors to measure the financial performance of Master Limited Partnership companies.
See Teekay Offshore Partners’ quarterly earnings presentations for a reconciliation of this non-GAAP measure to the most directly comparable GAAP financial measure
(3) As of January 1, 2016, excluding options
35
(4) Source: ExxonMobil outlook report 2016Agenda
Section 1: Key Investment Highlights
Section 2: Business update
Appendix
36Estimated LP Units Outstanding at the End of 2017
Estimated LP Units Outstanding
175
150
125
In Millions LP Units
100
75
50
25
0
Total LP Units Outstanding as Additional Common Units Preferred C Conversion (2H- Equity Issuance through PIK Estimated LP Units
at Dec 31, 2015 Issuances (1H-2016) (1) 2016) (2) & ATM (2016-2017) (3) Outstaning as at Dec 31,
2017 (4)
Increase in LP Units
(1) Assumes $100M common LP unit issuance through PIPE at common unit price of $4.55 per LP unit as at June 16, 2016.
(2) $46M of the $250M series C preferred shares is being exchanged for 8.3M common units
(3) Assumed unit price range is $5.40 per unit to $9.00 per unit during the period 37
(4) Assumes Series D warrants and remaining $204M Series C conversion do not get exercised until post-2017.Appendix
TOO Capitalization of March 31, 2016
% of
Item Amount Rate Financial covenants
capitalization
Cash and cash equivalents $336M
Restricted cash $23M
Aggregate drawn revolvers $405M 8.1% L+50 – L+290 Minimum liquidity(1); Minimum asset coverage(2)
Aggregate term loans and other $2,354M 46.8% L+30 – L+496 Minimum asset coverage(2)
Total secured debt $2,759M 54.9%
(3)
2017 NOK bonds $73M 1.5% N+575 Minimum liquidity : Greater of i) 5% of total debt and ii) $75 million
(3)
2018 NOK bonds $97M 1.9% N+575 Minimum liquidity : Greater of i) 5% of total debt and ii) $75 million
2019 NOK bonds(3) $121M 2.4% N+425 Minimum liquidity : Greater of i) 5% of total debt and ii) $75 million
2019 USD bonds $300M HH:
6.0%format and
6.00% take
Minimum liquidity : Greater of i) 5% of total debt and ii) $50 million
Derivative instruments(4) $416M 8.3% out…
(5)
Due to affiliates $247M 4.9%
Total debt $4,013M 79.9%
Pref. units - Series A $150M 3.0%
Pref. units - Series B $125M 2.4%
Conv. pref. units - Series C $250M 5.0%
Market equity (6/16/2016) $487M 9.7%
Total equity $1,012M 20.1%
Total capitalization $5,025M 100.0%
(1) Four revolvers require TOO to maintain minimum liquidity of the greater of i) 5% of total debt and ii) $75 million; one revolver requires TKC to maintain minimum
liquidity of the greater of i) 5% of total debt and ii) $50 million
(2) One revolver and four term loans require TOO to maintain vessel values to drawn principal balance ratios of a minimum range of 113% to 125%
(3) Based on prevailing USD / NOK exchange rate as of March 31, 2016
(4) Based on the mark-to-market as of March 31, 2016 38
(5) A $200 million promissory note due to TK Corp related to the Knarr FPSO acquisitionAppendix
Existing Preferred Equity Terms
Series A Series B Series C(1)
• 7.25% Series A Cumulative Redeemable • 8.50% Series B Cumulative Redeemable • 8.60% Series C Cumulative Convertible Perpetual
Issue Description:
Preferred Units Preferred Units Preferred Units
Original Issue Date: • April 23, 2013 • April 13, 2015 • July 1 / 14, 2015
Maturity: • Perpetual • Perpetual • Perpetual
Par Amount: • $25 • $25 • $23.95
Units Outstanding: • 6,000,000 • 5,000,000 • 10,438,413(1)
Amount: • $150M • $125M • $250M(1)
Dividend Rate: • 7.25% p.a. • 8.50% p.a. • 8.60% p.a.
• Yes (paid at 12.6% p.a. prospective if not paid in full when
Cumulative: • Yes • Yes due, with increased rate to apply until all accrued and
unpaid distributions are paid)
Dividend Frequency: • Quarterly • Quarterly • Quarterly
• Convertible into common units after 18 months after
Unitholders Optional Conversion Right: • None • None
Original Issue Date at $23.95 per unit(1)
• If common unit VWAP(2) is greater than 150% of the Par
Amount(1) for 20 trading days over a 30 day trading period,
Mandatory Conversion Right: • None • None
following the third anniversary of the Original Issue Date
the GP may convert Series C into common units
• If TOO offers to redeem, each holder may elect to redeem
First Call: • April 30, 2018 • April 20, 2020
all, but not less than all, of the Series C units(3)
Call Level: • $25 • $25 • $23.95
Listing: • NYSE • NYSE • None – Privately held
• Right to elect one director to Board of General Partner if 6 quarterly distributions are in arrears
Board Representation Rights:
(consecutive or not)
(1) TOO has secured a two-year PIK arrangement on the Series C preferred units (requirement of NOK bondholder amendments) by agreeing to (i) convert
$46million of face value of the $250 million Series C preferred units for 8.3 million common units, and (ii) exchange the remaining Series C preferred units on
a one-for-one basis into Series C-1 Preferred Units. The terms of the Series C-1 Preferred Units will be modified from the terms of the existing Series C
preferred units such that the Special Distribution will not require additional cash payments to the Series C-1 holders when TOO increases its cash
distributions by more than 30% in any particular quarter in the future; and the mandatory conversion right will be reduced to 150% of $16.25 per unit (from
150% of the $23.95 par value). As part of making these changes, TOO agreed to reduce the conversion price on the Series C-1 preferred units to $16.25
per unit (from $23.95 per unit), which is a 257% premium to TOO’s unit price on June 16, 2016.
(2) Volume Weighted Average Price (VWAP)
(3) If the Partnership elects to redeem Series A or Series B preferred units, it must also offer to redeem a corresponding percentage of outstanding Series C
39
Preferred UnitsAppendix
New Series D Preferred Units – Summary of Key Terms
TOO Key Terms
Issuer • Teekay Offshore Partners L.P. (“Issuer“)
• $100mm in 10.5% Series D Preferred Units (“Preferred Units”)
Security Type(s) • 4.5mm common unit warrants with a strike price of $4.55 per unit
• 2.25mm common unit warrants with a strike price of $6.05 per unit
• 10.5% p.a.
Preferred Unit Rate • Distribution will be payable in cash or Issuer Common Units at the Issuer’s option for the first two years, cash only
thereafter
• Preferred Redemption Right: The Issuer shall have the right to redeem the Preferred Units in cash at 110% of the
purchase price after the five year anniversary and at 105% anytime after the six year anniversary
• Conversion: Anytime after the five year anniversary, holders of the Preferred Units shall have the right to convert their
Other Key terms
Preferred Units into Common Units at the then common unit market price
• Warrants: Seven year warrants, exercisable anytime after the six month anniversary of closing. Net settlement in cash or
shares
• To fund Teekay Offshore’s existing business plan and general working capital
Use of proceeds
• Prior to June 30, 2016, subject to completion of Teekay Offshore’s financing initiatives
Closing
40Appendix
41Non-GAAP Reconciliations - DCF
(USD $millions) Year Ended
December 31, 2015
Net income 100
Net income attributable to Dropdow n Predecessor (10)
Net income attributable to the partners and non-controlling interests' 90
Depreciation and amortization 252
Vessel and business acquisition costs (1) 14
Realized loss on termination of interest rate sw ap 11
Equity income from joint ventures (8)
Distributions relating to equity financing of
new buildings and conversion costs 19
Partnership's share of equity accounted joint venture's distributable cash flow net of estimated
maintenance capital expenditures (2) 17
Write-dow n and (gain on sale) of vessels 70
Distributions relating to preferred units (29)
Estimated maintenance capital expenditures (137)
Unrealized (gains) losses on derivative instruments (3) (10)
Foreign currency exchange and other, net (23)
Distributable cash flow before non-controlling interests 267
Non-controlling interests' share of DCF (23)
Distributable Cash Flow 245
(4)
Pro forma adjustments
Knarr partial year 29
Arendal partial year 5
SPT Navigator and Explorer vessel sales (7)
Piranema offhire 6
Part year tow age delivery 5
Heidrun roll-off (Randgrid and Europa) (12)
2015 run-rate Distributable cash flow 271
1) Vessel and business acquisition costs relate to business development fees of $13.9 million paid to Teekay Corporation relating to the purchases of the Knarr FPSO unit, the six towage
vessels and the Arendal Spirit UMS.
2) Estimated maintenance capital expenditures relating to the Partnership’s equity accounted joint venture for the year ended December 31, 2015 was $4.2 million.
3) Derivative instruments include interest rate swaps and foreign exchange forward contracts.
4) Annualized for Knarr FPSO and Arendal Spirit UMS deliveries, Navigator Spirit and SPT Explorer sales and shuttle tanker contract expirations during 2015. 42Non-GAAP Reconciliations - CFVO
(USD $millions) Year Ended
December 31, 2015
Income from vessel operations 260
Depreciation and amortization 252
Realized losses from the settlements of non-designated foreign
exchange forw ard contracts (12)
Amortization of non-cash portion of revenue contracts (14)
Write-dow n of vessels 70
Falcon Spirit revenue accounted for as direct financing lease (4)
Falcon Spirit cash flow from time-charter contracts 9
Cash flow from vessel operations from consolidated vessels 560
Cash flow from vessel operations from equity accounted vessels (See next slide) 27
(1)
Pro forma adjustments
Knarr partial year 82
Arendal partial year 16
SPT Navigator and Explorer vessel sales (8)
Piranema offhire 6
Part year tow age delivery 10
Heidrun roll-off (Randgrid and Europa) (12)
2015 run-rate cash flow from vessel operations 681
1) Annualized for Knarr FPSO and Arendal Spirit UMS deliveries, Navigator Spirit and SPT Explorer sales and shuttle tanker contract expirations during 2015.
43Non-GAAP Reconciliations – CFVO Cont’d
(USD $millions) Year Ended
December 31, 2015
TOO's 50%
Voyage revenues 41
Vessel and other operating expenses (14)
Depreciation and amortization (8)
General and administrative -
Loss on sale of asset -
Incom e from vessel operations of equity accounted vessels 19
Net interest expense (4)
Realized and unrealized losses on derivative instruments (7)
Total other item s (11)
Net income / equity income of equity accounted vessel before income
tax recovery 8
Income tax (expense) recovery -
Net incom e / equity incom e of equity accounted vessels 8
Income from vessel operations of equity accounted vessels 19
Depreciation and amortization 8
Loss on sale of asset -
Cash flow from vessel operations from equity accounted vessels 27
4445
You can also read