Creating One of the World's Leading Independent Listed African E&Ps - Corporate Presentation - Cision
←
→
Page content transcription
If your browser does not render page correctly, please read the page content below
Creating One of the World’s Leading
 Independent Listed African E&Ps
             Corporate Presentation

                10 February 2021      www.panoroenergy.com
Disclaimer
This company presentation (the “Presentation") has been prepared solely for information purposes with respect to Panoro Energy ASA (“Panoro”or the “Company”, and together with its subsidiaries, the "Group").
This Presentation is furnished by the Company for information purposes only, and it is expressly noted that no representation or warranty, expressed or implied, as to the accuracy or completeness of any information included herein is given by the
Company and that no information, including projections, estimates, targets and opinions, contained in this Presentation is or can be relied upon as a promise or representation by the Company .
The Company has announced the signing of transaction agreements for the acquisition of the interests of TullowOil Plc. in (i) the DUSSAFU Permit and (ii) the CEIBA and OKUME COMPLEX Permits by way of acquisition of the entire share capital in Tullow
Equatorial Guinea Limited (to be renamed post acquisition) (“TEGL”) (the "Transactions"). Further information on the Transactions are set out herein. However, readers of this Presentation should note that the Presentation might not cover all matters that
would be of interest to an investor in the Company with respect to the Transactions and that the Presentation is prepared on this basis. The Company makes no undertaking, representation or warranty, expressed or implied, regarding the accuracy or
completeness of the information described herein, and the Company expressly disclaims to the fullest extent permitted by law any liability whatsoever in connection with the matters described herein. This Presentation contains information obtained from
third parties. Such information has been accurately reproduced and, as far as the Company is aware and able to ascertain from the information published by that third party, no facts have been omitted that would render the reproduced information to be
inaccurate or misleading.
This Presentation contains certain forward-looking statements relating to the business, financial performance and results of the Group and/or the industry in which it operates. Forward-looking statements concern future circumstances and results and
other statements that are not historical facts, sometimes identified by the words “believes”, "expects”, “predicts”, “intends”, “projects”, “plans”, “estimates”, “aims”, “foresees”, “anticipates”, “targets”, and similar expressions. The forward-looking
statements contained in this Presentation, including assumptions, opinions and views of the Company or cited from third party sources are solely opinions and forecasts which are subject to risks, uncertainties and other factors that may cause actual
events to differ materially from any anticipated development. Neither the Company nor any of its subsidiary undertakings nor any of such person’s officers or employees, nor any of the Company’s advisors provide any assurance that the assumptions
underlying such forward-looking statements are free from errors nor do any of them accept any responsibility for the future accuracy of the opinions expressed in this Presentation or the actual occurrence of the forecasted developments. The Company
does not assume any obligation, except as required by law, to update any forward-looking statements or to conform these forward-looking statements to our actual results.
An investment in the Company and its shares should be considered as a high-risk investment. An investment in the Company is only suitable if you have sufficient knowledge, sophistication and experience in financial and business matters to be capable of
evaluating the merits and risks of an investment decision relating to the Company's shares, and if you are able to bear the economic risk, and to withstand a complete loss of your investment. Several factors could cause the actual results, performance or
achievements of the Company to be materially different from any future results, performance or achievements that may be expressed or implied by information in this Presentation.
By reading this Presentation you acknowledge that you will be solely responsible for your own assessment of the Group and that you will conduct your own analysis and be solely responsible for forming your own view of the potential future performance
of the Group’s business.
The contents of this Presentation shall not be construed as financial, legal, business, investment, tax or other professional advice. You should consult your own professional advisers for any such matter and advice.
The distribution of this Presentation and the offering, application, purchase or sale of shares issued by the Company in certain jurisdictions is restricted by law. This Presentation does not constitute an offer of, or an invitation to purchase, any shares or
financial instruments of Panoro. No one has taken any action that would permit a public offering of shares of financial instruments to occur in any jurisdiction. Neither this Presentation nor any advertisement or any offering material may be distributed or
published in any jurisdiction except under circumstances that will result in compliance with any applicable laws and regulations.
This Presentation does not constitute a prospectus pursuant to the EU Prospectus Regulation (Regulation (EU) 2017/1129). Accordingly, this Presentation has not been, and will not be, approved or reviewed by, or registered with, the Financial Supervisory
Authority of Norway (Finanstilsynet) or any other supervisory authority.
Neither this Presentation nor any copy of it may be taken, transmitted or distributed, directly or indirectly, in or into the United States, Canada, Australia or Japan, except as permitted under applicable securities law. Any failure to comply with this
restriction may constitute a violation of the United States, Canadian, Australian or Japanese securities laws. The Presentation is also not for publication, release or distribution in any other jurisdiction where to do so would constitute a violation of the
relevant laws of such jurisdiction nor should it be taken or transmitted into such jurisdiction and persons into whose possession this Presentation comes should inform themselves about and observe any such relevant laws.
This Presentation speaks as of the date set out on its cover. Neither the delivery of this Presentation nor any further discussions of the Company with any of the recipients shall, under any circumstances, create any implication that there has been no
change in the affairs of the Company or the Group since such date.
This Presentation is subject to Norwegian law, and any dispute arising in respect of this Presentation is subject to the exclusive jurisdiction of Norway with Oslo as legal venue.

                                              Creating One of the World’s Leading Independent Listed African E&Ps                                                                                                                                              Slide 2
Transaction
                Overview

              Panoro Energy
                Overview

                Equatorial
                 Guinea

                Existing
                Portfolio

Transaction
Overview        Outlook &
                Summary

              Supplementary
                 Material
Overview of the Acquisitions1
Transformational Acquisitions of Producing Assets in West Africa
                                                                                                                 KEY FIGURES4
• US$ 140 million2 acquisitions of
  14.25%3 WI in Ceiba/Okume (EG)
                                                                                                                 Producing oil fields                                                                            7
  and 10% in Dussafu Marin (Gabon)                                                                               MMbbl 2P                                                                                      25.1
   →   1 July 2020 effective date                                                                                MMbbl 2C5                                                                                     29.0
   →   Acquired from Tullow as part of their
       portfolio management program                                                                 EQUATORIAL
                                                                                                                 Bopd production (H2 2020)                                                                    6,000
                                                                                                      GUINEA
• Assets characteristics
                                                                                                                 Opex / bbl EG (H2 2020e)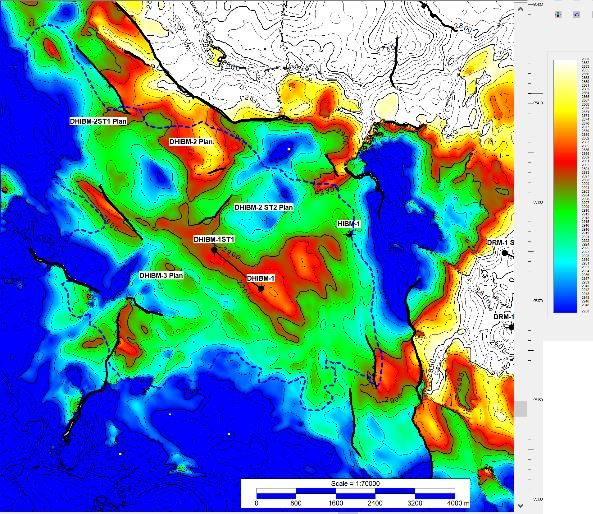
Transformational Impact on Panoro
Significantly Increased Scale, Robustness, Diversification and Upside Potential

                                                                  Panoro pre-Acquisitions                             Acquisitions                                       Panoro post / pre:

     # of
Producing
    Fields
                                               6                                                                        71                                                   +2.0x1
Production
   2021e2
                       2,500 bopd                                                                6,900 bopd                                                                   +3.8x
       2P
 Reserves3                 13.4 MMbbl                                                           25.1 MMbbl                                                                    +2.9x
       2C            4.0
Resources3        MMbbl                                                      29.0 MMbbl                                                                                       +8.3x
Operating
Cash Flow
                     $14                                                               $67 million                                                                            +5.8x
   2021e4         million
             0%                                 25 %                                 50 %                                 75 %                                100 %

  Post the Acquisitions and Financing, Panoro will be fully financed for all foreseeable
           capex and production ramp-up to ~12,000+ bopd net WI in 2023e

        1. Acquisitions include Dussafu (Tortue field producing) where Panoro already has interest, i.e. 6 out of 7 producing fields acquired are added
        2. Working interest production based on management estimates – in line with operator
        3. Working interest from ASR as at 1/1/20 and working interest CPR from TRACS as at 1/7/20
        4. Operating cash flow after tax, before interest. Based on production volumes not actual liftings/revenue recognition. Subject to completion adjustments from effective date of 1 July
           2020. Management estimates at US$ 55/bbl Brent                                                                                                                                         Slide 5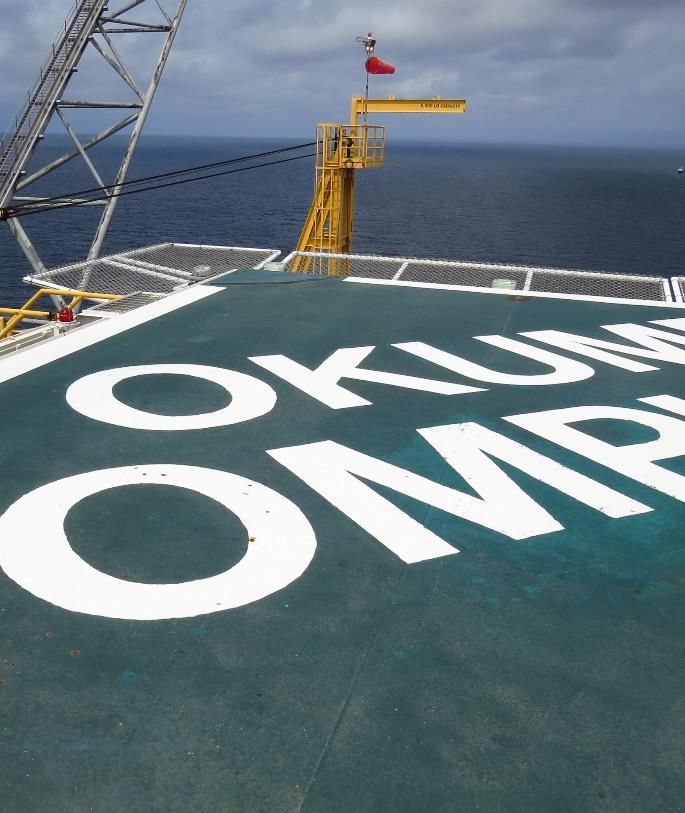
Significantly Increased Production and Cash Flow Outlook
Positioned to Pay Substantial Dividends from 2023 Onwards

 NET WI PRODUCTION (2P CASE)1                                                                                 CASH FLOW OUTLOOK (2P CASE)2
                                                                                                                                                                                                 • More than tripling of current
kbopd                                                                                                        US$ million                                                                           production base with strong
                                                                                                            175
                                                                      Upside from
                                                                                                                                 Free cash flow pre debt service 3                                 growth outlook, both near and
                                                                                                                                                                           4
12
                                                                      2C resources                                               Indicative year-end cash position                                 longer term
                                                                                                            150
                                                                                                                            Substantial free cash

10
                                                                                                                        generation, providing material                                           • As a result operating cash flow
                                                                                                            125           capacity for dividends and
                                                                                                                         further growth investments                                                significantly enhanced, more
 8
                                                                                                                                                                                                   steady and diversified
                                                                                                            100

                                                                                                                                                                                                 • Strong free cash flow
 6                                                                                                            75
                                                                                                                                                                                                   generation from 2023 onwards,
                                                                                                                                                                                                   after Dussafu Hibiscus/Ruche
 4                                                                                                            50
                                                                                                                                                                                                   Phase 1 on stream…
 2                                                            Acquisitions
                                                              Panoro pre-deal
                                                                                                              25                                                                                 • … positioning Panoro for
                                                                                                                                                                                                   dividends and further growth,
 0                                                                                                             0
        H2'20       2021            2022           2023            2024           2025                                    2021               2022               2023               2024   2025
                                                                                                                                                                                                   organic and inorganic

            1. Management estimates mid case based on CPRs
            2. Management estimates mid case, based on Brent at US$ 55/bbl in 2021 and US$ 50/bbl in 2022-2025
            3. After tax. Based on production volumes not actual liftings/revenue recognition. 2021 cash flow is subject to completion adjustments from effective date of 1 July 2020
            4. Indicative cash position after all scheduled debt service prior to any dividend or debt cash sweep (40% of forecasted excess cash used to accelerate debt repayment)                                           Slide 6
Financing of the Acquisitions
US$ 70 million Equity and up to US$ 90 million Debt Financing

• Equity: US$ 70 million equity private placement completed1                                           SOURCES AND USES

                                                                                                       Sources - US$ million                                                     Uses - US$ million
• Debt: Up to US$ 90 million committed debt facility with Trafigura group2                             Equity                                                    70              Acquisition Price                                140
   →   Conventional RBL type structure on Panoro Gabon and Equatorial Guinea assets                    Debt                                                      90              Transactions costs and
                                                                                                                                                                                                                                   20
   →   Key terms: 5-year tenor, 7.5% margin over 3-month LIBOR, US$ 50 million                                                                                                   Working capital3,4
       accordion option, up to US$ 20 million working capital facility, semi-annual linear             Total                                                   160              Total                                             160
       amortizations, conventional RBL covenants, crude oil marketing
   →   Cash sweep mechanism provides that ca 40% of forecasted excess cash pays
       debt down faster than 5-year amortization and still allows for dividends                        PRO FORMA CAPITAL STRUCTURE5
   →   No long-term oil hedging requirement; hedging of a portion of production up to                  US$ million
       12 months forward likely to manage price risk on crude liftings                                                                                                                  26
                                                                                                                                                      111
   →   Element of fees payable by issuance of US$ 562,500 equivalent in Panoro shares
                                                                                                                     70                  Completed private placement1
• Post the financing and the Acquisitions, Panoro will be fully financed for                                                                                                                                             288
  all foreseeable capex and production ramp-up to ~12,000 bopd net WI
                                                                                                                    132                  Market cap. (8 Feb 2021)

                   • One of the world’s leading independent commodity trading and logistics houses                Equity                        Gross debt                            Cash                                EV
                   • Regular lender to oil & gas companies                                               1. Approx. US$ 57 million is subject to EGM approval
                                                                                                         2. Trafigura group will also be offtaker of crude oil produced from the Equatorial Guinea fields at market terms. Debt
                                                                                                            facility consists of two tranches for a total amount of up to US$ 90 million
                                                                                                         3. Includes transfer taxes of US$ 4.5 million, fees related to Debt and Equity Private Placement and legal costs
                                                                                                         4. Working capital and completion adjustments are subject to change due to timing of completions of Acquisitions
                                 Creating One of the World’s Leading Independent Listed African E&Ps     5. Pro forma for contemplated debt and equity financing. The numbers for cash and debt are provisional and
                                                                                                                                                                                                                                  Slide 7
                                                                                                            unaudited and may differ from the full year 2020 results which are yet to be announced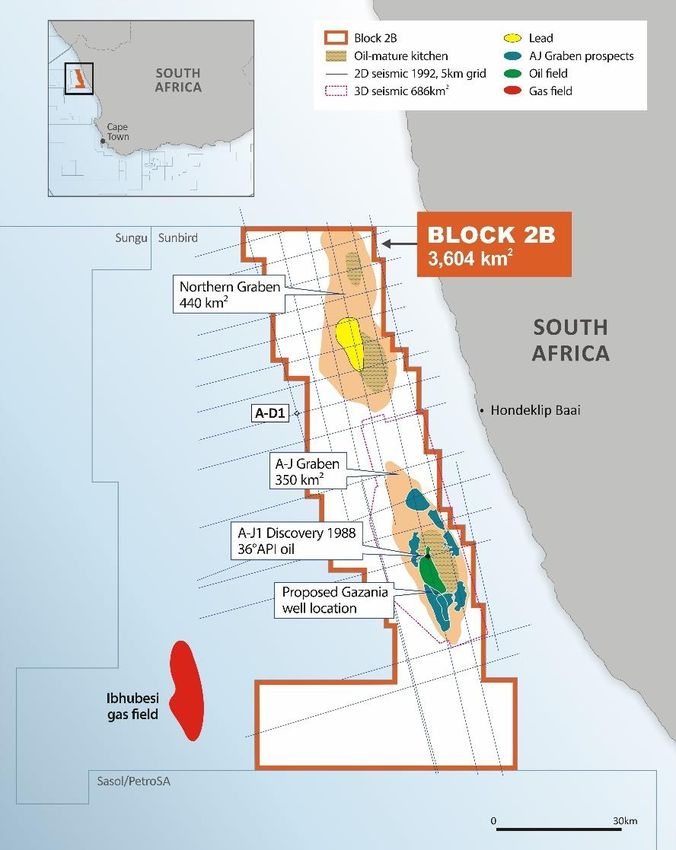
Indicative Timeline for the Acquisitions and Financing

                                                                                           February                                March
                                                                                                                                                            Acquisitions
                                                      Accomplished
                                                                                                                                                            →   SPAs signed
                                                        milestone
                                Week starting ->                            1/2         8/2         15/2        22/2   1/3   8/3           15/3      22/3
                                                                                                                                                            →   Tullow GM approval expected 3-4 weeks after private placement
                                                                                                                                                                - exact date subject to UK FCA approval of circular. The
               SPAs signed                                                                                                                                      acquisition of 14.25% WI in Ceiba/Okume is subject to GM
Acquisitions

                                                                                                                                                                approval while the acquisition of 10% WI in Dussafu Marin is not
               Tullow GM
                                                                                                                                                            →   Closing subject to customary conditions, including (but not
                                                                                                                                                                limited to) government consent and pledge releases
               Government approval / Closing                                                                                        Expected H1’21

                                                                                                                                                            Debt financing
               Committed and final TS agreed
                                                                                                                                                                Financing is fully committed, subject to customary closing
Debt

                                                                                                                                                            →
                                                                                                                                                                conditions including (i) final long-form documentation, and
               Term sheet signed                                                                                                                                regulatory approvals, where necessary; (ii) signed oil marketing
                                                                                                                                                                agreement; (iii) committed minimum equity contribution; (iv) no
               Launch, bookbuild, allocation                                                  Overnight private placement                                       material adverse change; and (v) completion of the Acquisitions

               Summon EGM                                                                                                                                   Equity financing
Equity

                                                                                                                                                            →   Overnight private placement completed 9 February
               EGM
                                                                                                                                                            →   Panoro EGM on or about 3 March

               Prospectus (indicative timing)

                                                Creating One of the World’s Leading Independent Listed African E&Ps                                                                                                    Slide 8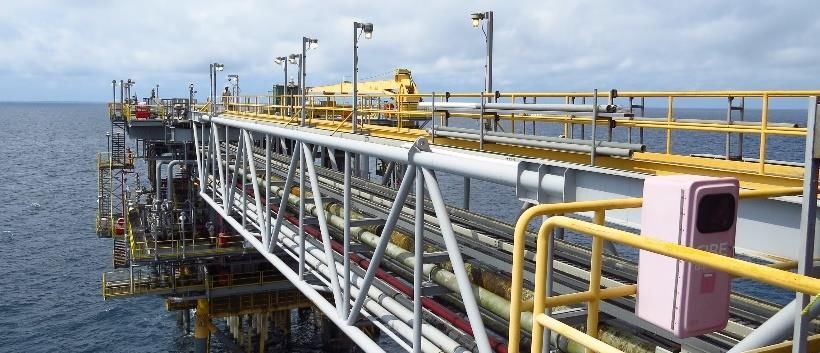
Summary – Acquisitions Highlights
Creating One of the World’s Leading Independent Listed African E&Ps

  TRANSFORMATIONAL                               EXCELLENT                                         HIGH QUALITY             MATERIAL                                    STRONG FREE
      GROWTH                                      METRICS                                           ASSET BASE               UPSIDE                                      CASH FLOW

     ~3-4x immediate                        Acquisitions                                            Low opex            Multiple production                           Significantly
   increase in Panoro’s                  materially accretive                                     and breakevens       growth & exploration                       increased cash flow
        production                         on all metrics                                                                 opportunities
     and reserve base                                                                             Long-life assets                                                    Panoro fully
                                         Payback in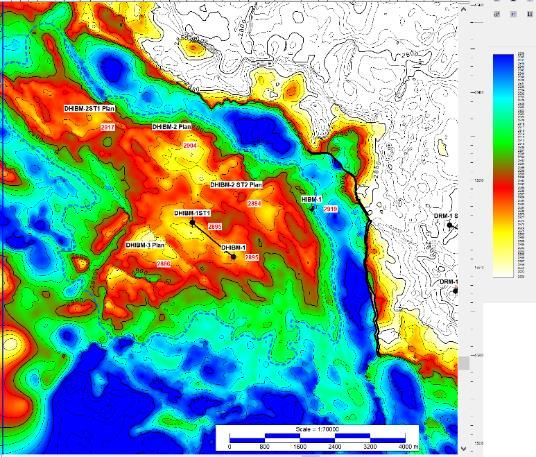
Transaction
             Overview

           Panoro Energy
             Overview

             Equatorial
              Guinea

Panoro       Existing

Energy
             Portfolio

Overview     Outlook &
             Summary

           Supplementary
              Material
Panoro at a Glance
CEIBA/OKUME - EQ. GUINEA SFAX & TPS PERMITS - TUNISIA PRO FORMA PROFILE2
Market Cap
TUNISIA
Number of
Assets
Number of
Licences
SFAX Exploration
Permit
TPS Assets
Permit ~US$ 202m
2 6 52.5% 29.4% Pre acq. - US$ 132m
ownership ownership
Net Debt
Okume Ceiba NIGERIA
Permit Permit ~US$ 86m
14.25% 1 14.25% 1 EQUATORIAL Pre.acq- US$ 6m
ownership ownership GUINEA
BLOCK 2B
SOUTH AFRICA
GABON
Net Reserves
DUSSAFU MARINE PERMIT - GABON
~38.5 MMbbl
Block 2B
Pre.acq - 13.4 MMbbl
Permit
Number of SOUTH 12.5% 1
2P Gross The Dussafu
Discovered Fields Reserves Marine Permit AFRICA ownership H2 Net Production
6 111 17.5% 1
APPROVALS PENDING ~8,400 bopd
MMbbl ownership
Pre.acq- ~2,250 bopd
1. Subject to Governmental approvals and other condition precedents
2. Pro forma market cap is market cap per 8 February 2021 plus gross proceeds from equity issue. Net debt is
based on provisional and unaudited YE 2020 estimates and may differ from the full year 2020 results which
Creating One of the World’s Leading Independent Listed African E&Ps are yet to be announced. 2P reserves are working interest share as reported in the ASR plus certified
reserves from the acquisition. Production is on a working interest basis. Slide 11Management Team and Board of Directors
EXECUTIVE MANAGEMENT TEAM BOARD OF DIRECTORS
Joined 2015 Joined 2010 Joined 2014 Joined 2014
John Hamilton Qazi Qadeer Mr. Julien Balkany Mr. Torstein Sanness
Chief Executive Officer Chief Financial Officer Chairman Deputy Chairman
Joined 2008 Joined 2019 Joined 2015 Joined 2015 Joined 2016
Richard Morton Nigel McKim Mr. Garrett Ms. Alexandra Mrs. Hilde
Technical Director Projects Director Soden Herger Ådland
Creating One of the World’s Leading Independent Listed African E&Ps Slide 12Environmental, Social and Governance
Robust HSSE Procedures Delivered Recent Campaign in Tunisia without Incident
ENVIRONMENT SOCIAL
• Panoro is committed to reducing its greenhouse gas • We are committed to working with our employees,
(GHG) emissions through the efficient operation of partners and other stakeholders to achieve the
our existing equipment and infrastructure highest industry safety standards and to reduce
• The Company is working towards enhancing its
operating risks
emissions management and data capture over its • Panoro is an equal opportunity employer and has
entire portfolio enshrined this within its human resources policies.
• Solar project at TPS asset in Tunisia initiated
GOVERNANCE
• We are dedicated to ensuring that the
company’s presence has a positive impact on
every stakeholder
• 2020 will be our baseline year for all HSSE data
and with additional reporting we can effectively
manage and improve our performance over
each aspect of ESG
Installed by Panoro and ETAP in 2019/20 as first solar initiative
Creating One of the World’s Leading Independent Listed African E&Ps Slide 13High Levels of Corporate Activity
RECENT M&A TRANSACTIONS
December 2016 July 2018 November 2018 October 2019
Farm-out of 25% interest Acquisition of DNO Acquisition of OMV Agreement to Sell OML 113 February 2021
in Dussafu to BW Energy Tunisia AS Tunisia Upstream Nigeria to PetroNor Tullow Acquisitions
• Historic costs reimbursed to • No cash consideration paid GmbH • All share consideration of • US$ 140 million cash
Panoro of US$ 12 million • US$ 65 million cash US$ 10 million in PetroNor shares consideration
• US$ 8.6 million cash retained in
• Non-recourse loan of up to US$ the acquired company plus DNO consideration • Distribution of PetroNor shares as • Transformative
12.5 million paid by subscribing US$ 4.2 million in the • 2,000 bopd production dividends upon completion acquisitions, adding
BWE towards Phase 1 equity private placement acquired together with a high high quality, low cost oil
• Additional consideration producing assets …
development cost • Exposure to exploration acreage profile local strategic partner receivable of up US$ 25 million
in Tunisia and gained a base of in Beender linked to project milestones • ...and increasing
operations with competent staff • Significant synergies with DNO Panoro’s reserve and
in-country Tunisia acquisition production base 3-4x
2016 2017 2018 2019 2020 2021
July 2018 November 2018 October 2019
February 2021
• Issue size: US$ 8.3 million (raised in • Issue size: US$ 30 million (raised in • Issue size: US$ 16 million (raised to gain financial
conjunction with DNO transaction) conjunction with OMV transaction) flexibility for Dussafu development) • US$ 70 million equity
private placement, in
• Substantially oversubscribed • Substantially oversubscribed by • Oversubscribed conjunction with the
• Discount to share price: 3.6% multiple times • Discount to share price: 2% Tullow Acquisitions
• Subscription price: NOK 12.82/sh • Discount to share price: 1.5% • Subscription price: NOK 23.90/sh
• Subscription price: NOK 16.10/sh
RECENT EQUITY PRIVATE PLACEMENTS
Creating One of the World’s Leading Independent Listed African E&Ps Slide 14Selected Financials 2020
• Net working interest production of 2,357 bopd KEY FINANCIALS (US$ million)
in Q4 2020 and 2,219 bopd full year 2020 30 Sep 20 31 Dec 20
(YTD)1 (est.)2
• Operating cost remained in line with guidance Total revenue (YTD) 16.1 26.8
despite incremental COVID related costs EBITDA 3.1
• Consistent decline in G&A in each quarter of Net profit/(loss) after tax from continuing operations3 1.2
the year - Including discontinued operations (1.1)
Underlying net profit/(loss) before tax3,4 (0.2)
• Hedging position remains strong with
Cash and bank balances5 15.6 15.7
~US$ 4.5 million cash income for the full year
Gross debt6 21.9 21.3
Capital expenditure – cash basis 10.1
1. The historical numbers have been extracted from Panoro’s Third Quarter report published on 23 November 2020
2. The year end estimates of 31 December 2020 are best estimates from the Company and may differ from the Q4 2020 results and 2020 annual report which is
yet to be announced
3. Following agreement to sell Aje to PetroNor in Q4 2019, the results and operations have been classified as discontinued operations and the asset has also been
classified as held for sale. Numbers including comparatives in income statement have been re-classified to remove and disclose Aje operations separately in a
single line of the income statement
4. Non-GAAP Financial Measures. The Group has enhanced its disclosures and introduced the reporting of Underlying Operating Profit/(Loss) before tax, a Non-
GAAP Financial Measure. Underlying Operating Profit/(Loss) before tax is considered by the Group to be a useful additional measure to help understand
underlying operational performance. The definition and details of this Non-GAAP measure can be referred to on page 8 of the Third quarter, 2020 report.
5. Includes US$ 10 million held for SOEP Guarantee as at 30 September 2020 and 31 December 2020
6. Mercuria Senior Secured Loan and BW Energy Non-Recourse Loan
Creating One of the World’s Leading Independent Listed African E&Ps Slide 15Stakeholder Overview
SHAREHOLDER OVERVIEW (PRE EQUITY ISSUE) LENDING PARTNERS
Rank Shareholder Holding (%)
1 SUNDT AS 8,450,000 12.24 % Large, diverse, and supportive existing Committed up to US$ 90
million debt facility on Gabon
shareholder base
2 KISTEFOS AS 7,833,288 11.35 % and Eq. Guinea assets
JULIEN BALKANY AND ASSOCIATED
3 3,166,244 4.59 %
INVESTMENT COMPANIES → One of the world’s leading independent
4 VERDIPAPIRFONDET DNB SMB 2,790,427 4.04 % commodity trading and logistics houses
5 ALDEN AS 2,346,884 3.40 % → Regular lender to oil & gas companies
6 HORTULAN AS 2,325,000 3.37 % 4,000 Top ten
shareholders >40% of shares
7 F1 FUNDS AS 1,119,000 1.62 % US$ 14.1 million debt facility
(Panoro’s net share) on Tunisian
8 SIMEN THORSEN 1,050,000 1.52 % assets (31.12.20)
9 F2 FUNDS AS 1,018,000 1.47 %
10 TORSTEIN INGVALD TVENGE 1,003,374 1.45 %
Top 10 includes several Good daily liquidity → One of the largest integrated energy and
long standing commodity trading companies in the world
shareholders
TOP 10 SHAREHOLDERS 31,102,217 45.06 %
→ Experienced debt provider to oil & gas
Shareholder overview per 8 February 2021 companies
Creating One of the World’s Leading Independent Listed African E&Ps Slide 16Transaction
Overview
Panoro Energy
Overview
Equatorial
Guinea
Equatorial Existing
Portfolio
Guinea Outlook &
- Ceiba & Okume Summary
Supplementary
MaterialEq. Guinea Gabon Tunisia Other
Ceiba and Okume Complex Overview
Reliable Producing Oil Fields with Strong Cash Flow and Growth Potential
Strong production and cash flow providing self KEY FIELD DATA
funded near term growth Ceiba Okume Complex1
• 34,000 bopd gross production in 2020… Working interest
Trident Energy (40.375% op.2), Kosmos Energy (40.375%2), Panoro
(14.25%2), GE Petrol (5%)
• … with potential increase to ~55,000 bopd from 2023 Water depth 600 - 800 metres 50 – 850 metres
• 13 US$/bbl opex and growth projects with low capex intensity Discovery year 1999 2001/2
First production 2000 2006-11
Material remaining reserves base with large upside Cuml. production 30.06.2020 204 MMbbl 237 MMbbl
2P / 2C 1.7.2020 (gross)3 27 / 72 MMbbl 73 / 107 MMbbl
• 100 MMbbl gross 2P reserves, 158 MMbbl 3P reserves, and
Production 2020 (gross) ~12.3 kbopd ~21.3 kbopd
179 MMbbl 2C resources
Opex LoF3 15 US$/bbl 12 US$/bbl
• Upside projects can be funded from production cash flow PSC expiry Dec. 2029 Jul. 2034
Decom. costs (net)3 US$ 59 million US$ 52 million
Highly proactive operator specializing in midlife assets
• Focus on growth from untapped potential and efficiencies
• Proven asset performance improvements
1. Consists of the Okume, Elon, Oveng, Ebano and Akom North fields
2. Trident Energy and Kosmos Energy have 42.5% paying interest and Panoro has 15% paying interest. GE Petrol is the National Oil Company
of the Republic of Equatorial Guinea and has a carried interest
Creating One of the World’s Leading Independent Listed African E&Ps 3. 2P, 2C, opex LoF and decom. costs are estimates per the CPR from TRACS on a working interest basis Slide 18Eq. Guinea Gabon Tunisia Other
Development History - Ceiba and Okume Complex
HISTORY AND DEVELOPMENT OVERVIEW FIELD AND INFRASTRUCTURE LAYOUT
Ceiba
• Discovered in 1999 – first oil in 2000
• Developed with six subsea manifolds, each with water injection,
tied-back to the Ceiba FPSO
• Active (total) well count: 16 (26) producers and 10 (15) injectors
Okume Complex
• Consists of five fields discovered in 2001/02 – first oil in 2006-11
• Developed utilising four fixed jackets located at the Elon field and
two tension leg platforms (remaining fields)
• All fields tied back to a central processing facility at the Okume
Charlie platform – export via 25km pipeline to Ceiba FPSO 48 production wells 22 water injection wells
• Active well count: 32 producers and 12 injectors, 81 wells in total
2 tension leg platforms 4 jacket platforms
Tied back to the Ceiba FPSO for processing and/or exports
Creating One of the World’s Leading Independent Listed African E&Ps Slide 19Eq. Guinea Gabon Tunisia Other
Production History and Outlook - Ceiba and Okume Complex
HISTORIC AND FORECASTED PRODUCTION (GROSS)1
• Ceiba first oil late 2000 - production peaked
kbopd at ~70 kbopd in Q2 2002
120
• Okume Complex commenced production
late 2006 - peak production close to 90
100 kbopd in H2 2010
Trident replacing Hess as operator –
arresting production decline and • Combined plateau production of +110
80 preparing plans for new growth phase kbopd in 2008-10
• Substantial decline due to underinvestments
60
prior to sale from Hess to Trident / Kosmos
late 2017
40
• Production stabilized / increased with
Trident as operator without drilling new
20
wells – current production in excess of ~32
kbopd (~4.5 kbopd net)
0 H1 H2
2000 2002 2004 2006 2008 2010 2012 2014 2016 2018 2020 2021 2023 2025 2027 2029 2031 2033
• With resumption of drilling, production
potential of ~55 kbopd (~8 kbopd net) in
Ceiba Okume Comp. Ceiba 2P Okume Comp. 2P Ceiba 2C Okume Comp. 2C
2023-25
1. Ceiba licence expiry in 2029 and Okume Complex in 2034 – expected to be aligned to 2034 for operational purposes with further extensions
Creating One of the World’s Leading Independent Listed African E&Ps possible. Production numbers are management estimates based on the CPR from TRACS and assumes Ceiba extension to 2034 Slide 20Eq. Guinea Gabon Tunisia Other
Significant Resource Upside from Increased Recovery & PSC Extension
• 440 MMbbl produced by 30.06.2020 SIGNIFICANT UPSIDE POTENTIAL1
• Remaining 2P reserves of 100 MMbbl gross based on: 35%
MMbbl Potential to increase recovery factor +63% recovery
→ ESP installations in a number of wells 2020-21
800
→ Stimulation campaigns and further zone completions 2020-21 136 719
700
→ Infill drilling at Elon and Oveng 2021-22
43
600 21%
• Substantial additional potential: recovery 100
→ 2C resources of 43 MMbbl is attributed to extension of 2P profiles 500
440
beyond licence end dates:
400
→ Further 2C resources of 136 MMbbl from facility upgrades, well
workovers, perforation of behind pipe zones, infill drilling and licence 300
extension to 2050
200
• Very limited capex required to realise 2P case …
100
→ US$ 125m (gross) driven mainly by drilling and facilities capex on Okume Net capex
0
• … while realizing 2C is estimated to require US$ ~1bn (gross), Produced 2P 2C ext.2 2C 2P + 2C
with vast majority of capex related to drilling on both Okume
Complex and Ceiba US$ 19m US$140m
1. 2P reserves, 2C resources and capex are estimates from the CPR from TRACS
Creating One of the World’s Leading Independent Listed African E&Ps 2. 2C attributed to extension of 2P profiles beyond license end dates Slide 21Eq. Guinea Gabon Tunisia Other
First Class Operating Partnership
Responsible for production Responsible for exploration and
operations and optimization subsurface evaluation
• “Bringing new life to midlife assets” • “Kosmos searches for every opportunity to increase
production and grow cash flow”
• Highly proactive operator specializing in midlife
assets • Kosmos has a strong track record as proven oil finders
• Supported by Warburg Pincus, the Trident team has • The Kosmos team originally discovered and managed
background from Perenco operating 450 kbopd the Ceiba and Okume fields for Triton and have a deep,
production, managing operations across 15 long term understanding of the subsurface
countries in four different continents performance and nearby exploration potential
• Strong focus on growth from untapped potential • “Several subsalt and structural plays identified beneath
and efficiencies and adjacent to Ceiba and Okume”
• Proven asset performance improvements
Creating One of the World’s Leading Independent Listed African E&Ps Slide 22Transaction
Overview
Panoro Energy
Overview
Equatorial
Guinea
Existing Existing
Portfolio
Portfolio
Outlook &
Summary
Supplementary
MaterialFAST
Gabon The Dussafu Marin Permit FACTS
Panoro acreage
SELECTED O&G COMPANIES
IN GABON (2015-2020) Number of
Discovered
Fields
6
DUSSAFU MARIN
2P Gross
Reserves1
111
• Panoro active in Gabon since 2007 MMbbl
• Located in prolific oil fairway
• PSC offers favourable climate for investment
• Partner with BW Energy and Gabon Oil The Dussafu
Marine Permit
• Largest exploitation area in Gabon
17.5%2
ownership
1. 2P reserves as per 31/12/19 are based on the CPR by NSAI
Creating One of the World’s Leading Independent Listed African E&Ps 2. 10% subject to governmental approvals and other condition precedentsEq. Guinea Gabon Tunisia Other
Dussafu has an Outstanding Track Record
15 Consecutive Successful Well Penetrations (2011-20)
DTM 2-H DTM 4-H, 5-H & 6H
RUCHE TORTUE 3D SEISMIC RUCHE NE HIBISCUS
PRODUCTION DTM 3-H PRODUCTION
DISCOVERY DISCOVERY DISCOVERY DISCOVERY
WELL WELLS
2011 2013 2014 2018 2018 2018 2019 2019/20
+ + + + +
Sidetrack 1 Sidetrack DTM 3 DRNEM-1 Sidetrack
Sidetrack 2 Appraisal Sidetrack
Sidetrack
7 MMbbl +20x increase in reserves and resources – significant further growth potential and running room 153 MMbbl
(2C, YE’10) (2P+2C1, YE’19)
Creating One of the World’s Leading Independent Listed African E&Ps 1. Includes 5.5 MMbbl production over the period. 2P+2C are from the ASR and based on the NSAI CPR Slide 25Eq. Guinea Gabon Tunisia Other
Dussafu Reserves and Resources1
Increased Growth Over Time
MMbbl Produced 2P 2C Hibiscus Upside
2P and 2C split
per field
300
260 Tortue Ruche Ruche NE
Hibiscus Other
250
150
Hibiscus
14.5
Upside 2.4
5.1
200 120 13.8
153
150 90 43.7
5.5
100 60
17.8
70
52
50 30
36 44.4
17
7
0 0
End 2010 End 2011 End 2013 End 2017 End 2018 End 2019 Future 2P 2C
Moubenga Ruche NE
New seismic Seismic
and Walt Ruche Tortue and Tortue Hibiscus
and Tortue FID reprocessing
Whitman Appraisal
Creating One of the World’s Leading Independent Listed African E&Ps 1. 2P+2C are from the ASR as at 1/1/20 and based on the CPR by NSAI, and Hibiscus Upside is an estimate from the Operator Slide 26Eq. Guinea Gabon Tunisia Other
Phased Development Approach…
… Targeting 111 MMbbl Reserves with Vast Upside Potential
GROSS RESERVES AND RESOURCES1
Tortue • Two wells on production (DTM-2H and 3H), tied back to the Adolo FPSO
+130% 258 MMbbl (total)
2018
Phase 1 • ~12,000 bopd gross total production
36
• Four production wells: DTM-4H and 5H on production, DTM-6H (already 111
Tortue drilled) and DTM-7H to come online in Q3 2021 111 MMbbl
2019
Phase 2 31
• 2020 gross production 14,140 bopd, 2021e 16,000 bopd 36 Hib/Ruche ph2 Hib/Ruche ph1
24 Tortue ph 1 + 2 2C at various fields
20
• Development of the Hibiscus and Ruche fields 2P 2C / Upside
• Cost savings being implemented, improving cash breakeven to US$ 25/bbl
Hibiscus/ (IRR of 15% at US$ 30/bbl Brent) GROSS PRODUCTION POTENTIAL2
Ruche
• Development comprises converted jack-up rig3 as platform, providing US$ +91%
Phase 1 100 million phase 1+2 capex savings vs previous concept, tied back to the
kbopd
2022
Adolo FPSO and 6 wells (2 in Ruche, 4 in Hibiscus)
+38%
• Total of 6 wells planned (2 in Ruche, 2 in Hibiscus, 2 in Ruche NE) 42
Hibiscus/ 22
• Evaluating significant upside as reprocessed seismic suggests 16
Ruche Hibiscus may hold 155 MMbbl recoverable
2024
Phase 2 Q4'20 + Tortue ph 2 + Hib/Ruche ph 1 Further phases
• FPSO name plate capacity can be expanded significantly (Q3'21e) (2023e)
1. 2P+2C are from the ASR and based on the CPR by NSAI as at 1/1/20, and Hibiscus Upside is an estimate from the Operator
2. Production numbers are management estimates of 2P reserve production based on the CPR by NSAI. Numbers represent peak production rate during the year or quarter and not average
3. Operator BW Energy recently acquired two 2003-built jack-up rigs from Borr Drilling Slide 27Eq. Guinea Gabon Tunisia Other
Hibiscus is Growing and May Double Total Dussafu 2P Reserves
HIBISCUS STRUCTURE MAPS OLD AND NEW
11 MMbbl • The Hibiscus discovery from August 2019 has
(pre-drill) significantly increased the reserve and resource
base for the Dussafu area
Discovery
• At present Hibiscus has 43.7 MMbbl certified
Reprocessing
2P reserves by NSAI, 4x larger than pre-drill
estimate
• Further, recent seismic reprocessing suggests
an increase in the Greater Hibiscus oil-in-place
44 MMbbl volumes by potentially ~3x, which could give
(certified 2P) 155 MMbbl recoverable reserves… HIBISCUS PROPOSED WELL – 2021
SE DHIBM-1 / ST1 DHIBM-2 Planned NW
• … in which case Dussafu 2P reserves would
reprocess.
double to 222 MMbbl
Seismic
Madiela
DHIBM-2 To
test structure &
• Planned appraisal well in Q2 2021 to confirm 2400m
oil presence in
Sa lt NorthWest
new interpretation
(metres below sea level)
• Importantly Hibiscus has also de-risked and G amba O W C 2928m
Depth
Reservoir
provided intelligence for several follow-up
155 MMbbl prospects with large potential as illustrated on Dentale
(prelim est.) Sa ndstones
the next page Hibiscus
Growth
Fault
3400m
Creating One of the World’s Leading Independent Listed African E&Ps Slide 28Eq. Guinea Gabon Tunisia Other
Further Upside Potential through Large, De-risked Prospect Inventory
LARGE INVENTORY OF EXPLORATION PROSPECTS AND LEADS
• Ambition to drill 2 explorations wells each year for
5 years
• +13 prospects and leads identified based on seismic
and readthrough from existing six discoveries
• +280 MMboe combined unrisked gross prospective
resources1
• 36-90% chance of success (geological) of prospects2
• 100% historic drilling success rate with four
discoveries in Gamba/Dentale play over 2011-20
• Evaluation of reprocessed seismic underway – will be
used to further validate existing portfolio and identify
new prospects
• At least one exploration well will be drilled in 2021
1. Operator estimate
Creating One of the World’s Leading Independent Listed African E&Ps 2. Based on the CPR by NSAI Slide 29Sfax Offshore Exploration Permit FAST
and Ras El Besh Concession.
FACTS
Tunisia TPS Assets
SELECTED O&G COMPANIES
IN TUNISIA (2015-2020)
Number of
PANORO ASSETS Licences
6
TPS 2P Gross
Reserves1
• Panoro acquired two sets of assets in 2018 17
MMbbl
1. TPS producing fields around Sfax
2. The Sfax Offshore Exploration Permit (SOEP)
• TPS is one of the main onshore oil producers in Tunisia
• Further development and growth potential exist at TPS TPS Asset
SFAX
Exploration
Concessions
• Synergistic exploration opportunities in SOEP Permit
29.4% 52.5%
ownership
Creating One of the World’s Leading Independent Listed
1. 2P from the ASR as at 1/1/20 and based on the CPR by GCA
African E&PsEq. Guinea Gabon Tunisia Other
Tunisia Assets Overview
Steady Low-Cost Oil Production Portfolio with Upside Reserve & Production Potential
TPS assets (29% WI)1 OVERVIEW MAP GROSS RESERVES AND RESOURCES2
• Five low-cost and cash-
generative producing assets 21.4 MMbbl (total)
(6.3 MMbbl net WI)
• Located onshore and in shallow
water offshore
17.0 MMbbl 4.4
• US$ 15/bbl opex in 2020 (5.0 MMbbl net WI)
• Production growth and 0.6
exploration potential 2.0
SOEP (52.5% WI)
• Three offshore blocks with
7.8
existing discoveries and large
exploration upside
• Adjacent to existing TPS assets Rhemoura
infrastructure at the TPS assets
Gremda / El Ain
• Salloum West 1 well planned for El Hajeb / Guebiba
6.6
2021 targeting 2-5 MMbbl with Crude is exported via pipeline
Cercina
40% chance of success and sold internationally through
La Skhira export terminal
2P 2C
1. Panoro holds indirect 29% WI through a JV with Beender Petroleum
Creating One of the World’s Leading Independent Listed African E&Ps 2. CPR by GCA, WI share Slide 31Eq. Guinea Gabon Tunisia Other
TPS Production: 5,000 bopd Achieved
Key Events Driving TPS Production Over the Past Year
Asset review; ranking quick wins; Operational development activity: well workovers; mobilising rigs for drilling operations;
operational planning subsurface modelling for future field development
PANORO
ACHIEVES
5500 COVID-19 Pandemic Lockdown 5,000 BOPD New
Activities
5000
4500
Gross production (bopd)
Two wells
temporarily offline
4000
for routine pump
replacement
3500
TEMPORARY
3000
SHUT IN
OF GUEBIBA
2500
2000
2019 2020
Slide 32Eq. Guinea Gabon Tunisia Other
Targeting Material Production Growth at TPS
Opportunity to Bring Assets Back to Historical Production Levels (+6,000 BOPD)
2021 ONWARD ACTIVITIES
GROSS OIL PRODUCTION TPS FIELDS Enhancing production levels
bopd • Significant 2020 drilling and workover programme
10,000 ASSETS HAVE HISTORICALLY completed
PRODUCED > 6,000 BOPD → Has provided a much improved understanding of development
9,000 potential of the Douleb reservoir
→ As a result further development activity envisaged in 2021
8,000
Cercina
• Remaining approved workovers through Q1 2021
7,000
El Ain
• Further stimulation and optimisation initiatives identified
6,000 Guebiba
Growing the Reserve and Resource Base
Rhemoura
5,000
• Remapping and modelling work in progress to define
El Hajeb next phase of development
4,000 Gremda → Guebiba Douleb reservoir optimisation
→ Cercina field further development and life extension
3,000
→ Rhemoura field further development
2,000 • Salloum West exploration well planned for 2021,
tied back to TPS in success case
1,000
Maintaining existing production:
0
• Well workovers for ESP / integrity management
1982 1984 1986 1988 1990 1992 1994 1996 1998 2000 2002 2004 2006 2008 2010 2012 2014 2016 2018 2020
• Optimisation of ESP pump performance
Period of low Assets have historically produced Period of • Continued cost focus
oil prices in excess of 6,000 bopd under investment
→ Opex (incl. TPS G&A) of US$ 14/boe at 5,000 bopd
Creating One of the World’s Leading Independent Listed African E&Ps Slide 33Eq. Guinea Gabon Tunisia Other
South Africa Block 2B
Proven Oil Basin
• Exciting rift basin oil play, with an existing 37 MMbbl oil discovery from 1988 which flowed high-
quality oil to surface (36° API)
• Near-term, low-risk exploration well planned updip from discovery, targeting 349 MMbbl gross
prospective oil resources
• Shallow water and attractive fiscal terms ensure excellent economics in case of discovery
• Analogous to Lokichar Basin (Kenya) and Albertine Graben (Uganda)
• Panoro to carry Africa Energy up to US$ 2.5 million of its drilling costs1
• Closing subject to Minister consent and Azinam farm in completion
ASSET SUMMARY
Partnership (following approval) Panoro (12.5%1), Africa Energy (27.5%), Azinam (50%, op.2), Crown (10%)
Basin Orange Basin
First well / Planned spud date Gazania-1 / Q2‘21 (depending on regulatory approvals and rig availability)
Water depth 150 metres
First well prospect size 349 MMbbl3
Well cost estimate (gross) ~US$ 21 million
Play type Rift basin
Work program to date 686 km2 of 3D seismic (3D survey by Western Geco 2013)
1. Panoro has agreed to acquire 12.5% WI from Africa Energy. Transaction is subject to consent of the Minister of Minerals and Energy of South Africa and the Azinam farm-out becoming effective (see footnote 2 for more details)
2. Azinam has agreed to acquire 50% WI and operatorship from Africa Energy. Transaction is subject to consent of the Minister of Minerals and Energy of South Africa
3. Best Estimate Prospective Resources by Africa Energy - 200 MMbbl have been subject to resource assessment by qualified third-party resource auditor Slide 34Eq. Guinea Gabon Tunisia Other
Sale of Nigerian Business to PetroNor
In Kind Consideration of PetroNor Shares to be Distributed to Shareholders
Aje/OML 113
• PetroNor E&P Limited (“PetroNor”), an E&P company listed on the Oslo
Operator: Yinka Folawiyo Petroleum
Axess, will purchase all outstanding shares in Panoro’s fully owned
subsidiaries holding OML 113 Revenue Interest: Initially 12.19%
Paying Interest: 16.255%
• Upfront consideration of new PetroNor shares with a value of US$ 10
Working Interest: 6.502%
million
Other Partners: NewAge, EER, ADM
• A contingent consideration of up to US$ 16.67 million cash based on future
gas production volumes FIELD OVERVIEW
• Panoro’s intention is to propose a distribution to its shareholders of the
US$ 10 million PetroNor share consideration
• This special dividend enables Panoro shareholders to retain a
direct exposure in OML 113
• Completion of the transaction is conditional government
approvals in Nigeria which are expected in H1 20211
Creating One of the World’s Leading Independent Listed African E&Ps 1. The transaction has an amended 30 June 2021 long stop date Slide 35Transaction
Overview
Panoro Energy
Overview
Equatorial
Guinea
Outlook and Existing
Portfolio
Summary Outlook &
Summary
Supplementary
MaterialSignificant Newsflow Ahead
2021 2022
Activity Comments Q1 Q2 Q3 Q4 Q1 Q2 Q3 Q4
Final well Tortue Phase 2
PRODUCTION WELLS
Gabon 6 new wells Hibiscus/Ruche Phase 1 2022
Planned well 2021 in Hibiscus; 2x contingent wells
EXPLORATION WELLS
per year for 5 years
Equatorial Guinea
PRODUCTION WELLS Infill Production Wells
PRODUCTION Workover Activity to Increase Production
Tunisia
EXPLORATION WELL Salloum West (pending approvals)
Additional
PETRONOR DIVIDEND Subject to Closing Conditions
activity to
Other
be defined
EXPLORATION WELL South Africa, subject to Closing Conditions
Dividend Planned Contingent/Possible
Creating One of the World’s Leading Independent Listed African E&Ps Slide 37Summary of Acquisitions1,2
→ Effective date July 1, 2020 Ceiba / Okume (14.25%) Dussafu (10%)4
Consideration3 US$ 94 million US$ 46 million
Contingent consideration US$ 16 million5 US$ 24 million6
H2 2020 production ~4,600 bopd ~1,450 bopd
Opex (2020) < US$ 15/bbl US$ 16-18/bbl
2P reserves (WI) 14.2 MMbbl 10.9 MMbbl
2C resources (WI) 25.6 MMbbl 3.5 MMbbl
Prospective resources (WI)7 4.5 MMbbl 28 MMbbl
Purchase price US$/bbl (2P working int.) US$ 6.6 US$ 4.2
1. The Acquisitions are subject to certain closing conditions, including (but not limited to) government consent, pledge releases, and approval by the general meeting of Tullow for the Ceiba/Okume transaction.
Expected closing during H1 2021
2. 2P reserves, 2C resources, prospective resources, opex, are estimates per the CPR by NSAI and TRACS for Dussafu and Ceiba/Okume . Dussafu reserves are adjusted for H1 2020 production
3. Consideration for Ceiba / Okume acquisition includes US$ 5 million of deferred consideration payable upon closing of Dussafu Acquisition
4. Panoro retains a small residual payment obligation in respect of historical costs (~US$ 5 million paid to JV partners (including Panoro) spread out over time)
5. Payable only in years where the average annual net production of the acquired interests is in excess of 5,500 bopd. Once this initial net production threshold has been reached, in that year and for the four
consecutive subsequent annual periods, annual contingent consideration of US$ 5.5 million will be payable to Tullow provided that the production threshold is met in such annual period and the average daily
Dated Brent oil prices in respect of the annual period is in excess of US$ 60/bbl, subject to the aforementioned cap of US$ 16 million
6. Payable once commercial production commences on Hibiscus/Ruche and achieves daily production equal to or greater than 33,000 bopd gross over any 60 day continuous period. Once this milestone has
been met, annual contingent consideration will apply to that year and to each of the subsequent four years where the average daily Dated Brent oil price is in excess of US$ 55/bbl, subject to the US$ 24
million cap. Where the oil price threshold has been met, the Dussafu contingent consideration payable for that year will be based on 15% of net free cashflow after all taxes, operating and capitalcosts from
the acquired 10% WI. The contingent payment for any year will be capped at US$ 5 million
7. Prospective resources (WI) for Ceiba/Okume according to Tullow
Slide 38Investment Highlights
High Quality Oil Production and Strong Financial Position and Excellent
Development Portfolio1 Cash Flow Outlook2 Track Record
Material Asset Base with Fully Financed … Both Organically …
Strong Growth … → For all foreseeable capex … → Dussafu: Since 2011, 20x increase in
→ 39 MMbbl 2P and ~9,500 bopd 2021e → … providing production growth to reserves and resources and 15
production ~12,000 bopd by 2023e … successful consecutive well
penetrations, with multiple identified
→ Diversified across 12 fields in three core → … with additional flexibility through an opportunities remaining
hubs up to US$ 20 million working capital
facility to manage working capital → TPS: Revitalized fields and brought
→ Significant further upside potential –
production back towards 5,000 bopd
33 MMbbl 2C resources and attractive → and US$ 50 million accordion option gross
exploration & appraisal opportunities
… and Positioned for Dividends … and Inorganically
… Low Costs, and Excellent Operators from 2023 → High levels of corporate activity
→ US$ 15/bbl opex (2021-23e) → Backed by strong and steady free cash
→ Fifth and sixth M&A transaction since
→ Excellent fiscal terms flow generation from diversified asset
2016 now underway
→ Highly capable and dedicated operators base
with strong track record
1. 2P reserves and 2C resources are working interest share from Panoro’s Annual Statement
of Reserves and the CPR from TRACS. Production and opex are management estimates
Creating One of the World’s Leading Independent Listed African E&Ps 2. Management estimates Slide 39Transaction
Overview
Panoro Energy
Overview
Equatorial
Guinea
Supplementary Existing
Portfolio
Material Outlook &
Summary
Supplementary
MaterialReserves & Contingent Resources: Ceiba and Okume
TRACS Independent Audit as of 1/7/20
Gross (MMbbl) Tullow WI (MMbbl)
Reserves Classification (Oil)
1P 2P 3P 1P 2P 3P
Development Pending (DP) 35.6 64.5 98.2 5.1 9.2 14.0
Approved for Development (AD) 6.8 14.5 23.4 1.0 2.1 3.3
Justified for Development (JD) 6.3 20.7 36.2 0.9 3.0 5.2
Total All Reserves Categories 48.7 99.8 157.8 6.9 14.2 22.5
Gross (MMbbl) Tullow WI (MMbbl)
CR Classification (Oil)
1C 2C 3C 1C 2C 3C
Development Pending 4.7 15.4 28.4 0.6 2.2 4.1
Development Unclarified 16.0 40.3 67.7 2.3 5.8 9.6
Development not viable 37.8 123.4 286.9 5.4 17.6 40.9
Total All CR Categories 58.6 179.1 382.9 8.4 25.6 54.6
Creating One of the World’s Leading Independent Listed African E&Ps Slide 41Glossary and Definitions
API American Petroleum Institute gravity, a measure of how heavy or light a petroleum liquid is compared to water
ASR Annual Statement of Reserves
bbl One barrel of oil, equal to 42 US gallons or 159 liters
boe Barrel of oil equivalent
boepd Barrels of oil equivalents per day
bopd Barrels of oil per day
Company, Panoro or Panoro Energy Panoro Energy ASA and its consolidated subsidiaries
CPR Competent Person’s Report
E&P Exploration and production
EBITDA Earnings before Interest, Taxes, Depreciation and Amortisation
EGM Extraordinary general meeting
FID Final investment decision
FPSO Floating Production Storage and Offloading vessel, a marine vessel used to extract oil
GCA Gaffney Cline & Associates
IRR Internal rate of return
JV Joint venture
kbopd Thousands of barrels of oil per day
km kilometre
MMbbl Million barrels of oil
NOK Norwegian Kroner, the lawful currency of the Kingdom of Norway
NSAI Netherland Sewell & Associates Inc
op Operator
sh share
SPA Sale and purchase agreement
TPS Thyna Petroleum Services
US$ United States Dollar, the lawful currency of the United States of America
WI Working interest
Creating One of the World’s Leading Independent Listed African E&Ps Slide 42Contact Details: PANORO ENERGY 78 Brook Street London W1K 5EF United Kingdom Tel: +44 (0) 203 405 1060 Fax: +44 (0) 203 004 1130 info@panoroenergy.com
You can also read


