SECOND QUARTER 2020 EARNINGS - MGM RESORTS INTERNATIONAL - JULY 30, 2020
←
→
Page content transcription
If your browser does not render page correctly, please read the page content below
MGM RESORTS INTERNATIONAL
SECOND QUARTER 2020 EARNINGS

          JULY 30, 2020
         MGM RESORTS INTERNATIONAL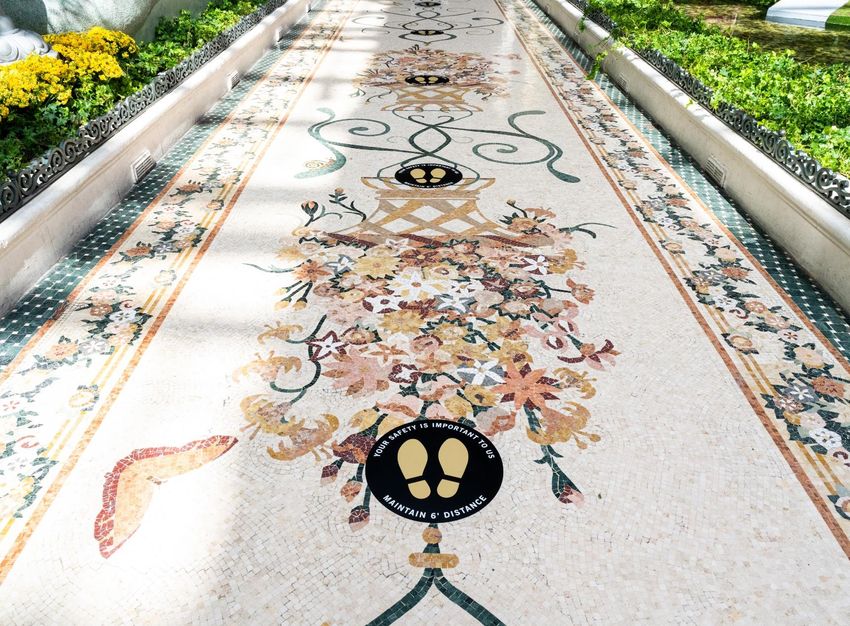
F O R WA R D - L O O K I N G S T A T E M E N T S
Statements in this presentation that are not historical facts are forward-looking statements, within the meaning of the Private Securities Litigation Reform Act of 1995 and involve risks and/or uncertainties, including
those described in the Company's public filings with the Securities and Exchange Commission. The Company has based forward-looking statements on management’s current expectations and assumptions and
not on historical facts. Examples of these statements include, but are not limited to, the Company’s expectations regarding its financial outlook (including expectations regarding its liquidity position, long term cost
savings and the performance at re-opened properties), the timing, strategy and plans to reopen the Company’s remaining domestic properties, the continued impact of the COVID-19 pandemic, and any benefits
the Company expects to achieve from its strategic plans, including its asset-light strategy, the MGM 2020 plan and its investment in sports betting and iGaming through its BetMGM venture (including any expected
growth in new and existing jurisdictions and projected net revenues). These forward-looking statements involve a number of risks and uncertainties. Among the important factors that could cause actual results to
differ materially from those indicated in such forward-looking statements include the continued impact of the COVID-19 pandemic, effects of economic and other conditions in the markets in which the Company
operates and competition with other destination travel locations throughout the United States and the world, the design, timing and costs of expansion projects, risks relating to international operations, permits,
licenses, financings, approvals and other contingencies in connection with growth in new or existing jurisdictions and additional risks and uncertainties described in the Company’s Form 10-K, Form 10-Q and Form
8-K reports (including all amendments to those reports). In providing forward-looking statements, the Company is not undertaking any duty or obligation to update these statements publicly as a result of new
information, future events or otherwise, except as required by law. If the Company updates one or more forward-looking statements, no inference should be drawn that it will make additional updates with respect
to those other forward-looking statements.

                                                                                  MARKET AND INDUSTRY DATA
This presentation also contains estimates and information concerning the Company’s industry that are based on industry publications, reports and peer company public filings. This information involves a number
of assumptions and limitations and you are cautioned not to rely on or give undue weight to this information. The Company has not independently verified the accuracy or completeness of the data contained in
these industry publications, reports or filings. The industry in which we operate is subject to a high degree of uncertainty and risk due to a variety of factors, including those described in the “Risk Factors” section of
the Company’s public filings with the SEC.

                                         NOTE REGARDING PRESENTATION OF NON -GAAP FINANCIAL MEASURES
This presentation includes certain “non-GAAP financial measures” as defined in Regulation G under the Securities Exchange Act of 1934, as amended, including, among others, Adjusted EBITDAR, Table Games
Hold Adjusted Las Vegas Strip Resorts Adjusted Property EBITDAR, and Adjusted EPS. Schedules that reconcile the non-GAAP financial measures to the most directly comparable financial measures calculated
and presented in accordance with Generally Accepted Accounting Principles in the United States are included herein or in the Company’s earnings releases that have been furnished with the SEC and are available
on our website at www.mgmresorts.com.
In addition, this presentation includes estimated operating trends for the Company’s Las Vegas Strip and Regional properties compared to the same periods in 2019 using monthly property level financials and
internally generated daily operating reports to calculate activity for partial monthly periods, based on the days that such properties were opened prior to June 30, 2020, including activity for invitation only customer
events prior to re-opening to the general public. These trends are based on management estimates only using currently available information, which has not been reviewed by the Company’s auditors, is not
subject to the Company’s normal control procedures and has not prepared in accordance with GAAP. The Company does not prepare monthly or intra-month property level financials on the same basis as its
reported GAAP results and, as a result, the trends reported are based on information that may not be indicative of full quarter or full month results, respectively, for the Company’s operating segments.

  MGM RESORTS INTERNATIONAL                                                                                                                                                                                                     2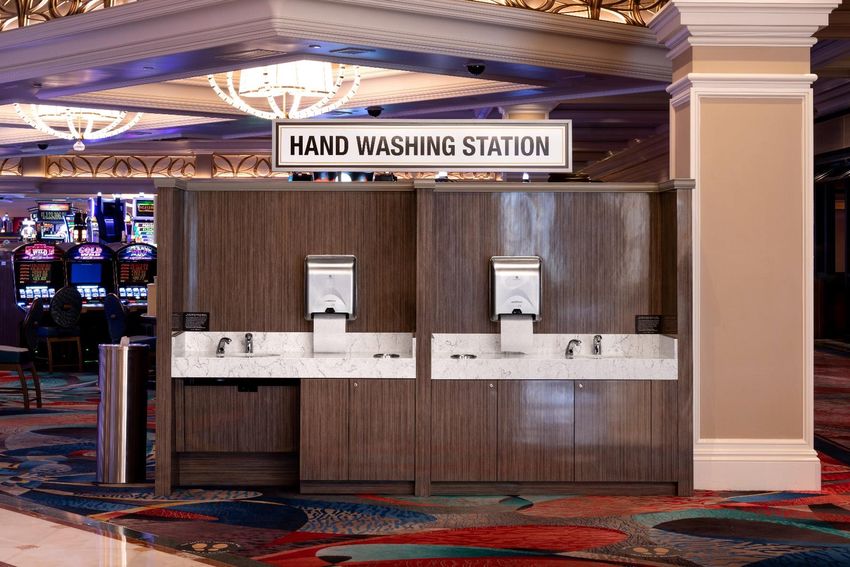
•   2Q 2020 HIGHLIGHTS

            •   BETMGM
 TABLE OF
CONTENTS    •   2Q 2020 FINANCIAL RESULTS

            •   SUPPLEMENTAL

                                            3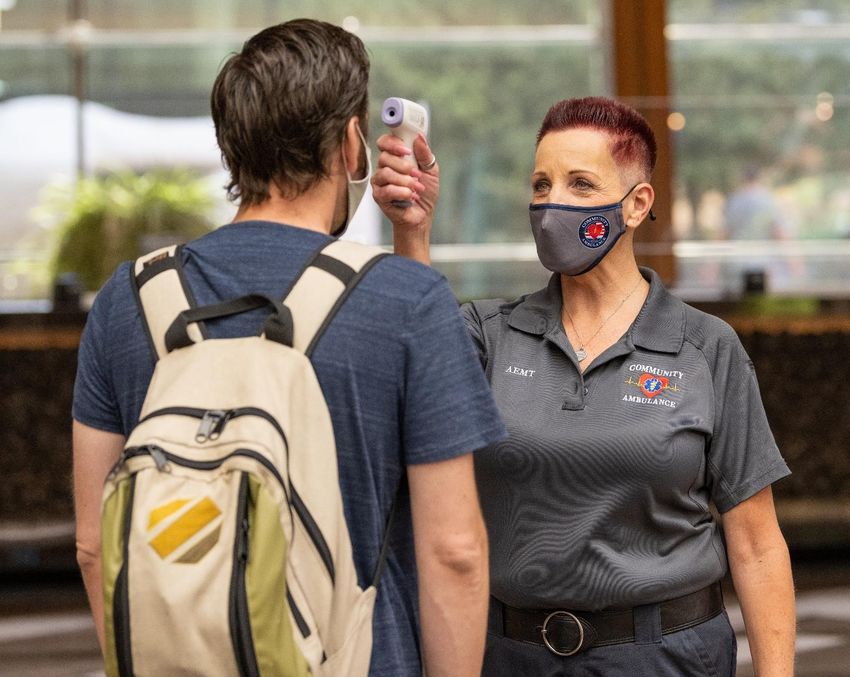
KEY 2Q 2020 TAKEAWAYS

  U.S. property reopening and recovery
  • Health & safety remains our top priority; MGM Resorts continues to work closely with regulators and other stakeholders to reopen and operate properties
  • Results since opening have been better than expected, with significant domestic margin improvement
  • Continue to believe Las Vegas will lag regional operations in the recovery, but believe the city will recover to prior levels of business and tourist demand over time

  Strong operating model and healthy liquidity position to help weather the crisis
  • Reduced approximately 85% of our operating expenses during closures and continue to manage post-opening cost ramp to closely match demand. Going forward,
    we expect to permanently reduce approximately $450 million in property and corporate expense, compared to 2019 levels
  • Continued strong liquidity position with $8.1 billion1 of consolidated liquidity, or $4.8 billion2 excluding MGM China and MGM Growth Properties (“MGP”)

  Macau
  • Limited market activity in 2Q 2020 due to border restrictions and mandatory 14-day quarantine measures
  • Effective July 15th, the 14-day quarantine measures between Guangdong and Macau were lifted. Although this is a first step, meaningful recovery will require the
    resumption of IVS and tour visa programs

  Fundamental long-term business outlook and growth opportunities remain unchanged
  • Sports betting and iGaming: BetMGM well-positioned to become a leader in sports betting and iGaming (Leading brand in NJ iGaming)
  • Japan: Remain excited about the Company’s partnership with ORIX to develop a leading international integrated resort serving key Asian markets

                                            1   Cash and equivalents of $4.84 billion as of June 30, 2020, adjusted for $3.26 billion collectively available under MGM Resorts, MGM China, MGP’s revolving credit facilities
MGM RESORTS INTERNATIONAL                   2   Cash and equivalents of $3.82 billion as of June 30, 2020, adjusted for $940 million available under MGM Resorts’ revolving credit facility                                    4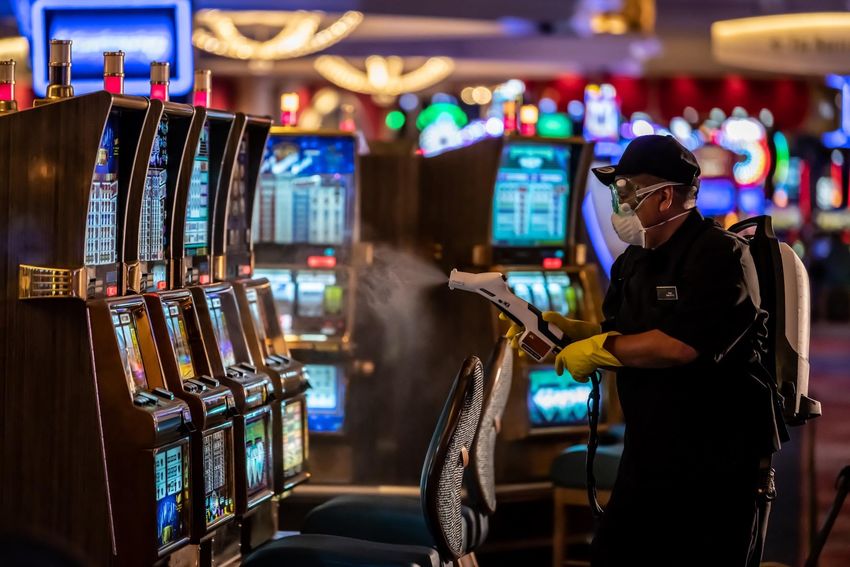
HEALTH & SAFETY IS OUR TOP PRIORITY
     MGM Resorts’ “Seven-Point Safety Plan” puts our guests and employees at the center of all we do. It is a comprehensive,
           multi-layered approach resulting from months of consultations and guidance from public health experts

                          SCREENING,                                MANDATORY MASKS
                                                                                                                                                                      HANDWASHING AND
                         TEMPERATURE                                  AND PERSONAL                                           PHYSICAL
                                                                                                                                                                         ENHANCED
                         CHECKS AND                                PROTECTIVE EQUIPMENT                                     DISTANCING
                                                                                                                                                                        SANITIZATION
                      EMPLOYEE TRAINING                                    (PPE)

                                          HEATING, VENTILATION
                                         AND AIR CONDITIONING                                  INCIDENT RESPONSE                                        DIGITAL
                                         (HVAC) CONTROLS, AND                                     PROTOCOLS                                          INNOVATIONS
                                               AIR QUALITY

             For more information, please refer to our website which includes a link to our full 20 page Seven-Point Safety Plan handbook at https://www.mgmresorts.com/en/covid-19/seven-point-safety-plan.html.

MGM RESORTS INTERNATIONAL                                                                                                                                                                                           5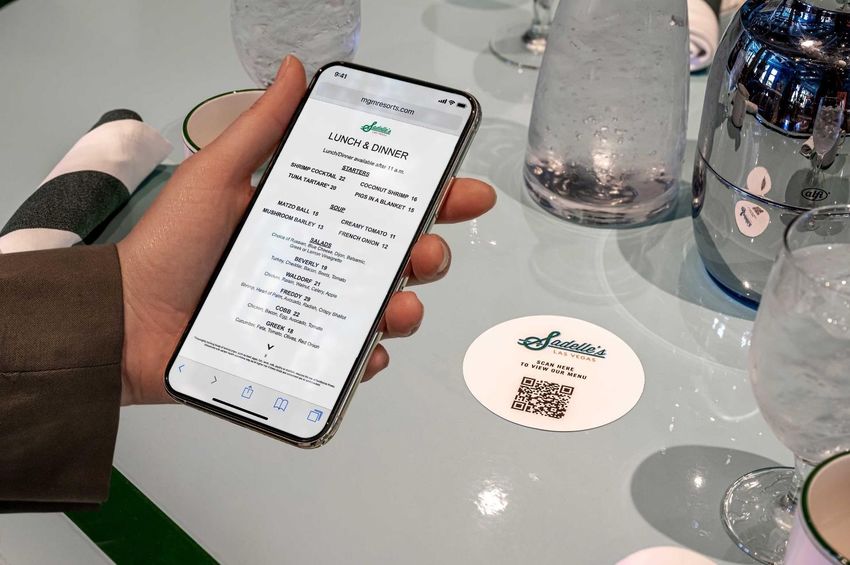
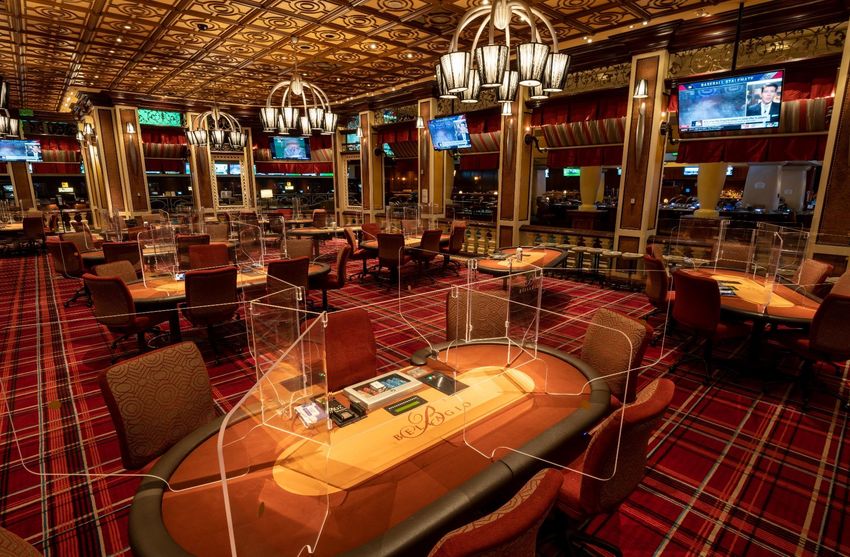
HEALTH & SAFETY IS OUR TOP PRIORITY

                                                                                       Social Distancing Indicators
                                   Plexiglass at Gaming Tables                                  Throughout Resorts    Sanitized Room Stickers on Guest Room Doors

                     Temperature Testing                         Enhanced Sanitization Measures                        Hand Washing Stations on the Casino Floors

MGM RESORTS INTERNATIONAL                                                                                                                                           6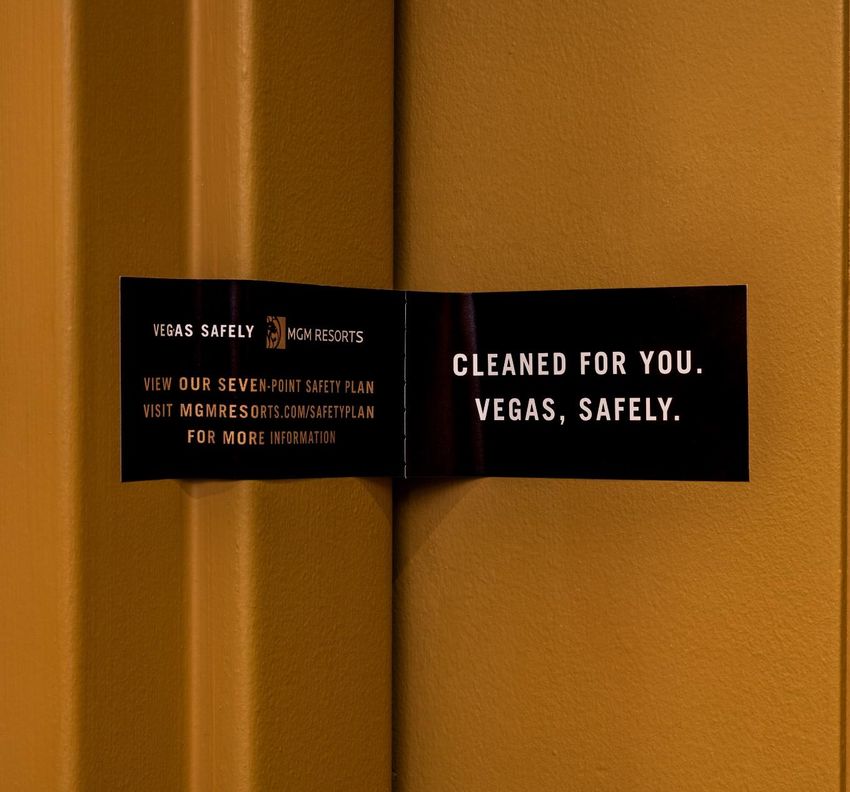
OUR LIQUIDITY POSITION REMAINS STRONG
                            As of June 30, 2020, the Company’s domestic operations had $4.8 billion of liquidity

   Domestic monthly cash outflows1 were slightly better than our targeted $270 million during April and May when our domestic
         properties were mostly closed. In June, we significantly reduced our domestic cash outflows as we reopened
                                                      additional properties

                                                                           MGM Resorts                                                                                           MGM Resorts
          ($ in millions)                                       (Ex. MGM China and MGP)                                  MGM China                           MGP                 Consolidated
          Cash and Equivalents                                                                    $3,816                             $294                    $726                            $4,836
          Revolver Availability                                                                      $940                         $1,166                  $1,150                             $3,256
            Total Liquidity                                                                      $4,756                           $1,460                  $1,876                            $8,092

   • MGM Resorts (consolidated) had $8.1 billion of liquidity as of June 30, 2020

   • MGM Resorts, MGM China and MGP collectively raised $2.45 billion in the debt markets at attractive coupons during 2Q 2020,
     to strengthen liquidity:
     ➢ MGM Resorts:     $750 million 6.750% senior notes due 2025
     ➢ MGM China:       $500 million 5.250% senior notes due 2025; $400 million incremental revolving credit facility
     ➢ MGP:             $800 million 4.625% senior notes due 2025

   • MGP redeemed 30.3 million of operating partnership units for $700 million in 2Q 2020. The Company currently has $700 million
     remaining under its agreement with MGP to redeem operating partnership units held by MGM Resorts for cash through
     February 2022
MGM RESORTS INTERNATIONAL            1   MGM Resorts domestic operations excluding MGM China and MGP. Domestic cash outflows include interest, taxes, and rent (net of dividends received from MGP)
                                                                                                                                                                                                      7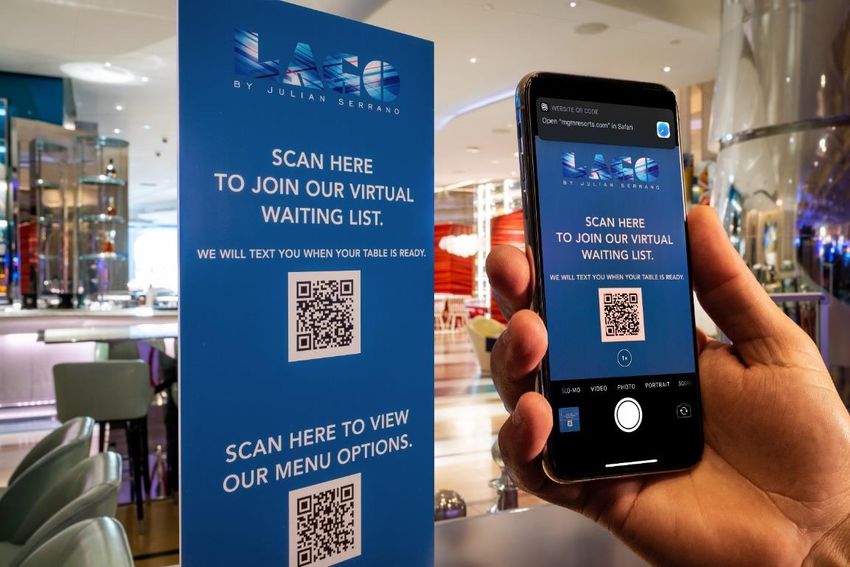
SOLID DEBT PROFILE

           As of June 30, 2020, the Company’s domestic operations had $5.3 billion of debt, with no domestic maturities until 2022

      MGM RESORTS (EXCLUDING MGM CHINA AND MGP) – DEBT MATURITY PROFILE                               CONSOLIDATED DEBT OVERVIEW
  $ in millions
                                                                                                   ($ in millions)                         Debt
                      Revolving Credit Facility Outstandings                 Senior Notes
                                                                                                   MGM Resorts (Ex. MGM China and MGP)    $5,300

                                                                                                   MGM China                              $2,484
                                                                      $1,425
     NO MATURITIES                                                                                 MGP                                    $3,650
      UNTIL 2022                              $1,250                                                  MGM Resorts Consolidated           $11,434
                               $1,000
                                                                      $550           $400   $675

      2020         2021         2022           2023            2024   2025          2026    2027

  • MGM Resorts (consolidated) had $11.4 billion of debt as of June 30, 2020

  • MGM Resorts and MGM China have received, under their respective credit facilities, waivers of financial maintenance covenants
    through 1Q 2021 and 2Q 2021, respectively

MGM RESORTS INTERNATIONAL                                                                                                                          8
WE BEGAN REOPENING U.S. PROPERTIES IN 2Q 2020
                 U.S. REOPENING DATES1
                                                 % of
                                                                                   • Health and safety remained top priority as we worked to execute a
     LAS VEGAS                  Date                                                 sustainable reopening process
                                                2Q Open
     Bellagio                  6/4/20             30%
     MGM Grand                 6/4/20              30%                             • Better-than-expected 2Q 2020 domestic results driven by:
     New York New York         6/4/20              30%                               ➢ Stronger-than-anticipated casino and leisure demand
     Excalibur                 6/11/20             22%                               ➢ Ability to yield the casino market segment
     Luxor                     6/25/20              7%                               ➢ Continued focus on cost management
     Mandalay Bay              7/1/20               0%
     ARIA                      7/1/20               0%
                                                                                   • Future reopenings continue to depend on expectations for demand and
     Vdara                     7/16/20              0%                               maximizing cash flow, while balancing the needs of our employees,
     Mirage                     TBD                 0%                               local regulators, and other stakeholders
     Park MGM                   TBD                 0%
                                                 % of                              • We continue to believe:
     REGIONAL                   Date
                                                2Q Open
                                                                                     ➢ Regionals will lead the recovery in the U.S.
     Gold Strike Tunica, MS    5/25/20             41%
     Beau Rivage, MS           6/1/20              33%
                                                                                     ➢ While our Las Vegas Strip properties remain more heavily impacted
                                                                                       in the near term, the city will recover to prior levels of business and
     MGM Northfield Park, OH   6/20/20             12%
                                                                                       tourist demand over time
     MGM National Harbor, MD   6/29/20              2%
     MGM Springfield, MA       7/13/20              0%
     Borgata, NJ               7/26/20              0%
     MGM Grand Detroit, MI     8/7/20               0%
     Empire City, NY            TBD                 0%
MGM RESORTS INTERNATIONAL              1   Indicates opening dates to the general public
                                                                                                                                                                 9
DEMONSTRATING OPERATING MODEL STRENGTH

 MGM 2020 savings include initiatives launched at the end of 2019 that began yielding tangible results prior to the COVID-19 crisis

    Since the beginning of the COVID-19 crisis, the Company has fundamentally re-evaluated how it operates, with a focus on
                               permanently eliminating redundancies and low profitability initiatives

                                                                                                                                                     Annualized
                               ($ in millions)
                                                                                                                                                      Run-rate1

                               MGM 2020                                                                                                                        $160
                               Corporate expense (gross)2                                                                                                      $180
                               Fixed labor                                                                                                                      $25
                               Operations streamlining                                                                                                          $85

                               Annualized domestic cost reductions                                                                                             $450

MGM RESORTS INTERNATIONAL        1   Annual run-rate savings relative to 2019 actuals
                                                                                                                                                                      10
                                 2   Represents gross corporate expense savings, a large portion of which gets allocated to property-level operating results
LAS VEGAS: BETTER THAN EXPECTED 2Q 2020 RESULTS
LAS VEGAS STRIP YEAR-OVER-YEAR OPERATING PERFORMANCE
FOR REOPENED PROPERTIES DURING THE PERIOD THEY WERE OPERATING IN 2Q 2020
Net Adjusted Property Adjusted Property
Revenues EBITDAR EBITDAR Margin
-50% -44% Approx. +450 bps
2Q 2019 2Q 2020 2Q 2019 2Q 2020 2Q 2019 2Q 2020
Reflects management's estimates of operating trends for the periods in which the properties were operating through June 30, 2020, compared to the same periods in 2019 using monthly property
MGM RESORTS INTERNATIONAL level financials and internally generated daily operating reports to calculate activity for partial monthly periods, based on the days that such properties were opened prior to June 30, 2020,
11
including activity for invitation only customer events prior to reopening to the general publicSTRONG REGIONAL MARGINS SINCE REOPENING
Our regional operations include destinations that rely more on air travel and lodgers
U.S. REGIONAL YEAR-OVER-YEAR OPERATING PERFORMANCE
FOR REOPENED PROPERTIES DURING THE PERIOD THEY WERE OPERATING IN 2Q 2020
Net Adjusted Property Adjusted Property
Revenues EBITDAR EBITDAR Margin
-31% -14% Approx. +880 bps
2Q 2019 2Q 2020 2Q 2019 2Q 2020
2Q 2019 2Q 2020
“DRIVE-TO” U.S. REGIONALS1
Net Adjusted Property Adjusted Property
Revenues EBITDAR EBITDAR Margin
-14% +18% Approx. +1,400 bps
1 “Drive-to” regional properties include Gold Strike Tunica, MGM Northfield Park and MGM National Harbor
MGM RESORTS INTERNATIONAL Reflects management's estimates of operating trends for the periods in which the properties were operating through June 30, 2020, compared to the same periods in 2019 using monthly property
12
level financials and internally generated daily operating reports to calculate activity for partial monthly periods, based on the days that such properties were opened prior to June 30, 2020,
including activity for invitation only customer events prior to reopening to the general publicMACAU UPDATE
APRIL 28 MAY - JUNE JULY 6 JULY 15
Hong Kong implements Macau and Zhuhai authorities Macau residents exempted Visitors crossing borders
14-day quarantine for begin easing the 14-day from quarantine when between Macau and
arrivals from China (incl. quarantine for non-resident entering Zhuhai may also Guangdong Province no longer
Macau and Taiwan) workers to cross the border visit the nine GBA cities need to undergo the 14-day
quarantine
• In 2Q 2020, the Macau market continued to experience significant year-over-year declines driven by MGM CHINA CASH OUTFLOWS
border and travel restrictions, resulting in 2Q GGR declining 96% and visitation down nearly 100%
($ in millions) Per month
• Lifting of 14-day quarantine measures between Guangdong and Macau are encouraging first step. Run-rate operating cash outflow $36.8
However, meaningful recovery requires the resumption of IVS and tour visa programs
Development & maintenance
$16.7
capital expenditures
• In the current operating environment, MGM China estimates monthly cash outflows of ~$65 million
Interest expense $11.6
➢ Implies that MGM China’s $1.5 billion liquidity1 could support over 22 months of operations
under “near zero” revenue Total cash outflow $65.1
➢ Estimated capital expenditures include future development projects to strengthen its position in
the premium mass segment, including the development of the MGM Cotai South Tower suites
• Continued easing of current border restrictions and the resumption of Mainland China’s key
visa issuances will serve as catalysts for market rebound given strong long-term demand
MGM RESORTS INTERNATIONAL 1 Cash and equivalents of $294 million as of June 30, 2020, adjusted for $1.17 billion available under MGM China’s revolving credit facilities
13• 2Q 2020 HIGHLIGHTS
• BETMGM
TABLE OF
CONTENTS • 2Q 2020 FINANCIAL RESULTS
• SUPPLEMENTAL
14BETMGM: OUR LARGEST U.S. GROWTH OPPORTUNITY
• MGM Resorts and GVC Holdings collectively announced an additional $250 million commitment for BetMGM1 to
capitalize on the rapidly growing U.S. sports betting and iGaming markets
• Leading iGaming brand in New Jersey with ~19% market share2
• On track to generate over $130 million of net revenues in 2020
• Market access secured in 19 states3, with the expectation to be live in 11 states by year end 2020
• Differentiated omni-channel strategy driven by unique MGM Resorts’ destinations and entertainment experiences
extending beyond sports betting and iGaming
• Leveraging GVC’s proprietary technology and advanced analytics platform
• Effective customer acquisition model through 34+ million M life Rewards database as well as strategic relationships
with professional sports leagues, Buffalo Wild Wings and Yahoo! Sports
1 BetMGM is the operating brand of ROAR Digital, the U.S. sports betting and online gaming company owned jointly by MGM Resorts and GVC Holdings
MGM RESORTS INTERNATIONAL 2 Excludes Pala 15
3 Market access includes states where certain legislative modifications are required and states in which the Company is seeking direct licensureSTAY-AT-HOME ORDERS HAVE RESULTED IN SIGNIFICANT
IGAMING GROWTH, WITH BETMGM GAINING SHARE
BETMGM NJ GROSS GAMING REVENUES (GGR) NJ IGAMING MARKET SHARE1
BetMGM June GGR in NJ up 32% vs. January, BetMGM has the leading market share in NJ iGaming1
with iGaming +66%, more than offsetting Sports decline
BetMGM Betfair DraftKings
Golden Nugget Caesars Sugarhouse
iGaming GGR Sports Betting GGR
Tropicana Hard Rock Resorts
Total GGR:
Jun vs. Jan +41%
Jun vs. Mar +32%
4.3% 4.8% 4.2% 4.2% 4.5% 4.5%
4.2% 5.2% 4.3% 5.0% 5.7% 6.1%
5.9% 5.5% 6.0% 5.6% 5.8% 5.3%
Sports GGR: 6.2% 6.1% 5.8% 6.2% 6.2%
6.3%
Jun vs. Jan -72% 6.7% 7.6% 9.0% 9.6% 9.1%
iGaming GGR: 9.6%
Jun vs. Jan +66% 12.3% 12.2% 11.5%
Jun vs. Mar +39% 10.7% 10.7% 11.2%
14.3% 13.8% 12.1%
15.8% 12.9% 12.8%
Jan-20 Feb-20 Mar-20 Apr-20 May-20 Jun-20
19.6% 18.3% 17.3% 16.6% 16.6%
19.4%
#1
BetMGM is on track to exceed $130 million in net revenues in 2020, 17.6% 14.1% 17.8% 18.9% 18.4% 18.9%
share
primarily driven by iGaming in NJ
Jan-20 Feb-20 Mar-20 Apr-20 May-20 Jun-20
MGM RESORTS INTERNATIONAL 1 Based on Eilers & Krejcik Gaming estimates; BetMGM stats exclude Pala
16KEY PILLARS POSITION BETMGM FOR SUCCESS
BetMGM’s four key strategic pillars position it to become an industry leader with an efficient financial model
KEY STRATEGIC PILLARS RECENT SUCCESSES
• Access to 19 markets secured
• Prime MGM Resorts brick & mortar assets in key states
• Operational in 7 markets
MARKET ACCESS • Additional access secured through partnerships
• Expect to be operational in 4 additional markets by
• Technology platform enables seamless market entry
year end 2020
• Proprietary retail and online platform, including • Global platform deployed in all active online states
advanced trading, marketing, CRM and BI tools • Dedicated GVC team focused on bespoke
TECHNOLOGY & • Flexibility to respond to different conditions development
PRODUCT • Technology available at lower costs vs competitors • Foundational technology in place with the conversion
given that GVC owns complete technology stack of MGM Resorts’ sportsbook technology
• MGM Resorts sportsbook and online presence
BRANDS & rebranded to BetMGM
MARKETING • PartyPoker re-launched as national U.S. poker brand
• Integration of M life Rewards status and tier credit
earning capabilities
PLAYER • Key strategic relationships in place
ACQUISITION • Omni-channel campaigns launched to drive customer
acquisition at a lower cost
MGM RESORTS INTERNATIONAL 17STRATEGIC MARKET ACCESS ENABLES DAY 1 LAUNCH
AS MORE STATES GO LIVE
To date, BetMGM has secured market access in 19 states1 and is live in seven states,
with the expectation of being live in 11 states by year end 2020
ME
WA
VT Live States Retail Betting Online Betting Online Casino Online Poker
NH MA
MT ND
MN NY Nevada ✓ ✓
OR
ID RI
WI MI
SD CT
WY PA2 NJ Colorado On hold ✓
IA DE
NV NE OH MD Mississippi ✓
IL IN
WV VA D.C.
CA
UT
CO KY Indiana ✓
KS MO
NC
Michigan ✓ End 2020 End 2020 End 2020
TN
SC
AZ NM
OK AR West Virginia ✓ Aug 2020 Aug 2020
MS GA
AL
New Jersey ✓ ✓ ✓ ✓
TX LA
FL
2020 Launch Retail Betting Online Betting Online Casino Online Poker
Oregon ✓
New Mexico ✓
Live
Launching in 2020
Tennessee ✓
Market Access Secured
Pennsylvania ✓ ✓
MGM RESORTS INTERNATIONAL PA access subject to finalizing definitive agreement with partner
1
2 Market access includes states where certain legislative modifications are required and states in which the Company is seeking direct licensure 18M LIFE INTEGRATION INTO BETMGM PLATFORM
BetMGM customers now receive an M life number, earn tier credits, and see their status within the BetMGM app
Jane Doe
Tier Status and M life Number Active Advertising Letting Users
Now Appear within App Know They Earn Tier Credits
MGM RESORTS INTERNATIONAL 19• 2Q 2020 HIGHLIGHTS
• BETMGM
TABLE OF
CONTENTS • 2Q 2020 FINANCIAL RESULTS
• SUPPLEMENTAL
202Q 2020 FINANCIAL HIGHLIGHTS
$ in U.S. millions, except per share information
2Q19 2Q20 $ Change % Change
Consolidated Net Revenue $3,223 $290 ($2,933) (91%)
Las Vegas Strip Resorts $1,466 $151 ($1,316) (90%)
Regional Operations $911 $89 ($822) (90%)
MGM China $706 $33 ($673) (95%)
Net Income (Loss) Attributable to MGM Resorts $43 ($857) ($900) NM
Diluted Earnings (Loss) Per Share $0.08 ($1.67) ($1.75) NM
Adjusted EPS $0.23 ($1.52) ($1.75) NM
Consolidated Adjusted EBITDAR $764 ($492) ($1,256) NM
Las Vegas Strip Resorts Adjusted Property EBITDAR $418 ($104) ($523) NM
Table Games Hold Adjusted Las Vegas Strip Resorts
$431 ($112) ($543) NM
Adjusted Property EBITDAR
Regional Operations Adjusted Property EBITDAR $261 ($112) ($373) NM
MGM China Adjusted Property EBITDAR $173 ($116) ($289) NM
CityCenter Adjusted EBITDA $106 ($37) ($143) NM
MGM RESORTS INTERNATIONAL 21FINANCIAL CONSIDERATIONS
2Q 2020 consolidated income statement
• $19.9 million of restructuring charges related the Company’s reorganization
• $49.0 million related to the October 1 litigation settlement1
Health and safety / COVID-19 related
• Domestic operating expenses:
➢ 2Q 2020: $10 million2 primarily related to labor, PPE, and other supplies
➢ Second half 2020: Expected to be approximately $25 million per quarter
• Corporate expense:
➢ 2Q 2020: ~$9 million primarily related to non-recurring, non-capital spend (e.g. hand washing stations)
~$5 million contribution to the MGM Resorts Employee Emergency Grant Fund
➢ Second half 2020: Expected to be ~$5-6 million in aggregate, as additional properties reopen
• Capital expenditures:
➢ 2Q 2020: ~$8 million2 related to technology and touchless capabilities
➢ Second half 2020: Expected to be ~$15-20 million in aggregate, heavily weighted toward 3Q 2020
1 Represents the difference between the expected settlement amount accrued of $800 million and the $751 million insurance receivable
MGM RESORTS INTERNATIONAL 2 Includes approximately $1.5 million in aggregate at CityCenter 22TRIPLE NET OPERATING AND GROUND LEASES
• In 2Q 2020, the Company recognized its first full quarter since the closing of both the Bellagio BREIT venture and MGP BREIT venture
(Mandalay Bay and MGM Grand Las Vegas)
• While MGP is consolidated within the Company’s financial statements, the BREIT ventures are not consolidated
• Thus, MGM Resorts’ rent expense associated with the BREIT ventures are expensed within the Company’s consolidated income statement as
part of “General and administrative” expenses
➢ Recognized on a straight-line basis ($189.6 million in 2Q 2020)
• Additionally, the Company’s income is recognized via the equity method under “Income (loss) from unconsolidated affiliates” and “Non-
operating items from unconsolidated affiliates” ($41.6 million in 2Q 2020)
➢ 5% ownership of Bellagio BREIT venture
➢ 50.1% ownership of MGP BREIT venture through the consolidation of MGP within MGM Resorts financial statements
• Consolidated net income is adjusted to exclude the impact of these items in our Adjusted EBITDAR calculation1
• 2Q 2020 triple net operating lease rent expense on a cash basis:
➢ MGP: $206.9 million (partially offset by $96.1 million in distributions received from MGP)
➢ BREIT ventures: $134.2 million
• Our ground lease expenses aggregate to approximately $8 million of rent expense per quarter (~$32 million per year)
MGM RESORTS INTERNATIONAL 1 Refer to “Reconciliation of Net Income (Loss) Attributable to MGM Resorts International to Adjusted EBITDAR” table within the Company’s 2Q 2020 earnings release
232Q 2020 – LAS VEGAS STRIP
Net Revenues Adjusted Property EBITDAR
($ in U.S. millions) ($ in U.S. millions)
Actual Hold Adjusted
Actual Hold Adjusted
$1,466 $1,481
$418 $431
2Q20 2Q20
$151 $142
2Q19 2Q19
2Q19 2Q20 2Q19 2Q20 ($104) ($112)
• Casino revenue decreased 80% compared to the prior year quarter • Rooms revenue decreased 94% compared to the prior year quarter
➢ Table games drop of $149 million compared to $851 million in 2Q 2019 ➢ Occupancy % of 43% compared to 95% in 2Q 2019
➢ Table games win % of 32.5% compared to 21.1% in 2Q 2019 ➢ ADR declined 5% to $154 compared to $163 in 2Q 2019
➢ Slot handle $524 million compared to $3.1 billion in 2Q 2019 ➢ RevPAR1 decreased 57% to $66 compared to $154 in 2Q 2019
➢ Slot hold % of 9.3% compared to 9.4% in 2Q 2019
MGM RESORTS INTERNATIONAL Note: Excludes CityCenter
1 RevPAR is hotel revenue per available room. Rooms that were out of service during the three months ended June 30, 2020 as a result of property closures due to the COVID-19 24
pandemic were excluded from the available room count when calculating hotel occupancy and REVPAR.2Q 2020 – REGIONAL
($ in U.S. millions)
Net Revenue Adjusted Property EBITDAR
$910
$261
$89
2Q20
2Q19 2Q20 2Q19
($112)
• Casino revenue decreased 88% compared to the prior year quarter
➢ Table games drop of $58 million compared to $1.0 billion in 2Q 2019
➢ Table games win % of 21.9% compared to 19.9% in 2Q 2019
➢ Slot handle $485 million compared to $6.4 billion in 2Q 2019
➢ Slot hold % of 10.0% compared to 9.5% in 2Q 2019
MGM RESORTS INTERNATIONAL 252Q 2020 – CITYCENTER
($ in U.S. millions)
1 . S T R U C T U R E T O D A Y ( 7 3 % O WN E R S H I P O F O P ) 3. MGM RESORTS LONG-TERM STRATEGY
Net Revenue Adjusted Property EBITDA
$329
$106
$3 2Q20
2Q19 2Q20 2Q19
($37)
• CityCenter was closed in the second quarter of 2020 • Key Balance Sheet Items (as of 6/30/20)
• In 2Q 2020, CityCenter received a waiver of its financial maintenance covenants ➢ Cash and cash equivalents: $86 million
through 1Q 2021
➢ Availability under revolver: $117 million
• In April 2020, CityCenter paid the previously announced dividend of $101 million, ➢ Total debt: $1.75 billion
of which MGM Resorts received its 50% share, or approximately $51 million
MGM RESORTS INTERNATIONAL 262Q 2020 – MGM CHINA
Net Revenues Adjusted Property EBITDAR
($ in U.S. millions) ($ in U.S. millions)
Actual Hold Adjusted Actual Hold Adjusted
1 . S T R U C T U R E T O D A Y ( 7 3 % O WN E R S H I P O F O P ) 3. MGM RESORTS LONG-TERM STRATEGY
$183
$730 $173
$706
2Q20 2Q20
2Q19 2Q19
$33 $32
($116) ($118)
2Q19 2Q20 2Q19 2Q20
• VIP table games: 96% decrease in turnover year-over-year; hold percentage of 2.6%
• Mass table games: 97% decrease in volume year-over-year; hold percentage of 17.5%
• MGM China paid the previously announced final dividend for 2019 of $41 million in June 2020, of which MGM Resorts received $23 million, representing its
55.95% share of the dividend, and noncontrolling interests received $18 million
MGM RESORTS INTERNATIONAL 27• MGM CHINA PROPERTY DATA
SUPPLEMENTAL • FOCUSED ON WHAT MATTERS
• DIGITAL INNOVATIONS
28MGM CHINA PROPERTY DATA
MGM RESORTS INTERNATIONAL 29MGM CHINA FINANCIAL INFORMATION UNDER IFRS
Due to the time differences between Macau and the United States, this supplemental information is being provided on behalf
of MGM China for the benefit of MGM China investors
Three Months Ended Six Months Ended
June 30 June 30
2020 2019 2020 2019
HK$'000 HK$'000 HK$'000 HK$'000
(unaudited) (unaudited) (unaudited) (unaudited)
Revenue
MGM Macau $139,809 $3,058,883 $1,268,615 $6,459,349
MGM Cotai $117,524 $2,477,003 $1,101,779 $4,837,285
Total Revenue $257,333 $5,535,886 $2,370,394 $11,296,634
Adjusted EBITDA1
MGM Macau ($391,026) $970,384 ($356,905) $2,045,595
MGM Cotai ($494,681) $487,455 ($651,481) $1,031,208
Total Adjusted EBITDA ($885,707) $1,457,839 ($1,008,386) $3,076,803
1
Adjusted EBITDA is profit/loss before finance costs, income tax expense/benefit, depreciation and amortization, gain/loss on disposal/write-off of property and equipment, construction in
progress and other assets, interest income, net foreign currency difference, share-based payments, pre-opening costs and corporate expenses which mainly include administrative expenses
of the corporate office and license fee paid to a related company. Adjusted EBITDA is used by management as the primary measure of the Group’s operating performance and to compare
our operating performance with that of our competitors. Adjusted EBITDA should not be considered in isolation, construed as an alternative to profit or operating profit as reported under IFRS
MGM RESORTS INTERNATIONAL or other combined operations or cash flow data, or interpreted as an alternative to cash flow as a measure of liquidity. Adjusted EBITDA presented in this announcement may not be
30
comparable to other similarly titled measures of other companies operating in the gaming or other business sectors.MGM CHINA FINANCIAL INFORMATION UNDER IFRS
Due to the time differences between Macau and the United States, this supplemental information is being provided on behalf
of MGM China for the benefit of MGM China investors
Three Months Ended Six Months Ended
June 30 June 30
2020 2019 2020 2019
HK$'000 HK$'000 HK$'000 HK$'000
MGM MACAU (unaudited) (unaudited) (unaudited) (unaudited)
(in thousands, except for percentages and revenue per available room (“RevPAR”))
VIP Table Games Turnover 1,752,680 50,900,798 17,545,488 104,887,108
VIP Gross Table Games Win1 47,488 1,318,527 550,040 3,096,640
VIP Table Games Win Percentage 2.71% 2.59% 3.13% 2.95%
Average Daily Gross Win Per VIP Gaming Table 7.8 179.9 51.8 212.1
Main Floor Table Games Drop 379,938 9,193,723 3,793,503 18,825,575
Main Floor Gross Table Games Win1 60,519 1,981,972 804,854 4,005,880
Main Floor Table Games Win Percentage 15.9% 21.6% 21.2% 21.3%
Average Daily Gross Win Per Main Floor Gaming Table 3.4 104.6 25.7 105.3
Slot Machine Handle 1,057,408 8,242,373 4,382,039 15,877,323
Slot Machine Gross Win1 34,646 296,859 147,760 603,877
Slot Hold Percentage 3.3% 3.6% 3.4% 3.8%
Average Daily Win Per Slot 0.7 3.2 1.3 3.3
Commissions, complimentaries and other incentives1 (36,295) (775,118) (368,553) (1,725,489)
Room Occupancy Rate 6.8% 97.5% 24.8% 96.8%
RevPAR 111 1,948 484 1,949
As of June 30
Gaming Units: 2020 2019
Tables2 285 291
Slot Machines 584 1,080
1
The total of “VIP gross table games win”, “main floor gross table games win” and “slot machine gross win” is different to the casino revenue because casino revenue is reported net of
MGM RESORTS INTERNATIONAL commissions and certain sales incentives including the allocation of casino revenue to hotel rooms, food and beverage and other revenue for services provided to casino customers on a 31
complimentary basis.
2
Permanent table count as of June 30, 2020 and 2019MGM CHINA FINANCIAL INFORMATION UNDER IFRS
Due to the time differences between Macau and the United States, this supplemental information is being provided on behalf
of MGM China for the benefit of MGM China investors
Three Months Ended Six Months Ended
June 30 June 30
2020 2019 2020 2019
HK$'000 HK$'000 HK$'000 HK$'000
MGM COTAI (unaudited) (unaudited) (unaudited) (unaudited)
(in thousands, except for percentages and revenue per available room (“RevPAR”))
VIP Table Games Turnover 1,704,784 35,048,025 12,528,653 59,605,713
VIP Gross Table Games Win1 42,742 932,908 383,653 1,841,318
VIP Table Games Win Percentage 2.51% 2.66% 3.06% 3.09%
Average Daily Gross Win Per VIP Gaming Table 8.7 183.9 44.5 185.5
Main Floor Table Games Drop 120,896 6,781,293 2,749,038 12,785,688
Main Floor Gross Table Games Win1 26,995 1,605,486 740,532 3,069,918
Main Floor Table Games Win Percentage 22.3% 23.7% 26.9% 24.0%
Average Daily Gross Win Per Main Floor Gaming Table 1.4 86.7 23.6 83.6
Slot Machine Handle 570,464 9,059,196 3,968,353 19,759,300
Slot Machine Gross Win1 12,855 263,244 124,453 493,237
Slot Hold Percentage 2.3% 2.9% 3.1% 2.5%
Average Daily Win Per Slot 0.3 2.4 1.1 2.3
Commissions, complimentaries and other incentives1 (8,928) (666,375) (337,334) (1,226,461)
Room Occupancy Rate 2.4% 93.5% 17.8% 91.8%
RevPAR 37 1,428 311 1,388
As of June 30
Gaming Units: 2020 2019
Tables2 267 261
Slot Machines 598 1,203
1
The total of “VIP gross table games win”, “main floor gross table games win” and “slot machine gross win” is different to the casino revenue because casino revenue is reported net of
MGM RESORTS INTERNATIONAL commissions and certain sales incentives including the allocation of casino revenue to hotel rooms, food and beverage and other revenue for services provided to casino customers on a 32
complimentary basis.
2
Permanent table count as of June 30, 2020 and 2019SOCIAL IMPACT AND SUSTAINABILITY:
FOCUSED ON WHAT MATTERS
MGM RESORTS INTERNATIONAL 33FOCUSED ON WHAT MATTERS PLATFORM The MGM Resorts Social Impact & Sustainability platform Focused on What Matters: Embracing Humanity & Protecting the Planet articulates our purpose and establishes measurable goals that serve as a roadmap to making an enduring impact for local communities and our planet. MGM RESORTS INTERNATIONAL 34
CORE BELIEFS

We know the importance of          As a member of the                We uphold our commitment to      We believe that a greener
respecting each other’s            communities in which we           the communities that have        business is a better business
differences. We endeavor to        operate, we understand our        welcomed us, by giving           and environmental leadership
embrace and leverage those         responsibility to contribute to   generously and embodying the     is critical to 21st century
differences to achieve best-in-    the social and economic           core value of embracing          corporate leadership.
class experiences and cultivate    progress of where we live. Our    humanity every day. We are       We preserve the environment
stronger ties with our guests,     strategies reflect, sustain and   passionately committed to        through climate leadership,
employees, neighbors and           build on the best of a            active engagement in             sustainable design and
partners. We are committed to      community, creating good jobs,    volunteerism and philanthropic   construction, and responsible
taking strong and principled       strong wages, resilient skills    opportunities — from global      operating practices including
stands on social issues and        and workforce development         commitments to meeting local     energy, water and materials
equality. We aim to better unify   opportunities.                    area needs.                      management.
our world.

MGM RESORTS INTERNATIONAL                                                                                                             35
2025 GOALS

  FOSTERING DIVERSITY                                        INVESTING IN                                                      CARING FOR                                                        PROTECTING
     & INCLUSION                                              COMMUNITY                                                       ONE ANOTHER                                                        THE PLANET

   Four goals announced 2019                          Two goals announced 2019                                         Four goals announced 2019                                         Four goals announced 2018

                                                 Expand our support of nonprofit
 Ensure all employees have equal                                                                                   Surpass 1 million cumulative
                                                 workforce development and                                                                                                           Reduce carbon emissions per
 access to leadership                                                                                              volunteer hours through the
                                                 education programs from                                                                                                             square foot by 45%
 opportunities                                                                                                     Employee Volunteer Program
                                                 25% to 40% of Company giving

 Spend with diverse suppliers at                 Award 600 post-secondary                                          Exceed $100 million in
                                                                                                                                                                                     Reduce energy per square foot
 least 10% of our domestic                       scholarships to children of                                       cumulative employee donations
                                                                                                                                                                                     by 25%
 biddable procurement                            employees                                                         through the MGM Foundation

 Expand our Supplier Diversity                                                                                     Achieve 75% participation in
                                                                                                                                                                                     Reduce water per square foot by
 Mentorship Program to achieve                                                                                     domestic employee donations to
                                                                                                                                                                                     30%
 a milestone of 50 graduates                                                                                       the MGM Foundation

 Train 100% of management
 employees on social impact &                                                                                      Donate 5 million meals through                                    Achieve 60% materials diversion
 sustainability policies and goals                                                                                 our Feeding Forward program                                       rate
 Note: Start date 2020. Not disclosed yet.

                                             Note: 2025 goals are as of December 31, 2019 and based on the following: (i) scholarships for children of employees goal is based on a 2019 start date (ii) cumulative volunteer hours goal is
MGM RESORTS INTERNATIONAL                    based on 2012 program start, (iii) foundation donation goal is based on 2002 program start date, (iv) feeding forward goal is based on 2016 program start date and (v) protecting the planet     36
                                             goals are based on 2007 baseline.
Progress Towards Achieving Our 2025 Goals
U.S. data unless indicated
FOSTERING DIVERSITY & INCLUSION 2007 2008 2009 2010 2011 2012 2013 2014 2015 2016 2017 2018 2019
Women in workforce (U.S. only 2011 - 2017, global 2018 - 2019), % Data not disclosed 2007 - 2010. 50.4% 50.3% 50.4% 50.6% 50.6% 51.1% 51.1% 50.4% 50.3%
Women in management (U.S. only 2011 - 2017, global 2018 - 2019), % Data not disclosed 2007 - 2010. 42.5% 42.9% 42.6% 42.3% 43.6% 43.9% 44.0% 40.4% 41.0%
Women's leadership opportunity (U.S. only 2011 - 2017, global 2018 - 2019), % Data not disclosed 2007 - 2010. Quantitative goal established in 2019. 7.9% 7.4% 7.9% 8.3% 7.0% 7.2% 7.0% 10.1% 9.2%
Racially and ethnically diverse talent in workforce, % Data not disclosed 2007 - 2010. 63.1% 63.7% 64.5% 65.3% 66.2% 68.6% 68.3% 69.0% 67.8%
Racially and ethnically diverse talent in management, % Data not disclosed 2007 - 2010. 37.7% 38.2% 39.0% 37.8% 41.5% 42.7% 42.9% 44.8% 47.8%
1,2
Racially and ethnically diverse leadership opportunity, % Data not disclosed 2007 - 2010. Quantitative goal established in 2019. 25.3% 25.5% 25.5% 27.5% 24.6% 25.9% 25.4% 24.2% 20.0%
Tier 1 diverse supplier spend, % 3 Data not disclosed 2007 - 2010. Quantitative goal established in 2019. 7.5% 7.3% 7.3% 7.7% 8.4% 9.1% 9.5% 9.4% 9.1%
Diverse supplier mentorship program graduates, cumulative Program launched in 2016. Quantitative goal established in 2019. 0 4 8 12
INVESTING IN COMMUNITY 2007 2008 2009 2010 2011 2012 2013 2014 2015 2016 2017 2018 2019
Company giving to workforce development programs, % of total company giving Data not disclosed 2007 - 2016. 12% 15% 26%
Scholarships awarded to children of employees Program launched in 2018. Quantitative goal established in 2019. 100
CARING FOR ONE ANOTHER 2007 2008 2009 2010 2011 2012 2013 2014 2015 2016 2017 2018 2019
Employee volunteer hours, cumulative Data not disclosed 2007 - 2011. Quantitative goal established in 2019, with 2012 baseline. 113,454 222,169 394,485 552,336 655,238 770,192 893,971 964,544
Employee giving to MGM Resorts Foundation, cumulative $ 4 $23.5M $30.4M $35.1M $39.9M $44.5M $49.3M $54.1M $59.1M $65.2M $68.3M $73.5M $78.1M $83.0M
5
Employees giving to MGM Resorts Foundation, % of employees 50.0% 54.0% 43.0% 40.0% 42.0% 43.0% 42.0% 51.0% 61.0% 68.7% 67.5% 71.0% 34.3%
Meals donated to charity, cumulative 6 Program launched in 2018. Quantitative goal established in 2019. 232,870 538,797 923,044 1,528,735
PROTECTING THE PLANET (GLOBAL DATA) 2007 2008 2009 2010 2011 2012 2013 2014 2015 2016 2017 2018 2019
Carbon emissions, pounds CO2 equivalent (scope 1 and 2) per square foot 30.2 29.8 29.4 26.6 25.3 27.3 26.6 26.0 25.5 21.0 21.3 20.0 22.2
Carbon emissions, kilograms CO2 equivalent (scope 1 and 2) per square meter 147.6 145.3 143.4 129.7 123.4 133.3 129.7 127.2 124.5 102.6 103.9 97.7 108.2
Change from 2007 baseline, % 0% -1.5% -2.8% -12.1% -16.4% -9.7% -12.1% -13.8% -15.7% -30.5% -29.6% -33.8% -26.7%
Energy usage, electricity and natural gas, kilowatt hours per square foot 30.9 30.5 29.2 27.0 26.6 27.1 27.2 26.7 26.5 25.8 25.9 25.8 26.1
Energy usage, electricity and natural gas, kilowatt hours per square meter 332.4 328.7 313.9 290.8 286.0 292.2 292.7 287.6 285.0 278.0 279.1 278.2 281.2
Change from 2007 baseline, % 0% -1.1% -5.6% -12.5% -14.0% -12.1% -11.9% -13.5% -14.3% -16.4% -16.0% -16.3% -15.4%
Water usage, combined utility and well water, gallons per square foot 75.6 70.9 68.9 59.4 60.0 61.1 60.7 61.2 60.0 58.7 55.9 57.23 53.6
Water usage, combined utility and well water, cubic meters per square meter 3.08 2.89 2.81 2.42 2.44 2.49 2.47 2.49 2.44 2.39 2.28 2.33 2.18
Change from 2007 baseline, % 0% -6.3% -8.8% -21.4% -20.7% -19.2% -19.7% -19.0% -20.6% -22.3% -26.1% -24.3% -29.1%
Materials diversion, materials diverted from landfill / incineration, % 9.8% 14.4% 23.6% 33.2% 38.3% 41.9% 50.7% 44.1% 35.7% 39.7% 38.5% 45.8% 44.1%
Notes: 1. We are tracking progress toward this goal by comparing the percentage of women and diverse people in leadership positions with their proportion in our total workforce. 2. In accordance with U.S. Equal Employment Opportunity Commission voluntary self-identified racial/ethnic background or heritage. 37
3. Tier 1 Diverse Supplier Spend is spend with certified diverse suppliers including minority, women, veteran, disabled and LGBTQ+ owned suppliers. Tier 1 biddable spend is non sole-source procurement (excluding design & construction) that diverse suppliers are eligible to bid on. 4. Employee giving goal based on 2002 program start. Annual
values from 2007 to 2016 reflect dollars raised from employees. Value in 2017 reflects dollars raised and disbursed. Values in 2018 and 2019 reflect dollars disbursed. 5. Reduction from 2018 to 2019 driven partly by company restructuring in 2019. 6. Includes meals rescued from properties and funded through philanthropy.COVID-19 RESPONSE & COMMUNITY SUPPORT
Beyond COVID-related donations in Las Vegas, across the U.S. and in Macau, of food, personal protective equipment and other
cash and in-kind giving valued at over $3.5 million, MGM Resorts provided community support in the following ways*:
Employee Emergency Grant Fund $10.5 MILLION
The MGM Resorts Foundation has paid 13,485 eligible employee bills and disbursed over $10.5M to date. paid in assistance on behalf of
Assistance includes mortgage and rent payments, utilities, medical bills and funeral expenses. The MGM Resorts employees
average grant is $2,528. The Foundation has an approval rate of 93% relative to applications received.
13,000+
employee bills paid
New York State COVID-19 Crisis Response
Donated $225,000 to community non-profits to assist with food, safety and medical equipment in New $225,000
York State. Organizations included: Health Research Inc., World Central Kitchen, Feeding Westchester and donated to New York-based non-
Bronx Community Relief Effort. profits
National Association for Advancement of Colored People (NAACP)
Donated $100,000 to support the NAACP #WeAreDoneDying Campaign which champions smarter,
results-based criminal justice reform to keep communities safe and support an end to racial disparities at $100,000
all levels of the judicial system. donated to NAACP
* Numbers as of July 21, 2020
MGM RESORTS INTERNATIONAL 38RECENT AWARDS & CURRENT CERTIFICATIONS
FOSTERING DIVERSITY & INCLUSION PROTECTING THE PLANET
• DiversityInc Top Regional Companies (ranked #2) Leadership in Energy & Environmental Design (LEED)
• DiversityInc Top Regional Company for Supplier Diversity • MGM Springfield: LEED Platinum (Four Certifications)
• Best Places to Work for LGBTQ Equality: Human Rights • MGM National Harbor: LEED Gold
Campaign • T-Mobile Arena: LEED Gold
• America’s Best Employers for Diversity: Forbes • The Park: LEED Gold
• 2019 America’s Top Corporations for Women’s Business • ARIA, Vdara, Veer: LEED Gold (Four Certifications)
Enterprises: Women’s Business Enterprise National Council
• Best for Vets Employer for 2019: Military Times Green Globes
• Leading Disability Employer: National Organization on • Park MGM: Three Green Globes
Disability • Bellagio, Delano, Excalibur, Luxor, Mandalay Bay,
• Million Dollar Club: U.S. Hispanic Chamber of Commerce MGM Grand Las Vegas, Mirage, New York-New York,
• 2019 Women’s Forum Corporate Champion Signature: Four Green Globes
Green Key
CARING FOR ONE ANOTHER/INVESTING IN COMMUNITY • ARIA, Bellagio, Delano, Mandalay Bay, MGM Grand
Detroit, MGM Grand Las Vegas, Vdara: Five Keys
• Newsweek: 50 companies that stood out in the pandemic • Beau Rivage, Gold Strike Tunica, Excalibur, Luxor
• Beau Rivage Resort Business Volunteer of the Year: Biloxi Mirage, Park MGM, New York-New York, Signature:
• One of the 50 Most Community Minded Companies in the US Four Keys
The Civic 50 (Points of Light)
• Public Awareness Award: National Council on Problem China Green Building Design Label - Macau
Gambling • MGM Cotai: Three Star Certification
MGM RESORTS INTERNATIONAL Note: Awards received in 2019/2020. Certifications are current as of 2Q 2020
39ADDITIONAL RESOURCES AT
MGMRESORTS.COM/FOCUSED
2019 Social Impact & Sustainability Report Social Impact & Sustainability Goals & Metrics
MGM RESORTS INTERNATIONAL 40DIGITAL INNOVATIONS
MGM RESORTS INTERNATIONAL 41DIGITAL GUEST EXPERIENCE: HOTEL
MGM’S RESORTS ARE THE FIRST DESTINATIONS ON THE LAS VEGAS STRIP TO OFFER
FULLY DIGITAL AND CONTACTLESS CHECK IN
Step 1: Step 2:
Guests can check in from their Guests can use their mobile device
mobile device before setting as a digital key allowing 100%
foot in the lobby contactless and faster access to
their hotel room at all MGM Resorts’
Las Vegas Strip locations*
27% 200,000+
of guests have opted for a fully doors have been unlocked via digital
digital check in experience since key since launch
reopening, driving app installs
and MLife signups to pre-
coronavirus levels
75% of mobile check-ins
completed before arrival,
reducing congestion in the lobby
MGM RESORTS INTERNATIONAL * Statements are for the time period of 6/4- 7/24/2020 and applies to all MGMRI Las Vegas resorts that are currently open as of 7/24/2020
42DIGITAL GUEST EXPERIENCE: F&B
VIRTUAL WAITLIST VIRTUAL MENU
• Guests can add themselves to a virtual • Digital menus allow guests to view menus
waitlist and receive a text message when on their personal mobile device simply by
their table is ready at over ~81 locations scanning a QR code at over ~87 locations
across Las Vegas and Regional resorts* across Las Vegas and Regional resorts*
• Reduces crowding at restaurant entrances • This allows us to protect the well being of
and allows guests to enjoy themselves on the our guests while also reducing waste
casino floor while waiting for a table created with single use disposable menus
MGM RESORTS INTERNATIONAL * Statements as of 7/24/2020 and applies to the majority of locations that are currently open at MGM Resorts. Waitlist available currently at 58 locations in Las Vegas and 23 locations across
Regional destinations. Virtual menu is available at 73 Las Vegas locations and 14 Regional locations 43You can also read