FY20 RESULTS PRESENTATION - 27 August 2020 - Cromwell Property Group
←
→
Page content transcription
If your browser does not render page correctly, please read the page content below
FY20
RESULTS
PRESENTATION
27 August 2020

                 CROMWELL PROPERTY GROUP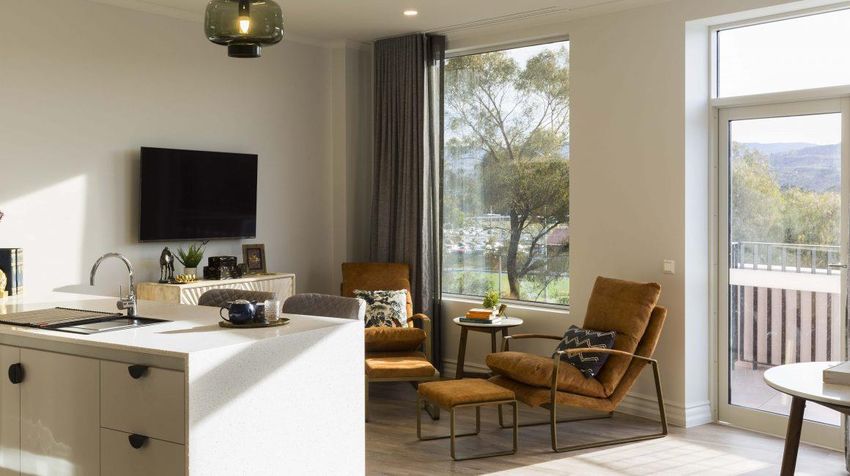
Important Information & Disclaimer
This    presentation     including    its    appendices      they deem necessary or consider appropriate for their           Fund ARSN 165 011 905 (DPF), Cromwell Ipswich City
(Presentation) is dated 27 August 2020 and has been          particular jurisdiction.                                        Heart Trust ARSN 154 498 923 (ICH), Cromwell
prepared by Cromwell Property Group, which                                                                                   Phoenix Opportunities Fund ARSN 602 776 536
                                                             Cromwell Property Group does not guarantee any
comprises Cromwell Corporation Limited (ACN 001                                                                              (POF), Cromwell Phoenix Property Securities Fund
                                                             particular rate of return or the performance of an
056 980) and the Cromwell Diversified Property Trust                                                                         ARSN 129 580 267 (PSF), Cromwell Property Trust 12
                                                             investment in Cromwell Property Group nor do they
(ARSN 102 982 598) (the responsible entity of which is                                                                       ARSN 166 216 995 (C12) and Cromwell Riverpark
                                                             guarantee the repayment of capital from any such
Cromwell Property Securities Limited (ACN 079 147                                                                            Trust ARSN 135 002 336 (CRT) (the funds). In making
                                                             investment or any particular tax treatment. Past
809; AFSL 238052)). Shares in Cromwell Corporation                                                                           an investment decision in relation to one or more of the
                                                             performance is not a reliable indicator of future
Limited are stapled to units in the Cromwell Diversified                                                                     funds, it is important that you read the product
                                                             performance. Any “forward-looking” statements are
Property Trust. The stapled securities are listed on the                                                                     disclosure statement for the fund. The PDS for each
                                                             based on assumptions and contingencies which are
ASX (ASX Code: CMW).                                                                                                         fund is issued by CFM and is available from
                                                             subject to change without notice and are provided as a
                                                                                                                             www.cromwell.com.au or by calling Cromwell on 1300
This Presentation contains summary information about         general guide only and should not be relied upon as an
                                                                                                                             268 078. POF, ICH, C12 and CRT are not open for
Cromwell Property Group as at 30 June 2020.                  indication or guarantee of future performance.
                                                                                                                             investment. Applications for units in DPF and PSF can
Statutory financial information has been reviewed by
                                                             The information in this Presentation has been obtained          only be made on the application form accompanying
Cromwell Property Group’s auditors. Operating
                                                             from or based on sources believed by Cromwell                   the relevant PDS.
financial information has not been subjected to audit
                                                             Property Group to be reliable. To the maximum extent
review. All financial information is in Australian dollars                                                                   This Presentation is for information purposes only and
                                                             permitted by law, Cromwell Property Group, their
and all statistics are as at 30 June 2020 unless                                                                             does not constitute an offer to sell, or the solicitation of
                                                             officers, employees, agents and advisors do not make
otherwise stated.                                                                                                            an offer to buy, any securities or any other financial
                                                             any warranty, expressed or implied, as to the currency,
                                                                                                                             products in any jurisdiction and is not a prospectus,
The information in this Presentation is subject to           accuracy, reliability or completeness of the information
                                                                                                                             product disclosure statement or other document under
change without notice and does not purport to be             in this Presentation and disclaim all responsibility and
                                                                                                                             Australian law or any other law.
complete or comprehensive. It should be read in              liability for the information (including, without limitation,
conjunction with Cromwell Property Group’s other             liability for negligence).
periodic and continuous disclosure announcements
                                                             To the extent that any general financial product advice         © 2020. Cromwell Property Group. All rights reserved
available at www.asx.com.au.
                                                             in respect of Cromwell Property Group stapled
The information in this Presentation does not take into      securities is provided in this Presentation, it is provided
account your individual objectives, financial situation or   by Cromwell Property Securities Limited. Cromwell
needs. Before making an investment decision,                 Property Securities Limited and its related bodies
investors should consider, with or without a financial or    corporate, and their associates, will not receive any
taxation adviser, all relevant information (including the    remuneration or benefits in connection with that advice.
information in this Presentation) having regard to their
                                                             Cromwell Funds Management Limited ACN 114 782
own objectives, financial situation and needs. Investors
                                                             777 AFSL 333214 (CFM) is the responsible entity of,
should also seek such financial, legal or tax advice as
                                                             and the issuer of units in the Cromwell Direct Property

                                                                                                                                                CROMWELL PROPERTY GROUP                     2
Overview

           CROMWELL PROPERTY GROUP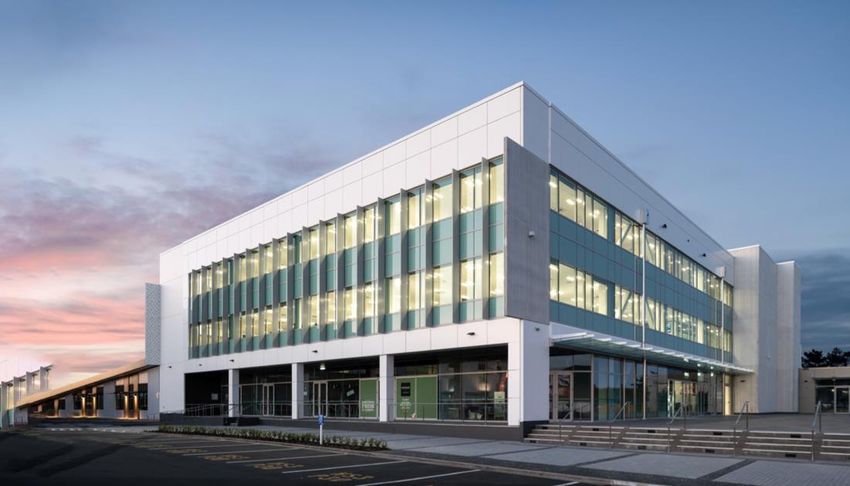
FY20 Group Financial Highlights
Overview

 Earnings and Distributions                                                    Platform                                                   Financial Position

               Underlying operating                                            Direct Property Investment
               profit1                                                         $3.0 billion value                                         NTA per unit
                                                                                                                                                               Liquidity3
               $221 million                                                    5.6% WACR
                                                                               6.2 year WALE
                                                                                                                                          $0.99                $667 million
               up 27.0% (FY19 $174 million)                                    $1.1bn development pipeline
                                                                                                                                          (FY19 $0.97)

               Underlying operating                                            Indirect Property Investment
               profit per security                                             CEREIT            CPRF2
                                                                                                                                          Debt tenor           Gearing
               8.50 cents                                                      €394 million
                                                                               book value
                                                                                                                     €452 million
                                                                                                                                          3.2 years            41.6%
               3.5% above FY19 (8.21 cps)                                                                            independent
                                                                               (30.7% interest)                      external valuation

               Distributions                                                   Funds and asset management                                 Next debt            Interest rate
               per security                                                    $8.2 billion total AUM                                     maturity             hedging
               7.50 cents                                                      $5.8 billion AUM in Europe
                                                                               (78% recurring)                                            March                66% / 2.6
               3.4% above FY19 (7.25 cps)                                      $2.4 billion AUM in A/NZ                                   2022                 years
 1.   See Appendix for further details of segment results, operating profit and reconciliation to statutory profit
 2.   Excludes equity accounted interest in Ursynow
 3.   Cash and cash equivalents plus undrawn commitments

                                                                                                                                                       CROMWELL PROPERTY GROUP   4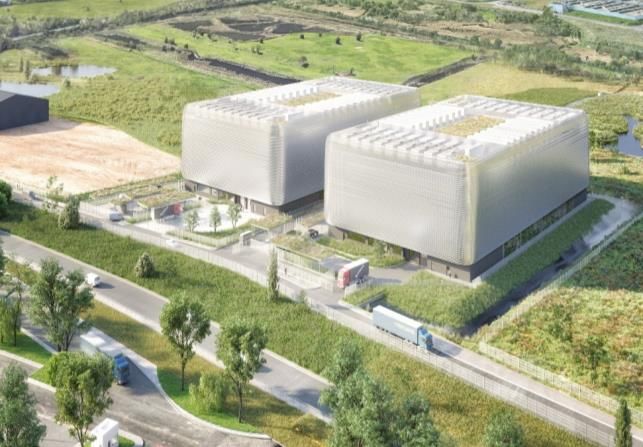
Strategy Summary
Overview

                     Core         Defensive government base, long WALE, strong covenants, low capex and structured growth
     Direct
    Property        Core+         Generate leasing upside and take advantage of short term market trends
  Investment
                Active/For sale   Drive outperformance from repositioning and asset enhancement or alternatively capital recycling

                   CEREIT         CEREIT provides stable and growing distributions, access to Asian capital
    Indirect
    Property         LDK          Significant opportunity to scale-up LDK JV and establish a sizeable Seniors Living business
  Investment
                    CPRF          Temporarily warehoused as part of ‘Invest to Manage’ strategy. Targeting eventual 20 to 30% stake

                                  Platform repositioning complete and ready to deploy operational leverage
  Funds and        Europe         New opportunities to scale-up platform – European Logistics and proposed Data Centres Funds
    Asset                         Deliver continued growth in quality and resilience of CEREIT portfolio
 Management
                     A/NZ         Consistent long term recurring revenue within A/NZ FM and high margins from retail syndicates

                                  ‘Through the cycle’ target gearing range of 30% to 40% with leverage capacity to be used on a short
      Capital Management          term basis to execute the ‘Invest to Manage’ strategy

                                                                                                       CROMWELL PROPERTY GROUP          5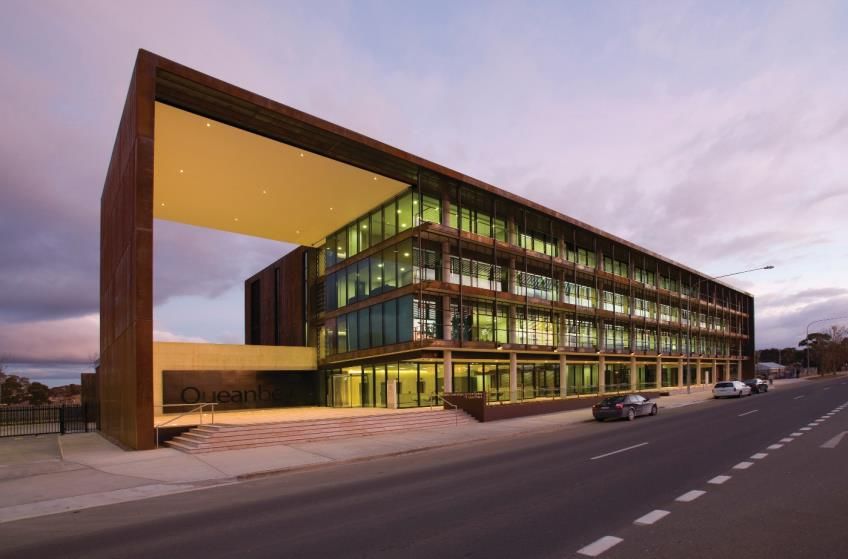
COVID-19 Tenant-Customer Negotiations
Overview

Direct Property Investment Portfolio                                   FY20 COVID-19 position – Australian portfolio
▪ National Code of Conduct requires landlords to provide rent
                                                                               $250.0       $228.9          $219.3
  relief to SMEs impacted by COVID-19
                                                                               $200.0
▪ Only 93 SMEs representing less than 10% of total gross passing
  income in Cromwell’s Australian property portfolio. Not all were

                                                                     Million
                                                                               $150.0
  impacted by COVID-19
                                                                               $100.0
▪ Agreements bespoke and agreed on a case-by-case basis, relief
  also provided to three impacted non-SME tenant-customers                      $50.0
                                                                                                                              $1.9         $7.7
▪ $9.6 million of rent impacted (4.2%) of which $1.9 million was                  $-
                                                                                        Total FY20 Rent   Unimpacted         Waived      Deferred
  waived with majority ($7.7 million) being deferred                                          (100%)        (95.8%)          (0.83%)     (3.36%)

Creating COVID safe workplaces                                         Creating COVID safe workplaces
▪ Cromwell has been focused on providing safe workplaces for all
  3,000+ tenant-customers and employees globally
▪ In Australia these measures are in accordance with relevant
  government and state guidelines including:
        ▪ Increased communication and signage in all buildings
        ▪ Increased cleaning of high touch / high traffic areas
        ▪ Sanitiser stations and safe distance notifications
        ▪ Additional deep clean options for individual tenancies

                                                                                                                       CROMWELL PROPERTY GROUP      6
COVID-19 Tenant-Customer Negotiations
Overview

Cromwell Polish Retail Fund (CPRF)                                                FY20 COVID-19 position – CPRF1

▪ The Polish government temporarily suspended retail lease                        Month                                   Mar        Apr        May      Jun         Jul
  agreements in March 2020 as part of its COVID-19 response plan.
  Essential retail including grocery and pharmacy were deemed out                 Tenants permitted to open (By           34%2       34%        93%      96%         100%
  of scope and traded heavily throughout the period                               headline rent)
▪ Most tenant-customers that closed were subsequently able to                     2020 Footfall as % of 2019 Footfall     48%2       40%        76%      81%         87%
  reopen in a phased process from May and all were open by July
▪ Unlike Australia there is no right to a rental waiver. The
                                                                                  Gross Collection by month               90%        60%        71%      62%         62%
  uncollected or deferred rent must still be paid usually via a lease
  variation (extension) agreed with the landlord
▪ The Polish law stipulates that tenants must serve notice to
  renegotiate their lease within three months of re-opening. If they               CPRF footfall From Government Closure 2020 & Comparison to 2019
  fail to do so, then rent during the mandated closure period                                     160
  becomes payable and they lose the right to renegotiate                                          140
                                                                                                  120
▪ 111 tenant-customers have agreed lease variations so far with

                                                                                   Footfall (k)
                                                                                                  100
  another 162 remaining. The total operating profit impact of rent not                             80
  charged during the lockdown period was €2.6 million                                              60
                                                                                                   40
▪ For the June quarter overall cash collection for the portfolio was
                                                                                                   20
  64% and it is expected that further amounts will be collected once                               -

                                                                                                          4-Apr

                                                                                                          6-Jun
                                                                                                        13-Jun
                                                                                                        20-Jun
                                                                                                        27-Jun
                                                                                                           4-Jul
                                                                                                         11-Jul
                                                                                                         18-Jul
                                                                                                         25-Jul
                                                                                                        14-Mar
                                                                                                        21-Mar
                                                                                                        28-Mar

                                                                                                         11-Apr
                                                                                                         18-Apr
                                                                                                         25-Apr
                                                                                                         2-May
                                                                                                         9-May

                                                                                                          1-Aug
                                                                                                          8-Aug
                                                                                                        16-May
                                                                                                        23-May
                                                                                                        30-May
  negotiations conclude with each tenant

 1.   Acquired November 2019
 2.   March from COVID-19 Lockdown (i.e excludes data from first half of March)                         2019       2020          Trend (2019)         Trend (2020)

                                                                                                                                 CROMWELL PROPERTY GROUP                   7
Total Securityholder Returns
Overview

     Cromwell has consistently outperformed its benchmark index over key timeframes

                                                 CMW total performance returns to 30 June 2020
   250%
                                                                                                                     213%
   200%

   150%                                                                                                                      142%

   100%
                                                                                                                                      71%

    50%
                                                                                          29%
                                                       19%                                       22%
                                                                        13%                                7%
                                           4%                   6%
     0%

                     -18%     -22%
   -50%
                              FY20                            FY18-20                           FY16-20                     FY11-20

                                                Cromwell Total Return    ASX 200 A-REIT    Out/(under performance)

   Source: Datastream as at 30 June 2020

                                                                                                                     CROMWELL PROPERTY GROUP   8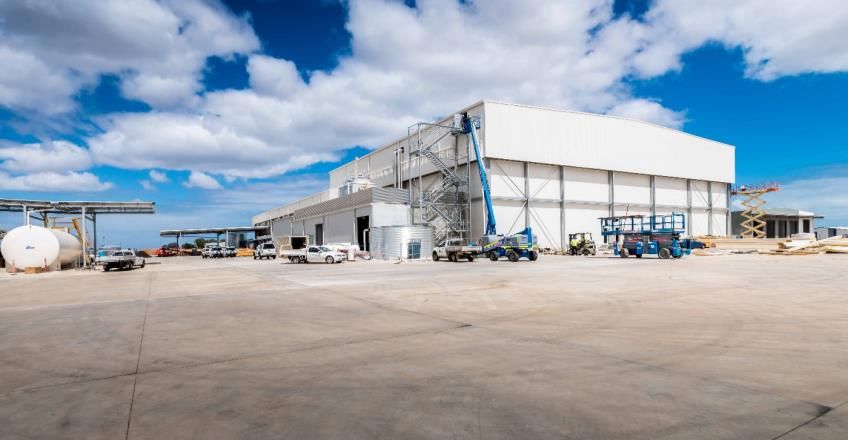
Financial and Capital
Management Update

                        CROMWELL PROPERTY GROUP
FY20 Headline Results
Financial and Capital Management Update

Commentary                                                                                                           FY20 Performance Versus PCP

▪ Cromwell has delivered operating profit of 8.50 cents                                                                                        FY20     FY19     Change
  per security, exceeding guidance of 8.30 cents per
  security due to strong underlying business performance                                                            Statutory profit ($m)      181.1    159.9    13.3%
▪ Rent collection has been strong relative to peers given
  the skew towards high quality government, ASX-listed                                                              Statutory profit (cps)     6.96     7.53     (7.6%)
  and other larger tenant-customer entities
▪ Prudent financial management has allowed Cromwell to                                                              Operating profit ($m)1     221.2    174.2    27.0%
  deliver distributions of 7.50 cents per security in line with
  guidance, 3.4% greater than FY19                                                                                  Operating profit (cps)     8.50     8.21      3.5%

                                                                                                                    Distributions ($m)         195.5    157.5    24.1%
Operating profit per security                                      Distributions per security

                                                                                                                    Distributions (cps)        7.50     7.25      3.4%
            8.50 cents                                                             7.50 cents
            3.5% above FY19                                                        3.4% above FY19                  Payout ratio               88%      90%      (2.1%)

1.   See Appendix for further details of segment results, operating profit and reconciliation to statutory profit

                                                                                                                                               CROMWELL PROPERTY GROUP    10
FY20 Segment Results
Financial and Capital Management Update
FY20 Commentary FY20 Segment Profit1 Versus PCP
Direct Property Investment FY20 FY19
Change
Segment profit of $172.2 million (+26.5%) driven by strong like-for-like NOI ($m) ($m)
growth across Core and Core+ portfolios (well above rolling 3.0% target)
and Northpoint development profit Direct property investment 172.2 136.1 26.5%
Indirect property investment 55.9 45.4 23.1%
Indirect Property Investment
Funds and asset management 40.8 28.5 43.2%
Segment profit of $55.9 million up 23.1% partly due to warehousing CPRF,
stable and growing earnings from CEREIT and share of income from LDK
Total segment results 268.9 210.0 28.0%
Funds and asset management
Finance income 5.8 4.8 20.8%
Segment profit of $40.8 million (+43.2%) due to strong first half Corporate costs2 (39.2) (39.6) (1.0)%
transactional activity. Continued growth expected as platform scales to
medium term AUM target and once transactional activity resumes Income tax expense (14.3) (1.0) 1330%
Other Operating profit 1 221.2 174.2 27.0%
Corporate costs flat with an increase in income tax expense primarily
attributable to development fee earned in respect of Northpoint Tower Operating profit (cps) 8.50 8.21 3.5%
1. See Appendix for further details of segment results, operating profit and reconciliation to statutory profit
2. Includes non-segment specific corporate costs pertaining to Group level functions such as finance and tax, legal, risk
and compliance, corporate secretarial and marketing and other corporate services
CROMWELL PROPERTY GROUP 11Capital Position
Financial and Capital Management Update
Strong Debt Profile and Balance Sheet Position Group Gearing (2009 to 2020)
▪ Substantial liquidity of $667 million consisting of cash
55
and cash equivalents of $194 million with the balance
50
consisting of undrawn domestic banking lines
45
▪ Target ‘through the cycle’ gearing of 30% – 40% with 40
leverage capacity to be used on a short term basis to 35
execute the ‘Invest to Manage’ strategy 30
Target Gearing Range CMW Gearing
▪ Gearing of 41.6% with deleveraging to take place over 25
time (sell down of CPRF alone would return gearing to
low end of target range)
Debt Expiry Profile
▪ Average cost of debt of 2.84%, no major expiries until $ 1,400 M
March 2022, debt well diversified across two dozen $ 1,200 M
domestic and international lenders
Debt Balance ($M)
$ 1,000 M
$ 800 M
Weighted average cost of debt Weighted average debt expiry $ 600 M
$ 400 M
2.84% 3.2 years $ 200 M
$0M
Weighted average hedge term FY FY FY FY FY FY FY
Interest rate hedging 2021 2022 2023 2024 2025 2026 2027
Australian Major Banks $ 0.0 M $ 0.0 M $ 168.0 M $ 0.0 M $ 0.0 M $ 0.0 M $ 0.0 M
2.6 years 66% International Banks $ 0.0 M $ 176.1 M $ 1,150.8 $ 200.0 M $ 72.2 M $ 60.0 M $ 0.0 M
1. Gearing calculated as (total borrowings less cash)/(total tangible assets less cash)
Convertible Bond $ 0.0 M $ 0.0 M $ 0.0 M $ 0.0 M $ 360.2 M $ 0.0 M $ 0.0 M
CROMWELL PROPERTY GROUP 12Direct Property
Investment Segment
CROMWELL PROPERTY GROUPProperty Portfolio Snapshot (Australian properties only)
Direct Property Investment Segment
Key Core/Core+ Portfolio Metrics1
Core
Properties Book value WACR WALE Occupancy NOI growth
10 $2.35 billion 5.34% 7.5 years 99.2% 3.6%
Core+
Properties Book value WACR WALE Occupancy NOI growth
6 $0.60 billion 6.49% 3.0 years 96.4% 5.8%
3
Total
Properties Total value WACR WALE Occupancy NOI growth 1 8
16 $2.95 billion 5.57% 6.4 years 98.4% 4.1% 7
2
Active/For sale
Total Australian properties
21 on balance sheet
Properties Book value WACR WALE Occupancy NOI growth
5 $0.06 billion 7.25% 0.3 years 38.0% (64.8%)% $3.0bn Book value
5.57% WACR
1. NOI growth calculated on a like-for-like basis. All other metrics as at 30 June 2020
CROMWELL PROPERTY GROUP 14Defensive and Diversified Portfolio
Direct Property Investment Segment
Commentary Geographic diversification1 Tenant classification1
▪ Defensive portfolio with 45.3% of gross
passing income from government owned 2.5%
10.0% 14.0% ACT
and funded entities,Lease Expiry Profile Remains Favourable1
Direct Property Investment Segment
Lease Update and Upcoming Expiry Profile Cromwell Lease Expiry Profile
▪ Lease transactions mainly completed in first half with 36 deals 70.0%
58.4%
completed for a total of 22,000 sqm 60.0%
50.0%
▪ Core/Core+ portfolio combined occupancy remains high at 98.4%
40.0%
▪ Only one major upcoming (FY21, > 1.0% of gross passing 30.0%
income) lease expiry in the Core/Core+ portfolio. 20.0% 12.9%
7.8% 9.1%
10.0% 5.7% 4.9%
▪ Reed Elsevier at Victoria Avenue, Chatswood in 1.2%
0.0%
December 2020 (1.2%)
Vacant/ 2021 2022 2023 2024 2025 Thereafter
Holdover/
▪ Active/For sale assets currently have 38.0% occupancy. They are Casual
2
not available for lease and occupancy will reduce to zero as they
are repositioned or sold
Next Review Type
▪ Average fixed review profile over next three years
100% 3% 3%
▪ 3.72% over 72% of portfolio in FY21 13%
25%
▪ 3.67% over 66% of portfolio in FY22 80% 21% 40%
▪ 3.67% over 58% of portfolio in FY23 60% No review
Market
40%
72% 66%
57% Fixed
20%
0%
1. Calculated on current gross passing income for Core/Core+ portfolio, subject to review and rounding
FY21 FY22 FY23
2. Includes vacancy, holdover, casual
CROMWELL PROPERTY GROUP 16Portfolio Valuation Proves Resilient
Direct Property Investment Segment
▪ All domestic portfolio assets were externally, FY20 Weighted Average Cap Rate Change1
independently valued (except the three held for sale)
5.73% 0.03% 5.57%
▪ Fair value increase in investment property of $65.2 million
-0.13%
(FY19 $74.9 million) net of property improvements, lease
costs and incentives, driven by value of Core portfolio
▪ Asset recycling strategy ongoing with over $640 million of
assets sold and $794 million acquired in last three years
▪ Portfolio continues improvement trend with WACR
tightening by 0.16% to 5.57%
FY20 FY19 Historic Weighted Average Cap Rate
Core
WACR WACR 9.0%
5.34% 5.47% 8.5%
8.0%
7.5%
Core+
WACR WACR 7.0%
6.49% 6.04% 6.5%
6.0%
5.5%
Total
WACR WACR 5.0%
Jun-2009
Jun-2010
Jun-2011
Jun-2012
Jun-2013
Jun-2014
Jun-2015
Jun-2016
Jun-2017
Jun-2018
Jun-2019
Jun-2020
Dec-2009
Dec-2010
Dec-2011
Dec-2012
Dec-2013
Dec-2014
Dec-2015
Dec-2016
Dec-2017
Dec-2018
Dec-2019
5.57% 5.73%
1 Sales include assets moved to held for sale and 50% sale of Victoria Avenue, Chatswood
CROMWELL PROPERTY GROUP 17Development Pipeline
Direct Property Investment Segment
Line-of-sight to c.$1.1 billion pipeline of new value add development opportunities
LDK Greenway Views, Victoria Avenue, 700 Collins Street,
Centenary House, ACT Confidential Projects
ACT1 Chatswood NSW Melbourne VIC
DA submitted July 2019 for
First three blocks for 210 This property is earmarked an additional 13,000 sqm of
Negotiations on
apartments complete. to be demolished and a new Amended DA agreed with office, 182 room hotel and
redevelopment of existing
Description Blocks D & E (> 100 c. 18,000 sqm building is to JV partner and c. 280 residential
assets with new and
apartments) yet to be constructed subject to submitted to Council accommodation units.
existing tenants
commence DA approval Response expected by end
of 2020
Status Current Awaiting DA Approval Awaiting DA Approval Awaiting DA Approval New
Estimated
$170m ($120m complete) $85 million c.$120m c.$350m >$500m
development cost
Proposed timing FY19 –FY21 FY21+ FY21-23 FY21-24 FY21+
1. Cromwell has a 50% ownership interest in LDK Healthcare (LDK). Note LDK is included within the Indirect Property Investment Segment
CROMWELL PROPERTY GROUP 18Indirect Property
Investment Segment
CROMWELL PROPERTY GROUPSegment Results Up 23.1%
Indirect Property Investment Segment
Operating profit of $55.9 million up 23.1% from $45.4 million in FY19 due to contribution from CPRF
and 30.7% interest in CEREIT
Key Metrics Commentary
Book value Increase quality / resiliency of portfolio, with
AUM WALE Properties
CEREIT €394 75%+ in Western Europe and 75%+ in office
€2.1 billion 4.6 yrs 951 and light industrial / logistics
million
Equity Seniors Seniors
accounted JV interest Living Living Focus on final stage of works at LDK
LDK Value2 Apts Villages Greenway Views and identifying further
50% village sites to scale up
$6.7 million 430 2
Valuation
WALE WACR Assets
CPRF3 €452 Temporarily warehoused on balance sheet
4.7 years 6.4% 6
million
1. Includes property in Sangerhausen acquired after 30 June 2020
2. 50% interest
3. Excludes 94% interest in Ursynow
CROMWELL PROPERTY GROUP 20CEREIT – 30.7% stake
Indirect Property Investment Segment
Commentary Key statistics Sector diversification
▪ Leasing momentum continued despite COVID-19. To date impact
Book value
on CEREIT’s tenant-customers has been limited
€394 million 6%
▪ Net Property Income of €57.7 million up 6.6% (€54.1 million).
31% Light Industrial /
▪ Distributions of 1.74 euro cents per unit (cpu) were 3.4% lower on a AUM Logistics
Office
like-for-like basis2
€2.1 billion
Others 3
▪ External valuations were conducted for ~50% of CEREIT’s portfolio
63%
by value at 31 December 2019 with reduction of just 1.0% WACR
▪ Cromwell’s 30.7% equity accounted share of CEREIT’s profit for 6.4%
the year was $47.5 million (2019: $44.6 million)
Geographic diversification
▪ As at 30 June 2020 the stake is valued at over €394.4 million WALE
($645.4 million) 4.6 years
4% The Netherlands
6%
8% 29% Italy
Occupancy
France
94.8% 12% Poland
1. For the Financial Period, which refers to the financial period from 1 January 2020 to 30 June 2020 Germany
2. This assumes 1H 2020 base management fee and property management fee are paid 100%/40% respectively in units Finland
as in 1H 2019 and excludes provision for COVID-19 related doubtful debts of €3.0 million and distribution of divestment Properties 19% 22%
gain of €2.8 million as these items are considered one-off Denmark
3. Others include three government-let campuses, one leisure/retail property and one hotel in Italy 954
4. Includes Sangerhausen property acquired after 30 June 2020
CROMWELL PROPERTY GROUP 21LDK Joint Venture – 50% interest
Indirect Property Investment Segment
Seniors Living opportunity
▪ 50% ownership interest in LDK Healthcare (LDK) which has two
operational villages (North Sydney and Canberra)
▪ The Landings, a 220 home Seniors village on the Upper North
Shore, Sydney, was acquired for $60 million in 2019 and adaptive
reuse of Greenway Views in Canberra continues
▪ Additional sites already identified for future growth
▪ Ongoing discussions with interested capital partners to scale-up
and establish a sizeable business over the medium term
Greenway Views, ACT
LDK Greenway Views Update
▪ Adaptive re-use of Tuggeranong Office Park to a planned >300
apartment, Seniors Living village continues
▪ Three blocks (of five planned) now complete, providing a total of
210 apartments available for sale as at end April
▪ One third (77) sold with deposits received for an additional 25, first
residents have moved in with care and meals being delivered
▪ No reported COVID-19 cases in either of the villages
Greenway Views, ACT
CROMWELL PROPERTY GROUP 22CPRF – 20 to 30% stake targeted post sell-down
Indirect Property Investment Segment
Commentary Key statistics1
▪ The portfolio contains six catchment-dominating shopping or Valuation
WALE WACR Assets Occupancy
convenience centres, plus a significant effective interest in a €452.1
seventh (Ursynow). All centres are anchored by significant
million 4.7 years 6.4% 6 94.8%
hypermarket/grocery, DIY and non-discretionary retail
▪ The Polish government temporarily suspended retail lease
agreements in March 2020 as part of its COVID-19 response plan. Valuation Details
Essential retail was deemed out of scope
Value Value
▪ Hypermarket/Grocery traded strongly throughout, underpinned by
(€m) (€m) Change WALE Occupancy
French grocery giant Auchan providing 30% of gross rent and all
Portfolio Dec 19 June 20 % (years) (%)
stores have now reopened
Janki, Warszawa 243.7 227.6 (6.6%) 4.3 91.2%
▪ June revaluations for all seven properties, conducted after
COVID-19 lockdown was lifted, resulted in 5.3% decrease in Korona, Wrocław 92.1 84.9 (7.9%) 6.7 100.0%
value. Assets with a larger proportion of hypermarket/grocery Ster, Szczecin 59.7 56.2 (6.0%) 5.2 99.5%
sales were comparatively less impacted Rondo, Bydgoszcz 57.1 54.9 (3.8%) 5.0 96.9%
▪ Cromwell will recommence its strategy to sell-down CPRF once Tulipan Łódź 16.3 15.6 (3.0%) 3.3 88.8%
the situation settles further
Kometa, Toruń 13.6 13.2 (3.3%) 6.1 100.0%
▪ Confidential discussions with a range of possible outcomes
ongoing on Ursynow. Update to be provided once they conclude Total 482.2 452.1 (6.2%) 4.7 94.8%
Ursynow, Warsaw 108.1 106.8 (1.2%) 4.4 89.7%
Total 590.3 558.9 (5.3%)
1. Statistics exclude equity accounted investment in Ursynow
CROMWELL PROPERTY GROUP 23Funds and Asset
Management Segment
CROMWELL PROPERTY GROUPSegment Profit up 43.2%
Funds and Asset Management Segment
Key Metrics Commentary Cromwell Funds Under Management
Significant investment
Wholesale
in people and
AUM FY20 profit processes,
$6.0 billion $30.1 million 78% of platform
underpinned by longer
term capital
Long term recurring
Retail
AUM FY20 profit revenue, high margins
and focus on quality
$2.2 billion $8.3 million retail investment
products
AUM reduced mainly by
$600 million sale of
AUM FY20 profit1 Northpoint Tower.
Total
Profit up 43.2% on the
$8.2 billion $40.8 million back of strong
transactional income in
first half
1. Includes asset management profit of $2.45 million
CROMWELL PROPERTY GROUP 25Europe - Foundations In Place
Funds and Asset Management Segment
European Funds Management Update European FUM by Region (€bn)
▪ €3.5 billion FUM with 78% underpinned by longer dated capital
▪ Total FY20 transactional activity of €0.6 billion in sales and €0.3 Italy
€ 0.4 € 0.6
billion in acquisitions (excl. CPRF) UK
€ 0.2
▪ Focus in last few months on select support packages for c.780 € 0.2 Benelux
tenant customers in 10 different countries Nordics
€ 1.0 CEE
▪ Successful pro-forma transactions include the DHL Logistics € 0.8
Germany
portfolio in Italy, Sangerhausen asset for CEREIT in Germany and
€ 0.3 France
The Joan, in the Netherlands with Goldman Sachs MBD
▪ Platform remains ready to scale to medium term target of €8 billion
FY20 Change in European FUM Evolution of European FUM1
€ 9.0 € 8.0
€ 8.0
€3.54 € 7.0
75%
€ 6.0
€ 5.0 € 3.9 € 3.8 € 3.5
€ 4.0 € 3.4
€ 3.0 78%
€ 2.0 49%
36%
€ 1.0
€- 0%
Jun-17 Jun-18 Jun-19 Jun-20 Medium term
target
European FUM ($B) % recurring FUM
CROMWELL PROPERTY GROUP 26Australia – Continued Investor Support for DPF
Funds and Asset Management Segment
▪ Retail Funds Management segment profit was $8.3 million and AUM was $2.2
billion ($2.3 billion FY19), slightly lower primarily due to lower equities markets
Cromwell Direct Property Fund (DPF)
▪ Withdrawal event associated with the end of DPF’s initial seven-year term
closed on 31 July 2020 with the next full withdrawal event due in July 2025
▪ Despite the ongoing impact of COVID-19, investors representing 90.1% of
issued capital elected to continue with their investment in DPF
Rand Distribution Centre, Direk
▪ Gross assets remain in excess of $400 million following the redemption and
performance since inception (August 2013) is 9.2% annualised (30 June 2020)
▪ The distribution is 7.25 cents per security per annum, paid monthly, equivalent
to a distribution yield of 5.9% based on unit price of $1.23 as at 30 June 2020
▪ The Fund has a 7.5 year weighted average lease expiry with 42% of income
sourced from government tenants
Cromwell Property Trust 12
▪ Post year end, contracts were exchanged on the Rand Distribution Centre in
Direk, South Australia for $63 million, a $10 million premium to book value
11 Farrer Place, Queanbeyan
CROMWELL PROPERTY GROUP 27New Zealand - Oyster Continues Growth
Funds and Asset Management Segment
▪ AUM at Oyster Group in New Zealand (50% interest) was up to NZ$2.0 billion
(FY19 NZ$1.7 billion)
Key activity during the year
▪ Syndicated Pastoral House, 25 The Terrace / 92 Lambton Quay in Wellington, Image
with offices 100% leased to the New Zealand Government on a 15-year lease
▪ Syndicated Home Straight Park, Te Rapa, Hamilton comprises 2.9 hectares
and three modern office buildings, with a net lettable area of 14,738 sqm.
▪ Both syndicates closed fully subscribed with 6% forecast pre-tax cash
distributions for their initial terms (March 2021 and March 2022 respectively) Pastoral House, Wellington
▪ Oyster Direct Property Fund is open providing exposure to diversified portfolio
of commercial property valued at NZ$686 million (as at 31 March 2020)
Home Straight Park, Hamilton
CROMWELL PROPERTY GROUP 28New Growth Opportunities To Expand Platform
Funds and Asset Management Segment
Cromwell European Logistics Fund Proposed Stratus Cromwell Data Cromwell Polish Retail Fund
Centres Fund
▪ Cromwell’s platform in Europe has ▪ Heads of Terms to partner with data ▪ Temporarily warehoused on balance sheet.
significant light industrial / logistics assets centres specialists EXS/Stratus Fund was being restructured as an
experience dating back to early 2000’s ▪ Cromwell to be a cornerstone investor in authorised investment fund pre COVID
▪ DHL logistics portfolio of seven assets proposed Fund which is targeting a ▪ Team in Poland have managed the assets
acquired for €52.5 million with IGIS gross asset value of US$1 billion+ with for over ten years and know them intimately
25% of the portfolio by value identified
▪ Assets may be used to seed Cromwell ▪ Assets have shown resiliency / defensive
European Logistics Fund focused on ▪ CEREIT has entered into Heads of nature throughout lockdown period
Core+ logistics assets throughout Terms to co-invest directly into 50%
stakes in the Fund’s first two data centre ▪ Fund is accretive, but will be offered to
Benelux, France, Germany and Italy
projects in London and Frankfurt, subject investors once transactional activity
▪ Target total Gross Asset Value of €400 to to various milestones resumes. Cromwell is targeting an eventual
€500 million (A$650 to A$800 million) 30% stake
CROMWELL PROPERTY GROUP 29Guidance
CROMWELL PROPERTY GROUPFY21 Distributions Maintained
Guidance
FY21 Distributions Maintained For further information please contact:
▪ Business well-positioned to continue to meet further COVID-19 risks with
45% of rental income from government entities, a strong balance sheet with Paul Weightman
liquidity, favourable debt profile and long WALE CEO / Managing Director
paul.weightman@cromwell.com.au
▪ Focus on continued execution of ‘Invest To Manage’ strategy including:
Phone: +61 7 3225 7720
1. Continue to optimise performance of Core portfolio
2. Continue to progress Core / Core+ c.$1.1bn development pipeline Michael Wilde
3. Execution of existing and new projects for LDK Chief Financial Officer
4. Continue growth in A/NZ and European funds platform michael.wilde@cromwell.com.au
Phone: +61 7 3225 7729
▪ Cromwell remains conscious of the pressure on securityholders who
rely on distributions during the pandemic Ross McGlade
Investor Relations Manager
▪ Guidance is subject to no material adverse change in market ross.mcglade@cromwell.com.au
conditions, unforeseen events or change in control or in strategy Phone: +61 2 8278 3613
▪ FY21 distribution guidance confirmed at 7.50 cps, a distribution yield of
8.20% based on a closing security price of $0.915 as at 26 August 2020
Investor Services Brisbane Office Sydney Office London Office Auckland Office Singapore Office
1300 276 693 Level 19, Level 14 7 Seymour Street Oyster Property Group 50 Collyer Quay
invest@cromwell.com.au 200 Mary Street 167 Macquarie Street London, W1H 7JW Level 2, 14 Normanby Road, #07-02 OUE Bayfront Singapore
www.cromwell.com.au Brisbane QLD 4000 Sydney NSW 2000 UK Auckland, New Zealand 049321
CROMWELL PROPERTY GROUP 31Proportional Offer
and EGM Update
CROMWELL PROPERTY GROUPARA's Takeover By Stealth
November 2019 AGM Majority of Cromwell securityholders REJECTED appointment of ARA nominee Gary Weiss
March 2020 EGM Majority of Cromwell securityholders AGAIN REJECTED appointment of ARA nominee Gary Weiss
ARA launches a proportional offer for SOME BUT NOT ALL of your securities
Proportional Offer Offer price significantly UNDERVALUES CROMWELL and offers NO PREMIUM for effective control
Cromwell Board recommends securityholders DO NOT ACCEPT ARA's Proportional Offer
ARA has called another EGM to nominate two new directors, including Gary Weiss for a third time
September 2020 EGM Cromwell Board recommends securityholders VOTE AGAINST ARA's nominations
1. STOP ARA’s takeover by stealth
Board 2. DO NOT ACCEPT ARA’s hostile, unsolicited and opportunistic Proportional Offer
Recommendation 3. VOTE AGAINST ARA’s board nominations
4. IGNORE all documents and forms from ARA
CROMWELL PROPERTY GROUP 33Reasons To Reject ARA’s Proportional Offer
#1 The Offer is an attempt to grab effective control of Cromwell from securityholders, without offering to acquire 100% of their stapled securities at a
price that the Cromwell Board believes is significantly below Cromwell's fundamental value
#2 Proportional Offer for only 29% of securityholders securities is highly opportunistic and significantly undervalues Cromwell
#3 Proportional Offer does not provide any premium for effective control of Cromwell
ARA Group has an extremely poor track record of managing other listed REITs, has outlined no clear future strategy for Cromwell, and its
#4
intentions may have severe adverse implications for securityholders remaining investment in Cromwell
#5 It is in securityholders interests to support Cromwell's current strategy versus being forced into an ongoing minority investment in an entity
effectively controlled by a competitor of Cromwell
#6 The Board knows Cromwell's business and is best placed to drive Cromwell’s future performance
#7 Accepting the Proportional Offer will have important implications for securityholders rights and remaining investment in Cromwell
CROMWELL PROPERTY GROUP 34TSR relative to benchmark indices1 (based on financial year performance)
Cromwell has consistently outperformed all ARA managed listed REITs relative to their
respective benchmarks over all key timeframes
71 %
13 %
4% 4% 0% 0% N/A N/A N/A
(14)% (7)%
(16)%
(32)% (30)% (26)% (29)%
(36)% (44)%
(63)%
(80)%
(129)%
Cromwell Prosperity REIT Fortune REIT Hui Xian REIT ARA LOGOS Logistics Suntec REIT ARA US Hospitality
Trust Trust
FY20 FY18-20 FY11-20
Source: Datastream as at 30 June 2020
1. Cromwell performance relative to the S&P / ASX A-REIT 200 Index, Fortune REIT, Prosperity REIT and Hui Xian REIT price performance relative to the FTSE EPRA NAREIT Hong Kong Index.
Suntec REIT, ARA Logos Logistics Trust and ARA US Hospitality Trust price performance relative to the FTSE EPRA NAREIT Singapore Index.
CROMWELL PROPERTY GROUP 35Appendices
CROMWELL PROPERTY GROUPAppendices
Contents
38 Cromwell Property Group Statistics
39–41 Economic and Real Estate Markets Overview
42 FY20 Operating and Statutory Profit Reconciliation
43 Segment Result - Operating Earnings Detail
44 Balance Sheet
45 Property Portfolio - Top 10 Assets
46 Property Portfolio - Top 20 Leases
47-48 Property Portfolio - Net Property Income
49 Property Portfolio - Movement in Book Value
50 Property Portfolio - Debt Platform Facility Details
CROMWELL PROPERTY GROUP 37Cromwell Property Group Statistics
Appendix: All group statistics as at 30 June 2020
BroadPortfolio
and Deep Property Platform Geographic and Culturally Diverse Team Global Portfolio by Sector and Geography
AUM by Sector
$ 11.5bn 2.8%
3.3%
AUM
460+ 12.2% Office
Retail
people
15.5% Industrial / Logistics
225 66.2%
Other
Property Securities
properties
14
countries
AUM by Geography
3.4m+ 7.9%
sqm
29 Europe
offices
50.1% Australia
3,000+ 42.0%
New Zealand
tenant
customers
CROMWELL PROPERTY GROUP 38Global Economic Growth Negative
Appendix
Global Economic Growth 2021 (Select) Forecast GDP Growth Rates
12.0
▪ 2020 was originally seen as a ‘go slow’ year with global GDP
10.0
growth, before COVID-19, forecast to be just 2.5%
8.0
▪ All major G7 economies now showing recessionary statistics with 6.0
%
a minimum of two quarters of consecutive negative growth likely 4.0
▪ Australian economy is forecast to contract around 10% for the first 2.0
half of 2020 with any subsequent recovery impacted by ongoing 0.0
social distancing and household and business confidence
▪ Eurozone GDP fell by a historic 12.1% in Q2, as was largely
anticipated, driven by the impact of lockdowns Source: Oxford Economics
Australian Quarterly GDP Growth Rate
▪ Given the differences in policy responses Eurozone recovery will
be uneven across the region - GDP is expected to contract 7.8%
this year before a material pick-up to 6.4% growth in 2021
▪ Central European countries including Poland, are expected to
continue to out-perform their western European counterparts
▪ €1.1 trillion European Commission recovery plan marks a material
improvement for the region’s medium-term growth outlook and
should help offset the differences in domestic fiscal responses
Source: Oxford Economics Source: Trading Economics.com, Australian Bureau of statistics
CROMWELL PROPERTY GROUP 39Australian Real Estate Snapshot
Appendix
Australian CBD Office Markets Total Australian CBD Office Vacancy (%)
▪ Australian CBD’s still being impacted by COVID-19 with 20.0% 18.4%
Melbourne in lockdown and Sydney and Brisbane CBD offices 14.2%
15.0% 12.9%
operating at reduced capacity 10.1%
9.2%
10.0%
▪ CBD Office market vacancy has increased from 8.0% to 9.2% with 5.6% 5.8%
effectively no net absorption in the last six months 5.0%
▪ Sydney CBD and Melbourne CBD office markets have vacancy 0.0%
Sydney Melbourne Canberra Brisbane Perth CBD Adelaide Australian
rates of 5.6% and 5.8% respectively, all other CBD markets are in CBD CBD CBD CBD CBD Office
double digits (3.9% and 3.2% Jan 2020) Source: PCA
▪ 300,000 sqm of stock has been added in last 12 months with Future Supply of CBD Markets
another 390,000 sqm due by December mostly in Melbourne, with 600,000
2020 2021 2022+
a further 350,000 due in 2021 500,000
400,000
▪ Office, where supported by government authorities continues to be
300,000
SQM
in demand, industrial / logistics sector yields are also expected to
200,000
stay tight while retail remains out of favour
100,000
0
Melbourne Sydney CBD Brisbane Canberra Adelaide Perth CBD
CBD CBD CBD
Source: PCA
CROMWELL PROPERTY GROUP 40European Real Estate Snapshot
Appendix
European Commercial Real Estate Markets Investment volumes by sector
400
▪ Gateway cities continue to perform well, targeted by international 350
capital, which accounts for 40% of all deals 300
▪ European property investment volumes reached €50.5 billion in Q2 250
Euro Billion
2020. Office accounts for 29% of total investment volume, down 200
150
from the 43% in Q1 2020 as residential fills the gap (39%)
100
▪ Germany, the United Kingdom and France account for 58% of all 50
deals in H1 2020, on par with H2 2019 and up by 4.5% from trading 0
volumes recorded in H1 2019 2007 2008 2009 2010 2011 2012 2013 2014 2015 2016 2017 2018 2019 H1
Office Industrial Retail Hotel Apartment Other 2020
Sectors Investment volumes by country
▪ Office: The strong positive office rental growth seen in recent years Belgium (2%)
Denmark (3%) Finland (2%)
has slowed and incentives are likely to increase, especially in older Italy (3%)
Germany (27%)
stock, as tenants and landlords assess their corporate options Spain (4%)
▪ Logistics: Assets continue to be popular as more demand is
Netherlands (6%)
channelled through online shopping and e-commerce Sweden (7%)
▪ Retail: Supermarkets and grocery stores provide essential product
and are seeing rising trade figures as they remain open France (12%)
United Kingdom
▪ Data centres: Levels of interest rise as working remotely becomes (18%)
more popular. Frankfurt, London, Amsterdam, and Paris likely to
see around 200MW of colocation take-up, equalling 2019’s record
Source: Real Capital Analytics – data as at 30 July 2020.
CROMWELL PROPERTY GROUP 41FY20 Operating and Statutory Profit Reconciliation
Appendix
FY20 ($M) FY19 ($M)
Profit from operations 221.2 174.2
Operating EPS (cents per security) 8.50 cps 8.21 cps
Gain on sale of investment properties 3.3 0.7
Loss on disposal of other assets (3.6) (0.3)
Other transaction costs (23.4) (2.9)
Operating lease costs 3.1 -
Fair value net gains / (write-downs) Investment properties 17.5 86.4
Derivative financial instruments 18.4 (10.5)
Investments at fair value through profit or loss (4.3) (9.2)
Non-cash property investment income / (expense) Straight-line lease income 9.7 9.3
Lease incentive amortisation (25.7) (18.8)
Lease cost amortisation (3.5) (2.0)
Other non-cash expenses: Amortisation of loan transaction costs (10.0) (7.8)
Finance costs attributable to lease incentives (0.8) -
Net exchange gains / (loss) on foreign currency borrowings (1.8) (12.7)
Costs in relation to asset classified as held for sale - (35.3)
Net increase / (decrease) in recoverable amounts (4.3) (0.4)
Amortisation and depreciation, net of deferred tax expense1 (7.4) (2.4)
Relating to equity accounted investments2 (14.8) 1.6
Net foreign exchange gains / (losses) (3.0) (3.0)
Restructure costs - 0.3
Net tax losses incurred / (utilised)3 10.5 (7.3)
Profit for the year 181.1 159.9
Statutory EPS (cents per security) 6.96 cps 7.53 cps
1. Comprises depreciation of plant and equipment and right-of-use assets and amortisation of intangible assets
2. Comprises fair value adjustments and other non-operating items included in share of profit of equity accounted entities
3. Comprises tax expense attributable to changes in deferred tax assets recognised as a result of carried forward tax losses
CROMWELL PROPERTY GROUP 42Segment Results – Operating Earnings Detail
Appendix
Direct Property Indirect Property Funds And Asset
Full Year ending 30 June 2020 Investment Investment Management
($M) ($M) ($M) FY20
Segment revenue
Rental income and recoverable outgoings 228.9 40.9 - 269.8
Operating profits of equity accounted investments - 51.4 2.9 54.3
Development sales and fees1 32.0 - - 32.0
Funds and asset management fees - - 132.9 132.9
Distributions - 2.0 - 2.0
Total segment revenue and other income 260.9 94.3 135.8 491.0
Segment expenses
Property expenses (45.2) (17.4) - (62.6)
Funds and asset management direct costs - (3.4) (80.8) (84.2)
Other expenses (1.2) (5.1) (10.6) (16.9)
Total segment expenses (46.4) (25.9) (91.4) (163.7)
EBITDA 214.5 68.4 44.4 327.3
Finance costs (42.3) (12.5) (3.6) (58.4)
Segment profit after finance costs 172.2 55.9 40.8 268.9
Unallocated items
Finance income 5.8
Corporate costs2 (39.2)
Income tax expense (14.3)
Segment profit 221.2
Weighted Average Securities on Issue ('000) 2,600.4
1. In accordance with the relevant accounting policy, the development revenue of $32.0 million has been recognised due to the performance obligations inherent in the relevant contract being fully satisfied during the period
2. Includes non-segment specific corporate costs pertaining to Group level functions such as finance and tax, legal, risk and compliance, corporate secretarial, marketing and other corporate services
CROMWELL PROPERTY GROUP 43Balance Sheet
Appendix
FY20 ($M) FY19 ($M)
Cash and Cash Equivalents 194.1 101.6
Investment Property 3,708.5 2,520.9
Investment Property held for sale 44.0 -
Equity accounted investments held for sale 49.8 -
Equity accounted investments 668.2 814.5
Receivables 251.3 194.2
Intangibles 7.6 4.5
Investments at fair value 12.9 22.6
Other assets 54.1 37.4
Total assets 4,990.5 3,695.7
Interest bearing liabilities (2,191.2) (1,356.4)
Derivative financial instruments (19.3) (37.1)
Distribution payable (49.0) (40.5)
Payables (111.1) (60.3)
Other liabilities (30.9) (18.4)
Total liabilities (2,401.5) (1,512.7)
Net assets 2,589.0 2,183.0
Securities on issue 2,612.9 2,236.6
NTA per security (excl. interest rate swaps) $0.99 $0.97
1
Gearing 41.6% 35.0%
Gearing (look-through)1 47.5% 42.3%
1. Gearing calculated as (total borrowings less cash)/(total tangible assets less cash). Look through gearing adjusts for the 30.7% interest in CEREIT, 94% interest in Ursynow, 28% interest in Portgate, 50% interest in Oyster and 50% interest in LDK
CROMWELL PROPERTY GROUP 44Top 10 Assets1
Appendix
Current
Market Value Occupancy %
Asset State Class ($M) Cap Rate by NLA WALE Major Tenants
400 George Street QLD Office 525.0 5.38% 96.6% 4.4 years QLD Government, Federal Government
Qantas HQ NSW Office 520.0 5.25% 100.0% 11.3 years Qantas Airways Limited
700 Collins Street VIC Office 337.0 5.00% 99.8% 5.3 years Bureau of Meteorology, Metro Trains
McKell Building NSW Office 300.0 5.00% 100.0% 8.0 years NSW State Government
Kent Street, Sydney NSW Office 297.0 6.25% 100.0% 3.6 years Symantec, Mann Judd, Leap Software
Soward Way ACT Office 290.0 5.00% 100.0% 12.2 years Federal Government
HQ North Tower QLD Office 242.0 6.00% 98.5% 4.6 years AECOM, TechnologyOne, CS Energy
2
Victoria Avenue NSW Office 120.0 5.84% 93.9% 2.8 years Reed Elsevier, Leighton Contractors, Ventia
200 Mary Street QLD Office 96.0 6.25% 96.8% 2.1 years Secure Parking, Cromwell, Logicamms
Station Street, Penrith NSW Office 51.0 6.25% 100.0% 8.0 years NSW State Government
Total Top 10 Assets 2,778.0 5.44% 98.6% 6.6 years
Balance of Portfolio 227.5 5.91% 69.0% 3.6 years
Total 3,005.5 5.57% 90.9% 6.2 years
1. Relating to Australian balance sheet properties only
2. 50% interest
CROMWELL PROPERTY GROUP 45Top 20 Leases1
Appendix
Tenant Tenant Classification Expiry Date % of Portfolio Rental Income
Qantas Airways Limited Listed Company/Subsidiary Dec-32 15.1%
Commonwealth of Australia (Dept of Social Services) Government Authority Sep-32 8.4%
QLD State Government Government Authority Dec-26 8.2%
Government Property NSW Government Authority Jun-28 7.3%
Bureau of Meteorology Government Authority Jul-26 4.2%
Therapeutic Goods Administration Government Authority Jun-22 3.9%
Commonwealth of Australia (Dept of Human Services) Government Authority Sep-21 3.8%
TechnologyOne Limited Listed Company/Subsidiary Apr-26 3.5%
AECOM Australia Pty Ltd Listed Company/Subsidiary Sep-25 3.5%
Metro Trains Melbourne Pty Ltd Private Company Feb-25 3.0%
Ministry for Health and Wellbeing Government Authority Sep-20 2.5%
Symantec (Australia) Pty Ltd Listed Company/Subsidiary Jul-21 2.0%
CGW Nominees Private Company Sep-24 1.9%
Government Property NSW Government Authority Jun-28 1.8%
Government Property NSW Government Authority Jun-28 1.7%
Government Property NSW Government Authority Jun-28 1.3%
Reed Elsevier Australia Pty Limited Listed Company/Subsidiary Dec-20 1.2%
Mann Judd Administration Pty Ltd Private Company 31-Dec-22 1.2%
CS Energy Limited Government Authority 30-Jun-23 0.9%
Village Cinemas Australia Listed Company/Subsidiary 15-Mar-25 0.9%
76.3%
1. Relating to Australian balance sheet properties only
CROMWELL PROPERTY GROUP 46Net Property Income
Appendix
FY20 ($M) FY19 ($M) Variance ($M) Variance (%)
McKell Building 13.5 12.2 1.3 10.3%
Station Street, Penrith 2.9 2.7 0.2 9.8%
700 Collins Street 17.0 16.4 0.6 3.7%
Bull Street, Newcastle 1.8 1.7 0.1 3.5%
Qantas HQ 30.0 29.0 1.0 3.4%
HQ North Tower 16.4 16.0 0.4 2.5%
Soward Way, Greenway 15.4 15.3 0.1 0.8%
Crown Street, Wollongong 2.8 2.8 - (0.1%)
Village Cinema Geelong 1.3 1.5 (0.2) (10.6%)
Core Total 101.1 97.6 3.5 3.6%
Oracle Building 2.6 2.1 0.5 21.7%
200 Mary Street 7.4 6.9 0.5 7.2%
Kent Street, Sydney 16.3 15.4 0.9 5.9%
TGA Complex 7.4 7.2 0.2 2.8%
Regent Cinema 1.1 1.3 (0.2) (15.8%)
Core+ Total 34.8 32.9 1.9 5.6%
Tuggeranong Office Park - Car Park (0.7) (0.7) - 8.4%
19 National Circuit 0.9 2.5 (1.6) (63.4%)
Active Total 0.2 1.8 (1.6) (88.9%)
TOTAL HELD PROPERTIES1 136.1 132.3 3.8 2.9%
1. Includes only balance sheet properties held for all of FY20 and FY19
CROMWELL PROPERTY GROUP 47Net Property Income
Appendix
FY20 ($M) FY19 ($M) Variance ($M) Variance (%)
ACQUISITIONS / DISPOSALS
Cromwell Polish Retail Fund 23.5 - 23.5 N/A
George Street, Brisbane 25.1 - 25.1 N/A
Borrowdale House (0.1) (0.1) N/A N/A
1
Victoria Avenue 11.7 13.0 (1.3) (10.0%)
Wakefield St, Adelaide 11.4 18.2 (6.8) (37.4%)
Farrer Place, Queanbeyan (0.7) 2.1 (1.3) (64.6%)
Tuggeranong Office Park - 3.2 (3.2) (99.9%)
Lovett Tower (0.6) 1.5 (2.1) (139.8%)
Acquisition / Disposals Total 71.7 37.9 33.8 89.2%
Car Parking / Mary St Hub 0.5 0.9 (0.4) (44.4%)
Consolidation adjustments / eliminations 7.8 4.9 2.9 59.2%
Other Total 8.3 5.8 2.5 43.1%
TOTAL NET PROPERTY INCOME 216.1 176.0 40.1 22.8%
1. Reflects 50% Sale in May 2020
CROMWELL PROPERTY GROUP 48Movement In Book Value
Appendix
▪ Strategy of continuously improving portfolio through acquisitions since 2010
▪ In-sourced facilities management model also lowers lifecycle capex
FY20 FY19 FY18 FY17 FY16 FY15 FY14 FY13 FY12 FY11 FY10
($M) ($M) ($M) ($M) ($M) ($M) ($M) ($M) ($M) ($M) ($M)
Opening balance 2,520.9 2,451.1 2,357.8 2,274.0 2,101.0 2,249.5 2,396.0 1,724.4 1,444.9 1,064.1 1,117.2
Acquisitions1 1,286.0 - 51.8 - - 8.0 - 661.3 263.4 322.4 -
Construction costs 0.2 - 13.6 92.3 47.2 - - - - - -
Finance costs capitalised 0.1 - 1.1 4.4 - - - - - - -
Property Improvements 13.4 21.9 6.7 9.2 2.1 16.5 44.5 76.3 50.2 40.4 1.3
Lifecycle Capex 0.7 1.9 2.5 3.0 2.6 6.8 6.8 6.3 2.6 3.0 2.2
Disposals (150.8) (54.5) (89.3) (87.1) (150.9) (205.8) (250.0) (42.4) (39.3) (33.7) (22.1)
Transferred to held for sale - - (0.9) (69.5) - (36.6) - - - - -
Straight line lease income 9.7 9.3 27.8 3.6 2.3 5.5 5.6 6.0 6.9 4.9 0.8
Lease costs and incentives 68.6 25.6 22.1 22.8 21.7 37.7 11.9 29.3 15.8 15.9 2.2
Amortisation of leasing costs and incentives2 (29.2) (20.8) (19.5) (19.9) (15.2) (13.0) (11.6) (9.5) (7.7) (5.8) (5.4)
Net gain/(loss) from fair value adjustments 17.5 86.4 77.4 125.0 263.2 32.4 46.3 (55.7) (12.4) 33.7 (32.1)
Net foreign exchange loss 15.2
Closing Balance 3,752.3 2,520.9 2,451.1 2,357.8 2,274.0 2,101.0 2,249.5 2,396.0 1,724.4 1,444.9 1,064.1
Lifecycle Capex as a % on average assets 0.02% 0.08% 0.10% 0.13% 0.12% 0.31% 0.29% 0.31% 0.16% 0.24% 0.20%
1. Includes right-of-use assets acquired as a component of the Polish portfolio
2. Pertains to the amortisation of lease costs, lease incentive costs and right-of-use assets
CROMWELL PROPERTY GROUP 49Balance Sheet Debt Details
Appendix
Drawn Commitment Maturity Fin Yr Years
Facility Covenants
(AUD $M) (AUD $M) Date Expiry Remaining
Jun-2023
Bank 1 - 5 Year Facility 100.0 100.0 2023 3.0
Bank 2 - 5 Year Facility - 250.0 Jun-2023 2023 3.0
Bank 3 - 5 Year Facility 168.0 250.0 Jun-2023 2023 3.0
Bank 4 - 5 Year Facility 150.0 150.0 Jun-2023 2023 3.0
Bank 5 - 5 Year Facility 200.0 200.0 Jun-2024 2024 4.0
Bank 6 - 5 Year Facility 100.0 100.0 Jun-2023 2023 3.0
LVR 60%
Bank 7 - 5 Year Facility 75.0 75.0 Jun-2023 2023 3.0
ICR 2.0 x
Bank 8 - 5 Year Facility 50.0 50.0 Jun-2023 2023 3.0 WALE 3.0 yrs
Bank 9 - 5 Year Facility 125.0 125.0 Jun-2023 2023 3.0
Bank 10 - 7 Year Facility 60.0 60.0 Jun-2026 2026 6.0
Bank 11 - 4 Year Facility - 50.0 Mar-2024 2024 3.7
Bank 11 – 5 Year Facility - 50.0 Mar-2025 2025 4.7
Syndicated Debt Platform 1,028.0 1,460.0 3.4 yrs
Euro Syndicated Facility 368.2 368.2 Sept-2022 2023 2.2 yrs Gearing ratio 65%; ICR 2.0 x
International Bank 168.4 168.4 Mar-2022 2022 1.7
International Bank 182.6 182.6 Feb-2023 2023 2.6 LTV 60%; DSCR 220%
CPRF Facilities 351.0 351.0 2.2 yrs
Euro - 3 Year Facility 7.6 7.6 May 2022 2022 1.9 yrs LVR 60%; ICR 2.0 x; LTC 50% until PC
2025 Convertible Bond 360.2 360.2 Mar-2025 2025 4.7 yrs
Multiple Banks 72.2 113.1 Apr-2025 2025 4.8 yrs LTV 65%; ICR 1.5 x
TOTAL 2,187.2 2,660.1 3.2 yrs
CROMWELL PROPERTY GROUP 50CROMWELL PROPERTY GROUP
You can also read