Q2 2019 Earnings Conference Call - NASDAQ: EQIX - Equinix Investor ...
←
→
Page content transcription
If your browser does not render page correctly, please read the page content below
Q2 2019 Earnings
                                                    Conference Call
                                                         NASDAQ: EQIX

                                                        Presented on July   31, 2019

Confidential – © 2019 Equinix Inc.   Equinix.com                                       1
Public Disclosure Statement
    Forward-Looking Statements
                Except for historical information, this presentation contains forward-looking statements, which include words such as “believe,”
                “anticipate,” and “expect.” These forward-looking statements involve risks and uncertainties that may cause Equinix’s actual results to
                differ materially from those expressed or implied by these statements. Factors that may affect Equinix’s results are summarized in our
                annual report on Form 10-K filed on February 22, 2019 and our quarterly report on Form 10-Q filed on May 3, 2019.

    Non-GAAP Information
                This presentation contains references to certain non-GAAP financial measures. For definitions of terms including, but not limited to,
                “Cash Gross Profit,” “Cash Gross Margins,” “Cash SG&A,” “Adjusted EBITDA,” “Funds From Operations,” “Adjusted Funds From
                Operations,” and “Adjusted Net Operating Income,” and a detailed reconciliation between the non-GAAP financial results presented in
                this presentation and the corresponding GAAP measures, please refer to the supplemental data and the appendix of this presentation.

Confidential – © 2019 Equinix Inc.                                          Equinix.com                                                                   2
(1)
Q2 2019 Financial Highlights
Revenues Recurring Revenues Non-recurring Revenues
$1,385 Revenues Growth
Q2 19
$1,310 $1,363 QoQ YoY
($M) $1,262 $1,284
As-reported 2% 10%
Normalized and (2)
2% 10%
$1,208 $1,230 $1,275 $1,306 Constant Currency
$1,188
(2)
Normalized MRR 2% 10%
Q2 18 Q3 18 Q4 18 Q1 19 Q2 19 Adjusted EBITDA Q2 19
Growth QoQ YoY
Adjusted EBITDA & AFFO Adjusted EBITDA AFFO AFFO per Share (Diluted)
As-reported 3% 12%
$5.37 $5.01 $5.13 $5.95 $5.87
$660 $677 Adjusted EBITDA Normalized and (2)
$604 $613 $617 3% 12%
margin of 48.9% Constant Currency
or 49.1%
excluding
Q2 19
integration costs AFFO Growth
QoQ YoY
$428
$488 $498 As-reported 2% 16%
$402 $414
Normalized and (2) (3)
Flat 14%
Constant Currency
Q2 18 Q3 18 Q4 18 Q1 19 Q2 19
Delivered our 66th quarter of consecutive revenue growth, derived from record bookings in the first half of 2019 and healthy
interconnection activity benefiting from our global reach and interconnected ecosystems
(1) Q2 19 results include the impact of the acquisition of Switch Datacenter’s AMS1 in Amsterdam “AM11”, which closed on April 18, 2019
(2) Revenues and adjusted EBITDA normalized for acquisitions, integration costs related to acquisitions and other adjustments. Normalized MRR excludes non-recurring revenues. AFFO also normalized for the incremental net interest expense related to
acquisition financing and one-time other gains and losses. Constant currency assumes average currency rates used in our financial results remained the same over comparative periods and removes the impact of one-time gains or losses related to balance
sheet remeasurements
(3) AFFO normalized and constant currency growth includes QoQ step-up in recurring capex as expected
Confidential – © 2019 Equinix Inc. Equinix.com 3
Q2 2019 Consolidated Results
                                                                  ($M Except for AFFO per Share and                                                  Q2 19
                                                                        Non-Financial Metrics)                         Guidance            Actual              QoQ                YoY
                                                                          (1)
                                                             Revenues                                               $1,381 - 1,391              $1,385          2%                10%

                                                             Cash Gross Profit                                                                    $924          1%                10%

                                                             Cash Gross Margin %                                       65 -66%                  66.7%

                                                             Cash SG&A                                                                            $247          -3%               5%

                                                             Cash SG&A %                                               18 - 19%                 17.8%

                                                             Adjusted EBITDA (2)                                       $649 - 659                 $677          3%                12%

                                                             Adjusted EBITDA Margin %                                   ~47.2%                  48.9%

                                                             Net Incom e                                                                          $144         22%               112%

                                                             Net Income Margin %                                                                10.4%

                                                             Adjusted Funds from Operations (AFFO)                                                $498          2%                16%

                                                             AFFO per Share (Diluted)                                                            $5.87          -1%               9%

                                                             Recurring Capital Expenditures                             $37 - 47                    $37        75%               -13%

                                                             Cabs Billing                                                                     232,400           2%                14%

                                                             MRR per Cab (3)                                                                    $1,830          1%                -1%

                                                             Total Interconnections                                                           348,000           2%                16%

(1)   Q2 19 Actual includes a minimal foreign currency impact when compared to Q1 19 average FX rates and a negative foreign currency impact of approximately $1 million when compared to our prior FX guidance rates, including the net effect from our hedging
      transactions
(2)   Q2 19 Actual includes a minimal foreign currency impact when compared to Q1 19 average FX rates and to our prior FX guidance rates, including the net effect from our hedging transactions
(3)   MRR per Cab excludes AM11, Bit-isle MIS, Brazil, Colombia and Infomart non-IBX tenant income. MRR per Cab up $8 QoQ on a constant currency basis. Constant currency basis assumes average currency rates used in our financial results remained the
      same over comparative periods. YoY MRR per Cab step-down due to the negative impact of ~$40 from the inclusion of IL2, Itconic and Metronode in the non-financial metrics beginning in Q4 18

Confidential – © 2019 Equinix Inc.                                                                                       Equinix.com                                                                                                                          4
Americas Performance
      Revenues                                                                                                      Includes $8M
                                                                                                                    of lower NRR                                                                        Q2 19
($M)                             $626                   $638                  $644                  $644                 QoQ                                Revenues Growth
            $618                                                                                                                                                                                QoQ               YoY

                                                                                                                                                            As-reported                         Flat               4%

                                                                                                                                                            Normalized and (1)
                                                                                                                                                                                                Flat               5%
                                                                                                                                                            Constant Currency
                                                                                                                                                                                     (1)
                                                                                                                                                            Normalized MRR                       2%                5%

                                                                                                                                                             Adjusted EBITDA                            Q2 19
           Q2 18                 Q3 18                 Q4 18                 Q1 19                 Q2 19                                                         Growth                         QoQ               YoY
                                                                                      Adjusted EBITDA Margin
      Adjusted EBITDA                                       Adjusted EBITDA
                                                                                                                                                            As-reported                         Flat               5%
                                                                               $308                   $309
           $294                   $296                  $302                                                                                                Normalized and (1)
                                                                                                                                                                                                 1%                4%
                                                                                                                                                            Constant Currency

          47.5%                  47.3%                  47.4%                 47.8%                  48.0%

                                                                                                                                                                                                                            (2)
                                                                                                                               Cross-connects Cabs Billing                                       MRR per Cab                        Utilization
                                                                                                                                    149,600                         83,600                           $2,387                             77%
                                                                                                                                        1% QoQ                         1% QoQ               As-reported and constant
                                                                                                                                                                                              currency QoQ $12
          Q2 18                  Q3 18                  Q4 18                 Q1 19                  Q2 19
(1)   Constant currency assumes average currency rates used in our financial results remained the same over comparative periods. Normalized for Infomart, integration costs related to acquisitions and other adjustments. Normalized MRR excludes non-recurring
      revenues
(2)   MRR per Cab excludes Brazil, Colombia and Infomart non-IBX tenant income

Confidential – © 2019 Equinix Inc.                                                                                      Equinix.com                                                                                                                          5
EMEA Performance
      Revenues                                                                                            $450
                                                                                  $435                                                                     Revenues                                    Q2 19
      ($M)                                                 $403
               $383                  $397                                                                                                                  Growth                                QoQ             YoY

                                                                                                                                                           As-reported                            3%            17%

                                                                                                                                                           Normalized and (1)
                                                                                                                                                                                                  3%            15%
                                                                                                                                                           Constant Currency
                                                                                                                                                                                    (1)
                                                                                                                                                           Normalized MRR                         3%            13%

                                                                                                                                                            Adjusted EBITDA                            Q2 19
                                                                                                                                                                Growth                           QoQ             YoY
              Q2 18                 Q3 18                  Q4 18                  Q1 19                 Q2 19
                                                                                                                                                           As-reported                            5%            23%
      Adjusted EBITDA                                     Adjusted EBITDA              Adjusted EBITDA Margin
                                                                                                         $210                                              Normalized and (1)
                                                                                  $199                                                                                                            5%            19%
                                                           $181                                                                                            Constant Currency
             $171                   $180

                                                                                                         46.6%                                               (2)                          (2)                             (2) (3)                   (2)
             44.6%                  45.3%                  45.0%                  45.8%                                        Cross-connects Cabs Billing                                        MRR per Cab                       Utilization
                                                                                                                                    119,900                         99,600                          $1,413                            83%
                                                                                                                                        2% QoQ                         2% QoQ                   As-reported QoQ         $17
                                                                                                                                                                                            Constant Currency QoQ
                                                                                                                                                                                                      $4
             Q2 18                  Q3 18                  Q4 18                  Q1 19                  Q2 19
(1)   Constant currency assumes average currency rates used in our financial results remained the same over comparative periods. Normalized for integration costs related to acquisitions and other adjustments. Normalized MRR excludes non-recurring revenues
(2)   Non-financial metrics exclude AM11
(3)   Constant currency assumes average currency rates used in our financial results remained the same over comparative periods

Confidential – © 2019 Equinix Inc.                                                                                     Equinix.com                                                                                                                         6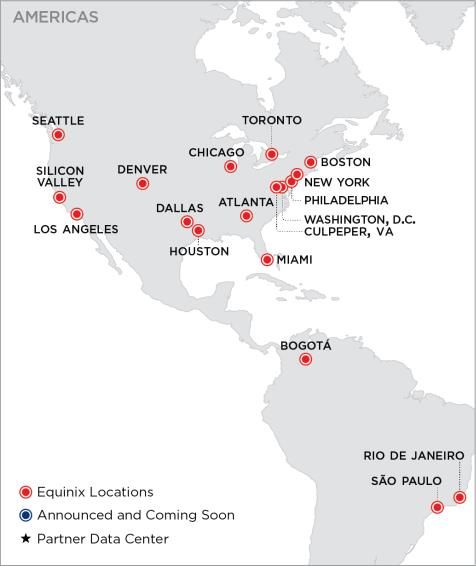
Asia-Pacific Performance
       Revenues                                                                                                                                              Revenues                                   Q2 19
                                                                                    $284                     $291
      ($M)
              $261                   $261                    $269                                                                                            Growth                             QoQ                YoY

                                                                                                                                                             As-reported                         2%               12%

                                                                                                                                                             Normalized and (1)
                                                                                                                                                                                                 3%               14%
                                                                                                                                                             Constant Currency
                                                                                                                                                                                      (1)
                                                                                                                                                             Normalized MRR                      3%               17%

                                                                                                                                                              Adjusted EBITDA                           Q2 19
             Q2 18                   Q3 18                   Q4 18                  Q1 19                   Q2 19                                                 Growth                         QoQ               YoY

       Adjusted EBITDA                                        Adjusted EBITDA               Adjusted EBITDA Margin                                           As-reported                         3%               14%

                                                                                                                                                             Normalized and (1)
                                                                                     $153                    $158                                                                                4%               18%
                                                                                                                                                             Constant Currency
              $139                   $137
                                                             $133

                                                                                                                                                                                                                              (2)
            53.4%                   52.3%                   49.6%
                                                                                    53.9%                  54.5%                 Cross-connects Cabs Billing                                        MRR per Cab                     Utilization
                                                                                                                                       59,500                         49,200                            $1,784                          82%
                                                                                                                                          2% QoQ                         2% QoQ                 As-reported QoQ              $16
                                                                                                                                                                                                Constant Currency QoQ
                                                                                                                                                                                                         $24
             Q2 18                   Q3 18                   Q4 18                  Q1 19                   Q2 19

(1)   Constant currency assumes average currency rates used in our financial results remained the same over comparative periods. Normalized for Metronode, integration costs related to acquisitions and other adjustments. Normalized MRR excludes non-recurring
      revenues
(2)   MRR per Cab excludes Bit-isle MIS. Constant currency assumes average currency rates used in our financial results remained the same over comparative periods

 Confidential – © 2019 Equinix Inc.                                                                                      Equinix.com                                                                                                                         7
Capital Structure
        ~$350M ATM proceeds and Fitch credit rating upgrade to investment grade (BBB-)
                                                                                                                                                               Q2’19 Financing Activity
                                                                                                                                                                  •   Raised net proceeds of $348M
        As-reported ($M)                                                     Q1 19           Q2 19                         Net Leverage Ratio                         under the ATM program at ~$485
                                                                                                                           (Target 3.0x – 4.0x)                       per share
                                                                   (1)
        Bank Debt, Senior Notes and Mortgages                            $     9,799     $     9,670                               3.4x                           •   Paid first tranche of Infomart notes
        Finance Lease Obligations                                        $     1,222     $     1,202                                                  (3)             of $150M in April
                                                                                                                         Blended Borrowing Rate
        Total Debt                                                       $ 11,022        $ 10,872
                                                                                                                                                               Ratings Update
        Less: Cash & Investments
                                           (2)
                                                                         $     1,648     $     1,631                             4.11%
        Net Debt                                                         $     9,374     $     9,241                                          (3)                 •   Corporate credit rating upgraded by
                                                                                                                             Unsecured Debt
                                                                                                                                                                      Fitch to investment grade, making
        Market Value of Equity                                           $ 38,097        $ 42,773
                                                                                                                                   99%                                Equinix index-eligible as an
        Enterprise Value                                                 $ 47,471        $ 52,014                                               (3)                   investment grade issuer with two IG
                                                                                                                            Fixed vs Floating                         ratings
        Net Debt / Market Value of Equity                                        25%             22%                        87% vs 13%                                      Rating
                                                                                                                                                            Agency                         Date of Upgrade
        Net Debt / Enterprise Value                                              20%             18%                        Revolving Facility                              (Outlook)
                                                                                                                                                                            BBB-
        Net Debt / LQA Adjusted EBITDA                                           3.6x            3.4x                              $2B                      S&P
                                                                                                                                                                            (Stable)
                                                                                                                                                                                           February 26, 2019

                                                                                                                                                                            BBB-           July 1, 2019
                                                                                                                                                            Fitch
                                                                                                                                                                            (Stable)

                                                                                                                                                                            Ba2
                                                                                                                                                            Moody’s                        March 25, 2019
  (1)    Principal balances outstanding as of each reporting period                                                                                                         (Stable)
  (2)    Includes cash, cash equivalents and short-term investments but excludes restricted cash
  (3)    Excludes finance leases and interest savings associated with the $750M cross-currency swaps executed in Q1 19

Confidential – © 2019 Equinix Inc.                                                                                       Equinix.com                                                                           8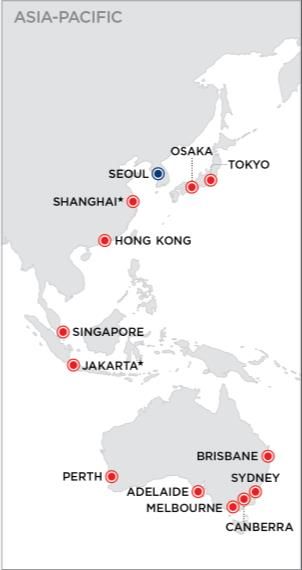
Capital Expenditures
    Recurring Capital Expenditures
                                                              5.4%

                                       4.3%
($M)                                                          $70                                                                    • Recurring capital expenditures typically
           3.3%                                               13%                                                                      trend between 3 and 5% of revenues,
                                       $55                                                                   2.7%
                                       13%
                                                              18%                                                                      annually
           $42                                                                       1.5%
           15%                         24%                                                                    $37
                                                                                                                                     • Maintenance capital expenditures can vary
           12%                                                                                                   18%
                                                              70%                  $21                     12%                         by quarter based on maintenance schedules
           73%                         63%
                                                                                27%
                                                                                      21%                                              and payment terms
                                                                                                             70%
                                                                                  52%
          Q2 18                        Q3 18                 Q4 18                  Q1 19                    Q2 19

                        Installation      Sustaining IT & Network     Maintenance          % of Revenues

       Non-recurring Capital Expenditures
                                                             $610                                                                     • Completed eight expansion projects
                                       $490
                                                                                                                                        including Chicago, London, Madrid, Osaka,
           $478                                              31%
                                       15%                                                                  $407
                                                                                                                                        Perth, Seattle, Sofia and Tokyo
           18%
                                                                                    $343
                                                                                    15%
                                                                                                             23%                      • 70%+ of current expansion capital
           45%                         47%                   42%
                                                                                                             40%
                                                                                                                                        expenditures is allocated to the 16 major
                                                                                    46%                                                        (1)
                                                                                                                                        metros, leveraging established ecosystem
           37%                         38%                   28%                    39%                      37%                        density and our large installed base, to
                                                                                                                                        deliver market-leading financial returns
          Q2 18                        Q3 18                 Q4 18                  Q1 19                   Q2 19

                                                   APAC        EMEA      AMER                                          (1)   Major metros defined as those markets that generate greater than $100 million of annual revenues

Confidential – © 2019 Equinix Inc.                                                                 Equinix.com                                                                                                            9
(1) (2)

       Stabilized IBX Growth
                       Stabilized, Expansion & New IBXs                                                                                                                        Stabilized IBX Profitability ($M)
                                                                                                                                                       Last Quarter                                                  $2,244   $94
                                                                                                                                                                             $7,327               $3,308
                                                                                                                                                        Reported
          # of IBXs                                                                      Q2 19 Revenues ($M)

                                                                                                                                                                                            ~30% annual Cash Gross
                                                                                                                                                                                              Profit on Gross PP&E
                                                                                                                                                                                                    investment (5)
                                                                 Expansion:
                                             Stabilized:            23%                                                           Stabilized:
                201                             85%              Growth YoY                                                          3% (3)
                                              Utilized                                                                             Growth
                                                                                                                                     YoY

                                                                                                                                                                                      (4)

 (1)   Reference appendix for IBX definitions of Stabilized, Expansion and New
 (2)   Metronode included as of Q2 19. Excludes AM11, Infomart non-IBX tenant income, non-IBX assets and unconsolidated IBX JK1. Represents Q2 19 revenues
 (3)   YoY growth on a constant currency basis assumes average currency rates used in our financial results remained the same over comparative periods
 (4)   Investment (Q2 19 Gross PP&E) includes real estate acquisition costs, capitalized leases and all capital expenditures associated with stabilized IBXs since opening
 (5)   Cash generation on gross investment calculated as trailing four quarters as-reported cash gross profit divided by Gross PP&E as of Q2 19

Confidential – © 2019 Equinix Inc.                                                                                        Equinix.com                                                                                               10
(1)
2019 Financial Guidance
($M except AFFO per Share) FY 2019 Q3 2019
(2) (3)
Revenues $5,565 - 5,595 $1,399 - 1,409
Cash Gross Margin % 66 - 67% 66 - 67%
Cash SG&A % 18 - 19% 18 - 19%
(4) (5)
Adjusted EBITDA $2,660 - 2,690 $665 - 675
Adjusted EBITDA Margin % ~48% ~47.7%
Recurring Capital Expenditures $170 - 180 $52 - 62
% of revenues ~3% ~4%
Non-recurring Capital Expenditures $1,730 - 1,920
(6)
AFFO $1,910 - 1,930
(6)
AFFO per Share (Diluted) $22.57 - 22.81
Expected Cash Dividends ~$825
(1) Guidance includes the expected impact of the EMEA hyperscale joint venture including the reduction in revenue, adjusted EBITDA and AFFO due to the sale of both LD10x and PA8x to the joint venture, net of the fees earned, the lease payments incurred by
Equinix and the AFFO contribution from Equinix’s 20% non-controlling interest in the joint venture
(2) Guidance includes a foreign currency benefit of approximately $5M compared to Q2 19 FX guidance rates, including the net effect from our hedging transactions
(3) Guidance includes a foreign currency benefit of approximately $3M compared to Q2 19 FX guidance rates and a foreign currency benefit of approximately $8M compared to Q2 19 average FX rates, including the net effect from our hedging transactions
(4) Guidance includes a foreign currency benefit of approximately $1M compared to Q2 19 FX guidance rates, including the net effect from our hedging transactions, $11M of estimated integration costs related to acquisitions and an estimated negative ASC 842
impact of $15M
(5) Guidance includes a foreign currency benefit of approximately $1M compared to Q2 19 FX guidance rates and a foreign currency benefit of approximately $4M compared to Q2 19 average FX rates, including the net effect from our hedging transactions and
$4M of estimated integration costs related to acquisitions
(6) Guidance includes a foreign currency benefit of approximately $11M compared to Q2 19 FX guidance rates, $11M of estimated integration costs related to acquisitions and a minimal ASC 842 impact. Guidance excludes any potential financing the Company
may undertake in the future
Confidential – © 2019 Equinix Inc. Equinix.com 11(1)
FY19 Guidance
Revenues Adjusted EBITDA
Raise full year revenues guidance by $17M Raise full year adjusted EBITDA guidance by $22M
Normalized
Constant Currency (2) 47.6% As-reported Margin ~48%
~9%
YoY Growth
(3) (4) Margin excl. Integration
~10% 48.2% 48.2% Costs and ASC 842
($M) $5,565 - 5,595
10 - 11%
$2,671 - 2,701
-$11 $ 2,660 - 2,690
$2,413
$5,072 1 2
FY18 Reported FY19 Guidance FY18 Reported FY19 Guidance excl. Integration Costs FY19 Guidance
Integration Costs
1 Raise full year revenues guidance
2 Raise full year adjusted EBITDA guidance
Prior Full Year Guidance $5,545 - 5,595M Prior Full Year Guidance $2,640 - 2,680M
Foreign Exchange +$5M Foreign Exchange +$1M
Guidance Adjustment +$12M Guidance Adjustment +$19M
Hyperscale JV Adjustment ($7M) Integration Costs Reduction +$2M
Current Guidance $5,565 - 5,595M Hyperscale JV Adjustment ($7M)
Current Guidance $2,660 - 2,690M
(1) Guidance includes the expected impact of the EMEA hyperscale joint venture including the reduction in revenue, adjusted (3) FY18 adjusted EBITDA margin normalized for $30M of integration costs related to acquisitions
EBITDA and AFFO due to the sale of both LD10x and PA8x to the joint venture, net of the fees earned, the lease payments (4) FY19 adjusted EBITDA margin normalized for an estimated negative ASC 842 impact of $15M, ASC 606 contract cost
incurred by Equinix and the AFFO contribution from Equinix’s 20% non-controlling interest in the joint venture amortization benefit of $10M and $11M of integration costs related to acquisitions
(2) FY19 normalized for AM11, the sale of NY12 and the sale of LD10x and PA8x assets to the EMEA hyperscale JV. FY18
normalized for approximately $19M of Metronode revenues, approximately $10M of Infomart revenues, the sale of NY12, the
sale of LD10x and PA8x assets to the EMEA hyperscale JV and a foreign currency benefit of approximately $20M between
FY19 FX guidance rates and FY18 average FX rates
Confidential – © 2019 Equinix Inc. Equinix.com 12(1)
Q3 19 Guidance
Revenues Adjusted EBITDA
(2) (2)
Q3 growth of 1% muted by one-time Q3 events Adjusted EBITDA QoQ impacted by a better than expected Q2 performance
As-reported Margin
($M)
~1% 48.9% 48.8% 48.0% 47.7%
$1,399 - 1,409 ~-1%
$677 $678
$1 $669 - 679
-$4 $665 - 675
$1,388
$1,385 $3
(1)
(3) (4)
Q2 19 Reported Normalizing Q2 19 Normalized Q3 19 Guidance Q2 19 Reported Normalizing Q2 19 Q3 19 Integration Q3 19 Guidance
Normalized Guidance excl. Costs
Integration
Costs
(1) Guidance includes the expected impact of the EMEA hyperscale joint venture including the reduction in revenue, adjusted EBITDA and AFFO due to the sale of both LD10x and PA8x to the joint venture, net of the fees earned, the lease payments incurred by
Equinix and the AFFO contribution from Equinix’s 20% non-controlling interest in the joint venture
(2) Lower Q3 19 revenues due to sale of assets, a modest step-down in NRR and a favorable property tax ruling, resulting in a reduction in tenant reimbursement revenues. Q2 19 EBITDA was better than expectations largely due to strong recurring revenues
performance and delays in spend
(3) Q2 19 revenues normalized for a foreign currency benefit of approximately $8M between Q3 19 FX guidance rates and Q2 19 average FX rates, the sale of NY12 and the sale of LD10x and PA8x assets to the EMEA hyperscale JV
(4) Q2 19 adjusted EBITDA normalized for a foreign currency benefit of approximately $4M between Q3 19 FX guidance rates and Q2 19 average FX rates, approximately $3M of integration costs related to acquisitions, the sale of NY12 and the sale of LD10x
and PA8x assets to the EMEA hyperscale JV
Confidential – © 2019 Equinix Inc. Equinix.com 13(1) (2)
FY19 AFFO and AFFO per Share Guidance
Raise full year AFFO guidance by $25M; AFFO per share growth of 8 - 9%
Share Count (Diluted) Normalized
Constant Currency
AFFO per Share (Diluted) YoY Growth
($M except AFFO per Share)
1 Raise full year AFFO guidance
AFFO per
Share (3)
80.2M 84.1M 84.6M 84.6M Prior Full Year Guidance $1,880 - 1,910M
8 - 9%
$20.69 $22.52 - 22.88 $22.70 - 22.94 $22.57 - 22.81 Foreign Exchange +$11M
(3)
AFFO Adjusted EBITDA incl. Integration Costs +$15M
13 - 14% Interest Expense +$15M
$1,921 - 1,941 Tax Expense ($5M)
$1,893 - 1,923 +$17 -$5 $1,910 - 1,930 Other ($11M)
+$11 -$11
Current Guidance $1,910 - 1,930M
1 2 FY19 adjusted EBITDA to AFFO guidance
$1,659 FY19 Adjusted EBITDA Guidance $2,660 - 2,690M
2
Interest Expense (guidance mid-point) ($445M)
Tax Expense (guidance mid-point) ($135M)
Recurring Capital Expenditures (guidance mid-point) ($175M)
Current Guidance $1,910 - 1,930M
FY18 Reported FY19 Prior FX Underlying Hyperscale JV FY19 Integration FY19 Guidance
Guidance excl. Adjustment Guidance excl. Costs
Integration Integration
Costs Costs
(1) Guidance includes the expected impact of the EMEA hyperscale joint venture including the reduction in revenue, adjusted EBITDA and AFFO due to the sale of both LD10x and PA8x to the joint venture, net of the fees earned, the lease payments
incurred by Equinix and the AFFO contribution from Equinix’s 20% non-controlling interest in the joint venture
(2) AFFO and AFFO per share guidance excludes any potential financing the Company may undertake in the future
(3) Normalized for a positive foreign currency benefit of approximately $11M between FY19 FX guidance rates and FY18 average FX rates, $11M of integration costs related to acquisitions, a minimal ASC 842 and ASC 606 contract cost amortization impact
and other adjustments; AFFO growth also normalized for acquisitions, the sale of NY12 and the sale of LD10x and PA8x assets to the EMEA hyperscale JV
Confidential – © 2019 Equinix Inc. Equinix.com 14Dividend Outlook
(1)
Annual Cash Dividend
($M) ~13%
+19%
~$825
$727
$612
$492
$394
2019E Cash Dividend of ~$825M
• Continued growth of our annual total
47% 46% 43% 44% 43% cash dividend amount
Payout Payout Payout Payout Payout
Ratio Ratio Ratio Ratio Ratio
2015 2016 2017 2018 2019 E (2) • Third quarter dividend of $2.46 to be
(1)
paid on September 18, 2019
Annual Cash Dividend per Share
+8%
+14% • 2019E cash dividend payout of
$9.84 ~$825M ( 13% YoY) and $9.84 per
$9.12
$8.00 share ( 8% YoY)
$6.76 $7.00
(2)
2015 2016 2017 2018 2019 E
(1) Excludes the dividend distribution on RSU shares
(2) Assumes 83.9M average common shares outstanding for 2019
Confidential – © 2019 Equinix Inc. Equinix.com 15Supplemental Financial and Operating Data
• 203 Data Centers • 348,000+ Total Interconnections • 20+ years of deep expertise
• 52 Metros • The most networks, clouds and IT designing and implementing
services companies on one platform customer architectures
• 5 Continents
• The world’s largest Internet • Digital tools and services to
• 99.9999% Uptime Record
Exchange footprint secure, control and manage
• 100% Renewable Power your hybrid environment
Pledge • Equinix Cloud Exchange Fabric
• 9,800+ Customers • 25%+ of Bookings through
Partner channel
• ~50% of Fortune 500
Confidential – © 2019 Equinix Inc. Equinix.com 16(1)
Equinix Overview
• Global footprint: 203 data centers in 52 metros
Unique Portfolio of Data • Network dense: 1,800+ networks; 100% of Tier 1 Network Routes
Center Assets • Cloud dense: 2,900+ Cloud & IT service providers
• Interconnected ecosystems: 348,000+ Total Interconnections
• 2019 expected YoY revenues growth of ~9% on a normalized and constant currency basis (2)
Attractive Growth Profile • 66 quarters of sequential revenues growth
• 3% (3) same store revenues growth, 68% cash gross margin
• Industry-leading development yields
Proven Track Record • ~30% yield on gross PP&E invested on stabilized assets
• 10 year total annualized return including dividends as of YE 2018 was 23%
• Own 88 of 203 IBXs, 12.9M of 22.7M gross sq. ft.
Long-term Control of Assets • Owned assets generate ~55% of recurring revenues
• Average remaining lease term of >19 years including extensions
• Long history of development success through expansions, campuses and known demand pipeline
Development Pipeline • Expect typical new build to be >80% utilized in 2-5 years
• Expect typical new build to be cash flow breakeven within 6-12 months
• Investment grade corporate credit ratings by S&P (BBB-) and Fitch (BBB-)
• Conservative leverage levels with significant access to capital and financial flexibility
Balance Sheet Flexibility
• Leverage of 3.4x (target of 3 - 4x net debt to adjusted EBITDA)
• Steadily reduced cost of capital
• Strong yield (MRR per cabinet) across all regions and expect yields to remain firm
Stable Yield
• Levers on yield: 2 - 5% pricing escalators on existing contracts, interconnection and power density
(1) All stats are as of Q2 19
(2) FY19 normalized for AM11, the sale of NY12 and the sale of LD10x and PA8x assets to the EMEA hyperscale JV. FY18 normalized for approximately $19M of Metronode revenues, approximately $10M of Infomart revenues, the sale of NY12, the sale of
LD10x and PA8x assets to the EMEA hyperscale JV and a foreign currency benefit of approximately $20M between FY19 FX guidance rates and FY18 average FX rates
(3) YoY same store revenues growth on a constant currency basis assumes average currency rates used in our financial results remained the same over comparative periods
Confidential – © 2019 Equinix Inc. Equinix.com 17Pressing Our Advantage in All Markets
Equinix global reach expanding across 52 metro areas and 24 countries
5 Continents 24 Countries 52 Metro areas 203 Data centers
AMERICAS EMEA ASIA-PACIFIC
% of Customers in Platform Equinix
18 Metros 22 Metros 12 Metros Multiple Locations
(1)
• Geographic footprint is
87 IBXs 74 IBXs 42 IBXs unmatched and remains
Multi-Metro a unique differentiator
Customers
• Multi-region deployments
86% outpace single-region
Multi-Region deployments
Customers
Expansion strategy
73% • Capture first-mover
In All 3 Regions advantage in future
global hubs
Approved Expansions Approved Expansions Approved Expansions 61%
18 • Use unique market
3 12 intelligence for prudent
Opened 3
Newly Approved
8 3
1
capital allocation
2
Previously Announced 2 12
8
4
(1) Derived from Q2 19 recurring revenues
Confidential – © 2019 Equinix Inc. Equinix.com 18(1)
EMEA xScaleTM JV Development
Joint venture with GIC to support the unique needs of top hyperscale customers
Phase Phase Phase Capacity in
Phase
Capacity Capex Open Future Phases
750
Q3 Final
Overview
LD10x LD10x-3 Cab-e / $45M
• On July 1, 2019, announced initial agreement of greater than
Announced
2019 Phase
Previously
6 MW
$1 billion JV with GIC, Singapore’s sovereign wealth fund
1,300
PA8x PA8x-2 Cab-e / $49M
Q4
2019
Final • JV will build and operate xScale data centers in Europe
Phase
8 MW
designed to support the unique needs of our top hyperscale
customers, including the world’s largest cloud service providers
1,450 1,450
Q1
Developments
LD11x LD11x-1 Cab-e / $135M Cab-e /
10 MW
2021
10 MW • GIC will own 80% equity interest and Equinix will own 20% with
JV expected to close in Q3 2019, pending regulatory approval
New
1,325 1,325
and other closing conditions
Q3
FR9x FR9x-1 Cab-e / $121M Cab-e /
2020
10 MW 8 MW Assets in JV
• Equinix will sell LD10x and PA8x, as well as certain other
development interests to the JV
Development
AM To Be Announced at a Future Point in Time
Future
• An initial four future xScale data centers to be developed in
Amsterdam, Frankfurt (2) and London, including newly
FR To Be Announced at a Future Point in Time announced FR9x and LD11x
Sites are less than 1 km from network dense Equinix facilities and support
ultra-low latency campus cross-connects via bulk dark fiber
(1) EMEA xScale JV with GIC excludes TY12x expansion project in Japan
Confidential – © 2019 Equinix Inc. Equinix.com 19Customer Revenues Mix
• Diversified Revenues across Customer, Region & Industry segments
• Record Channel logos adds driving ~60% of new logo acquired in Q2 19
Revenues Mix Customers and Churn
Top 10 Customers
Financial
Services Rank Type of Customer %MRR Region Count IBX Count
EMEA
16%
32% 1 Network 2.8% 3 127
INT 2 Cloud & IT Services 2.3% 3 56
Network 17% Asia-
Enterprise 24% Recurring Pacific
3 Cloud & IT Services 2.2% 3 63
18%
Total Revenues Revenues
(2)
Total Revenues 21% 4 Enterprise 2.2% 3 46
(1)
by Vertical MIS & 5 Cloud & IT Services 2.1% 3 63
Other by Geography(1)
Content & Colo $1,306M 6% 6
7
Network
Network
1.6%
1.5%
3
3
136
118
Digital 77%
Media 8 Content & Digital Media 1.3% 3 64
14% Cloud & IT
Services Americas 9 Cloud & IT Services 1.3% 3 23
28% 47% 10 Content & Digital Media 1.1% 3 24
Top 10 Customers 18%
Top 50 Customers 39%
Global New Customer Count & Churn %
Q2 18 Q3 18 Q4 18 Q1 19 Q2 19
(3)
Gross New Global Customers 170 150 160 140 110
(1) Q2 19 revenues
MRR Churn (4) 2.4% 2.4% 2.1% 2.1% 2.4%
(2) Q2 19 recurring revenues
(3) Gross New Global Customers excludes acquisitions and customers added through the channel and is based on the count of unique global parents
(4) MRR Churn is defined as a reduction in MRR attributed to customer termination divided by MRR billing at the beginning of the quarter
Confidential – © 2019 Equinix Inc. Equinix.com 20Revenues by Product by Region
Americas EMEA Asia-Pacific Worldwide
+10%
+2%
($M)
$1,363 $1,385
$79
$1,262 $88
$81
$74 $81
$77
+4% $219
(1) $213
~0% $198
$644 $644
$618 $30
$38
$29 $28 $28 +17%
$23
$132 $139 $142 +3%
+12%
$435 $450
+2%
$383 $34 $33
$32 $31 $981 $1,006
$24 $39 $284 $291 $914
$32 $38 $261
$34 $22 $16 $22 $17
$21 $38
$440 $444 $21 $37
$434 $32
$331 $348
$294
$186 $210 $214
Q2 18 Q1 19 Q2 19 Q2 18 Q1 19 Q2 19 Q2 18 Q1 19 Q2 19 Q2 18 Q1 19 Q2 19
Colocation Interconnection Managed Services and Other Non-recurring revenues
(1) Includes $8M NRR step-down QoQ
Confidential – © 2019 Equinix Inc. Equinix.com 21(1)
Non-Financial Metrics
FY 2018 FY 2019
Q2 Q3 Q4 Q1 Q2 QoQ
Interconnections
Americas 142,100 143,500 145,900 147,800 149,600 1,800
EMEA 96,900 99,300 115,500 117,900 119,900 2,000
Asia-Pacific 49,300 51,600 57,300 58,500 59,500 1,000
Worldwide Cross Connections 288,300 294,400 318,700 324,200 329,000 4,800
Worldwide Virtual Connections 11,300 13,100 14,900 16,800 19,000 2,200
Total Interconnections 299,600 307,500 333,600 341,000 348,000 7,000
Internet Exchange Provisioned Capacity
Americas 38,600 41,400 44,100 46,800 49,000 2,200
EMEA 8,700 10,000 10,800 11,300 12,100 800
Asia-Pacific 17,400 19,600 21,100 22,800 24,900 2,100
Worldwide 64,700 71,000 76,000 80,900 86,000 5,100
Worldwide Internet Exchange Ports 4,870 4,980 5,110 5,190 5,340 150
Cabinet Equivalent Capacity
Americas 98,200 101,600 105,900 108,000 108,300 300
EMEA 103,900 106,100 113,500 118,100 119,300 1,200
Asia-Pacific 46,000 48,600 57,300 58,100 59,900 1,800
Worldwide 248,100 256,300 276,700 284,200 287,500 3,300
Cabinet Billing
Americas 80,300 80,700 81,800 82,800 83,600 800
EMEA 87,500 89,200 94,700 97,500 99,600 2,100
Asia-Pacific 35,600 37,500 47,500 48,100 49,200 1,100
Worldwide 203,400 207,400 224,000 228,400 232,400 4,000
Quarter End Utilization
Americas 82% 79% 77% 77% 77%
EMEA 84% 84% 83% 83% 83%
Asia-Pacific 77% 77% 83% 83% 82%
MRR per Cab
North America $2,385 $2,379 $2,389 $2,375 $2,387
EMEA $1,332 $1,338 $1,352 $1,395 $1,413
Asia-Pacific $2,008 $1,977 $1,762 $1,767 $1,784
(1) Non-financial metrics include IL2, Itconic and Metronode beginning in Q4 18 but exclude AM11. Reference appendix for non-financial metric definitions
Confidential – © 2019 Equinix Inc. Equinix.com 22Equinix Announced Expansions Cabinet
(1)
(1)
Equivalent
2019 2020 2021 Total Capex(1) Capacity In
(1)
IBX Data Center Status Q1 Q2 Q3 Q4 Q1 Q2 Q3 Q4 Q1 $US millions Ownership Future Phases
DA6 phase III (Dallas) Open 425 $23 Owned
CH3 phase V (Chicago) Open 450 $14 Owned 1,175
SE4 phase II (Seattle) Open 575 $30 Owned 1,175
AT1 phase V (Atlanta) Previously Announced 400 $22 Leased 350
NY5 phase III (New York)
BO2 phase II (Boston)
Previously Announced
Newly Approved
1,100
550
$33
$32
Owned*
Owned 500
Expansion Highlights
LA4 phase III (Los Angeles) Newly Approved 450 $15 Owned 1,600
SP4 phase III (São Paulo) Previously Announced 1,025 $59 Leased 1,475 • 6 newly announced expansions
DA11 phase I (Dallas) Previously Announced 1,975 $138 Owned 1,900
Americas Sellable IBX Cabinet Adds 425 1,025 1,500 - 1,000 3,000 - - $366 including 4 IBX projects in existing
FR2 phase VI-A (Frankfurt) Open 1,425 $103 Owned
LD4 phase II (London) Open 1,075 $45 Owned*
markets (Boston, Los Angeles, Milan
LD9 phase V (London)
PA8x phase I (Paris) ●
Open
Open
1,825
875
$72
$73
Leased
Owned
& Singapore) and 2 xScale projects
LD7 phase I (London) Open 1,600 $124 Owned* 875 (Frankfurt and London)
MD2 phase II (Madrid) Open 300 $15 Leased 775
SO2 phase I (Sofia)
FR2 phase VI-B(Frankfurt)
Open
Previously Announced
350
1,600
$18
$67
Owned
Owned
1,100
• 30 major construction projects
HE7 phase I (Helsinki) Previously Announced 250 $20 Owned 1,225 currently underway including 5 xScale
LD10x phase III (London) ● Previously Announced 750 $45 Leased
SK2 phase VI (Stockholm) Previously Announced 540 $46 Leased 725 projects adding capacity in 23
FR5 phase IV (Frankfurt) Previously Announced 350 $25 Owned 650
HH1 phase I (Hamburg) Previously Announced 375 $27 Owned 1,500 markets
LD9 phase VI (London) Previously Announced 900 $48 Leased
PA8x phase II (Paris) ●
WA3 phase I (Warsaw)
Previously Announced
Previously Announced
1,300
550
$49
$34
Owned
Owned 725
• Estimated FY19 ending cabinet
ZH5 phase III (Zurich) Previously Announced 475 $58 Owned equivalent capacity of ~302,000
AM4 phase III (Amsterdam) Previously Announced 975 $26 Owned
MC1 phase I (Muscat) Previously Announced 250 $28 Owned / JV 500
FR9x phase I (Frankfurt) ● Newly Approved 1,325 $121 Owned 1,325
ML5 phase I (Milan) Newly Approved 500 $48 Owned 975
LD11x phase I (London) ● Newly Approved 1,450 $135 Leased 1,450
EMEA Sellable IBX Cabinet Adds 5,200 2,250 3,140 3,950 1,225 - 1,325 500 1,450 $1,225
HK2 phase V (Hong Kong) Open 1,000 $43 Leased
SH6 phase I (Shanghai) Open 400 $31 Leased 2,825
OS1 phase V (Osaka) Open 475 $15 Leased
PE2 phase II (Perth) Open 225 $11 Leased
TY11 phase I (Tokyo) Open 950 $70 Leased 2,500
HK4 phase II (Hong Kong) Previously Announced 500 $34 Leased
SL1 phase I (Seoul) Previously Announced 550Long-Term Lease Renewals
Weighted average lease maturity of greater than 19 years including extensions
(1)
Global Lease Portfolio Expiration Waterfall
Equinix Owned Sites (2)
% Leases Renewing by Square Footage • Own 88 of 203 IBXs
Last Possible Expiration Date • 12.9M of 22.7M total gross square feet
71%
• 55% of total recurring revenues
Limited Near-Term Lease Expirations
• Only 0.4M square feet up for renewal prior to 2022
9%
3% 2% 1% 2% 3% 2% 4%
0% 1% 1% 0% 1% 0%
2019 2020 2021 2022 2023 2024 2025 2026 2027 2028 2029 2030 2031 2032 2033 +
80%+ of our recurring revenue is generated by either owned properties or properties where our lease expirations extend to 2033 and beyond
(1) This lease expiration waterfall represents when leased square footage would be expired if we assume all available renewal options are exercised as of December 31, 2019. Square footage represents area in operation based on customer ready date
(2) Owned assets defined as fee-simple ownership or owned building on long-term ground lease
Confidential – © 2019 Equinix Inc. Equinix.com 24(1) (2)
Same Store Operating Performance
Revenues ($M) Cash Cost, Gross Profit and PP&E ($M)
Cash Cost Trailing 4-Qtr
Inter- Services/ Total Non- Total of Cash Gross Cash Gross Gross Cash Return on
Category Colocation connection Other Recurring recurring Revenues Revenues Profit Margin % PP&E Gross PP&E %
Q2 2019 Stabilized $595 $157 $55 $807 $42 $849 $274 $576 67.8% $7,483 30%
Q2 2018 Stabilized $579 $148 $54 $781 $45 $827 $265 $562 67.9% $7,534
Stabilized YoY % 3% 6% 2% 3% -8% 3% 3% 3% 0% -1%
(3)
Stabilized @ CC YoY % 2% 8% 6% 4% -6% 3% 2% 4%
Q2 2019 Expansion $399 $61 $21 $481 $36 $517 $172 $345 66.8% $6,829 19%
Q2 2018 Expansion $325 $49 $19 $393 $28 $421 $143 $278 66.0% $6,225
Expansion YoY % 23% 24% 13% 22% 29% 23% 20% 24% 1% 10%
Q2 2019 Total $993 $218 $76 $1,288 $78 $1,366 $445 $921 67.4% $14,312 25%
Q2 2018 Total $904 $197 $73 $1,174 $73 $1,248 $409 $839 67.3% $13,758
Total YoY % 10% 11% 4% 10% 7% 9% 9% 10% 0% 4%
(1) Excludes AM11, Infomart non-IBX tenant income and unconsolidated IBX JK1
(2) Acquisition IBX level financials are based on allocations which will be refined as integration activities continue
(3) YoY growth on a constant currency basis assumes average currency rates used in our financial results remained the same over comparative periods. Q2 2018 normalized for Metronode April 18, 2018 close impact
Confidential – © 2019 Equinix Inc. Equinix.com 25(1)
Consolidated Portfolio Operating Performance
Cabinets Billed Q2 19 Revenues ($M)
Total Cabinet Owned %
Cabinet Cabinets Utilization Total (5) of Total
Category # of IBXs Capacity Billed % Recurring Recurring
Americas
Owned (2) 45 73,300 54,700 75% $400
Leased 42 35,000 28,900 83% $202
Americas Total 87 108,300 83,600 77% $602 66%
EMEA
Owned (2) 30 77,400 65,200 84% $266
Leased 43 41,900 34,400 82% $149
EMEA Total 73 119,300 99,600 83% $415 64%
Asia-Pacific
Owned (2) 13 13,300 11,000 83% $36
Leased 28 46,600 38,200 82% $236
Asia-Pacific Total 41 59,900 49,200 82% $272 13%
EQIX Total 201 287,500 232,400 81% $1,289 55%
Other Real Estate
(3)
Owned $11
Other Real Estate Total $11 100%
Acquisition Total (4) 1 $0 0%
Combined Total 202 287,500 232,400 81% $1,301 55%
(1) Excludes unconsolidated IBX JK1; Acquisition IBX level financials are based on allocations which will be refined as integration activities continue
(2) Owned assets include those subject to long-term ground leases
(3) Includes Infomart non-IBX tenant income
(4) Includes AM11
(5) Excludes revenues from non-IBX assets and unconsolidated IBX JK1
Confidential – © 2019 Equinix Inc. Equinix.com 26(1) (2)
IBX Portfolio Composition
Metro Count Stabilized Expansion New Acquisition Owned Leased
Atlanta 5 AT2, AT3, AT4, AT5 AT1 AT4 AT1, AT2, AT3, AT5
Bogota 1 BG1 BG1
Boston 2 BO1 BO2 BO2 BO1
Chicago 5 CH1, CH2, CH4, CH7 CH3 CH3, CH7 CH1, CH2, CH4
Culpeper 4 CU1,CU2, CU3 CU4 CU1, CU2, CU3, CU4
Dallas 8 DA1, DA2, DA3, DA4, DA7, DA9, DA10 DA6 DA1, DA2, DA3, DA6, DA9 DA4, DA7, DA10
Washington DC/Ashburn 14 DC1, DC2, DC3, DC4, DC5, DC6, DC7, DC8, DC10, DC13, DC97 DC11, DC12, DC14 DC1, DC2, DC4, DC5, DC6, DC11, DC12, DC13, DC14 DC3, DC7, DC8, DC10, DC97
Denver 2 DE1 DE2 DE2 DE1
Houston 1 HO1 HO1
Los Angeles 5 LA1, LA2, LA3, LA7 LA4 LA4, LA7 LA1, LA2, LA3
Miami 4 MI2, MI3 MI1, MI6 MI1, MI6 MI2, MI3
New York 11 NY1, NY2, NY4, NY7, NY8, NY9, NY11, NY12 NY5, NY6, NY13 NY2, NY4*, NY5*, NY6*, NY11, NY12 NY1, NY7, NY8, NY9, NY13
Philadelphia 1 PH1 PH1
Rio de Janiero 2 RJ1 RJ2 RJ2* RJ1
Sao Paulo 4 SP1, SP2 SP3, SP4 SP2, SP3 SP1, SP4
Seattle 3 SE2, SE3 SE4 SE4 SE2, SE3
Silicon Valley 13 SV1, SV2, SV3, SV4, SV5, SV6, SV8, SV13, SV14, SV15, SV16 SV10, SV17 SV1, SV5, SV10, SV14, SV15, SV16 SV2, SV3, SV4, SV6, SV8, SV13, SV17
Toronto 2 TR1 TR2 TR1, TR2
Americas 87 64 23 0 0 45 42
Abu Dhabi 1 AD1 AD1
Amsterdam 9 AM1, AM3, AM5, AM8 AM2, AM4, AM6, AM7 AM11 AM1*, AM2*, AM3*, AM4, AM5, AM6, AM7 AM8, AM11
Barcelona 1 BA1 BA1
Dubai 2 DX1, DX2 DX1, DX2
Dublin 4 DB1, DB2, DB3, DB4 DB3, DB4 DB1, DB2
Dusseldorf 1 DU1 DU1
East Netherlands 2 EN1, ZW1 EN1, ZW1
Frankfurt 6 FR1, FR4, FR7 FR2, FR5, FR6 FR2, FR4, FR5, FR6 FR1, FR7
Geneva 2 GV2 GV1 GV1,GV2
Helsinki 6 HE1, HE2, HE3, HE5, HE6 HE4 HE6 HE1, HE2, HE3, HE4, HE5
Istanbul 1 IL2 IL2
Lisbon 1 LS1 LS1
London 8 LD3, LD5 LD4, LD6, LD8, LD9, LD10x LD7 LD4*, LD5*, LD6*, LD7* LD3, LD8, LD9, LD10x
Madrid 2 MD1 MD2 MD1, MD2
Manchester 4 MA1, MA2, MA3, MA4 MA1, MA2, MA3, MA4
Milan 3 ML3, ML4 ML2 ML3 ML2, ML4
Munich 2 MU1, MU3 MU1, MU3
Paris 8 PA1, PA2, PA3, PA5, PA6, PA7 PA4 PA8x PA2, PA3, PA4, PA8x PA1, PA5, PA6, PA7
Seville 1 SA1 SA1
Sofia 2 SO1 SO2 SO1, SO2
Stockholm 3 SK1, SK3 SK2 SK2 SK1, SK3
Warsaw 2 WA1, WA2 WA1, WA2
Zurich 3 ZH2 ZH4, ZH5 ZH5 ZH2, ZH4
EMEA 74 47 23 3 1 30 44
Adelaide 1 AE1 AE1
Brisbane 1 BR1 BR1
Canberra 1 CA1 CA1
Hong Kong 5 HK3, HK4 HK1, HK2, HK5 HK1, HK2, HK3, HK4, HK5
Melbourne 3 ME5 ME1, ME4 ME1, ME4, ME5 Status Change
Osaka 2 OS99 OS1 OS1, OS99
Perth
Singapore
2 PE1
3 SG1, SG2
PE2
SG3
PE1, PE2
SG1, SG2, SG3
* Subject to long-term ground lease
(1) Divested IL1 in Q2 19
Shanghai 5 SH1, SH2, SH3, SH5 SH6 SH3 SH1, SH2, SH5, SH6
Sydney 7 SY1, SY2, SY3, SY8 SY4, SY6, SY7 SY4*, SY6, SY7 SY1, SY2, SY3, SY8 (2) Metronode moved from Acquisition to
Tokyo 11 TY1, TY2, TY3, TY4, TY5, TY6, TY7, TY8, TY9, TY10 TY11 TY10* TY1, TY2, TY3, TY4, TY5, TY6, TY7, TY8, TY9, TY11 Stabilized/Expansion in Q2 19
Jakarta (unconsolidated) 1 JK1 JK1
APAC 42 28 12 2 0 13 29
Total 203 139 58 5 1 88 115
Confidential – © 2019 Equinix Inc. Equinix.com 27(1)
Adjusted Corporate NOI ($M, except # of IBXs)
Calculation Of Adjusted Corp NOI ($M) Q2 2019 Q1 2019 Q4 2018 Q3 2018 Q2 2018
(1)
# of IBXs 202 201 199 199 199
(2)
Recurring Revenues $1,301 $1,273 $1,228 $1,206 $1,186
Recurring Cash Cost of Revenues Allocation (408) (386) (387) (380) (369)
Cash Net Operating Income 892 887 842 827 818
Operating Lease Rent Expense Add-back (3) 45 43 38 37 38
(4)
Regional Cash SG&A Allocated to Properties (140) (150) (141) (134) (137)
Adjusted Cash Net Operating Income (3) $798 $781 $739 $730 $718
Adjusted Cash NOI Margin 61.3% 61.3% 60.2% 60.5% 60.5%
Reconciliation of NOI Cost Allocations
Non-Recurring Revenues (NRR) (2) $78 $87 $80 $75 $74
Non-Recurring Cash Cost of Revenues Allocation (49) (59) (55) (49) (47)
Net NRR Operating Income $30 $29 $25 $27 $26
Total Cash Cost of Revenues (2) $457 $445 $441 $428 $416
Non-Recurring Cash Cost of Revenues Allocation (49) (59) (55) (49) (47)
Recurring Cash Cost of Revenues Allocation $408 $386 $387 $380 $369
(1)
Regional Cash SG&A Allocated to Stabilized & Expansion Properties $138 $149 $134 $129 $134
(1)
Regional Cash SG&A Allocated to New Properties 2 1 7 4 4
Total Regional Cash SG&A 140 150 141 134 137
Corporate Cash SG&A in HQ Functions Not Allocated to Regions NOI 106 104 102 99 92
Total Cash SG&A (4) $246 $254 $243 $233 $230
Corporate HQ SG&A as a % of Total Revenues 7.6% 7.7% 7.8% 7.7% 7.3%
(1) Excludes non-IBX assets and unconsolidated IBX JK1
(2) Excludes revenues and cash cost of revenues from non-IBX assets and unconsolidated IBX JK1
(3) Adjusted NOI excludes operating lease expenses
(4) 100% of Regional SG&A Allocated to Properties excludes incremental SG&A costs not directly supporting a regional portfolio and integration costs
Confidential – © 2019 Equinix Inc. Equinix.com 28Adjusted NOI Composition – Organic
(1)
Q2 2019 Q2 2019
Total Cabinet Recurring Quarterly
# of Cabinet Cabinets Utilization Revenues Adjusted NOI
Category IBXs Capacity Billed % ($M) ($M) % NOI
Stabilized
Owned (2) 46 71,600 62,100 87% $373 $269 34%
Leased 92 82,300 69,100 84% $434 $256 32%
Stabilized Total 138 153,900 131,200 85% $807 $525 66%
Expansion
Owned (2) 39 89,600 68,400 76% $328 $185 23%
Leased 19 39,900 32,300 81% $153 $86 11%
Expansion Total 58 129,500 100,700 78% $481 $271 34%
New
Owned 3 2,800 400 14% $2 $0 0%
Leased 2 1,300 100 8% $0 -$1 0%
New Total 5 4,100 500 12% $2 -$2 0%
Other Real Estate
(3)
Owned $11 $4 0%
Other Real Estate Total $11 $4 0%
Combined
Owned (2) 88 164,000 130,900 80% $713 $457 57%
Leased 113 123,500 101,500 82% $587 $340 43%
Combined Total 201 287,500 232,400 81% $1,300 $797 100%
(1) Excludes AM11, non-IBX assets and unconsolidated IBX JK1; Acquisition IBX level financials are based on allocations which will be refined as integration activities continue
(2) Owned assets include those subject to long-term ground leases
(3) Includes Infomart non-IBX tenant income
Confidential – © 2019 Equinix Inc. Equinix.com 29Components of Net Asset Value Operating Portfolio Adjusted Q2 19 Quarterly
Ownership Reference
NOI Adjusted NOI ($M)
Stabilized Owned Adjusted NOI Segments $269
Stabilized Leased Adjusted NOI Segments $256
Expansion Owned Adjusted NOI Segments $185
Expansion Leased Adjusted NOI Segments $86
Other Real Estate Owned Adjusted NOI Segments $4
Quarterly Adjusted NOI (Stabilized, Expansion & Other Real Estate Only) $799
Other Operating Income
Acquisition Net Operating Income (1) $0
Quarterly Non-Recurring Operating Income $30
Unstabilized Properties
New IBX at Cost $253
Development CIP and Land Held for Development $838
Other Assets
Cash, Cash Equivalents and Investments Balance Sheet $1,631
(2)
Restricted Cash Balance Sheet $24
Accounts Receivable, Net Balance Sheet $753
Assets Held for Sale Balance Sheet $354
(3)
Prepaid Expenses and Other Assets Balance Sheet $476
Total Other Assets $3,237
Liabilities
Book Value of Debt (4) Balance Sheet $9,601
Accounts Payable and Accrued Liabilities (5) Balance Sheet $1,113
Dividend and Distribution Payable Balance Sheet $15
Liabilities Held for Sale Balance Sheet $53
(6)
Deferred Tax Liabilities and Other Liabilities Balance Sheet $457
Total Liabilities $11,239
Other Operating Expenses
Annualized Cash Tax Expense $132
Annualized Cash Rent Expense (7) $299
Diluted Shares Outstanding ('M) Estimated 2019 Fully Diluted Shares 86.3
(1) Includes AM11 (5) Consists of accounts payable and accrued expenses and accrued property, plant and equipment
(2) Restricted cash is included in other current assets and other assets in the balance sheet (6) Consists of other current liabilities, other noncurrent liabilities, deferred tax liabilities less dividend and distribution payable less
(3) Consists of other current assets and other non-current assets, less restricted cash, debt issuance cost and contract costs liabilities held for sale
(4) Excludes finance lease and operating lease liabilities (7) Includes operating lease rent payments and finance lease principal and interest payments; excludes equipment and office
leases
Confidential – © 2019 Equinix Inc. Equinix.com 30Debt Summary
Spread / Interest First Call First Call / Balance(1)
Debt Maturity
Coupon Rate Date Current Call ($M)
Revolver L + 100 - Dec-22 - $ -
(2)
Term Loan A - SEK, GBP, JPY L + 120 1.672% Dec-22 - 1,302
Senior Notes Debt Amortization
USD due in 2019, 2020, 2021 5.000% 5.000% Various - 600
USD due in 2022 5.375% 5.375% Jan-22 Jan-18 102.6880 750 • $1.3B multi-currency Term Loan A
USD due in 2023 5.375% 5.375% Apr-23 Apr-18 101.7920 1,000
USD due in 2025 5.750% 5.750% Jan-25 Jan-20 102.8750 500
amortizes at 5% per year through 2022
USD due in 2026
USD due in 2027
5.875%
5.375%
5.875%
5.375%
Jan-26
May-27
Jan-21
May-22
102.9380
102.6880
1,100
1,250
• Senior notes mature 2019 through 2027
USD Total 5.474% 5.474% - - $ 5,200
EUR due in 2024 2.875% 2.875% Mar-24 Sep-20 101.4380 853 • Infomart senior notes mature through
EUR due in 2025 2.875% 2.875% Oct-25 Oct-20 101.4380 1,137 April 2021
EUR due in 2026 2.875% 2.875% Feb-26 Feb-21 101.4380 1,137
EUR Total 2.875% 2.875% - - $ 3,126
Mortgage Payable and Other Loans Payable Various 3.036% Various - 42
Subtotal $ 9,670
Finance Lease Obligations 1,202
Total Debt $ 10,872
Debt Maturity Profile (2) (3)
($M) $3,880
Currently Callable
(1) Principal balances outstanding as of reporting period
(2) Term Loan A is a multicurrency loan with outstanding balances of approximately SEK 2.6B, GBP 469M and JPY 45.7B
(3) Excludes finance leases, mortgage payable and other loans payable
Confidential – © 2019 Equinix Inc. Equinix.com 31Shares Forecast (‘M)
Fully Diluted Weighted Average Shares Common Stock Outstanding
~85.1 0.6 84.8
-1.1 ~84.6 84.1
3.7
80.4 80.7
79.5
80.7 0.7
1.4 1.2 1.2 1.5 1.5
Shares Est. Employee Q1 - Q2 Equity(5) Est. Shares Est. Weighted Est. Weighting Est. Fully Diluted Q2 18 Q3 18 Q4 18 Q1 19 Q2 19
Outstanding @ Equity Awards Outstanding Dilutive of All Share Weighted Avg
12/31/18 - Actual @ 12/31/19 Unvested Shares Activities Shares O/S @ Common Stock Outstanding (As-reported)
12/31/19 Unissued Shares Associated with Employee Equity Awards
Forecasted Weighted-Average Weighted-Average
Actual/Forecasted Shares - Fully Diluted Shares - Shares -
Shares (For NAV) Basic Fully Diluted
Shares outstanding at the beginning of the year 80.72 80.72 80.72 80.72
ATM Offering - Q2 0.72 0.72 0.44 0.44
Secondary Offering 2.99 2.99 2.48 2.48
(1)
RSUs vesting 0.55 0.55 0.32 0.32
ESPP purchases (1) 0.16 0.16 0.10 0.10
Dilutive impact of unvested employee equity awards - 1.17 (2) - 0.56 (3)
4.41 5.59 3.34 3.91
(4)
Shares outstanding - Forecast 85.13 86.31 84.07 84.63 For Diluted
AFFO/Share
(1) Represents forecasted shares expected to be issued related to employee equity awards
(2) Represents the dilutive impact of employee equity awards that were granted, but unvested as of year end
(3) Represents the dilutive impact of employee equity awards that were granted, but unvested as of year end and any employee equity awards to be issued in 2019. The weighted-average shares are calculated on the same basis as diluted
EPS for U.S. GAAP purposes
(4) Excludes any potential financing the Company may undertake in the future including ATM equity sales
(5) Includes Q1 secondary offering and Q2 ATM offering
Confidential – © 2019 Equinix Inc. Equinix.com 32(1)
Capital Expenditures Profile
($M)
Q2 2019 Q1 2019 Q4 2018 Q3 2018 Q2 2018
Recurring IBX Maintenance 26 11 49 35 31
Sustaining IT & Network 4 6 12 13 5
Re-configuration Installation 7 4 9 7 6
Subtotal - Recurring 37 21 70 55 42
Non-Recurring IBX Expansion 325 270 491 401 409
Transform IT, Network & Offices 51 55 89 66 47
Initial / Custom Installation 32 18 31 23 23
Subtotal - Non-Recurring 407 343 610 490 478
Total 444 364 681 546 520
Recurring Capital Expenditures as a % of Revenues 2.7% 1.5% 5.4% 4.3% 3.3%
(1) Reference appendix for capital expenditures definitions
Confidential – © 2019 Equinix Inc. Equinix.com 33FX Rates, Hedging and Currencies
(4)
Revenue FX Rates Currency % of Revenues
Blended
Guidance (2) Blended (3) % of
Currency (1) Hedge Rate Guidance (4)
CHF GBP
Rate (2) Hedge % Revenues
Rate 1%
9%
EUR HKD
USD 1.00 43% 20% 4%
AUD
EUR to USD 1.14 1.19 1.17 65% 20% 4%
GBP to USD 1.27 1.37 1.34 68% 9%
JPY to USD 0.01 6% JPY
Other 6%
SEK 1% 1%
SGD to USD 0.74 7%
HKD to USD 0.13 4%
7% SGD
BRL to USD 0.26 3%
0%
AUD to USD 0.70 4% 3%
CNY
SEK to USD 0.11 0.12 0.11 74% 1% 1% BRL
CAD
CHF to USD 1.02 1.03 1.03 79% 1%
CAD to USD 0.76 1% 43%
CNY to USD 0.15 0% USD
(5)
Other - 1%
(1) Guidance rate as of close of market on 6/28/2019
(2) Hedge rate and blended guidance rate for Q3 19
(3) Blended hedge percent for combined Equinix business for Q3 19
(4) Currency % of revenues based on combined Q2 2019 revenues; adjusted AUD, JPY, SGD and other currencies for USD billings
(5) Other includes AED, BGN, COP, PLN and TRY currencies
Confidential – © 2019 Equinix Inc. Equinix.com 34Industry Analyst Reports
Solution Category Report
• Colocation Cloud Interconnection Requires a Purposeful, Planned Approach, Gartner, 5/20/19
Interconnection • The Future of Enterprise Data Centers – What’s Next, Gartner, 4/24/19
• Equinix Vendor Profile: Driving for Global Reach, IDC, 3/31/18
• Equinix Expands ECX Fabric’s Global Footprint to Meet Growing Needs at the Digital Edge, IDC,
Multi-cloud 4/22/19
• Five Key Factors to Prepare your WAN for Multicloud Connectivity, Gartner, 11/12/18
• Equinix Network Edge Leverages SDN and NFV to Enhance Edge Networking, IDC, 6/6/19
Edge Computing • Top 10 Emerging Trends Affecting Digital Infrastructure and Operations in 2019, Gartner, 2/11/19
• The Edge Completes the Cloud, Gartner, 9/14/18
Confidential – © 2019 Equinix Inc. Equinix.com 35Equinix Leadership and Investor Relations
Executive Team
Equinix Investor Relations Contacts Equity Research Analysts
Katrina Rymill Bank of America Michael Funk
VP, Investor Relations Berenberg Nate Crossett
650-598-6583 BMO Capital Markets Ari Klein
krymill@equinix.com Citigroup Mike Rollins
Keith Taylor Cowen Colby Synesael
Charles Meyers Chip Newcom
Chief Financial Officer Credit Suisse Sami Badri
Chief Executive Officer and Director, Investor Relations
President FBN Securities Shebly Seyrafi
650-598-6262
Goldman Sachs Brett Feldman
cnewcom@equinix.com
Green Street Advisors Lukas Hartwich
Raouf Abdel - EVP, Global Operations
Guggenheim Robert Gutman
Sara Baack - Chief Product Officer
Jefferies Jonathan Petersen
Mike Campbell - Chief Sales Officer Equinix Media Contacts JP Morgan Phil Cusick
Simon Miller - Chief Accounting Officer
Brandi Galvin Morandi - Chief Legal and Human Resources Officer KeyBanc Jordan Sadler
David Fonkalsrud
and Corporate Secretary Moffet Nathenson Nick Del Deo
Director, Public Relations
Eric Schwartz - Chief Strategy and Development Officer 650-598-6240 Morgan Stanley Simon Flannery
Karl Strohmeyer - Chief Customer and Revenue Officer dfonkalsrud@equinix.com New Street Research Spencer Kurn
Milind Wagle - Chief Information Officer Nomura Jeff Kvaal
Michelle Lindeman Oppenheimer Tim Horan
Senior Manager, Public Relations Raymond James Frank Louthan
Board of Directors 650-598-6361 RBC Capital Markets Jonathan Atkin
mlindeman@equinix.com Stifel Erik Rasmussen
Peter Van Camp - Executive Chairman, Equinix
SunTrust Greg Miller
Charles Meyers - Chief Executive Officer and President, Equinix
UBS John Hodulik
Tom Bartlett - EVP & Chief Financial Officer, American Tower
Wells Fargo Jennifer Fritzsche
Nanci Caldwell - Former CMO PeopleSoft
Gary Hromadko - Private Investor William Blair James Breen
Scott Kriens - Chairman of the Board, Juniper Networks, Inc.
William Luby - Managing Partner, Seaport Capital
Irving Lyons III - Principal, Lyons Asset Management
Christopher Paisley - Dean’s Executive Professor, Leavey School of Business
at Santa Clara University
Confidential – © 2019 Equinix Inc. Equinix.com 36Appendix: Non-GAAP Financial
Reconciliations & Definitions
Confidential – © 2019 Equinix Inc. Equinix.com 37Non-GAAP Reconciliations Confidential – © 2019 Equinix Inc. Equinix.com 38
Non-GAAP Reconciliations

Confidential – © 2019 Equinix Inc.   Equinix.com   39
Non-GAAP Reconciliations

Confidential – © 2019 Equinix Inc.   Equinix.com   40
Non-GAAP Reconciliations

Confidential – © 2019 Equinix Inc.   Equinix.com   41
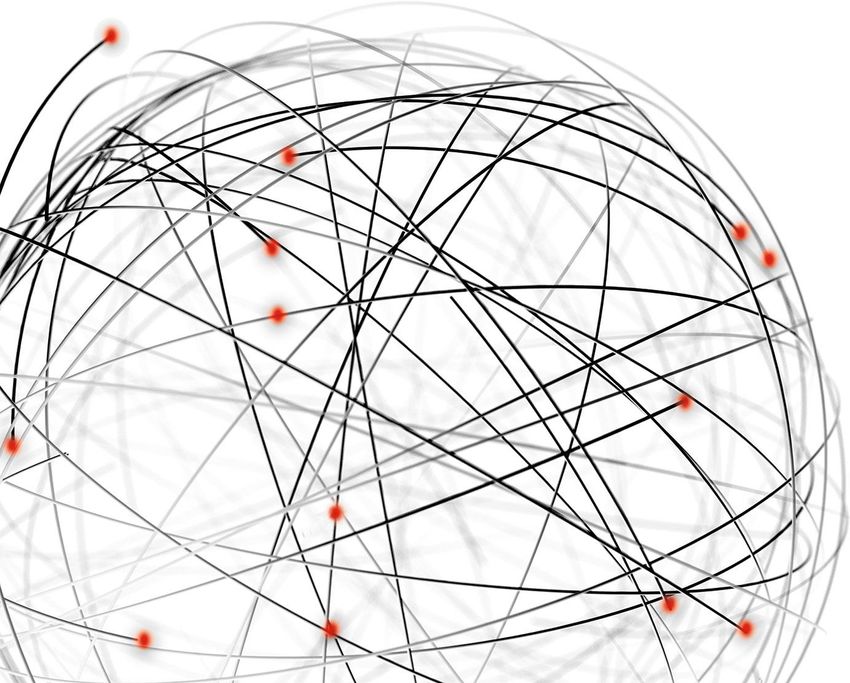
(1)

      Non-GAAP Reconciliations
                                            Consolidated NOI calculation                                                             Q2 2019             Q1 2019      Q4 2018       Q3 2018       Q2 2018
                                            (unaudited and in thousands)
                                            Revenues                                                                              $1,384,977       $1,363,218        $1,310,083    $1,283,751    $1,261,943
                                            Non-Recurring Revenues (NRR) (2)                                                          78,456           87,343            80,242        75,387        73,572
                                            Other Revenues (3)                                                                         5,859            2,783             1,353         1,964         1,945
                                            Recurring Revenues (2)                                                                $1,300,662       $1,273,093        $1,228,489    $1,206,401    $1,186,426

                                            Cost of Revenues                                                                      $ (698,179)      $ (682,030)       $ (670,935)   $ (660,309)   $ (651,801)
                                            Depreciation, Amortization and Accretion Expense                                         230,696          228,637           219,799       222,523       225,461
                                            Stock-Based Compensation Expense                                                           6,500            5,012             5,141         4,600         4,607
                                            Total Cash Cost of Revenues                                                           $ (460,983)      $ (448,381)       $ (445,995)   $ (433,186)   $ (421,733)

                                            Non-Recurring Cash Cost of Revenues Allocation                                           (48,598)         (58,559)          (54,822)      (48,602)      (47,334)
                                            Other Cash Cost of Revenues (3)                                                           (4,115)          (3,855)           (4,565)       (4,845)       (5,695)
                                            Recurring Cash Cost of Revenues Allocation                                            $ (408,271)      $ (385,967)       $ (386,608)   $ (379,740)   $ (368,704)
                                            Operating Lease Rent Expense Add-back (4)                                                 45,261           43,350            38,096        36,988        37,617
                                            Recurring Cash Cost excluding Operating Lease Rent                                    $ (363,009)      $ (342,617)       $ (348,512)   $ (342,752)   $ (331,087)

                                            Selling, General, and Administrative Expenses                                         $ (391,857)      $ (384,761)       $ (367,950)   $ (364,822)   $ (364,691)
                                            Depreciation and Amortization Expense                                                     89,854           86,068            85,331        83,795        83,367
                                            Stock-based Compensation Expense                                                          55,019           44,011            35,726        42,988        45,118
                                            Total Cash SG&A                                                                       $ (246,984)      $ (254,682)       $ (246,893)   $ (238,039)   $ (236,206)

                                            Corporate Cash SG&A in HQ Functions Not Allocated to Regions NOI                         (105,658)           (104,287)     (102,104)      (99,258)      (92,463)
                                                            (3)
                                            Other Cash SG&A                                                                            (1,360)               (660)       (4,256)       (5,200)       (6,390)
                                                                                                (5)
                                            Regional Cash SG&A Allocated to Properties                                            $ (139,966)      $ (149,735)       $ (140,533)   $ (133,581)   $ (137,353)

(1)   Excludes unconsolidated IBX JK1
(2)   Excludes revenues, cash cost of revenues and cash operating income from non-IBX assets and unconsolidated IBX JK1
(3)   Revenues, cash cost of revenues, integration costs and cash net operating income from non-IBX assets and unconsolidated IBX JK1
(4)   Adjusted NOI excludes operating lease expenses
(5)   100% of Regional SG&A Allocated to Properties excludes incremental SG&A costs not directly supporting a regional portfolio and integration costs

Confidential – © 2019 Equinix Inc.                                                                                       Equinix.com                                                                           42
Non-GAAP Reconciliations
(unaudited and in thousands) Q2 2019 Q1 2019 Q4 2018 Q3 2018 Q2 2018
Income from Operations $ 291,781 $ 279,508 $ 270,717 $ 265,753 $ 215,038
Adjustments:
Depreciation, Amortization and Accretion Expense 320,550 314,705 305,130 306,318 308,828
Stock-based Compensation Expense 61,519 49,023 40,867 47,588 49,725
Acquisition Costs 2,774 2,471 481 (1,120) 30,413
Impairment Charges 386 14,448 - - -
(Gain) Loss on Asset Sales - - - (6,013) -
Adjusted EBITDA $ 677,010 $ 660,155 $ 617,195 $ 612,526 $ 604,004
Adjustments:
Non-Recurring Revenues (NRR) (1) (78,456) (87,343) (80,242) (75,387) (73,572)
Other Revenues (2) (5,859) (2,783) (1,353) (1,964) (1,945)
Non-Recurring Cash Cost of Revenues Allocation (1) 48,598 58,559 54,822 48,602 47,334
Other Cash Cost of Revenues (2) 4,115 3,855 4,565 4,845 5,695
Corporate Cash SG&A in HQ Functions Not Allocated to Regions NOI (3) 105,658 104,287 102,104 99,258 92,463
Other Cash SG&A (4) 1,360 660 4,256 5,200 6,390
Operating Lease Rent Expense Add-back (5) 45,261 43,350 38,096 36,988 37,617
Adjusted Cash Net Operating Income $ 797,687 $ 780,741 $ 739,444 $ 730,068 $ 717,986
(1) Excludes revenues and cash cost of revenues from non-IBX assets and unconsolidated IBX JK1
(2) Includes revenues and cash costs of revenues from non-IBX assets and unconsolidated IBX JK1
(3) SG&A costs not directly supporting a regional portfolio
(4) SG&A related to JK1, non-IBX assets and integration costs
(5) Adjusted NOI excludes operating lease expenses
Confidential – © 2019 Equinix Inc. Equinix.com 43Non-GAAP Reconciliations
NAREIT Funds From Operations (NAREIT FFO)
- We calculate Funds From Operations in accordance with the standards established by the National Association of Real Estate Investment Trusts
(“NAREIT”). NAREIT FFO represents net income (loss), excluding gains (or losses) from disposition of real estate property, impairment charges related to
depreciable real estate fixed assets, plus real estate related depreciation and amortization expense and after adjustments for unconsolidated joint ventures,
and non-controlling interests.
Adjusted Funds from Operations (AFFO)
- We calculate AFFO by adding to or subtracting from NAREIT FFO:
1. Plus: Amortization of deferred financing costs and debt discounts and premiums
2. Plus: Stock-based compensation expense
3. Plus: Non-real estate depreciation, amortization and accretion expenses
4. Less: Recurring capital expenditures
5. Less/Plus: Straight line revenues/rent expense adjustments
6. Less/Plus: Contract cost adjustment
7. Less/Plus: Gain/loss on debt extinguishment
8. Plus: Restructuring charges, acquisition costs and impairment charges
9. Less/Plus: Income tax expense adjustment
10. Less/Plus: Adjustments from discontinued operations, unconsolidated JVs and non-controlling interests
Confidential – © 2019 Equinix Inc. Equinix.com 44You can also read