Theory of femtosecond strong field ion excitation and subsequent lasing in N+
←
→
Page content transcription
If your browser does not render page correctly, please read the page content below
Theory of femtosecond strong field ion excitation and subsequent
                                                                                                  lasing in N+
                                                                                                             2

                                                                               Vladimir T. Tikhonchuk,1, 2 Yi Liu,3 Rostyslav
                                                                            Danylo,3, 4 Aurélien Houard,4 and André Mysyrowicz4
                                                                                      1
                                                                                          University of Bordeaux-CNRS-CEA,
arXiv:2003.12840v1 [physics.optics] 28 Mar 2020

                                                                                   CELIA, UMR 5107, 33405 Talence, France∗
                                                                 2
                                                                     ELI-Beamlines, Institute of Physics, Czech Academy of Sciences,
                                                                                      25241 Dolnı́ Břežany, Czech Republic
                                                                               3
                                                                                   Shanghai Key Lab of Modern Optical System,
                                                           University of Shanghai for Science and Technology, 200093 Shanghai, China
                                                                      4
                                                                          Laboratoire d’Optique Appliquée, ENSTA ParisTech, CNRS,
                                                          Ecole Polytechnique, Institut Polytechnique de Paris, 91762 Palaiseau, France†
                                                                                               (Dated: March 31, 2020)

                                                                                                     Abstract
                                                      Delayed cavity-free forward lasing at the wavelengths of 391 and 428 nm was observed in recent
                                                  experiments in air or pure nitrogen pumped with an intense femtosecond laser pulse at wavelength
                                                  of 800 nm. The mechanism responsible for the lasing is highly controversial. In this article we
                                                  explain the delayed emission by the presence of long-lived polarizations coupling simultaneously
                                                                                                                                   +
                                                  ground state X2 Σ+            2        2 +
                                                                   g to states A Πu and B Σu of singly ionized nitrogen molecules N2 . Ionization

                                                  of neutral nitrogen molecules in a strong laser field and subsequent ion excitation are described by
                                                  a system of Bloch equations providing a distribution of ions in the ground and excited states A and
                                                  B at the end of the laser pulse. The delayed signal amplification at the B-X transition wavelength is
                                                  described by a system of Maxwell-Bloch equations with polarization coupling maintained by a weak
                                                  laser post-pulse. Two regimes of signal amplification are identified: a signal of a few ps duration at
                                                  low gas pressures and a short (sub-picosecond) signal at high gas pressures. The theoretical model
                                                  compares favorably with experimental results.

                                                  ∗
                                                      tikhonchuk@u-bordeaux.fr
                                                  †
                                                      rostyslav.danylo@ensta-paristech.fr

                                                                                                        1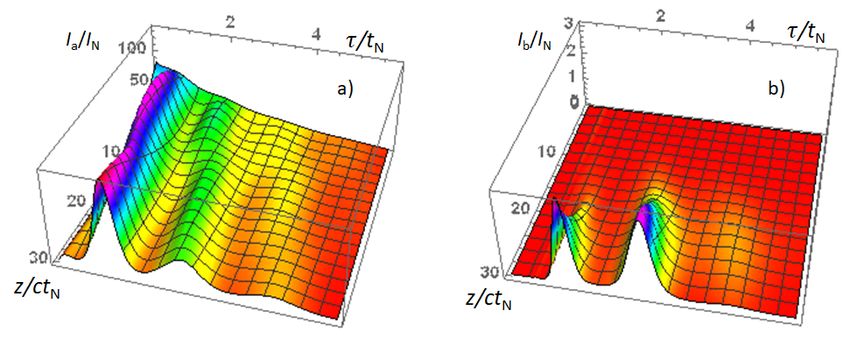
I.    INTRODUCTION: LASING WITHOUT INVERSION

     Several experiments on the interaction of a strong ultra-short laser pulse at 800 nm with
molecular nitrogen [1–7] report on a robust cavity-free lasing in the forward direction at the
wavelengths 391 or 428 nm, corresponding to transitions from the excited state B2 Σ+
                                                                                   u to the
                       +
ground state X2 Σ+
                 g of N2 with vibrational level 0 or 1. It was observed that a femtosecond

seed signal at 391 or 428 nm, injected a few ps after the pump pulse, is amplified by two-
three orders of magnitude. Furthermore, the lasing emission is delayed from the seed pulse
by a few ps. Several explanations for this lasing have been proposed so far. Fast population
inversion between B and X due to depletion of X by the pump pulse inducing a transfer of
population from X to the intermediate third level A2 Πu has been discussed in Refs. [5, 6].
However, these authors did not offer an explanation for the retarded emission, which is
much longer that the pump pulse duration. Increase of the population at the upper level
by multiple electron recollisions was suggested in [8]. However, it was shown later that this
process itself cannot produce an optical gain needed for lasing [9].

     It is known that lasing without population inversion is possible in a V-scheme, which
involves a third level resonantly driven by the pump and coupled to the excited state by a
quantum interference [10–12]. Such a V-scheme, studied in Refs. [13–15] and more recently
in Ref. [16], can be applied to the interpretation of lasing of nitrogen molecular ions N+
                                                                                         2

driven by a ultrashort laser pulse with peak intensity in the range of a few 1014 W/cm2 ,
but one needs to explain how the third level is driven and what are the conditions for
obtaining optical amplification. Recently we have developed a theoretical model that is
capable of describing the delayed lasing [17]. The theoretical results are in agreement with
experimental data about the temporal shape of the amplified signal and the gas pressure
dependence of the gain. The present paper explains in more details this theory: The signal
amplification in the B-X transition of nitrogen molecular ions is described by a two-step
process: (i) the interaction of a short and intense pump laser pulse at the wavelength
800 nm with a nitrogen gas leads to partial ionization of the nitrogen molecules and partial
excitation of the molecular ions to the upper states A and B; (ii) the coherent cross-coupling
between excited ion states A and B opens the possibility of retarded signal amplification.
The following condition must be satisfied in order to obtain gain: population at level B must
be larger than at level A but smaller than at level X; the coherent cross-coupling between

                                              2
A and B must be maintained by a weak 800 nm post-pulse of a few ps duration.
The paper is organized as follows. Section II addresses the problem of ionization of
nitrogen molecules and excitation of the ions by the main laser pulse. While direct ionization
into excited ionic states has a low probability, population transfer to these excited states
can be quite efficient if the transition frequencies are of the same order of magnitude as the
corresponding Rabi frequencies. The calculations show that in the range of intensities around
1014 W/cm2 population at level B is always lower than that at level X(0). Nevertheless, as we
show in Sec. III, signal amplification after the end of the laser pulse is possible provided that
the main laser pulse is followed by a weak coherent post-pulse of a few ps duration, which
maintains the A-X polarization. The presence of a post-pulse is consistent with experimental
observations [17]. The temporal evolution of populations in these three resonantly coupled
levels and the evolution of electromagnetic fields is described by a system of Maxwell-Bloch
equations enveloped over the transition frequencies. This long-lived mutual coherence makes
the system unstable: it may generate an emission corresponding to the B-X transition
or amplify a seed injected at the corresponding wavelength in the absence of population
inversion between B and X. Depending on the post-pulse fluence and gas pressure, this
amplification may proceed in two regimes: either parametric signal amplification at low
pressures or soliton formation at high pressures. Section IV presents an analysis of numerical
simulations with a particular emphasis on the dependence of the amplification process on
gas pressure and laser post-pulse amplitude. Section V compares our theoretical results with
experiments. Section VI presents our conclusions.
II. ION EXCITATION IN A STRONG LASER FIELD
Here we consider the interaction of the main laser pulse at 800 nm with a homogeneous
nitrogen gas. The laser pulse intensity, on the order of 1014 W/cm2 , is sufficiently strong to
create a plasma filament, and it is assumed that it is not appreciably modified by the gas
ionization and ion excitation. Therefore, we consider the interaction of a given laser field
with a single nitrogen molecule. The physical processes that we are interested in are: (i)
ionization of the neutral nitrogen molecule from the neutral ground state to the ionic ground
X and excited A and B states and (ii) subsequent transitions during the laser pulse between
the ground and excited ionic states.
3Fig. 1 shows the V-scheme of energy levels of N+ 2 +
2 containing the ground levels X Σg (0,1),
the excited level B2 Σ+ 2
u (0) and a series of A Πu (v) levels with different vibrational quantum
numbers varying from v = 0 to 3. The resonant couplings considered in what follows
correspond to transitions X(0)-A(2) and X(1)-A(3).
0
B2 Σ+ BM BM II
u B B II
B B II I A2 Πu
B ωbx1II 3
I
ωbx0 B B 2
I 1
B
B Bω
0
ax1
B B ωax0
2 +
X Σg B B 1
B 0
Figure 1. Scheme of the electronic levels in the molecule N+
2 . Numbers near the lines indicate the
vibrational mode, rotational splitting is neglected. Energy gap for transition B(0)-X(0) is 3.20 eV,
energy gap for transition A(2)-X(0) is 1.58 eV, energy splitting between vibrational X levels is
0.27 eV, energy splitting between the vibrational A levels 2 and 3 is 0.25 eV. Resonant couplings
to the laser corresponding to transitions X(0)-A(2)-B(0) and X(1)-A(3)-B(0) are shown with thick
arrows. Polarization cross-coupling between A and B levels is shown with dashed arrows.
Ionization of the nitrogen molecules is described by the PPT model [18, 19] with the ion-
ization probability wPPT (U, E)g(θn ) depending on the ionization potential U , instantaneous
laser electric field E(t), and angle θn between its direction and molecule axis. The angular
dependence is interpolated according to [20] by a function g(θn ) = 0.45 + 0.95 cos2 θn +
1.17 cos4 θn , which decreases from the maximum value 2.57 for the parallel orientation,
θ = 0◦ , to 0.45 for the perpendicular orientation, θ = 90◦ , with an average value of 1.
The ionization energy of level X(0) UX0 = 15.57 eV is comparable to that of level X(1),
UX1 = 15.84 eV, so that both levels have to be considered. As the probability of tunnel
ionization decreases exponentially with the transition energy, direct ionization into excited
states A and B, separated by the energy gap of 1.5 and 3 eV, respectively, is small, but we
account for it for completeness.
The dipolar moments µax ' 0.25 at.u. and µbx ' 0.75 at.u. of A-X and B-X transi-
tions [21, 22] correspond to the coupling energy µE on the order of a few eV for a laser
intensity of 1014 W/cm2 . This value is comparable to the energies of transitions. There-
fore, several levels can be excited simultaneously irrespectively of the resonance conditions.
Non-resonant excitation of two- and three-level systems in a strong laser field was consid-
4ered in Refs. [5–7]. Here we extend this approach by considering excitation in three states:
B(0), A(2) and A(3). Triplet X(0)-A(2)-B(0) with transition energies 1.58 and 3.20 eV,
corresponds to the lasing signal observed at 391 nm, another triplet X(1)-A(3)-B(0) with
transition energies of 1.55 and 2.93 eV, lying nearby, corresponds to lasing at 428 nm. The
scheme of level couplings is shown in Fig. 1.
The temporal evolution of this five-level system in a given laser electric field is described
by a system of Bloch equations for the density matrix involving five diagonal elements
representing the corresponding population of states A(2), A(3), B(0), X(0) and X(1), and
six off-diagonal elements accounting for polarization couplings between A-X, B-X and A-B
states as shown in Fig. 1. The governing equations are presented in Appendix A.
Figure 2. Time dependence of the ionization and excitation probabilities of nitrogen molecular
ions created in a laser pulse with maximum intensity Ilas = 1.5 × 10¹⁴ W/cm2 , wavelength 800 nm
and duration tlas = 40 fs for the molecule orientation at angle θn = 18◦ with respect to the laser
electric field, Tlas = 2π/ω0 = 2.67 fs is the laser period: the total ionization fraction – pink line,
population at X levels – green lines, population at B level – blue line, and population at A levels
– red lines. Solid lines correspond to the vibrational levels X(0) and A(2), dashed lines – to the
vibrational levels X(1) and A(3).
Equations (A1) – (A11) were solved numerically for a given laser pulse maximum intensity
Ilas and pulse duration tlas . The ion state probabilities were evaluated at the end of the
laser pulse, t = tlas , and averaged over the angle θn between the laser field and molecular
axis by taking into account the angular dependence of the ionization probability g(θn ) and
the polarization couplings. We assume an isotropic distribution of molecules in the gas
before the laser pulse arrival. Fig. 2 shows an example of temporal evolution of the state
probabilities for the triplets X(0)-A(2)-B(0) (solid lines) and X(1)-A(3)-B(0) (dashed lines)
5for the molecule orientation of 18◦ with respect to the laser polarization. Steps in the
ionization curve correspond to the maxima of laser electric field and oscillations in the
population levels are due to the polarization coupling. Ionization to the ground levels X is
the dominant channel, the population at level X(0) is larger than at X(1). Direct ionization
in excited states is a minor effect. The excited states A and B are populated essentially
from levels X by the strong-field Rabi coupling.
Figure 3. Dependence of the populations at levels A(2) (red), A(3) (red dashed), B(0) (blue), X(0)
(green) and X(1) (green dashed) normalized to the total ion density, ni on the laser intensity for
laser pulse duration 20 fs (a), 40 fs (b) and 60 fs (c). The total ionization probability ni /n0 is
shown with purple line.
Fig. 3 shows the dependence of the populations on laser intensity for laser pulse duration of
20, 40 and 60 fs. The calculated values are averaged over the molecular orientation assuming
isotropic molecular distribution before the laser arrival. The fraction of ionized nitrogen
molecules shown with purple lines increases with the laser pulse duration and intensity.
Partition of ions between the excited levels depends essentially on the laser intensity and
much less on the pulse duration. At the lowest intensities excitation to the level A(3) has
the highest probability while excitation to the highest level B has the lowest probability.
However, with the increase of laser intensity above ∼ 2 × 10¹⁴ W/cm2 the population ratio
between the levels A and B inverses: Population at level B increases with laser intensity,
while population at level A decreases.
This general trend presented in Fig. 3 is rather similar for the three pulse duration chosen
in panels a, b, and c. Population at level X(0) is always the largest, while an inversion
between states occurs at a laser intensity & 3 × 10¹⁴ W/cm2 . The inversion between levels B
and A(2) occurs at a laser intensity less than 2×10¹⁴ W/cm2 , and the inversion point slightly
varies with the pulse duration. By increasing the laser intensity beyond 4 × 10¹⁴ W/cm2 one
6may also achieve a population inversion between B and X(0) levels, but it is observed only
with the shortest pulse duration and it corresponds to an ionization level of more than 40%.
The ionization-excitation model of nitrogen molecules with a short and intense laser
pulse presented in this section is quite robust. The calculated populations depend rather
weakly on exact values of the frequencies of B-X and A-X transitions and their detuning
with respect to the laser frequency. Coupling is strong and it is controlled essentially by the
large values of the Rabi frequencies µa,bx Elas /~, comparable to the transition frequencies.
Direct ionization to the excited states A(2) and A(3) accounted for in Eqs. (A3) and (A4)
makes a relatively small contribution of about 10% to the population in the excited states.
Contribution of the direct ionization to the level B(0) is even smaller, it is less than 1% in
the considered cases.
In the next section we investigate the evolution of the excited molecules in a gas after
the end of the main laser pulse, assuming that the polarization corresponding to the A-X
transition is maintained by a weak laser post-pulse. It is supposed that such a post-pulse
cannot affect the population distribution between the levels but it is sufficiently strong and
resonant for maintaining one of polarizations da2x0 or da3x1 for a time of a few ps, much longer
than the main laser pulse duration. Due to the polarization coupling, the laser post-pulse
may induces a delayed emission from the level B(0).
III. TEMPORAL EVOLUTION OF THE ION POPULATIONS AND SEED AM-
PLIFICATION IN THE THREE-LEVEL INTERACTION
A. Maxwell-Bloch equations
Here, we consider the temporal and spatial evolution of the triplet X(0)-A(2)-B(0). One
has to account for the possible evolution of the post-pulse in space and in time while prop-
agating through the plasma filament. This implies the use of Maxwell-Bloch equations that
account for the evolution of both ion populations and electromagnetic fields in the plasma.
The post-pulse intensity is about four orders of magnitude smaller than the main pulse. It
cannot ionize the gas and the coupling to molecular ionic transitions is weak. This allows
us to treat each V-triplet independently, to use an envelope approximation for the electric
fields and polarization fields and to select only the resonantly coupled levels. Consequently,
7the electromagnetic field is presented here as a sum of two components operating at the
frequencies close to the transitions A(2)-X(0) and B(0)-X(0):
E(z, t) = Re Eax exp(−iωax τ ) + Ebx exp(−iωbx τ ) ,
where τ = t − z/c is the co-propagation time. Possible detuning from the resonant frequency
is accounted for in the time dependence of the electric field amplitude Ea,bx (τ, z). Similarly,
all polarizations in the Bloch equations (A6) – (A11) are separated in the slow varying
amplitudes and fast oscillating phases:
i i 1
dax = − pax exp(−iωax τ ), dbx = − pbx exp(−iωbx τ ), dba = pba exp(−iωba τ ).
2 2 2
Then the Maxwell-Bloch equations for the three level system system read [15]:
ωax ni µax ωbx ni µbx
c∂z Eax = pax sin θi , c∂z Ebx = pbx cos θi , (1)
20 20
µax µbx
∂τ pax = −γax pax + Eax (na − nx ) sin θi + Ebx p∗ba cos θi , (2)
~ 2~
µbx µax
∂τ pbx = −γbx pbx + Ebx (nb − nx ) cos θi + Eax pba sin θi , (3)
~ 2~
µbx µax ∗
∂τ pba = −γba pba − Ebx p∗ax cos θi − E pbx sin θi , (4)
2~ 2~ ax
µax µbx
∂τ na = − Re(p∗ax Eax ) sin θi , ∂τ nb = − Re(p∗bx Ebx ) cos θi , (5)
2~ 2~
where θi is the angle of the ion molecule orientation with respect to the laser polarization,
coefficients γij account for the collision-induced spontaneous damping of the corresponding
polarizations, ni is the density of nitrogen ions in the plasma and the populations of all three
levels are normalized to the ion density and are related by the condition na +nb +nx = 1. The
characteristic time of spontaneous damping is on the order of a few ps, which is comparable
to the amplification time, and needs to be retained in these equations. Initial conditions
for this system are provided by solution of the Bloch equations (A1) – (A11) driven by the
main pulse.
It is convenient for the qualitative analysis and numerical solutions to introduce the
characteristic time tN = (0 ~/ωax µ2ax ni )1/2 and the characteristic length zN = ctN . In
what follows we shall use the dimensionless time τ → τ tN and coordinate z → z/ctN
and normalized electromagnetic fields ea,b = µa,bx Ea,bx tN /~. (Numerical values for these
parameters are given in Sec. IV.) Then the dimensionless set of equations can be cast in the
8following form
1 1
∂z ea = pax sin θi , ∂τ pax = −γ̂ax pax + (na − nx ) ea sin θi + p∗ba eb cos θi , (6)
2 2
r 1
∂z eb = pbx cos θi , ∂τ pbx = −γ̂bx pbx + (nb − nx ) eb cos θi + pba ea sin θi , (7)
2 2
1 1
∂τ na = − Re(p∗ax ea ) sin θi , ∂τ nb = − Re(p∗bx eb ) cos θi , (8)
2 2
1 ∗ 1
∂τ pba = −γ̂ba pba − pax eb cos θi − pbx e∗a sin θi . (9)
2 2
where r = ωbx µ2bx /ωax µ2ax is the ratio of characteristic times of evolution of the B-X and A-X
transitions and γ̂ij = γij tN are the dimensionless damping rates. For the nitrogen ion this
ratio r ' 18 is quite large because of a large ratio of dipole moments. This implies a much
faster temporal evolution of the B-X transition compared to A-X.
It is important to mention that in the absence of damping, γ̂ij = 0, this system has the
propriety of conserving locally in space the following combination of populations:
1 1 1
|pax |2 + |pbx |2 + |pba |2 + n2a + n2b + n2x = C, (10)
2 2 2
where C is a positive constant which is equal to 1/3 for fully decorrelated and equally par-
titioned populations. The case of fully correlated system C = 1 is considered in Sec. III B 2.
Another important property is the energy conservation in the system. By time integrating
the equations for |ea,b |2 , one obtains the energy conservation laws for transitions A-X and
B-X:
Z L
Fa (L) − Fa (0) = dz (na (z, 0) − na (z, τmax )) , (11)
0
Z L
Fb (L) − Fb (0) = dz (nb (z, 0) − nb (z, τmax )) . (12)
0
Here Fa and Fb are the energy fluxes of the pump and seed pulses at the end of simulation
τ = τmax at the entrance, z = 0, and the exit, z = L, of the system
1 τmax
Z Z τmax
2 1
Fa (z) = dτ |ea (z, τ )| , Fb (z) = dτ |eb (z, τ )|2 .
2 0 2r 0
These relations (11) and (12) confirm that the number of emitted photons in A-X and B-X
transition is conserved separately and it is equal to the number of ions transferred from
the correspondent excited state to the ground state. By taking the difference between the
equations for the field intensities one can obtain also the following relation
1 1
∂z |ea |2 − ∂z |eb |2 = ∂τ nb − ∂τ na ,
2 2r
9which relates the number of ions transferred from state B to state A through the ground
state X to the number of emitted photons in the B-X and A-X transitions. This corresponds
to a lasing process without population inversion but has also been viewed as a two-photon
stimulated Raman scattering [23]. However, in difference from the conventional, single
photon Raman scattering, here the scattered wave is up-shifted in frequency and the energy
is provided from the medium. Therefore, in our view, it is better described as a lasing
process without population inversion.
Fulfillment of the conservation laws (10), (11) and (12) provides a test for the accuracy of
numerical calculations shown below. The positive values of Fa,b correspond to the amplifica-
tion of the corresponding input signal in the plasma. In what follows, we define the energy
gain, Ga,b , as a ratio between the emitted flux at the end of simulation and the injected flux,
and ηb as the fraction of energy extracted from the excited level:
Ga,b = Fa,b (L)/Fa,b (0), ηb = Fb (L)/nb0 L. (13)
Before discussing numerical solutions we first present several analytic results that are useful
for their interpretation.
B. Analytical solutions to the three level system
The system of equations describing the V-scheme has several analytical solutions that are
presented in Appendix B for reference. Here, we present two particular solutions that will
help us interpret the numerical simulations presented in the next section: the lasing without
inversion and the solitons. In both cases we neglect the spontaneous damping for sake of
simplicity.
1. Lasing without population inversion
The system of equations (6) – (9) has a particular solution, discussed by Svidzinsky
et al. [16]. It corresponds to an amplification of a signal at a higher frequency ωbx due
to a parametric coupling to the pump wave of lower frequency ωax through the correlated
polarization between levels A and B. Here, we assume that there are populations at both
excited states, na0 and nb0 , and that the A-X transition is driven by a pump field ea (τ, z) =
10ea0 exp(−i∆ωax τ + iqz) coupled to the polarization pax (τ, z) = pax0 exp(−i∆ωax τ + iqz).
Relations between the amplitudes, pax0 = 2iqea0 / sin θi , the space dephasing parameter
q = (na0 − nx0 ) sin2 θi /2∆ωax and the frequency detuning ∆ωax follow from the first two
equations of the system.
Let us consider seed wave of a small amplitude eb0 at a frequency ωbx corresponding
to the B-X transition and investigate the linear response of the system (6) – (9) to this
initial perturbation. The perturbed system contains three equations for the field eb and
polarizations pbx and pba :
r 1
∂z eb = pbx cos θi , ∂τ pbx = (nb0 − nx0 )eb cos θi + pba ea0 sin θi exp(−i∆ωax τ + iqz),
2 2
1
∂τ pba = iqea0 eb cos θi exp(i∆ωax τ − iqz) − pbx ea0 sin θi exp(i∆ωax τ − iqz).
2
Making a Fourier transform in time with the initial condition eb (0, z) = eb0 , and expressing
the Fourier components of polarizations through eb , one finds an equation for the seed field
∂z eb = H eb with the gain factor H depending on detuning:
ir cos2 θi ∆ωax (ω − ∆ωax ) (nb0 − nx0 ) − (na0 − nx0 ) e2a0 sin2 θi /4
H= .
2∆ωax ω (ω − ∆ωax ) − e2a0 sin2 θi /4
Solving this equation, the signal amplitude can be expressed as an inverse Fourier transform:
Z
ieb0 dω
eb (τ, z) = exp(−iωτ + Hz). (14)
2π ω
The integral here is performed in the complex plane ω along the contour going above the
singular points, according to the principle of causality. The singular points are solutions of
the dispersion equation:
ω (ω − ∆ωax ) − e2a0 sin2 θi /4 = 0,
p
which has two solutions ω1,2 = 21 ∆ωax ∓ 12 ∆ωax 2 + e2 sin2 θ . The first one corresponds
a0 i
to a spontaneous amplification at the B-X transition modified by the presence of the A
level. It requires the population inversion nb0 > nx0 as it is shown in Appendix Bb. The
second one corresponds to a parametric coupling between A and B levels and requires a
softer condition nb0 > na0 . A convenient way to compute the inverse Fourier transform (14)
asymptotically in the limit rzτ cos2 θi
1 is to close the integration contour in the lower
half plane and to transform it into two circles with the centers in the singular points ω1,2 .
The radius of each circle is found by equating the amplitudes of the two terms in the
11exponential. In particular, assuming a sufficiently large detuning |∆ωax |
ea0 | sin θi |, for
the singular point ω1 ≈ −e2a0 sin2 θi /4∆ωax , the circle radius Γ1 is defined by equation:
2Γ21 τ ≈ rz(nb0 − nx0 ) cos2 θi . This singular point corresponds to oscillations decaying in time
with the characteristic frequency Γ1 , if nb0 < nx0 , or to an exponential growth in time, if
nb0 > nx0 .
The radius of the contour around the second singular point ω2 ≈ ∆ωax +e2a0 sin2 θi /4∆ωax
is defined by equation: 8Γ22 τ ≈ rz(nb0 − na0 )e2a0 cos2 θi sin2 θi /∆ωax
2
. The integral around
this singular point corresponds to the modified Bessel function I1 in the case nb0 > na0 :
Γ2
eb (τ, z) = eb0 I1 (2Γ2 τ ). (15)
|∆ωax |
In the limit 2Γ2 τ
1 this expression corresponds to an exponentially growing solution. In
physical units expression for the gain factor reads
√ r
µbx Ea0 nb0 − na0 ωbx τ z
Gbx ' | sin 2θi | . (16)
2~ |∆ωax |tN 2ωax c
If spontaneous damping is included, it imposes a threshold value of the pump field amplitude
for excitation of this instability.
2. Solitary excitation
The soliton solution is a dynamic structure that propagates along the plasma with a
constant velocity. It was described in a two-level system by McCall and Hahn [24] and in
more details in Ref. [25]. Considering for example A-X transition alone and neglecting the
polarization damping term, system (6) and (8) reduces to the following three equations:
1 1
∂z ea = pax sin θi , ∂τ pax = (na − nx )ea sin θi , ∂τ na = − Re(p∗ax ea ) sin θi . (17)
2 2
Assuming ea to be real and depending on the coordinate and time as ξ = (τ − z/u) sin θi ,
this system has two integral relations, |pax |2 = 2na (1 − na ) and e2a = 2na u, which are the
particular case of the more general expressions (10) and (11). The constants in these two
relations are chosen assuming that there is no population at the level A before the laser
pulse arrival. Then the remaining equation for na has a soliton solution:
1 e0 sinh(wξ)
na = 2 , ea = , pax = − , (18)
cosh (wξ) cosh(wξ) cosh2 (wξ)
12√
where the amplitude e0 , velocity u and inverse width w are related as e0 = 2u and
√
w = e0 /2 2. Population at the level A increases from 0 to 1 when ξ is negative and
increasing, while it decreases back to zero when ξ is positive. The soliton carries an area
R∞ √
A = −∞ ea dξ = 2 2π. That relation imposes a condition on the minimum pump amplitude
needed for the soliton excitation.
The soliton propagates with a velocity uc/(1 + u) smaller than the light velocity. It
R∞ √
transports a dimensionless energy flux Fa = 12 −∞ e2a dz = e30 2/ sin θi , which depends on its
amplitude. Soliton solutions for a three level system has been constructed in Refs. [26, 27]
for a particular case of r = 1. However, these are not relevant to our conditions of the large
value of r ≈ 18 that makes correlation between B-X and A-X solitons more complicated.
Particular solutions of the V-system described above are found in the numerical analysis
presented in the next section.
IV. NUMERICAL SOLUTIONS FOR THE V-SYSTEM
A. Initial conditions
Before discussing the numerical solutions for the set of equations (6) – (9), we need
to consider the role of molecular rotations. The strong laser electric field induces a dipolar
moment in a neutral nitrogen molecule and exerts a torque. This leads, after an inertial delay
of ∼ 100 fs, to the formation of a coherent rotational wavepacket with a partial alignment
of the neutral molecules along the laser field axis. As molecules have a broad discrete
distribution in the rotational moments, a coherent rotational wave packet quickly dephases
but then experiences spontaneous revivals every half rotation period Trot = 1/(2Bc) [28, 29].
(Here, B is the rotation constant equal to 2.0 cm−1 for the neutral molecule, 2.07 cm−1
for level B and 1.93 cm−1 for level X.) The duration of revivals is rather short, it is J0
times shorter than the revival period, where J0 ' µElas tlas is the characteristic rotation
momentum.
For the parameters of interest in our study J0 ∼ 10 − 20 and the corresponding revival
duration is less than 1 ps. Thus, revivals should not affect significantly the amplification
process that proceeds on a longer time scale. Therefore, in our model we assume that
the probability of angular distribution of ions, P(θi ), does not depend on time, and we
13consider a quasi-classical angular distribution of ions with the average value hcos2 θi i ' 0.33
corresponding to a non-adiabatic strong short pulse excitation [29, 30]. Equations for angle
averaged populations, na,b,x , and corresponding polarizations are given in Appendix C.
In the numerical analysis of our system we consider the B(0)-A(2)-X(0) transition at
wavelengths 391.4 and 787.5 nm [17]. The fractions of excited ions and initial values of
polarizations are calculated from the system of Bloch equations discussed in Sec. II. As an
example, we consider the main laser pulse intensity 2.6 × 10¹⁴ W/cm2 and duration of 20 fs.
According to Fig. 3, that choice of parameters corresponds to an ionization of 20% and to
a situation without population inversion with respect to the ground level X: na0 = 0.12,
nb0 = 0.20 and na0 = 0.30. However, it satisfies the necessary amplification condition
na0 < nb0 .
We first consider solutions of system (6) - (9) without external fields, eax = ebx = 0, and
with maximum initial values of polarizations: pij ∼ 1. (The choice of phases has no im-
portance.) The system with these initial conditions is quickly discharged by spontaneously
amplifying photons at both transitions. The characteristic de-excitation times of the system,
∆ta ∼ ct2N /(2L|na − nx |) and ∆tb ∼ ct2N /(2rL|nb − nx |) are very short, less than 0.1 tN ,
especially for the B-X transition. This is consistent with the conservation equation (10):
any state will terminate with zero polarizations at excited levels and with nx = 1. This
situation, however, is not consistent with the delayed emission observed in the experiments.
By reducing polarization amplitudes by 100 times or more, one can slow down the spon-
taneous emission and maintain a large fraction of ions in the excited states. However, we
verified that without feeding the polarization pax with an external pump it is not possible
to obtain an efficient coupling between levels A and B and amplification. Therefore, all
simulations presented below were conducted with a post-pulse pump applied at t = 0 and
decaying exponentially with time.
B. Reference case
As a reference point we take a nitrogen gas pressure pN = 30 mbar, which corresponds
to a total ion density ni = 1.2 × 1017 cm−3 for a 20% ionization for the three considered
states. Then, according to Sec. III A, the characteristic time becomes tN ' 0.85 ps, the
characteristic length ctN ' 0.26 mm, the effective electric field EN = ~/µax tN ∼ 58.5 MV/m
142
and the normalization intensity IN = c0 EN = 0.91 GW/cm2 . Spontaneous decorrelation
time 1/γ at this pressure is set to 8.5 ps, same for all three polarizations.
We consider a filament length of L = 7.8 mm. The post-pulse at wavelength 788 nm cor-
responding to detuning ∆ωax = −3.5 ps−1 is decaying exponentially with a time constant
of ta = 5 tN = 4.3 ps. Its initial electric field Ea0 = 293 MV/m corresponds to the dimen-
sionless amplitude ea0 = 5 and intensity 11.4 GW/cm2 . The fluence Fa (0) = 49 mJ/cm2
injected with the post-pulse is significantly larger than the energy stored at the A level
~ωax na0 ni L = 4.7 mJ/cm2 .
A seed pulse at a frequency corresponding to the B-X transition and with a dura-
tion of 0.17 ps is injected 0.43 ps after the end of the main pump pulse. The seed field
Eb0 = 19.5 MV/m corresponds to the dimensionless amplitude eb0 = 1 and the intensity
0.05 GW/cm2 . The injected seed fluence Fb (0) = 0.009 mJ/cm2 is more than 3 orders of
magnitude smaller than the energy stored in the B level, ~ωbx nb0 Ni L = 15.3 mJ/cm2 . The
choice of seed amplitude has not much importance. The initial polarizations of the order
of 10−2 − 10−3 are taken from the solution of the Bloch system discussed in Sec. II. Their
phases are not important.It is also possible to obtain emission from the B-X transition with
other seed amplitudes or without seed provided there is small initial polarization pbx0 in the
filament. Such an initial polarization pbx0 by field induced recollisions has been attributed
as the source for the amplification in the absence of a seed pulse [8, 31].
Figure 4. Temporal evolution of the intensity of electromagnetic waves Ia (a) and Ib (b). Red
curves – incident field, Ia,b (0, t), black lines – exiting field, Ia,b (L, τ ). The intensity and time are
in the normalized units: tN = 0.85 ps and IN = 0.91 GW/cm2 . Dimensionless pump amplitude
ea0 = 5, other conditions and parameters are given in the text.
Example of the seed amplification in these conditions is presented in Fig. 4. It shows
the intensities of the pump and seed pulses, Ia /IN = 12 |ea |2 and Ib /IN = 21 |eb |2 (µax /µbx )2 ,
15at the entrance of the filament, z = 0, and at the exit, z = L, in function of co-propagation
2
time τ . Here IN = 0 cEN = 0.91 GW/cm2 is the normalization intensity. The pump wave
is modulated at the exit with a period of (2 − 3) tN due to the frequency detuning from the
A-X transition and partial absorption. The seed pulse of duration 0.2 tN is injected at time
0.5 tN with a duration 0.25 tN . It is amplified more than 25 times in energy and it extracts
about 0.8% of the energy initially stored in level B.
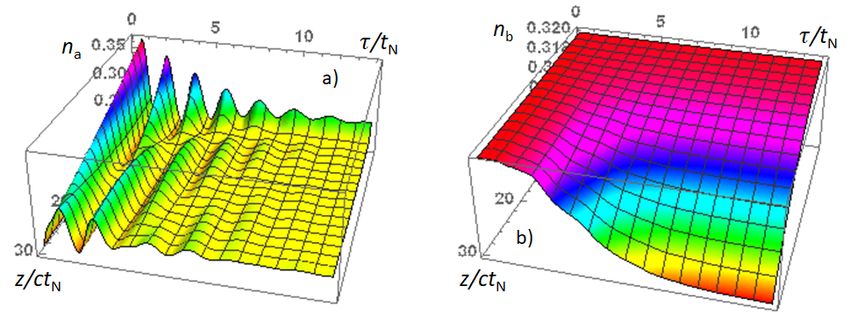
Figure 5. Spatio-temporal evolution of the populations at the excited level A (a) and B (b).
Parameters are the same as in Fig. 4.
The amplified signal is extended by more than 10 ps and produces at the exit a sequence
of pulses of duration of about 2 ps. The amplification is explained by the parametric
coupling of levels A and B by the polarization pba as it is described in Sec. III B 1. By
suppressing the corresponding cross-polarization terms in Eqs. (C5) – (C8) one may eliminate
completely the amplification. It is also verified that the gain is proportional to the difference
of populations between levels B and A, nb0 − na0 , the filament length, L, and the pump
amplitude, ea0 , according to Eq. (16). In particular, no gain is found for equal populations,
or when na0 ≥ nb0 .
The cross-coupling between levels A and B manifests itself also in the spatial and temporal
evolution of the populations of excited ions shown in Fig. 5. The propagation of the pump
post-pulse induces Rabi oscillations of populations at the levels A and X with an amplitude
decreasing with time. Part of the pump pulse is absorbed and the population at level A
temporally increases up to na ' 0.3. It is accompanied by a corresponding decrease of
the population at level X. By contrast, the population at level B shows a delayed decrease
corresponding to an exponential increase of the signal amplitude. Nevertheless, the condition
of amplification, na0 < nb0 is fulfilled all the time.
16Figure 6. Pressure dependence of the energy gain of the pump post-pulse Ga (a) and the seed
pulse Gb (b) and fraction of energy extracted from B-level ηb in per cent (c). The nominal pressure
pN = 30 mbar corresponds to the particle density ni = 1017 cm−3 on the three considered levels.
The input pump intensity Ia (0) = 22.5 GW/cm2 (ea0 = 7, green, 1), 11.5 GW/cm2 (ea0 = 5, red,
2), 4.1 GW/cm2 (ea0 = 3, blue, 3), the frequency detuning ∆ωax = −3.5 ps−1 , the post-pulse
decay time is 4.3 ps. The input seed intensity Ib (0) = 0.05 GW/cm2 , zero detuning, switched on
at tb = 0.5 tN for duration of 0.2 tN , na0 = 0.2 and nb0 = 0.32. The filament length L = 7.8 mm.
C. Pressure dependence of signal gain
The parametric dependence of the amplification process is analyzed by scanning the gains
of the pump and the seed pulses as a function of gas pressure and pump amplitude, while
keeping all other parameters unchanged, except the spontaneous damping which varied
linearly with pressure, γ = γ0 p/pN , where γ0 = 0.1/tN has the same value as in the previous
section. We assume that the ionization level remains the same and the density of ionized
molecules is proportional to the pressure. Figure 6 shows variation of energy gain of the
pump post-pulse, Ga , and seed pulse, Gb , as well as the fraction of energy extracted from
level B, ηb , as a function of gas pressure.
By changing pressure by a factor of 300, from 0.1 pN to 30 pN , we observe two different
behaviors at low and high pressures. At low pressures, the pump post-pulse goes through the
plasma without any significant depletion, and its temporal shape is modulated at the Rabi
frequency, see Figs. 4a and 7a. By contrast, at high pressures, p/pN & 3 − 10, a significant
part of the pump post-pulse is absorbed and the remaining part comes out with a 2 − 3 ps
delay in a form of the soliton, see Fig. 7c.
The seed gain increases monotonously in power approximately 2.5 − 3 at low pressures,
where there is no pump pulse depletion, see curves 1 and 2 in Fig. 6b. Such an increase
of amplification with pressure follows directly from Eq. (16): the gain is proportional to
17Figure 7. Temporal shape of the post-pump (a, b, c) and seed pulse (d, e, f) for gas pressures
p = 0.81 pN (a), p = 2.25 pN (b) and p = 9 pN (c). The dimensionless pump amplitude eea0 = 7,
other parameters are the same as in Fig. 4. The intensity and time and normalized to the values
at the nominal pressure: IN = 0.91 GW/cm2 and tN = 0.85 ps. Red lines show the injected pump
and seed pulse.
the pump amplitude. This is the regime of parametric amplification. The amplified pulse
is characterized by a long duration up (to 10 ps) accompanied by Rabi oscillations with a
period 2 − 3 ps. The amplification is, however, suppressed at very low pump amplitudes, see
curve 3 in Fig. 6b. In this case the signal growth rate is too low and it cannot be amplified
during the time when the pump is present in plasma. A cutoff at high pressures is explained
by two effects: (i) the increase of spontaneous damping and (ii) post-pump absorption.
For the chosen damping rate, the damping time is shorter than the amplification time at
pressures p & 10 pN . As the parametric growth rate is proportional to the pump amplitude,
the cutoff shifts to higher pressures if the pump is stronger. A second effect is demonstrated
in Fig. 6a: at pressures p & 5 pN the energy carried with the post-pulse is comparable with
the energy stored in level A. Consequently, the pump is resonantly absorbed and cannot
support the seed amplification.
It is important to note that there is no correlation in the temporal shape of the transmitted
pump post-pulse and seed pulse in the regime of parametric amplification. Conversely, at
high pressures both the seed and the pump post-pulse exit the plasma synchronously with a
time delay of 2 − 3 ps and a sub-ps duration. This regime of soliton amplification is realized
at pressures exceeding (5 − 10) pN , if the pump amplitude is sufficiently strong.
18The increase of signal gain is correlated with an increase of the energy extracted from
level B, ηb , in the pressure range corresponding to the parametric amplification regime. This
is shown in Fig. 6c in per cent. However, the extracted energy is saturated in the pressure
range of (3 − 10) pN , and in the soliton regime the extracted energy decreases.
Analysis of the spatio-temporal evolution of the post-pump and seed pulses shown in
Fig. 8 provides a better insight in the dynamics of soliton formation. First, the pump pulse
is effectively absorbed in the plasma over distance of a few mm and forms three solitons,
which propagate with a slower velocity. Seed amplification is correlated with the first two
pump solitons, that is, the post-pump and the seed propagate together and form a joint
soliton. The third soliton is too weak and the corresponding seed pulse is dissipated before
reaching the plasma end.
Figure 8. Spatio-temporal evolution of the intensity of the post-pump (a) and seed pulse (b).
Parameters correspond to the pressure ratio p/pN = 4 and dimensionless pump amplitude eea0 = 5.
Other parameters are given in the text.
The conditions of seed amplification are less favorable in the range of intermediate pres-
sures, p/pN = 1 − 10. This effect can be seen in Fig. 6b as a slower increase of gain with
pressure (curve 1) or by a complete gain suppression (curve 2). In this pressure range the
post-pump is already significantly absorbed and delayed in the plasma, but a soliton is not
yet formed. The seed pulse is amplified as a single pulse with a delay but it not yet correlated
to the pump post-pulse.
Therefore, seed amplification in the V-scheme occurs in two regimes of parametric am-
plification and soliton formation, both operating in a limited range of pressures. This range
depends on the post-pulse amplitude, duration, frequency detuning and population on the
level A.
19An increase of the pump amplitude extends the pressure range where seed gain increases
monotonously with pressure up to the cutoff. At small pump amplitudes and large detun-
ings, zones of parametric and soliton amplification are separated by an interval of pressures
p/pN ' 1 − 10 where gain either stagnates or suppressed. A similar behavior was reported
in Ref. [17]. Post-pulse duration has to be sufficiently long for enabling seed amplification.
No amplification was observed numerically for pulse duration shorter than 2 − 3 ps. Longer
post-pulses favor stronger amplification and at longer seed delays. Seed amplification can be
only observed at frequency detuning smaller than the corresponding pump Rabi frequency.
This condition in dimensionless units reads: ea0 |∆ωax | & 1.
V. COMPARISON WITH EXPERIMENTAL RESULTS
The features of the V-scheme amplification demonstrated in Sec. IV are in agreement
with several experimental observations [1–3, 8, 17, 32]. An amplified signal at 391 nm that
is delayed from the pump pulse by several ps has been observed in Ref. [3, 8]. It displays
an increase that is first growing approximately quadratic at low pressures until it reaches a
maximum around 30 − 50 mbar, and decreases at higher pressures [8, 17]. Similar behavior
can be seen in Fig. 6b, curve 2. The measured in these papers gain is on the order of 100,
which is also in agreement with Fig. 6b.
Simulations show that the temporal shape of the amplified signal depends sensitively on
several parameters such a gas pressure, the length of the gain medium, amplitude, duration
of the post pulse and the detuning of its frequency with respect to resonances. Because
of a lack of knowledge on these parameters it is difficult make a quantitative comparison
with experimental results. Nevertheless, the calculated temporal pulse shapes show striking
similarity with several published results. For instance, the multiple temporal oscillations of
the signal reported in Ref. [3] compare well with signal pulse shapes shown in Figs. 4 and 7.
Also, it is shown in Ref. [17] that there is good agreement between calculated and measured
temporal shapes at different pressures.
An amplification was also observed experimentally without injection of a seed pulse at
391 nm [2, 31]. This is consistent with the V-scheme, which predicts amplification even if the
initial coherent polarization B-X is on the order of 10−3 . In this case, the B-X polarization
is attributed to electron recollisions during the pump laser pulse duration [31].
20Signal amplification has been recently reported in air at normal pressure [32]. The pump
pulse wavelength was at 950 nm and the lasing signal occurred at 428 nm. An amplified
signal was reported that was delayed by 5.6 ps. According to our model, these conditions cor-
respond to a soliton regime in a B(0)-X(1)-A(2) V-scheme arrangement. The corresponding
pulse shapes are shown in Fig. 7f.
Finally, we note that it is also possible to obtain amplification with population inversion
between the B and ground X(0) and X(1) states. This, however, requires higher intensities,
above ∼ 4 × 10¹⁴ W/cm2 [33, 34]. These conditions can be obtained under tight focusing in
thin gas jets [35].
VI. CONCLUSIONS
Our theoretical analysis shows that ionization of nitrogen gas by an intense femtosecond
laser pulse at 800 nm is accompanied with a transfer of ionized molecules to higher excited
levels due to resonance polarization coupling. This process depends on both the laser inten-
sity and pulse duration. At moderate laser intensities (in the range of 1 − 3 × 10¹⁴ W/cm2 ),
an ionization level of a few percents is reached, and one obtains an inversion between elec-
tronic levels B and A but no population inversion between B and X. In this case, a seed
amplification can occur due to the coupling between A and B levels in a V-scheme. Two
additional conditions must be fulfilled in order for the gain to take place (i) the main laser
pulse has to be followed by a post-pulse of a few ps duration and an intensity 4 - 5 orders
of magnitude smaller than the main pulse; and (ii) the spectrum of the post-pulse has to
contain a component sufficiently close to one of the A-X transitions. The large number of
rotational and vibrational levels in the excited ion facilitates this resonance condition. A
three level V-scheme is sufficient for a description of this process as only one A-X transi-
tion closest to the spectral component of the laser post-pulse effectively participates in the
coupling.
The seed amplification can be realized in two qualitatively different regimes: three-level
parametric coupling or joint soliton propagation. In the former regime that occurs at pres-
sures of less than 100 mbar, the post-pulse needs to be present during the whole process.
This regime is experimentally observed in good agreement with our theory. The soliton
regime is realized at higher pressures, where the amplified seed comes out synchronously
21with the post-pump in the form of a narrow pulse with a delay increasing with pressure.
The soliton regime might have been observed in air at normal pressure.
Finally, at ionization level in excess of 40% our theory shows that it is possible to obtain
population inversion between the B and ground X state and to achieve direct amplification
of a seed pulse at the B-X transition.
ACKNOWLEDGMENTS
This research was partially supported by the Czech Republic MSMT targeted support of
Large Infrastructures, ELI Beamlines Project LQ1606 of the National Programme of Sustain-
ability II. The authors acknowledge support from the project HiFI (CZ.02.1.01/0.0/0.0/15 003/0000449),
ELITAS (CZ.02.1.01/0.0/0.0/16 013/0001793) and ADONIS (CZ.02.1.01/0.0/0.0/16 019/0000789)
from the European Regional Development Fund. The work is partially supported by the
National Natural Science Foundation of China (Grants No. 11574213, 11904332), Inno-
vation Program of Shanghai Municipal Education Commission (Grant No. 2017-01-07-
00-07-E00007), and Shanghai Municipal Science and Technology Commission (Grant No.
17060502500).
Appendix A: Equations describing ionization and excitation of nitrogen molecules
The temporal evolution of this 5 level system in a given laser electric field is described
by the system of Bloch equations for density matrix involving 5 diagonal elements, na2 , na3 ,
nb0 , nx0 , nx1 , representing the population of correspondent states A(2), A(3), B(0), X(0)
and X(1), and 6 off-diagonal elements, da2x0 , da3x1 , db0x0 , db0x1 , db0a2 , and db0a3 , accounting
for polarization couplings between A and B states as shown in Fig.1. This is a standard
system for the polarization matrix [36] extended to five coupled states.
The laser field responsible for molecule ionization and excitation is given by expression:
Elas (t) = E0 cos(ω0 t) sin(πt/tlas ) where E0 is the laser amplitude, ω0 is the carrier frequency
and tlas is the pulse duration. The spatial dependence of the laser field is not considered in
this model as the laser pulse is sufficiently strong and weakly modified in the gas. The five
22equations for the populations read:
∂t nx0 = wix0 (1 − ni ) − 2µax ~−1 Elas sin θn Imda2x0 − 2µbx ~−1 Elas cos θn Imdb0x0 , (A1)
∂t nx1 = wix1 (1 − ni ) − 2µax ~−1 Elas sin θn Imda3x1 − 2µbx ~−1 Elas cos θn Imdb0x1 , (A2)
∂t na2 = wia2 (1 − ni ) + 2µax ~−1 Elas sin θn Imda2x0 , (A3)
∂t na3 = wia3 (1 − ni ) + 2µax ~−1 Elas sin θn Imda3x1 , (A4)
∂t nb0 = wib0 (1 − ni ) + 2µbx ~−1 Elas cos θn Imdb0x0 + 2µbx ~−1 Elas cos θn Imdb0x1 . (A5)
They are completed with six equations for the corresponding polarizations:
∂t da2x0 = −iωa2x0 da2x0 − iµax ~−1 Elas sin θn (na2 − nx0 ) − iµbx ~−1 Elas cos θn d?b0a2 , (A6)
∂t da3x1 = −iωa3x1 da3x1 − iµax ~−1 Elas sin θn (na3 − nx1 ) − iµbx ~−1 Elas cos θn d?b0a3 , (A7)
∂t db0x0 = −iωb0x0 db0x0 − iµbx ~−1 Elas cos θn (nb0 − nx0 ) − iµax ~−1 Elas sin θn db0a2 , (A8)
∂t db0x1 = −iωb0x1 db0x1 − iµbx ~−1 Elas cos θn (nb0 − nx1 ) − iµax ~−1 Elas sin θn db0a3 , (A9)
∂t db0a2 = −iωb0a2 db0a2 + iµbx ~−1 Elas cos θn d?a2x0 − iµax ~−1 Elas sin θn db0x0 , (A10)
∂t db0a3 = −iωb0a3 db0a3 + iµbx ~−1 Elas cos θn d?a3x1 − iµax ~−1 Elas sin θn db0x1 . (A11)
Here ~ is the Planck constant, wia,b,x are the ionization probabilities of neutral nitrogen
molecule to the corresponding state and ni = na2 + na3 + nb0 + nx0 + nx1 is the total ion
density. The matrix elements are normalized to the initial density of neutral molecules. The
damping rates are in the range of a few inverse picoseconds, they have no importance for
the considered processes and have been neglected.
Appendix B: Simple analytical solutions of a three-level system
a. Dark state
The system of equations (6) – (9) has a particular solution corresponding to constant
electromagnetic field amplitudes and populations. This solution corresponds to zero polar-
izations, pax = pbx = 0. Then populations at the levels A, B and X are related to the field
amplitudes by equations (6) and (7):
1 1
(na − nx ) ea sin θi = − p∗ba eb cos θi , and (nb − nx ) eb cos θi = − pba ea sin θi .
2 2
23These relations imply that
nb − nx |ea |2 sin2 θi
= 2 2
= tan2 ψ.
na − nx |eb | cos θi
Taking into account that na +nb +nx = 1, we find that such a solution may exist for arbitrary
field amplitudes:
na = (1 − 2nx ) cos2 ψ + nx sin2 ψ, and nb = (1 − 2nx ) sin2 ψ + nx cos2 ψ. (B1)
This solution implies that the population at the level X is sufficiently low, nx < 0.5. It
corresponds to a “dark state” of a three level system, which allows propagation of both
electromagnetic waves without absorption. That is, by injecting simultaneously the fields
ea and eb one may maintain the population inversion in the states A and B for a long time,
assuming that all ions are aligned at the same angle θi with respect to the electric field.
b. Amplified spontaneous emission
Another known solution corresponds to the exponential amplification of a weak signal in
a two level system in the conditions where there exists either a population inversion or a
strong polarization. For example, Eqs. (7) and (8) for an isolated B-X transition read:
r 1
∂z eb = pbx cos θi , ∂τ pbx = (nb − nx ) eb cos θi , ∂τ nb = − Re(p∗bx eb ) cos θi .
2 2
Neglecting population variation, nb = nb0 ≈ const, a pair of equations for the electric field
and polarization admits either an exponentially growing solution
p
eb ∝ pbx0 exp( 2r(nb0 − nx0 )zτ | cos θi |),
if nb0 > nx0 , or an oscillating solution if nb0 < nx0 . This growing solution may be realized
at high pump intensities where a population inversion B-X is created by the pump pulse.
Appendix C: Angle-averaged equations for the V-scheme
Equations (6) – (9) are averaged over the ion orientation angle θi assuming that the
probability distribution P(θi ) is a time independent function with average value
1 π
Z
2
hcos θi i = cos2 θi P(θi ) sin θi dθi .
2 0
24Following Refs. [29, 30] we present in this paper simulation results with the value hcos2 θi i =
0.33, but similar results have been obtained with other propability distributions. By in-
troducing the angle-averaged values for populations, n̄a,b,x = hna,b,x i and polarizations,
p̄ax = hpax sin θi i, p̄bx = hpbx cos θi i and p̄ba = hpba sin θi cos θi i, these equations can be
written as follows:
1 1 ∗
∂z ea = p̄ax , ∂τ p̄ax = −γ̂ax p̄ax + h(na − nx ) sin2 θi i ea + p̄ba eb , (C1)
2 2
r 1
∂z eb = p̄bx , ∂τ p̄bx = −γ̂bx p̄bx + h(nb − nx ) cos2 θi i eb + p̄ba ea , (C2)
2 2
1 ∗ 1 ∗
∂τ n̄a = − Re(p̄ax ea ), ∂τ n̄b = − Re(p̄bx eb ), (C3)
2 2
1 ∗ 1
∂τ p̄ba = −γ̂ba p̄ba − hpax cos θi sin θi i eb − hpbx sin2 θi cos θi i e∗a .
2
(C4)
2 2
The higher order correlations in the right hand side of Eqs. (C1), (C2) and (C4) are re-
duced in the lowest order. For example, hna sin2 θi i ≈ n̄a hsin2 θi i and hpbx sin2 θi cos θi i ≈
p̄bx hsin2 θi i. Then, the system of equations takes a closed form:
1 1 ∗
∂z ea = p̄ax , ∂τ p̄ax = −γ̂ax p̄ax + (n̄a − n̄x ) ea hsin2 θi i + p̄ba eb , (C5)
2 2
r 1
∂z eb = p̄bx , ∂τ p̄bx = −γ̂bx p̄bx + (n̄b − n̄x ) eb hcos2 θi i + p̄ba ea , (C6)
2 2
1 ∗ 1 ∗
∂τ n̄a = − Re(p̄ax ea ), ∂τ n̄b = − Re(p̄bx eb ), (C7)
2 2
1 ∗ 1
∂τ p̄ba = −γ̂ba p̄ba − p̄ax eb hcos θi i − p̄bx e∗a hcos2 θi i.
2
(C8)
2 2
Solutions to this system of equations are presented in Sec. IV for the case hcos2 θi i = 0.33.
[1] Y. Yao, G. Li, C. Jing, B. Zeng, W. Chu, J. Ni, H. Zhang, H. Xie, C. Zhang, H. Li, H. Xu, S.
L. Chin, Y. Cheng, and Z. Xu, “Remote creation of coherent emissions in air with two-color
ultrafast laser pulses,” New J. Phys. 15, 023046 (2013).
[2] Y. Liu, Y. Brelet, G. Point, A. Houard, and A. Mysyrowicz, “Self-seeded lasing action of air
pumped by 800 nm femtosecond laser pulses,” Opt. Express 21, 22791 (2013).
[3] G. Li, C. Jing, B. Zeng, H. Xie, J. Yao, W. Chu, J. Ni, H. Zhang, H. Xu, Y. Cheng, and Z.
Xu, “Signature of superradiance from a nitrogen-gas plasma channel produced by strong-field
ionization,” Phys. Rev. A 89, 033833 (2014).
25You can also read