COVID-19: September, October & November 2020 Advice - PMCSA
←
→
Page content transcription
If your browser does not render page correctly, please read the page content below
Office of the Prime Minister’s Chief Science Advisor
                    Kaitohutohu Mātanga Pūtaiao Matua ki te Pirimia

         COVID-19: September, October &
             November 2020 Advice
                                  Collated 25 January 2021

                       Charts and data provided to support verbal advice.

For retrospective information and context, watch this short documentary by independent filmmaker
                                         Shirley Horrocks.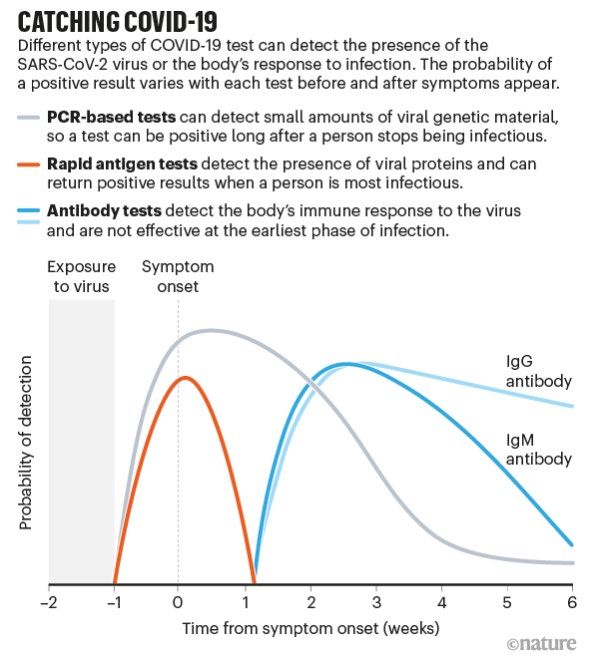
3 September 2020
Data up to 3 September 2020 collated from the Ministry of Health stand-ups/media releases

                                                         New community COVID-19 cases in New Zealand
                                                                                  does not include MIQ cases
                     100

                     90        26 March:
                              Alert level 4

                     80

                     70

                              23 March:
                     60      Alert level 3
   Number of cases

                     50
                                                                                                                                          31 August: Alert level
                                                                                                                                          2.5 in Auckland / level
                     40                                                                                                                         2 rest of NZ

                     30     21 March:
                           Alert level 2                                                                                 12 August: Alert level
                                                                                                                         3 in Auckland / level 2
                     20
                                                                    28 April:            14 May:           8 June:             rest of NZ
                                                                  Alert level 3        Alert level 2     Alert level 1
                     10

                      0

                                                                                                  Date
10 September 2020
Australian data up to 9 September 2020 from https://covidlive.com.au/
NZ data to 10 September 2020 from the Ministry of Health; both confirmed and probable cases included
New Zealand NSW, Australia
Cases 1792 4135
Tests 839,467 2,371,501
Deaths 24 52
Population 5 million 8 million
New COVID-19 cases per day in New Zealand
100
26 March:
90
Alert level 4
80
70
Number of cases
60
30 August: Alert
23 March:
level 2.5 in
50 Alert level 3
Auckland
40
12 August: Alert
21 March: level 3 in Auckland /
30
Alert level 2 level 2 rest of NZ
20 28 April: 14 May: 8 June:
Alert level 3 Alert level 2 Alert level 1
10
0
DateNew community COVID-19 cases in New Zealand
100
90 26 March:
Alert level 4
80
70
60
Number of cases
23 March:
50
Alert level 3
30 August: Alert
40
level 2.5 in
Auckland
30
21 March: 12 August: Alert
Alert level 2 level 3 in Auckland /
20 level 2 rest of NZ
28 April: 14 May: 8 June:
Alert level 3 Alert level 2 Alert level 1
10
0
DateNumber of cases
0
50
100
150
200
250
26-Jan
2-Feb
9-Feb
16-Feb
23-Feb
1-Mar
8-Mar
15-Mar
22-Mar
29-Mar
5-Apr
12-Apr
19-Apr
26-Apr
3-May
10-May
17-May
Date
24-May
31-May
7-Jun
14-Jun
21-Jun
28-Jun
5-Jul
12-Jul
19-Jul
26-Jul
New COVID-19 cases per day: New Zealand vs NSW, Australia
2-Aug
9-Aug
16-Aug
23-Aug
30-Aug
6-Sep
NSW
New Zealand13 September 2020
Australian data up to 13 September 2020 from https://covidlive.com.au/
NZ data to 13 September 2020 from the Ministry of Health; both confirmed and probable cases included
New Zealand NSW, Australia
Cases 1797 4166
Tests 864,469 2,480,838
Deaths 24 52
Population 5 million 8 million
New COVID-19 cases per day in New Zealand
100
26 March:
90
Alert level 4
80
70
Number of cases
60 23 March:
Alert level 3
50
40
21 March: 30 August: Alert
30 Alert level 2 12 August: Alert level 3 level 2.5 in
28 April: in Auckland / level 2 Auckland
14 May: 8 June: Alert
20 rest of NZ
Alert level 3 Alert level 2 level 1
10
0
DateNew community COVID-19 cases in New Zealand
100
90 26 March:
Alert level 4
80
70
60
Number of cases
23 March:
50 Alert level 3
40
30 21 March:
Alert level 2 30 August: Alert
12 August: Alert level 3 level 2.5 in
20 in Auckland / level 2 Auckland
28 April: 14 May: 8 June: Alert
Alert level 3 Alert level 2 level 1 rest of NZ
10
0
DateNumber of cases
0
50
100
150
200
250
26-Jan
2-Feb
9-Feb
16-Feb
23-Feb
1-Mar
8-Mar
15-Mar
22-Mar
29-Mar
5-Apr
12-Apr
19-Apr
26-Apr
3-May
10-May
17-May
Date
24-May
31-May
7-Jun
14-Jun
21-Jun
28-Jun
5-Jul
12-Jul
19-Jul
26-Jul
New COVID-19 cases per day: New Zealand vs NSW, Australia
2-Aug
9-Aug
16-Aug
23-Aug
30-Aug
6-Sep
13-Sep
NSW
New Zealand20 September 2020
Australian data up to 20 September 2020 from https://covidlive.com.au/
NZ data to 20 September 2020 from the Ministry of Health; both confirmed and probable cases included
New Zealand NSW, Australia
Cases 1815 4200
Tests 910,853 2,584,683
Deaths 25 53
Population 5 million 8 million
New COVID-19 cases per day in New Zealand
100
90
26 March:
Alert level 4
80
70
Number of cases
60
23 March:
Alert level 3
50
40
21 March: 30 August: Alert
30 12 August: Alert
Alert level 2 level 2.5 in
level 3 in Auckland /
20 28 April: 14 May: 8 June: Alert Auckland
level 2 rest of NZ
Alert level 3 Alert level 2 level 1
10
0
DateNew community COVID-19 cases in New Zealand
100
90
26 March:
Alert level 4
80
70
60
Number of cases
23 March:
50 Alert level 3
40
30
21 March:
Alert level 2 30 August: Alert
20
12 August: Alert
level 2.5 in
28 April: 14 May: 8 June: Alert level 3 in Auckland /
Auckland
Alert level 3 Alert level 2 level 1 level 2 rest of NZ
10
0
DateNumber of cases
0
50
100
150
200
250
26-Jan
2-Feb
9-Feb
16-Feb
23-Feb
1-Mar
8-Mar
15-Mar
22-Mar
29-Mar
5-Apr
12-Apr
19-Apr
26-Apr
3-May
10-May
17-May
24-May
Date
31-May
7-Jun
14-Jun
21-Jun
28-Jun
5-Jul
12-Jul
19-Jul
26-Jul
2-Aug
New COVID-19 cases per day: New Zealand vs NSW, Australia
9-Aug
16-Aug
23-Aug
30-Aug
6-Sep
13-Sep
20-Sep
NSW
New Zealand5 October 2020
IATA and COVID-19 Testing
– draft prepared under urgency, sent to DPMC and Prime Minister's Office 5/10/20
Summary
IATA have called for pre-departure testing for COVID-19 to replace long periods of quarantine which
would make air travel viable again. They have handed the responsibility to the International Civil
Aviation Organisation (made up of government agencies, including New Zealand’s Civil Aviation
Authority (NZ CAA), but not companies) to work with health authorities on getting it going. New
rapid antigen (i.e. testing for viral proteins, not antibodies to it) tests, recently authorised by the US
FDA are accurate, quick, convenient and cheap enough to make this a possibility. To reduce the risk
of travellers arriving in managed isolation, a single test may significantly reduce the number of
infectious passengers boarding flights, but is by no means fool proof. The lag between getting the
infection and becoming infectious means multiple tests are likely to be needed. NZCAA is involved in
the ICAO process and we have connected, through Hayden, to the key people involved.
IATA call for action
IATA put out a press release on 22 September calling for rapid pre-screening before departure. 1 It
said:
“The International Air Transport Association (IATA) called for the
development and deployment of rapid, accurate, affordable, easy-to-
operate, scalable and systematic COVID-19 testing for all passengers
before departure as an alternative to quarantine measures in order to re-
establish global air connectivity. IATA will work through the International
Civil Aviation Organization (ICAO) and with health authorities to
implement this solution quickly.”
They have said that now is time to develop a global system as testing methods have improved and
considerable practical knowledge has been gained with various travel bubble or travel corridor
initiatives.
In its most recent Bulletin, issued on 23 September 2020, 2 the ICAO (of which NZ CAA is a foundation
member) the organisation does not recommend pre-flight testing but acknowledges that it has been
introduced by some states and has issued a survey of state testing and quarantine requirements.
The responses to the survey will be:
“used to develop guidance material using a risk-based approach to
support the recovery of air traffic through the re-opening of borders and
by means of implementing Public Health Corridors.”
Hayden Glass at DPMC has checked in with the CAA to establish New Zealand’s involvement in this
work and reports that ICAO has released some guidance to states on responding to COVID and
potential mitigations for the risks presented by travel and is looking to update it. This is difficult
terrain for international standards setting (ICAO’s main function) given the developing state of
1
https://www.iata.org/en/pressroom/pr/2020-09-22-01/
2
https://www.icao.int/Security/COVID-19/EBandSL/2020%2097.pdfknowledge of COVID-19, the fact that this is a health-driven issue rather than a more technical
matter of aviation processes, and the varying country circumstances, risk appetites, measures in
place and perhaps also levels of trust. At the moment, ICAO is bringing states together on a regular
basis for discussions and looking to update and reissue its guidance, but it is unlikely to generate a
single set of consistent messaging with a recommended approach.
Possible implementation
There would be a number of factors to consider:
• The incubation period of the disease. It can take around 2-3 days to become infectious
after being infected with COVID-19. Therefore, any test, no matter how accurate, could give
a negative result immediately upon departure, with the traveller becoming infectious during
the flight or on arrival. This is why multiple tests will be necessary.
• The accuracy of any test. False negatives will give a risk of infection, false positives will
impose missed flights and financial burdens on travellers (or the airlines or the travellers’
insurers). This is why repeat tests or confirmation of a positive result via PCR testing may be
necessary.
• The practicalities of administering the test. Current PCR testing requires lab facilities and a
few hours. LAMP assays are faster but still require specialised equipment. Both assays test
for RNA which can linger in non-infectious patients giving false positives, which has been
seen with travellers leaving New Zealand and getting positive PCR tests on arrival overseas. 3
Progress in developing rapid antigen tests 4 suggests they will be the most suitable – at least
one simple to use test was approved by the FDA in August for emergency use. 5
• Systemic approach to testing. There needs to be an agreed international, consistent
approach to testing and certification so the testing, and confirmation that it has occurred,
are reliable and meet New Zealand’s needs for border security regardless of the point of
departure.
Rapid antigen testing
Antigen tests 6 look for proteins from the virus in nasal secretions or saliva. They do not amplify the
material (like the RNA tests do) so will be less sensitive early in the infection but are likely to be
effective once the traveller has enough virus in their secretions to be infective (see figure from
Nature article below). Unlike PCR tests that detect RNA, antigen tests will not continue to give
positive results for weeks or months following infection.
3
https://www.rnz.co.nz/news/covid-19/423572/japanese-belgian-travellers-who-left-new-zealand-test-
positive-for-covid-19
4
https://cpb-ap-se2.wpmucdn.com/blogs.auckland.ac.nz/dist/f/688/files/2020/03/COVID-19-Testing-
Landscape-Final.pdf
5
https://www.fda.gov/news-events/press-announcements/covid-19-update-fda-authorizes-first-diagnostic-
test-where-results-can-be-read-directly-testing-card
6
https://www.nature.com/articles/d41586-020-02661-2Despite having a potentially lower accuracy rapid antigen tests could be repeated easily and inexpensively by non-medically qualified personnel such as airline or airport staff, ensuring that readings can be confirmed. Positive results, necessitating that travel be abandoned or quarantine imposed, could be confirmed by PCR tests. The US FDA 7 and Australia’s TGA 8 have both authorised antigen tests. The initial antigen tests required laboratory equipment but Abbott Laboratories in the US have developed one (BinaxNOW COVID-19 Ag Card 9) that can be used by non-medical personnel (although they will need training in the use of the assay to ensure reliability). They claim 97.1% sensitivity (accuracy in saying the patient is infected or not) and 98.5% specificity (accuracy in saying the virus is SARS- Cov-2). Abbott proposed having the test on sale in September 2020 and will scale up to manufacture 50 million per month. Other manufacturers will have equivalents on the market soon. 10 Pre-flight testing A number of airlines and airports have already instituted pre-flight testing, including American Airlines, United, Lufthansa, Air Canada, and Etihad as well as Montreal Airport 11 and Rome Airport 12 7 https://www.fda.gov/news-events/press-announcements/covid-19-update-fda-authorizes-first-diagnostic- test-where-results-can-be-read-directly-testing-card 8 https://www.tga.gov.au/covid-19-test-kits-included-artg-legal-supply-australia 9 https://www.abbott.com/corpnewsroom/product-and-innovation/upping-the-ante-on-COVID-19-antigen- testing.html 10 https://www.roche.com/media/releases/med-cor-2020-09-01b.htm 11 https://apex.aero/articles/coronavirus/ 12 http://www.adr.it/web/aeroporti-di-roma-en- /viewer?p_p_id=3_WAR_newsportlet&p_p_lifecycle=0&p_p_state=normal&p_p_mode=view&p_p_col_id=col umn-
(also see Annexe). This will provide data on the idea’s effectiveness, allowing for the fact that some
of the initiatives use older testing technologies.

To reduce the risk of travellers arriving in managed isolation, a single test may significantly reduce
the number infectious of passengers boarding flights, but is by no means fool proof. It is very likely
that the delay between becoming infected and returning a positive antigen test means that multiple
tests will be required to ensure testing can reliably replace two-week quarantine. In countries with
higher prevalence of COVID 19 than New Zealand there is less of a need for certainty for them to
retain their current infection status. The Bahamas have introduced a Rapid Antigen test on arrival
and after 96 hours (5 days). 13

A protocol involving a certified test 2-3 days before departure, a test on departure, a test on arrival
and a test after a short period of isolation on arrival, is likely to be sufficiently secure. Abbott sell
their test for $US5.00 per test so the cost is not insurmountable.

2&p_p_col_count=1&_3_WAR_newsportlet_jspPage=%2Fhtml%2Fnews%2Fdetails.jsp&_3_WAR_newsportlet
_nid=20001712&_3_WAR_newsportlet_redirect=%2Fweb%2Faeroporti-di-roma-en-
%2Fviewer2&p_p_col_count=1&_3_WAR_newsportlet_jspPage=%2Fhtml%2Fnews%2Fdetails.jsp&_3_WAR_n
ewsportlet_nid=20001712&_3_WAR_newsportlet_redirect=%2Fweb%2Faeroporti-di-roma-en-%2Fviewer
13
   https://www.prnewswire.com/news-releases/the-government-of-the-bahamas-introduces-new-travel-and-
testing-protocols-designed-to-eliminate-the-need-to-quarantine-301144569.html
ANNEXE
Some Current Pre-Flight Testing Initiatives
Hawaii travel

In the US: Hawaii is preparing to drop its mandatory 14-day quarantine for out-of-state visitors who
return a negative test result within 72 hours of travel. This change comes into effect on 15 October.
The test must be an FDA-approved nucleic acid amplification test (NAAT).

Hawaii Safe Travels program includes arrival temp checks, secondary screening of people with temps
above certain threshold, collection of contact info.

https://hidot.hawaii.gov/coronavirus/

Some countries also have a similar policy (e.g. UAE, Jamaica, Bahamas, Costa Rica)

American Airlines

    •     Initially for people travelling to international destinations.
    •     Beginning mid-Oct, at-home testing via video call with medical professional (48 hours for
          results via LetsGetChecked, appears to be a nasal swab analysed by PCR); in-person testing
          at a CareNow urgent care location; rapid on-site testing administered by CareNow at Dallas
          airport for flights to Hawaii (unfortunately I can’t access the CareNow website, but appears
          to offer antibody and other diagnostic testing).
    •     https://news.aa.com/news/news-details/2020/American-Airlines-Adds-Costa-Rica-to-
          Preflight-Covid-19-Testing-Program-OPS-DIS-10/default.aspx

United Airlines

    •     Pilot program for passengers departing SanFran for Hawaii beginning mid-Oct – either rapid
          test at the airport, or a mail-in test a couple of days prior to departure.
    •     Test is the Abbott ID NOW COVID-19 test (only available in the US) which has come under
          scrutiny for less-than-ideal performance e.g. “Regardless of method of collection and sample
          type, Abbott ID Now COVID-19 had negative results in a third of the samples that tested
          positive by Cepheid Xpert Xpress when using nasopharyngeal swabs in viral transport media
          and 45% when using dry nasal swabs.” https://jcm.asm.org/content/58/8/e01136-20

JetBlue

    •     At-home saliva test administered through online video chat. Results within 72hrs. For
          travellers going to countries with negative test result entry requirement. Uses a saliva test
          and RT-qPCR to detect specific genes of SARS-CoV-2.
    •     This RT-qPCR test is very sensitive for the presence of SARS-CoV-2, with 98% of tests
          providing either a positive or a negative result, and only 2% of tests providing an
          inconclusive result. The test can detect fewer than 10 copies of viral genes per milliliter of
          saliva, and can detect the presence of virus in the saliva within 2 days of infection and up to
          28 days after infection. Across all known gene sequences of SARS-CoV-2, the test detects
          the ones in the genes of interest ~100% of the time, making it highly sensitive and specific
          for those genes. Currently, the false positive and false negative rates for this specific test
          cannot be calculated, because the lab and Vault do not receive data on what happens to
patients after they receive a test. We do not know if patients with a negative test go on to
develop symptoms and subsequently receive a positive test result (false negative) or if an
uninfected patient with a positive result then goes on to have another test that’s negative
(false positive). However, emerging data about false negative rates of saliva-based COVID
tests are showing that the false negative rate for saliva-based tests may be closer to 10%,
which is significantly lower than those of nasopharyngeal swab-based tests, which are in the
25-35% range.
• This assay is intended for use under the Food and Drug Administration’s Emergency Use
Authorization #200090 authorized on April 10, 2020. This is the only saliva test and saliva
collection device that is FDA-authorized for at-home self-collection in the U.S. at this
time. https://www.fda.gov/media/137773/download.
• https://www.vaulthealth.com/covid/#faq
Hawaiian Airlines
• Drive-through testing sites for passengers departing from LA or SanFran, $90 for 36 hour
result, $150 for day-of-travel express service. Also beginning mid-Oct. PCR test
Alaskan Airlines
• Pop-up clinic in downtown Seattle, $135 cost for results in two hours
• Uses the Abbott ID NOW rapid test
• https://www.travelandleisure.com/airlines-airports/alaska-airlines/alaska-airlines-
discounted-covid-tests
Tampa Airport
• Option of either PCR with result in 48hours, or rapid antigen in 15mins and “is most accurate
within five days of the onset of symptoms” (antigen test envisaged as extra layer of
reassurance on day of tracel, in addition to PCR test)
• Not mandatory
• https://news.tampaairport.com/tpa-launches-first-in-the-nation-covid-19-testing-for-all-
departing-and-arriving-passengers/
Lufthansa
• To introduce Rapid Antigen Testing for First and Business class passengers in October 2020
• https://www.washingtonpost.com/travel/2020/09/23/lufthansa-covid19-rapid-testing/
Philippines
• Introducing lab-based antigen testing for domestic travellers
• https://mb.com.ph/2020/10/02/baguio-tourist-boom-seen-with-adoption-of-antigen-
testing-for-domestic-travelers/
“in order for testing by airlines and airports to work, governments would have to agree to accept the
validity of each other’s tests, and consistent standards would have to be applied”
https://www.nytimes.com/2020/09/30/travel/coronavirus-airlines-test.html?auth=login-facebookOffice of the Prime Minister’s Chief Science Advisor
Kaitohutohu Mātanga Pūtaiao Matua ki te Pirimia
Framework for assessing risk of modes of transmission of COVID-19
Draft prepared under urgency at the request of Minister Verrall – 18 November 2020
Key points
• Understanding how the virus causing COVID-19 (SARS-CoV-2) is transmitted is crucial to inform effective
control measures and contact tracing.
• The scientific evidence published to date supports person-to-person transmission when people are in
the same place at the same time as by far the major route of SARS-CoV-2 transmission, with the majority
occurring indoors. Current control measures, including physical distancing, face coverings, good hand
hygiene and cough etiquette, remain the most appropriate risk mitigation measures.
• A growing body of evidence suggests that, although rare, transmission of SARS-CoV-2 can occur when
people have been in the same place at different times, despite not coming into direct contact. The risk
of infection decreases as time passes after viral shedding. There are two possibilities. One rare
transmission route is via fomites on surfaces or objects. Another is via aerosols that remain suspended
in the air for prolonged periods, spreading in an enclosed space or possibly through ventilation systems.
These routes of transmission are not commonplace – if they were, we would have observed far wider
spread of COVID-19 in workplaces and indoor spaces.
• As the prevalence of COVID-19 infection increases worldwide and transmission mitigation approaches
are put in place, rare modes of transmission will be observed from time-to-time, and may account for
transmission events where no person-to-person contact can explain the transmission. Despite being
rare, these modes of transmission should be considered during contact tracing procedures if no
confirmed person-to-person route is quickly identified.
• Infection prevention measures should be triaged based on the risk of infection. Targeting person-to-
person transmission is a primary objective, followed by measures that mitigate the more rare modes of
transmission.
• In response to increasing rates of COVID-19 infection and emerging evidence of airborne transmission,
some jurisdictions, including Europe, have provided guidance on room ventilation to add another layer
of protection.1 The German Government are funding upgrades to heating and air-conditioning systems
to reduce viral spread.2 It would be worth interrogating whether some MIQ facilities create a greater
transmission risk in this regard – e.g. if rooms do not have opening windows.
• Given the low rates of infection in the community, Aotearoa New Zealand has not yet had to prioritise
this ventilation control measure. However, evidence and experience from places with high transmission
rates should be drawn on to escalate mitigation strategies in quarantine settings where infection rates
are higher.
• Should the COVID-19 situation escalate, workplaces around Aotearoa New Zealand could consider (i)
maintaining their current ventilation systems and (ii) exploring options (or planning for) situations where
ventilation can be enhanced in response to incursions. For example, this might inform at what level of
restrictions staff are asked to work from home.
• Additional environmental monitoring is perhaps warranted to better understand which surfaces, objects
or types of ventilation are conducive to viral spread and survival. However, environmental surveying
may have limited value in some instances, as was seen for the Auckland August community cluster.
1 European Centre for Disease Prevention and Control, "Heating, Ventilation and Air-Conditioning Systems in the Context of Covid-19.",
2020; https://www.epa.gov/coronavirus/ventilation-and-coronavirus-covid-19; https://www.hse.gov.uk/coronavirus/equipment-and-
machinery/air-conditioning-and-ventilation.htm
2 https://www.bmwi.de/Redaktion/EN/Pressemitteilungen/2020/10/20201019-euro-500-million-for-ventilation-equipment-in-public-
buildings-and-places-where-people-meet.htmlBackground
Understanding modes of virus transmission is necessary to ensure the most effective control strategies for
COVID-19, to break chains of transmission, support contact tracing efforts, and provide clear and consistent
guidance to the public.
Many unanswered questions about transmission of SARS-CoV-2 remain. The evidence base for transmission
largely relies epidemiological studies, which have identified that most transmission has occurred from
person-to-person, within households. Though there are numerous anecdotes about transmission occurring
without direct contact, there is limited scientific evidence to relating to these rare modes of transmission.
Here we outline the relative likelihood of different modes of transmission for SARS-CoV-2 based on newly
available evidence.
In most studies of rare modes of transmission, researchers test for the presence of viral RNA. To be definitive,
studies would ideally also need to culture the virus to determine if it is infectious, but few such studies have
been published due to the time, cost and impracticalities. If the virus has been there for a long time or it is a
low viral load it may not be able to be cultured. In interpreting studies it’s important to distinguish between
these forms of evidence and also to note that even if the viable virus is detected, it doesn’t mean that an
infectious dose is present. Studies also need to be interpreted in the context of their unique setting and use
of other infection prevention methods. For example, basic hand hygiene would prevent most cases of fomite
spread via object and surfaces.
There is no clear size boundary to distinguish between particles that can settle and those that remain
airborne – it’s a continuum with complex aerodynamics depending on the environmental conditions at the
time – and applied definitions may differ between studies. For clarity, here we distinguish between
transmission that occurs from person-to-person (defined when people are in the same place at the same
time) and transmission that occurs without direct contact.
Evidence
1. Person-to-person transmission: This occurs when people are in the same place at the same time.
Transmission may occur via droplets, aerosols or immediately via surfaces or objects which people have
touched at (or near) the same time.
• The WHO scientific brief on transmission (9 July 2020) concludes SARS-CoV-2 transmission can occur
through direct, indirect or close contact with an infected person through infected secretions such as
saliva and respiratory droplets and aerosols when a person is coughing, sneezing, talking or singing.3
• Person-to-person transmission is widely accepted as the primary mode of transmission, responsible for
the majority of COVID-19 infections worldwide.
2. Transmission without direct contact: Transmission may occur through (i) fomites, where virus perseveres
on surfaces or objects for a short or extended period of time, depending on the context; and (ii) suspended
aerosols, where the virus might persist within enclosed spaces, e.g. a lift, or go through inadequately filtered
air systems, or may be transported via air currents, e.g. a fan.
(i) Fomite transmission via surfaces
• The WHO scientific brief on transmission (9 July 2020) concludes there is evidence consistent with
transmission from contact with a contaminated object or surface, however no specific reports directly
demonstrate this transmission.4
• More recent evidence:
3 World Health Organization, "Transmission of Sars-Cov-2: Implications for Infection Prevention Precautions: Scientific Brief, 09 July 2020",
2020
4 World Health Organization, "Transmission of Sars-Cov-2: Implications for Infection Prevention Precautions: Scientific Brief, 09 July 2020",
2020o A longitudinal monitoring study of high-touch surfaces in a community setting in Massachusetts
found 8.3% of 348 surfaces were positive for SARS-CoV-2, but did not test for virus infectivity.5
The risk of infection from touching a contaminated surface was estimated to be very low.
o A study found that SARS-CoV-2 could remain infectious on salmon for up to eight days at 4°C
and for up to two days at 25°C.6 The initial viral dose administered to the salmon may not be
applicable to concentrations in real-life situations.7
o 26% of 112 surface samples taken from COVID-19 patient rooms in a hospital setting had
detectable SARS-CoV-2 but none showed evidence of viable virus.8 These patients were 8 days
or more into their illness.
o A study detected SARS-CoV-2 RNA on around 5% of 242 tested surfaces swabbed in quarantine
hotels, hospitals, or personal items of COVID-19 patients, but did not test for infectivity or
transmission probability.9
o While 52% of 218 surfaces in a London hospital had SARS-CoV-2 RNA detected, no viable virus
was recovered from any sample.10
o A study of infected patients from the Diamond Princess isolating at the University of Nebraska
Medical Center detected SARS-CoV-2 on 70% of sampled personal items.11
Conclusion: Transmission via surfaces or objects is definitely one mode of transmission, but the risk
drops rapidly over time and is highly dependent on environmental factors. Relative to person-to-person,
fomite transmission where virus persists on the surfaces or objects for extended periods is rare.
(ii) Suspended aerosol transmission
• The WHO scientific brief on transmission (9 July 2020) concludes that airborne transmission can occur
when aerosol generating medical procedures are used (based on studies that have specifically applied
these procedures), but without that the evidence is not conclusive either way. Small quantities of SARS-
CoV-2 RNA can be detected in air samples, but no evidence that viable virus is suspended in the air for
extended periods. WHO note that some outbreaks that have occurred in indoor crowded spaces (e.g.
choir practice, restaurants, fitness classes, meat processing facilities) point to transmission being airborne
via aerosol. A more recent update from WHO (20 Oct 2020) states that “Aerosol transmission can occur
in specific settings.”12
• More recent evidence of aerosol transmission in an enclosed space:
A modelling study of transmission of SARS-CoV-2 suggests that aerosol transmission is
a possible route of transmission, but is inefficient, particularly for people with low viral
loads.13
All 11 air samples taken from rooms in a Japanese hospital with COVID-19 infected
patients were negative for SARS-CoV-2.14 The patients had been intubated 3 days prior
and had been in a negative pressure room.
5 Harvey et al., "Longitudinal Monitoring of Sars-Cov-2 Rna on High-Touch Surfaces in a Community Setting," medRxiv (2020) Pre-print only,
not yet peer-reviewed.
6 Dai et al., "Long-Term Survival of Sars-Cov-2 on Salmon as a Source for International Transmission," J Infect Dis (2020)
7 Goldman, "Exaggerated Risk of Transmission of Covid-19 by Fomites," The Lancet Infectious Diseases 20, no. 8 (2020)
8 Binder et al., "Environmental and Aerosolized Severe Acute Respiratory Syndrome Coronavirus 2 among Hospitalized Coronavirus Disease
2019 Patients," The Journal of Infectious Diseases (2020)
9 Ma et al., "Coronavirus Disease 2019 Patients in Earlier Stages Exhaled Millions of Severe Acute Respiratory Syndrome Coronavirus 2 Per
Hour," Clinical Infectious Diseases (2020)
10 Zhou et al., "Investigating Sars-Cov-2 Surface and Air Contamination in an Acute Healthcare Setting During the Peak of the Covid-19
Pandemic in London," Clinical Infectious Diseases (2020)
11 Santarpia et al., "Aerosol and Surface Contamination of Sars-Cov-2 Observed in Quarantine and Isolation Care," Scientific Reports 10, no. 1
(2020)
12 https://www.who.int/news-room/q-a-detail/q-a-how-is-covid-19-transmitted; accessed 17 November 2020
13 Smith et al., "Aerosol Persistence in Relation to Possible Transmission of Sars-Cov-2," Physics of Fluids 32, no. 10 (2020)
14 Nakamura et al., "Environmental Surface and Air Contamination in Severe Acute Respiratory Syndrome Coronavirus 2 (Sars-Cov-2) Patient
Rooms by Disease Severity," Infection Prevention in Practice 2, no. 4 (2020) Viable (infectious) SARS-CoV-2 was present in aerosols within a hospital room, 2 to 4.8
metres away from COVID-19 patients, in the absence of any specific healthcare
aerosol-generating procedures.15
Only 1.5% of 195 aerosol samples taken from COVID-19 patient rooms in a hospital
setting had detectable SARS-CoV-2 and none showed evidence of viable virus.16 These
patients were 8 days or more into their illness.
A study detected SARS-CoV-2 RNA in 27% of 52 exhaled breath samples from patients
with COVID-19 and 4% of 26 air samples, but didn’t test whether the virus was viable
to infect.17
A two-cage experimental study using ferrets provided limited experimental evidence
that SARS-CoV-2 is transmitted via the air, with air blown from the cage of infected
ferrets (via conduit containing bends) leading to infection in a separate cage 10 cm
away.18
A study of infected patients from the Diamond Princess isolating at the University of
Nebraska Medical Center detected SARS-CoV-2 in 63% of air samples, with some
evidence for the presence of replication competent virus but the virus couldn’t be
cultured.19
While nearly 38% of 31 air samples taken from a range of clinical areas across London
hospital (including ED, wards, theatres and ICU) had SARS-CoV-2 RNA detected, no
viable virus was recovered.20
Conclusion: A growing body of evidence suggests aerosol transmission is a transmission route for COVID-
19 infection, especially indoors. The period of time that virus remains suspended in aerosol form will
likely depend on a variety of environmental factors notably; temperature, humidity and ventilation.
Relative to person-to-person, transmission via suspended aerosols is likely to be a rare mode of
transmission.
• More recent evidence of aerosol transmission via air flow or air conditioning:
An epidemiological study of a community outbreak of COVID-19 in Zhejiang province, China,
found that individuals who rode a bus with air recirculation with a patient with COVID-19 had a
higher risk of SARS-CoV-2 infection than individuals who rode another bus without an infected
passenger to the same event and those that attended the event without taking either bus.21
The risk of infection was not higher in the part of the bus close to the index case, suggesting air
circulation played a role.
Circumstantial evidence for COVID-19 transmission in a high-rise apartment building in China
suggests it may have been caused through faecal aerosol transmission.22 The unusual
circumstances of this situation are notable, specifically that there were a large number of
infected occupants and that the material was aerosolised under pressure.
An epidemiological investigation of a COVID-19 outbreak in a call centre in South Korea
described a high rate of infection (43.5%) for people on one floor, concentrated on one side of
the building, highlighting the risk of crowded work settings.23
15 Lednicky et al., "Viable Sars-Cov-2 in the Air of a Hospital Room with Covid-19 Patients," International Journal of Infectious Diseases 100
(2020)
16 Binder et al., "Environmental and Aerosolized Severe Acute Respiratory Syndrome Coronavirus 2 among Hospitalized Coronavirus Disease
2019 Patients," (2020)
17 Ma et al., "Coronavirus Disease 2019 Patients in Earlier Stages Exhaled Millions of Severe Acute Respiratory Syndrome Coronavirus 2 Per
Hour," (2020)
18 Richard et al., "Sars-Cov-2 Is Transmitted Via Contact and Via the Air between Ferrets," Nature Communications 11, no. 1 (2020)
19 Santarpia et al., "Aerosol and Surface Contamination of Sars-Cov-2 Observed in Quarantine and Isolation Care," (2020)
20 Zhou et al., "Investigating Sars-Cov-2 Surface and Air Contamination in an Acute Healthcare Setting During the Peak of the Covid-19
Pandemic in London," (2020)
21 Shen et al., "Community Outbreak Investigation of Sars-Cov-2 Transmission among Bus Riders in Eastern China," JAMA Internal Medicine
(2020)
22 Li et al., "Evidence for Probable Aerosol Transmission of Sars-Cov-2 in a Poorly Ventilated Restaurant," medRxiv (2020)
23 Park et al., "Coronavirus Disease Outbreak in Call Center, South Korea," Emerging Infectious Disease journal 26, no. 8 (2020) Researchers have suggested that based on patterns of the epidemic spread in Iran, cooling
systems could be contributing to the spread.24
An outbreak of COVID-19 in an air-conditioned restaurant in Guangzhou, China, involved three
family clusters. The airflow direction was consistent with droplet transmission.25
SARS-CoV-2 was detected by PCR in approximately 25% of air handling units in a hospital setting
in Oregon where COVID-19 patients were being treated, but samples weren’t evaluated for viral
infectivity and there were no known transmission events associated with the units.26 The pre-
filters (MERV10), final filters (MERV15), and supply air dampers all had viral RNA detected in
some samples, with the most for pre-filters where outside air mixes with recirculated building
air.
• The European Centre for Disease Prevention and Control updated its guidance on heating, ventilation
and air-conditioning systems on 11 November 2020, with new recommendations to reduce transmission
risk based on the assumption that, under some situations, SARS-CoV-2 can travel through these systems
and the type of filter and maintenance practices can play a role in reducing transmission risk.27
Conclusion: Growing circumstantial evidence suggests that air-flow systems ‘capture’ virus that is
detectable via PCR. However, the likelihood of an air-flow system being a major factor in distributing
virus around buildings is unsupported simply because of the low number of incidents of clusters in such
settings (with the exception of cruise ships). Poor ventilation is regarded as a risk factor in the spread of
COVID-19, however the role of air handling units in this risk is unquantified and needs to be determined
in places with high viral load (e.g. the Sudima MIQ) and considered in transmission routes.
24 Pourkarim et al., "Air Conditioning System Usage and Sars-Cov-2 Transmission Dynamics in Iran," Medical Hypotheses (2020)
25 Lu et al., "Covid-19 Outbreak Associated with Air Conditioning in Restaurant, Guangzhou, China, 2020," Emerging infectious diseases 26,
no. 7 (2020)
26 Horve et al., "Identification of Sars-Cov-2 Rna in Healthcare Heating, Ventilation, and Air Conditioning Units," medRxiv (2020) Pre-print
only, not yet peer-reviewed.
27 European Centre for Disease Prevention and Control. Heating, ventilation and air-conditioning systems in the context of COVID-19. 10
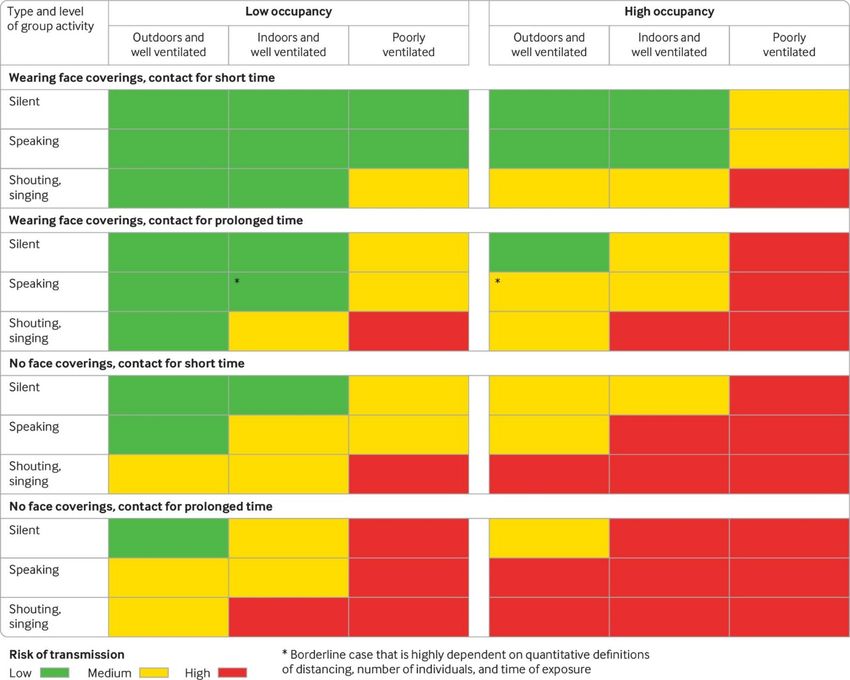
November 2020. Stockholm: ECDC; 2020Risk matrix Mitigating the risk of COVID-19 transmission requires several layers of protection, applied relative to the likelihood of infection from that route. The Jones et al. risk matrix (Figure 1) provides a traffic-light system from outdoor scenarios with low occupancy to poorly ventilated, high-occupancy scenarios. Figure 1: The risk matrix developed by Jones et al. in August 2020 provides a practical guide to how transmission risk may vary with setting, occupancy level, contact time, and whether face coverings are worn. Note these estimates apply when everyone is asymptomatic, assuming people with symptoms have self-isolated.28 28 Jones et al., "Two Metres or One: What Is the Evidence for Physical Distancing in Covid-19?," bmj 370 (2020)
References
Binder, Alarja, Robie, et al. "Environmental and Aerosolized Severe Acute Respiratory Syndrome
          Coronavirus 2 among Hospitalized Coronavirus Disease 2019 Patients". The Journal of
          Infectious Diseases (2020)
Dai, Li, Yan, et al. "Long-Term Survival of Sars-Cov-2 on Salmon as a Source for International
          Transmission". J Infect Dis (Nov 12 2020)
European Centre for Disease Prevention and Control, "Heating, Ventilation and Air-Conditioning
          Systems in the Context of Covid-19.", 2020.
Goldman. "Exaggerated Risk of Transmission of Covid-19 by Fomites". The Lancet Infectious Diseases
          20, no. 8 (2020): 892-93
Harvey, Fuhrmeister, Cantrell, et al. "Longitudinal Monitoring of Sars-Cov-2 Rna on High-Touch
          Surfaces in a Community Setting". medRxiv (2020): 2020.10.27.20220905
Horve, Dietz, Fretz, et al. "Identification of Sars-Cov-2 Rna in Healthcare Heating, Ventilation, and Air
          Conditioning Units". medRxiv (2020): 2020.06.26.20141085
Jones, Qureshi, Temple, et al. "Two Metres or One: What Is the Evidence for Physical Distancing in
          Covid-19?". bmj 370 (2020)
Lednicky, Lauzard, Fan, et al. "Viable Sars-Cov-2 in the Air of a Hospital Room with Covid-19
          Patients". International Journal of Infectious Diseases 100 (2020): 476-82
Li, Qian, Hang, et al. "Evidence for Probable Aerosol Transmission of Sars-Cov-2 in a Poorly
          Ventilated Restaurant". medRxiv (2020)
Lu, Gu, Li, et al. "Covid-19 Outbreak Associated with Air Conditioning in Restaurant, Guangzhou,
          China, 2020". Emerging infectious diseases 26, no. 7 (2020): 1628
Ma, Qi, Chen, et al. "Coronavirus Disease 2019 Patients in Earlier Stages Exhaled Millions of Severe
          Acute Respiratory Syndrome Coronavirus 2 Per Hour". Clinical Infectious Diseases (2020)
Nakamura, Morioka, Kutsuna, et al. "Environmental Surface and Air Contamination in Severe Acute
          Respiratory Syndrome Coronavirus 2 (Sars-Cov-2) Patient Rooms by Disease Severity".
          Infection Prevention in Practice 2, no. 4 (2020/12/01/ 2020): 100098
Park, Kim, Yi, et al. "Coronavirus Disease Outbreak in Call Center, South Korea". Emerging Infectious
          Disease journal 26, no. 8 (2020): 1666
Pourkarim, Thijssen, Lemey, et al. "Air Conditioning System Usage and Sars-Cov-2 Transmission
          Dynamics in Iran". Medical Hypotheses (2020)
Richard, Kok, de Meulder, et al. "Sars-Cov-2 Is Transmitted Via Contact and Via the Air between
          Ferrets". Nature Communications 11, no. 1 (2020/07/08 2020): 3496
Santarpia, Rivera, Herrera, et al. "Aerosol and Surface Contamination of Sars-Cov-2 Observed in
          Quarantine and Isolation Care". Scientific Reports 10, no. 1 (2020/07/29 2020): 12732
Shen, Li, Dong, et al. "Community Outbreak Investigation of Sars-Cov-2 Transmission among Bus
          Riders in Eastern China". JAMA Internal Medicine (2020)
Smith, Somsen, Rijn, et al. "Aerosol Persistence in Relation to Possible Transmission of Sars-Cov-2".
          Physics of Fluids 32, no. 10 (2020): 107108
World Health Organization, "Transmission of Sars-Cov-2: Implications for Infection Prevention
          Precautions: Scientific Brief, 09 July 2020." 2020.
Zhou, Otter, Price, et al. "Investigating Sars-Cov-2 Surface and Air Contamination in an Acute
          Healthcare Setting During the Peak of the Covid-19 Pandemic in London". Clinical Infectious
          Diseases (2020)
You can also read