Socio-Territorial Inequities in the French National Breast Cancer Screening Programme-A Cross-Sectional Multilevel Study
←
→
Page content transcription
If your browser does not render page correctly, please read the page content below
cancers
Article
Socio-Territorial Inequities in the French National Breast
Cancer Screening Programme—A Cross-Sectional
Multilevel Study
Quentin Rollet *, Élodie Guillaume, Ludivine Launay and Guy Launoy

                                           Centre François Baclesse, U1086 “ANTICIPE” INSERM, University of Caen Normandie, 3, Avenue du Général
                                           Harris, 14000 Caen, France; elodie.guillaume@unicaen.fr (É.G.); ludivine.launay@unicaen.fr (L.L.);
                                           guy.launoy@unicaen.fr (G.L.)
                                           * Correspondence: quentin.rollet@inserm.fr

                                           Simple Summary: France implemented a national breast cancer screening programme in 2004, which,
                                           despite recommendations, still coexists with opportunistic screening practices. We aimed to study
                                           socio-territorial inequities in participation in the 2013–2014 screening campaign, using multilevel
                                           models. With a representative sample of 42% of the estimated eligible population, we found that the
                                           organized programme does not erase social or territorial inequities in participation. Social inequities,
                                           at multiple levels, were found in nearly all départements, whereas territorial inequities seemed more
                                           context dependent. The impact of the coexistence with opportunistic screening, beyond any control
                                           and evaluation, is adding more risks (over-diagnosis, over-treatment) and leads to underestimating
                                           the true coverage of the population, mainly in the wealthiest, therefore leading to an underestimation

                                    of the true social gradient in participation. The French breast cancer screening programme needs
                                           to evolve to be more efficient in coverage, notably through the reduction of the unfair inequities
Citation: Rollet, Q.; Guillaume, É.;
                                           in participation.
Launay, L.; Launoy, G. Socio-Territorial
Inequities in the French National
Breast Cancer Screening
                                           Abstract: Background. France implemented in 2004 the French National Breast Cancer Screening
Programme—A Cross-Sectional                Programme (FNBCSP). Despite national recommendations, this programme coexists with non-
Multilevel Study. Cancers 2021, 13,        negligible opportunistic screening practices. Aim. Analyse socio-territorial inequities in the 2013–
4374. https://doi.org/10.3390/             2014 FNBCSP campaign in a large sample of the eligible population. Method. Analyses were
cancers13174374                            performed using three-level hierarchical generalized linear model. Level one was a 10% random
                                           sample of the eligible population in each département (n = 397,598). For each woman, age and travel
Academic Editor: Stefan Ambs               time to the nearest accredited radiology centre were computed. These observations were nested
                                           within 22,250 residential areas called “Îlots Regroupés pour l’Information Statistique” (IRIS), for
Received: 6 July 2021
                                           which the European Deprivation Index (EDI) is defined. IRIS were nested within 41 départements, for
Accepted: 27 August 2021
                                           which opportunistic screening rates and gross domestic product based on purchasing power parity
Published: 30 August 2021
                                           were available, deprivation and the number of radiology centres for 100,000 eligible women were
                                           computed. Results. Organized screening uptake increased with age (OR1SD = 1.05 [1.04–1.06]) and
Publisher’s Note: MDPI stays neutral
                                           decreased with travel time (OR1SD = 0.94 [0.93–0.95]) and EDI (OR1SD = 0.84 [0.83–0.85]). Between
with regard to jurisdictional claims in
published maps and institutional affil-
                                           départements, organized screening uptake decreased with opportunistic screening rate (OR1SD = 0.84
iations.                                   [0.79–0.87]) and départements deprivation (OR1SD = 0.91 [0.88–0.96]). Association between EDI
                                           and organized screening uptake was weaker as opportunistic screening rates and as département
                                           deprivation increased. Heterogeneity in FNBCSP participation decreased between IRIS by 36% and
                                           between départements by 82%. Conclusion. FNBCSP does not erase socio-territorial inequities. The
Copyright: © 2021 by the authors.
                                           population the most at risk of dying from breast cancer is thus the less participating. More efforts are
Licensee MDPI, Basel, Switzerland.         needed to improve equity.
This article is an open access article
distributed under the terms and            Keywords: early detection of cancer; breast neoplasms; organized screening programme; opportunis-
conditions of the Creative Commons         tic screening; health-care disparities; social deprivation
Attribution (CC BY) license (https://
creativecommons.org/licenses/by/
4.0/).

Cancers 2021, 13, 4374. https://doi.org/10.3390/cancers13174374                                            https://www.mdpi.com/journal/cancers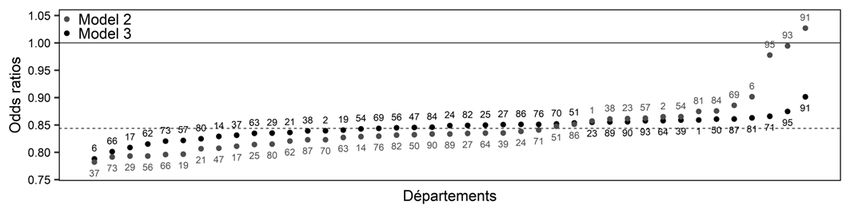
Cancers 2021, 13, 4374                                                                                             2 of 17

                         1. Introduction
                               Worldwide, one in six deaths is due to cancer. Breast cancer (BC), despite being mostly
                         a female disease (less than 1% occurs in men), has now surpassed lung cancer as the most
                         frequently diagnosed cancer, all sexes combined, with 2.3 million cases in 2020. With
                         685,000 deaths the same year, it ranked fifth for the most common cause of cancer death
                         all sexes combined, and first in women [1]. In France, after a stabilization between 2003
                         and 2010, incidence has increased again during 2010–2018. In contrast, mortality slowly
                         decreased between 1990 and 2018. Therefore, in 2018, BC was the most diagnosed cancer
                         (58,459 new cases) and ranked third in mortality all sexes combined, and first in women
                         (12,146 deaths) [2].
                               To control BC mortality [3], France has implemented in 2004 the French National
                         Breast Cancer Screening Programme (FNBCSP). The ambition of screening is to detect the
                         disease at an early stage to improve its prognosis via more effective treatment. This is a
                         national population-based programme targeted towards women aged 50–74 with medium
                         risk of BC (no familial or personal history of the disease, no genetic disposition, and no
                         symptoms of BC). Eligible population is invited, every two years, to perform a free of charge
                         screening mammography and a clinical breast exam in an accredited radiology centre of
                         her living (and sometimes bordering) département (an administrative division of France).
                         Once performed, a double reading is ensured for each negative mammogram. At the time
                         of our study, FNBCSP territorial organization was led at the département level by screening
                         management structures. One of many performance indicators regarding an organized
                         screening programme is the participation-to-invitation rate, evaluated “acceptable” at
                         70% by the European Commission to significantly reduce mortality [4]. According to
                         Santé Publique France, the French national public health agency in charge of evaluating the
                         FNBCSP, participation reached a peak of 52.4% in 2011–2012, then slowly decreased to
                         48.6% in 2018–2019 [5].
                               Despite the National recommendations [6], this screening programme co-exists with
                         opportunistic screening, where mammography realization depends on medical prescrip-
                         tion by health-care providers (mostly general practitioners or gynaecologists). It is not
                         recommended as it does not ensure double-reading that is performed in an accredited radi-
                         ology centre, is not free of charge, and is not under enough monitoring to allow sufficient
                         evaluation.
                               Beyond participation, another aim of the FNBCSP is to ensure equity of access to
                         screening [7]. Multiple publications have shown that this goal was not reached, with
                         individual factors associated with lower participation, such as poor socioeconomic sta-
                         tus [8–12], poor health [11,13] or healthcare system barriers [10–12,14]. Territorial inequities
                         have also been reported, with lower screening rates among eligible women living further
                         from the accredited radiology centres [15,16]. In recent years, attention has also increased in
                         the association between area-based deprivation and participation. Higher deprivation was
                         associated with lower participation in the FNBCSP in two départements (over 101) [15,17],
                         and in a representative sample of the eligible population covered by the three main health
                         insurance schemes in thirteen départements [16]. In metropolitan France (95 départements),
                         an ecological study found a more complex relation between participation and deprivation,
                         described as an “inverse U-curve” [18], but lacked individual data and used population
                         estimates for outcome assessment.
                               In this context, we aimed to evaluate socio-territorial inequities in the FNBCSP 2013–
                         2014 campaign by studying individual and contextual factors in a single model, in a large
                         sample of the eligible population residing in 41 départements of metropolitan France.

                         2. Materials and Methods
                             Redaction of this article follows the Strengthening the Reporting of Observational
                         Studies in Epidemiology guidelines [19].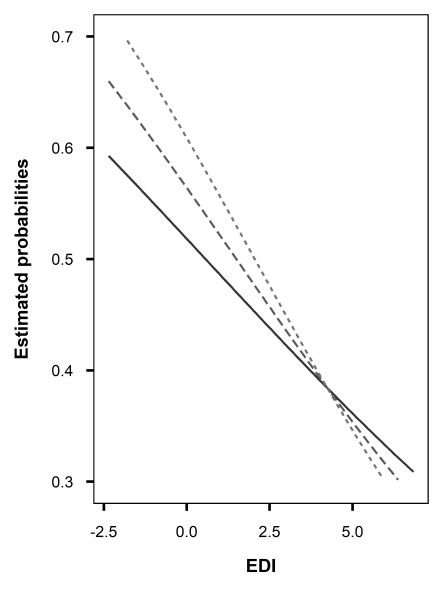
Cancers 2021, 13, x FOR PEER REVIEW 3 of 16
Cancers 2021, 13, 4374 3 of 17
2.1. Population and Sample
Screening management structures were invited to send their data regarding the 2013–
20142.1.
invitation
Populationcampaign.
and SampleParticipation of the structures was on a voluntary basis. These
data corresponded to the follow-up
Screening management of the
structures were FNBCSP
invited to sendand
theirincluded eligible
data regarding the women’s
2013–
addresses
2014 invitation campaign. Participation of the structures was on a voluntary basis. These age
of residence, dates of birth, dates of invitation (from which we computed
at invitation), and whether
data corresponded they performed
to the follow-up a mammography
of the FNBCSP screening
and included eligible through
women’s ad- the
FNBCSP
dressesinofthe two years
residence, following
dates of birth,invitation. We received
dates of invitation (from 4,236,066
which we observations
computed agenestedat
invitation), and whether they performed a mammography screening
in 41 départements. Data management was performed, leaving 4,001,225 (94%) unique through the FNBCSP
in the
eligible two years
women, 42%following invitation.
of the estimated We received
eligible 4,236,066
population observations
in France. nested in 41
Before geolocalisation,
we départements.
performed a Data management
stratified randomwas performed,
sampling leaving 4,001,225
by drawing 10% of the (94%) unique
eligible eligible in
population
women, 42% of the estimated eligible population in France. Before geolocalisation, we
each département (n = 400,125). Comparisons between samples and départements’
performed a stratified random sampling by drawing 10% of the eligible population in each
populations (data not shown) showed no important differences in participation rates
département (n = 400,125). Comparisons between samples and départements’ populations
(from
(data0 not
to 1.6%
shown) difference)
showed noand age (no
important differences
differences exceeded ¼
in participation years
rates (fromin 0mean
to 1.6%age).
Additional
difference)exclusions
and age (no were performed
differences due toyears
exceeded 1 geolocalisation
in mean age).and after geolocalisation.
Additional exclusions
4
Final sample
were consisted
performed due toof 397,598 women.
geolocalisation Flow
and after chart of the Final
geolocalisation. population is available
sample consisted of in
Figure 1. women. Flow chart of the population is available in Figure 1.
397,598
Initial data
n = 4,236,066 1. DATA MANAGEMENT
• Duplicates: n = 226,598
• Ineligible dates
Study period: n = 5349
Mammography realisation: n = 144
• Living in another département: n = 2750
Eligible women
n = 4,001,225 2. SAMPLING
• 10% of each département
Sample size
n = 400,125 3. GEOLOCALISATION
• Ungeocodable addresses: n = 1921
• Living in another département: n = 606
Final sample
n = 397,598
Figure 1. Flow chart of the population.
Figure 1. Flow chart of the population.
2.2. Variables
2.2. Variables
Level 1—Individual level (n = 397,598)
• Level
Age1—Individual
at invitation level (n = 397,598)
• • Age
Travel time to the nearest accredited radiology centre
at invitation
• Travel time to the nearest accredited radiology centre
We asked screening management structures which centres were active on the period.
All these centres have been geocoded. The travel time to the nearest accredited radiology
centre (NARC) was computed for all individuals using Navstreets© V14.0 data (ESRI, 21,
rue des Capucins 92195 Meudon Cedex, France; Navmart, 8400 E Crescent Pkwy Suite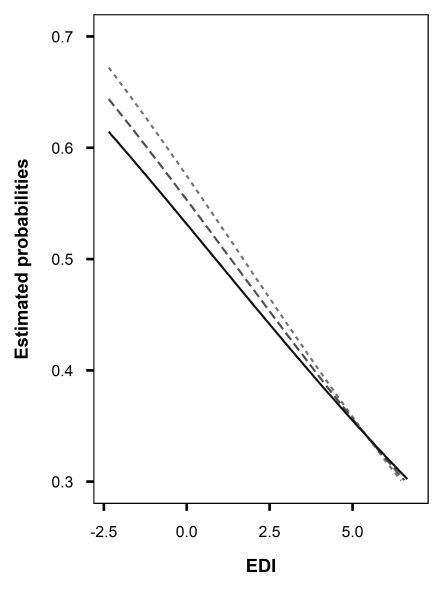
Cancers 2021, 13, 4374                                                                                            4 of 17

                              We asked screening management structures which centres were active on the period.
                         All these centres have been geocoded. The travel time to the nearest accredited radiology
                         centre (NARC) was computed for all individuals using Navstreets© V14.0 data (ESRI, 21,
                         rue des Capucins 92195 Meudon Cedex, France; Navmart, 8400 E Crescent Pkwy Suite 652,
                         Greenwood Village, CO 80111, United States), using the Network Analyst extension of
                         ArcGIS© PRO software (ESRI, 21, rue des Capucins 92195 Meudon Cedex, France).
                              Level 2—IRIS level (n = 22 250)
                         •    French version of the European Deprivation Index (EDI)
                              Thanks to geolocalisation, each woman was allocated to her residential IRIS (Îlots
                         Regroupés pour l’Information Statistique), the smallest geographical unit for which census data
                         is available. They are either neighbourhood proxies in all municipalities with more than
                         10,000 inhabitants and in most municipalities with more than 5000, and to the municipalities
                         themselves in other cases. Each of these IRIS correspond to an EDI score [20], computed
                         with the 2011 census data. Briefly, this ecological index is based on fundamental needs
                         associated with both objective and subjective poverty, a higher EDI score reflecting higher
                         deprivation in the area.
                              Level 3—Département level (n = 41)
                         •    Opportunistic screening
                              Opportunistic screening practices are not routinely collected at the individual level.
                         We used the estimations from Santé Publique France [21], computed using the national health
                         data system for the population of women aged 50–75 in 2013–2014. They defined these data
                         as a “crude indicator”, because of the impossibility to differentiate opportunistic screening
                         from mammography following clinical anomalies, or a follow-up mammogram for high-
                         risk women. Numeric values might suffer from imprecisions; it should be interpreted as a
                         proxy for the propensity of the population to resort to opportunistic screening procedures.
                         •    Care offer
                              The number of accredited radiology centres for 100,000 eligible women was calculated
                         for each département.
                         •    Département socioeconomic level
                              Two indicators have been used in this study. The first one, income-based, was the
                         gross domestic product per capita based on purchasing power parity (GDP-PPP) in 2015
                         according to the OECD statistics [22]. The second, deprivation-based, was the population
                         mean of the EDI by département, entitled “département deprivation” for the rest of the
                         document.

                         2.3. Statistics
                         2.3.1. Centring and Standardization
                              All variables have been centred for interpretational reasons and standardized for
                         computational reasons. For the rest of the document, a reference individual will be an
                         individual for which all variables are equal to their mean, and the variable’s effect size for
                         an increase of one standard deviation.

                         2.3.2. Model Building
                               Eligible women were nested in the IRIS, themselves nested in the départements. To get
                         an accurate modelling of the probability of FNBCS participation according to individuals
                         and area characteristics, multivariate hierarchical generalized linear model was used. The
                         statistical models were built level by level, by increasing complexity. The first model
                         presented (Model 0) is the “null model”, a model without any explanatory variable, only
                         composed of fixed and random intercepts. Second model (Model 1) was built by adding
                         level 1 variables’ fixed effects and testing random slopes at higher levels. Third (Model
                         2) and final (Model 3) models were built on the same logical steps, with the addition of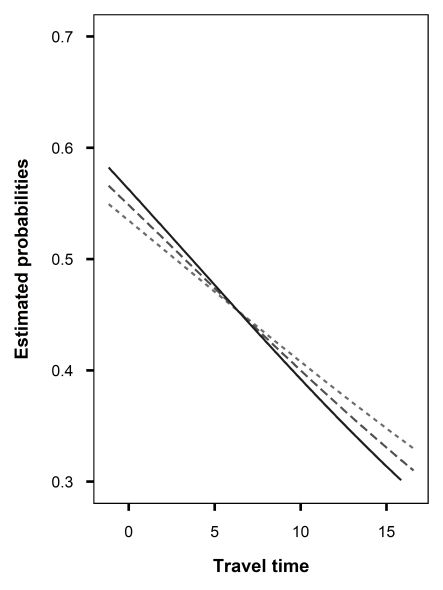
Cancers 2021, 13, 4374                                                                                                              5 of 17

                         testing for cross-level interactions. Model selection was done by comparing deviance using
                         ANOVA, and variance confidence intervals were computed using bootstrap.

                         2.3.3. Additional Measures
                              To give an easier interpretation of the random intercepts variance, we computed the
                         variance partition coefficient (VPC) [23] using the threshold latent variable hypothesis [24]
                         and the proportional change of the variance (PCV) [25]. Random slopes models and random
                         effects’ correlations implies that between-group variance is a function of the variables with
                         random coefficients [26]. When a random slope is included, the variance reported in the
                         table is the variance for a mean individual, and we plotted the more complex variation
                         according to lower-level variables. These are quadratic functions; variance of extreme
                         values should thus be interpreted with caution. R version 4.0.0 was used for analyses and
                         artworks.

                         3. Results
                         3.1. Population
                              Description of the population is available in Table 1 and list of participating départements,
                         sample sizes and participation rates are available in Table S1. Overall participation was
                         55%, with marked disparities between départements (from 40.8% in Essonne and Seine-Saint-
                         Denis to 68.3% in Indre-et-Loire). We illustrated univariate analyses of the relation between
                         FNBCSP participation, EDI and travel time by département (Figures S1 and S2). Briefly,
                         participation by population’s quintiles of the EDI followed a strong pattern, with lower
                         participation as deprivation increased in almost all départements. Participation by travel
                         time was less straightforward. It was lower among the very close population than for those
                         who live a little further away. Then, participation seemed to decrease as distance increased.

                         Table 1. Characteristics of the population.

                                Level 1—Individual                               Standard
                                                               Mean                                   Minimum            Maximum
                                       Level                                     Deviation
                              Travel time (minutes)             8.70                7.47                  0.00              132.48
                              Age (years)                      60.73                7.11                   50                 74
                                       a
                              FNBCSP participation
                                                               55.06                  /                    /                  /
                              (%)
                              Level 2—IRIS b
                              EDI c,d (dimensionless)           0.97                5.12                −11.08              35.96
                              Level 3—Départements
                              Opportunistic screening
                                                                8.91                6.06                  2.30              28.00
                              rates (%)
                              Mean of EDI c,d
                                                                0.97                2.29                 −1.67               9.63
                              (dimensionless)
                              GDP (PPP) e per capita
                                                               20,638               6134                17,310              23,360
                              (US$)
                              Number of accredited
                              radiology centres/100,000        21.88                8.55                  7.69              59.06
                              eligible women
                         a.French national breast cancer screening programme, b . Îlots regroupés pour l’information statistique, c . Eu-
                         ropean Deprivation Index, d . Population weighted, e . Gross-domestic product based on purchasing power
                         parity.
Cancers 2021,13,
Cancers2021, 13,4374
x FOR PEER REVIEW 66of
of17
16
3.2.
3.2. Results
All
All model
model results
results are
are described
described in
in Table
Table2.2.
•• Model 0:
Model 0: There
There was
was heterogeneity
heterogeneity in inFNBCSP
FNBCSPparticipation
participation(i.e.,
(i.e., random
random intercepts
intercepts
variance) around the fixed intercept (OR = 1.32 [1.22–1.45]) at both IRIS (σ
variance) around the fixed intercept (OR = 1.32 [1.22–1.45]) at both IRIS (σ22 == 0.055; 0.055;
VPC = 1.6%) and département levels (σ22 = 0.082; VPC = 2.4%). Shrunken residuals used
VPC = 1.6%) and département levels (σ = 0.082; VPC = residuals used
to estimate
to estimate these
these variances
variances are
are illustrated
illustratedin inFigure
Figure2a,b
2a,b(Model
(Model0).
0).
(a)—Random intercepts at the IRIS level (probability scale)
(b)—Random intercepts at the départements level (probability scale)
(c)—Random slopes for age at the départements level (Odds ratio scale)
Figure 2. Cont.Cancers
Cancers 2021,
2021, 13, x FOR PEER REVIEW
13, 4374 7 of 1617
7 of
Cancers 2021, 13, x FOR PEER REVIEW 7 of 16
(d)—Random slopes for travel time at the départements level (Odds ratio scale)
(d)—Random slopes for travel time at the départements level (Odds ratio scale)
(e)—Random slopes for EDI at the départements level (Odds ratio scale)
Figure
Figure2. Illustrations
2. Illustrationsof the random
of the random effects. (a) (a)
effects. Random
Random intercepts at the
intercepts IRISIRIS
at the levellevel
(probability scale),
(probability (b) Random
scale), intercepts
(b) Random at
intercepts
the (e)—Random
départements level slopes
(probability at the(c)départements
for EDIscale), Random slopes levelfor age atratio
(Odds the scale)
départements level (Odds ratio scale), (d) Random slopes
at the départements level (probability scale), (c) Random slopes for age at the départements level (Odds ratio scale), (d) Random
forFigure
travel time at the départements leveleffects.
(Odds (a)
ratio scale), (e) Random slopes forlevel
EDI(probability
at the départements
scale), level (Odds ratio scale)
slopes 2.forIllustrations
travel timeofatthe random
the départements Random
level (Odds intercepts
ratio scale),at(e)
theRandom
IRIS slopes for EDI at (b)
theRandom intercepts
départements levelat(Odds
the départements level (probability scale), (c) Random slopes for age at the départements level (Odds ratio scale), (d) Random slopes
ratio scale). • levelModel
for travel time at the départements (Odds ratio scale), (e)FNBCSP
1: Overall, Random slopes the départements
for EDI at increased
participation withlevel (OR ratio
age(Odds scale)
= 1.05 [1.03–1.07])
• and decreased
Model 1: Overall, with travel participation
FNBCSP time (OR = 0.98 [0.96–0.99]).
increased with Asageshown
(OR =by 1.05the[1.03–1.07])
random
• andModel
slopes, 1: Overall,
and
decreased with FNBCSP
illustrated travel participation
in Figure
time 2c,d
(OR(Model increased
= 0.98 1), with age
strength
[0.96–0.99]). (ORshown
of these
As =effects
1.05 by
[1.03–1.07])
varied across
the random
and decreased
départements,
slopes, inwith
suchtravel
and illustrated ainway time (OR
that2c,d
Figure =relation
0.98 [0.96–0.99]).
the(Model was
1), As
of shown
insignificant
strength by
theseoreffectsthevaried
reversed random
in some
across
slopes,
cases. and
Random illustrated
effects in Figure 2c,d
correlations (Model
showed 1), strength
that of these
départements
départements, in such a way that the relation was insignificant or reversed in some effects
with varied
higher across
intercepts
départements,
tended to have in asuch a wayeffect
stronger that the relationtime
forshowed
travel wasand insignificant
a weaker or reversed
effect for in some
age. It led to
cases. Random effects correlations that départements with higher intercepts
cases. Random effects correlations showed that départements with higher intercepts
tended to have a stronger effect for travel time and a weaker effect for age. It to
higher heterogeneity between départements for younger women and those closest led
tended to have a stronger effect(Figure
for travel
3a,btime and a1)).weaker effect
wasfor age. It led tobe-
toand furthest
higher from
heterogeneity the NARCbetween départements (Model
for younger There women anand
interaction
those closest
higherage
totween
heterogeneity
and furthestand travel
from the
between (ORdépartements
timeNARC = 0.99 for younger
[0.98–1.00]),
(Figure 3a,b (Model
womeninand
illustrated
1)). There
those closest to
Figure
was4a.an interaction
and furthest from the NARC (Figure 3a,b (Model 1)). There was an interaction be-
between age and travel time (OR = 0.99 [0.98–1.00]), illustrated
tween age and travel time (OR = 0.99 [0.98–1.00]), illustrated in Figure 4a. in Figure 4a.
(a)—Départements variance according to (b)—Départements variance according to (c)—Départements variance according to
(a)—Départements variance according to travel
age (b)—Départements
time —Départements variance according to
variance according to (c)EDI
age travel time EDI
Figure 3. Variance between départements according to lower-level variables. (a) Départements variance according to age, (b)
Figure 3. Variance
Départements variancebetween départements
according according
to travel time, to lower-level
(c) Départements variables.
variance (a) Départements
according to EDI variance according to age, (b)
Figure 3. Variance between départements according to lower-level variables. (a) Départements variance according to age,
Départements variance according to travel time, (c) Départements variance according to EDI
(b) Départements variance according to travel time, (c) Départements variance according to EDI.s 2021, 13, x FOR PEER REVIEW 9 of 16
Cancers 2021, 13, 4374 8 of 17
Moderator
−1 σ
(a)—Travel time and age (b)—Age and opportunistic screening Mean
+1 σ
(c)—EDI and opportunistic screening (d)—EDI (IRIS) and EDI (départements)
Figure
Figure4.4.Interactions
Interactionsininthe
thefinal
finalmodel.
model.(a)
(a)Travel
Traveltime
timeand
andage,
age,(b)
(b)Age
Ageand
andopportunistic
opportunistic screening,
screening, (c)
(c) EDI and
EDI and opportunistic screening, (d) EDI (IRIS) and EDI (dé
opportunistic screening, (d) EDI (IRIS) and EDI (départements). partements)
• Model 2: Overall, an increase in EDI was associated with lower probability of FNBCS
participation (OR = 0.84 [0.82–0.86]). Accounting for EDI reduced travel time effect
heterogeneity (Figure 3b (Model 2)). As shown by the random slope and illustrated in
Figure 2e, strength of the association between EDI and FNBCSP participation varied
across départements, but few had a weak relationship. Random effects correlations
showed that départements with higher random intercepts tended to have a stronger ef-
fect of EDI. It led to more heterogeneity in FNBCSP participation among the wealthiest
women, and, to a lesser extent, the most deprived (Figure 3c (Model 2)). Accounting
for EDI also reduced random intercepts variances at IRIS and département levels by
34% (Figure 2a (Model 2) and 12.2%.Cancers 2021, 13, 4374 9 of 17
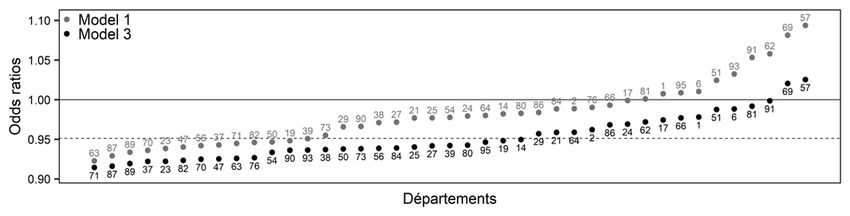
• Model 3: FNBCSP participation was lower as départements’ opportunistic screening
rates (OR = 0.84 [0.79–0.87]) and départements’ deprivation (OR = 0.91 [0.88–0.96])
increased. There were cross-level interactions between opportunistic screening rates
and both age (OR = 1.02 [1.01–1.04]) and EDI (OR = 1.04 [1.03–1.06]). As illustrated in
Figure 4b,c, FNBCSP participation in départements with high opportunistic screening
rates was lower as age and deprivation decreased. There was a cross-level interac-
tion between départements’ deprivation and EDI (OR = 1.02 [1.00–1.03]), with lower
participation as deprivation decreased (Figure 4d). These effects reduced the remain-
ing variance across départements by 79.2% (Figure 2b (Model 3)). They also strongly
reduced heterogeneities between départements in the strength of the effects of age,
travel time and EDI (Figure 2c–e (Model 3)). In addition, random effects correlations
were reduced to statistical insignificance. Unexplained remaining variances between
départements were thus independent of the lower-level variables. (Figure 3a–c (Model
3)). GDP-PPP and the number of radiology centres per 100,000 eligible women were
not associated with FNBCSP participation.Cancers 2021, 13, 4374 10 of 17
Table 2. Individual and contextual factors associated with French National Breast Cancer Screening Programme participation.
Model 0: Empty Model Model 1: Level 1 Variables Model 2: Level 2 Variable Model 3: Level 3 Variables
Level 1—Individuals
Intercept 1.32 [1.22–1.45] 1.35 [1.24–1.47] 1.32 [1.22–1.43] 1.32 [1.27–1.37]
Age / 1.05 [1.03–1.07] 1.05 [1.03–1.07] 1.05 [1.04–1.06]
Travel time / 0.98 [0.96–0.99] 0.95 [0.93–0.96] 0.94 [0.93–0.95]
Age × travel time / 0.99 [0.98–1.00] 0.99 [0.98–1.00] 0.99 [0.98–1.00]
Level 2—IRIS
Fixed effects
EDI / / 0.84 [0.82–0.86] 0.84 [0.83–0.85]
Random effects
Random intercept (σ2 0I ) 0.055 [0.048–0.058] 0.053 [0.048–0.058] 0.035 [0.030–0.039] 0.035 [0.031–0.039]
VCP 1.60% 1.55% 1.03% 1.05%
PCV (compared with empty model) / −3.64% −36.36% −36.36%
Level 3—Départements
Fixed effects
Individual screening rates / / / 0.84 [0.79–0.87]
Deprivation / / / 0.91 [0.88–0.96]
Cross-level interactions
Individual screening rates × Age / / / 1.02 [1.01–1.04]
Individual screening rates × EDI / / / 1.04 [1.03–1.06]
Mean of EDI × EDI / / / 1.02 [1.00–1.03]
Random effects
Random intercept (σ2 0D ) 0.082 [0.053–0.130] 0.082 [0.048–0.123] 0.072 [0.044–0.108] 0.015 [0.007–0.021]
VPC 2.39% 2.39% 2.12% 0.45%
PCV (compared with empty model) / 0% −12.20% −81.71%Cancers 2021, 13, 4374 11 of 17
Table 2. Cont.
Model 0: Empty Model Model 1: Level 1 Variables Model 2: Level 2 Variable Model 3: Level 3 Variables
Age random slope (σ2 1D ) / 2.3 × 10⁻³ [1.2 × 10⁻³ –3.7 × 10⁻³ ] 2.3 × 10⁻³ [1.2 × 10⁻³ –3.6 × 10⁻³ ] 1.4 × 10⁻³ [5.3 × 10⁻⁴ –2.2 × 10⁻³ ]
Travel time random slope (σ2 2D ) / 2.1 × 10⁻³ [1.0 × 10⁻³ –3.4 × 10⁻³ ] 1.4 × 10⁻³ [5.3 × 10⁻⁴ –2.3 × 10⁻³ ] 1.2 × 10⁻³ [4.0 × 10⁻⁴ –2.2 × 10⁻³ ]
EDI random slope (σ2 3D ) / / 4.1 × 10⁻³ [1.8 × 10⁻³ –6.7 × 10⁻³ ] 1.1 × 10⁻³ [1.0 × 10⁻⁴ –1.8 × 10⁻³ ]
Random effects correlation
σ2 0D, σ2 1D / −0.55 [−0.77; −0.19] −0.55 [−0.78; −0.23] −0.18 [−0.57; 0.23]
σ2 0D, σ2 2D / −0.60 [−0.83; −0.31] −0.71 [−0.94; −0.42] −0.32 [−0.67; 0.13]
σ2 0D, σ2 3D / / −0.76 [−0.91; −0.54] −0.03 [−0.65; 0.59]
σ2 1D, σ2 2D / 0.49 [0.12; 0.82] 0.68 [0.34; 0.95] 0.55 [0.10; 0.93]
σ2 1D, σ2 3D / / 0.43 [0.08; 0.75] −0.04 [−0.72; 0.70]
σ2 2D, σ2 3D / / 0.60 [0.17; 0.89] −0.09 [−0.87; 0.52]
Deviance 536,474 535,848 534,615 534,549Cancers 2021, 13, 4374 12 of 17
4. Discussion
In this large sample of eligible women for the 2013–2014 screening campaign, our
results strengthen the converging findings that the FNBCSP produces both territorial and
social inequities in participation. Our findings about the effect of travel time are coherent
with other studies led in France [15,16], while results are more nuanced at an interna-
tional level [27]. Its strength varied across départements, but accounting for deprivation
and opportunistic screening rate patterns reduced this heterogeneity. The effect of travel
time was stronger as age increased. We found no other publication studying this effect,
thus further work is needed to appreciate its robustness. The number of radiology cen-
tres for 100,000 eligible women by département was not associated with screening uptake,
in accordance with previous results [17]. Results are more nuanced at an international
level [27]. Measure of specific care accessibility through this density may not be sufficient.
More complete measures of accessibility (including social isolation, public transport avail-
ability, women’s travel possibilities or radiology centres characteristics) might be more
informative. Our findings about EDI are in line with other studies using this index [15,16],
Townsend index [17], or individual socioeconomic status [8–12]. The effect of deprivation
on screening has also been reported multiple times, in multiple settings [27]. We did not
find the “inverse U-curve” reported on the same screening campaign [18]. Multiple factors
could explain this difference: the indexes used (FDEP [28] and EDI), their level of measure
(municipalities and IRIS), the level of outcome assessment (municipality and individual) or
differences in population (estimated and eligible–95 and 41 départements). However, we
made the same observation that strength of social inequities varied across départements.
Whereas participation among the most deprived was lower, but more comparable between
départements, participation among the wealthiest was higher but more heterogeneous. We
identified two factors explaining this heterogeneity. Firstly, participation to the FNBCSP
was lower in départements with high opportunistic screening rates, mostly for the wealthiest.
It has been reported that wealthiest populations tend to participate more to opportunistic
screening [29–31]. Studies have also shown that opportunistic screening is more socially
stratified than organized screening [32,33]. Moreover, it is most often a screening pre-
scription by the general practitioner or gynaecologist [10,30], and France displays high
income inequities in visiting both [8]. More aggressive breast tumours are more likely to be
identified through their clinical manifestation, and could explain why some women could
be led to opportunistic screening by the general practitioner or gynaecologist. We found
no study in France linking tumour aggressiveness according to deprivation, but a study
led in Denmark [34] showed that women with less education or lower income had higher
risks of being diagnosed with a high-risk breast cancer. If this is also the case in France,
we should observe the opposite effect (i.e., more participation in opportunistic screening
as deprivation increases). Breast cancer incidence is higher for the wealthiest [35], which
could justify a more intensive and individual follow-up for these women and their relatives.
However, the size of this effect is low, and cannot explain such differences in opportunistic
screening participation. Opportunistic screening, by competing with the FNBCSP, is thus
one of the factors explaining low participation, and could hide a stronger social gradient in
eligible population coverage. Secondly, participation was lower as départements’ depriva-
tion increased, here again with a stronger effect among the wealthiest. Although interesting,
these results should be taken with caution as this is the first time that this measure was
used—further work is needed in understanding deprivation patterns as well as robustness
of these findings. The GDP-PPP was not associated with participation—this income-based
socioeconomic status may not carry sufficient information to identify social inequities
in FNBCSP participation. On note, neither social nor territorial inequities were found
in a population having the possibility to choose between radiology centres and mobile
mammography units [15]. In agreement with other publications [15,16,29,30,36], overall
participation to the FNBCSP increased with age. Strength of this association varied across
départements, with lower rates of screening uptake among the youngest in départements with
higher opportunistic screening rates. This is consistent with other studies, showing thatCancers 2021, 13, 4374 13 of 17
individual screening is mostly used by younger women [29,37], often starting before the
recommended age range [36]. Lack of data on opportunistic screening leads to underesti-
mating the true screening coverage, more importantly among the youngest. In the final
model, the unexplained differences in FNBCSP participation between areas were reduced,
mostly between départements (−82%) and to a lower extent between IRIS (−36%). We also
explained most of the heterogeneities in the effects of age, travel time and EDI. Other stud-
ies are needed to find the factors influencing these remaining disparities. It should be noted
that most of the heterogeneity in participation resided between individuals, with a total
variance partition coefficient of 4% inside our levels (using the latent variable hypothesis).
This study has multiple strengths. First, with a representative sample of 42% of
the estimated eligible population, this is the largest study about screening uptake using
individual data led in France. In addition, collaboration with screening management
structures allowed great accuracy in the study population. Even if, by default, homeless
populations and women who recently moved are excluded, it can still be assumed that the
invited population represents most of the eligible population. Additionally, départements’
samples and populations did not differ greatly in age and participation to the FNBCSP.
Although it does not guarantee representativeness, any major systematic differences would
be unfortunate. High-precision geocoding for both women and radiology centres allowed
to enrich screening database by adding travel time to the nearest accredited radiology
centre and area-based deprivation measures. Finally, we tried to get the most out of
multilevel models—which are particularly appropriate for nested data and contextual
measures.
Some limitations also need to be addressed. By combining our 10% sample design
and the unbalanced populations defined by the administrative boundaries of the IRIS,
half of the IRIS had a population of less than 10 eligible women. Although it has been
argued that the most important factor in multilevel analyses is the number of higher-level
units [38], this could be of importance in estimating the model parameters. We excluded
radiology centres from bordering départements because of poor data quality and did not
account for opening and closing dates because of insufficient data. Radiology centres
database needs to be created and updated by the public health authorities. We chose travel
time from home to the nearest accredited radiology centre, but it is unknown whether it
is the one chosen by eligible women, especially when accounting that a portion of them
are professionally active. The data are not the most recent, but designing this study, the
first of its kind, needed time (from recruiting screening management structures, getting
ethical approval, acquisition of screening and radiology centre data, to geolocalisation,
analyses and publication). However, updating the results on more recent campaigns using
the same methodology could be done in a shorter time. The use of area-based deprivation
index is known to raise the question of whether they act as a proxy for the individual
status (e.g., people with high deprivation in these areas have their decision shifted towards
no) and/or as contextual factors (e.g., living in an area with high deprivation shifts the
decision of all its population towards no). It has been argued that adjusting for individual
characteristics would help detangle these effects [39], but these data are not routinely
collected. Finally, area-based deprivation is defined based on all population in these areas,
while our population is age-gender-specific.
This work includes 41 départements. Even if screening organisation is the same in all
French départements, our results may not be generalizable for all metropolitan France, espe-
cially for the départements of Paris and the Hauts-de-Seine, known to be the least participative
in organized screening and in the most participative to opportunistic screening; in the
island-département of Corse, with its particular geographical situation; and in the département
of Orne, where a mobile mammographic unit is part of the screening programme. However,
participation rates are very comparable between the départements in this study and the
remaining French départements [5]. This study shows that it is logistically doable to develop
a methodology which could be replicated to the whole metropolitan country. These results
are also not generalizable to overseas départements for which the global context is quiteCancers 2021, 13, 4374 14 of 17
different, and EDI might be inappropriate. Finally, this study evaluates only one screening
campaign, and it is impossible to assert that every campaign suffers from the same pitfalls.
However, our findings are in line with studies on other campaigns, and little has been done
in targeting inequities in the FNBCSP. It is thus probable that inequities accumulate all
along screening life, which could lead to a high loss of opportunities for some populations.
In 2017, nearly all EU members had population-based BC screening programmes [40]. In
a lot of them, coverage and participation remained low, and social inequities have often
been reported, whether individual [41] or contextual [27,42]. Unfortunately, comparisons
between these results and our findings are difficult because of the strong heterogeneity
across measures and methodologies. EDI has been developed to be computable and com-
parable across all European countries and has already been developed in Spain, Portugal,
Italy, Slovenia, and Lithuania. Our methodology is thus hypothetically replicable at the
European level. The same approach could also be used in studying screening patterns for
other cancer localisations.
5. Conclusions
BC is a particular disease in terms of social inequities—in France [35] and in Eu-
rope [43], its incidence (particularly for in situ cancers) is higher among the wealthiest
populations. However, case fatality patterns follow the classical socioeconomic burden,
with higher case fatality and shorter survival among the more unfavourable socioeco-
nomic populations [44,45]. The populations that would benefit the most from a mortality
reduction through screening are thus the most at risk of non-participation. This is in con-
tradiction with two main goals of an organized screening programme: reducing mortality
and ensuring equitable access. Additionally, the impact of the coexistence with opportunis-
tic screening, beyond any control and evaluation, is adding more risks (over-diagnosis,
overtreatment) [46], mainly in the youngest and wealthiest populations. Deeper evalua-
tions are needed to evaluate the full implications of these results. The proportion of cancer
found and missed, the stage at diagnosis, the follow-up to treatment, the effect on mortality,
quality of life and the costs engendered and avoided by all these indicators need to be ap-
preciated to allow an exhaustive evaluation. Research of immense value could be led with
efficient linkage between cancer registries and screening databases. Some controversies
about the benefit–risk balance of BC organized screenings have been widely discussed
through the scientific community [47] and beyond [48]. They cannot be resolved without a
better understanding of all consequences. A recent study at European level [49] estimated
that yearly, 21,680 BC deaths were prevented due to mammography screening, and, with a
hypothetical full coverage of 100%, 12,343 additional deaths could be prevented. Although
this hypothetical coverage is not doable, the FNBCSP needs to evolve to be more efficient
in both coverage of the population and reduction of the unfair gradient in participation.
Supplementary Materials: The following are available online at https://www.mdpi.com/article/
10.3390/cancers13174374/s1, Table S1: Départements, sample size and FNBCSP participation rates,
Figure S1: Participation rates by départements by European Deprivation Index population’s quintiles,
Figure S2: Participation rates by départements by travel time.
Author Contributions: Conceptualization, É.G. and G.L.; Data curation, Q.R. and L.L.; Formal
analysis, Q.R.; Investigation, Q.R.; Methodology, Q.R.; Project administration, Q.R., É.G. and G.L.;
Resources, L.L.; Software, Q.R. and L.L.; Supervision, G.L.; Validation, É.G.; Visualization, Q.R.;
Writing—original draft, Q.R.; Writing—review & editing, Q.R., É.G., L.L. and G.L. All authors have
read and agreed to the published version of the manuscript.
Funding: This research received no external funding.
Institutional Review Board Statement: Not applicable.
Informed Consent Statement: Not applicable.
Data Availability Statement: Access to the data that support the findings of this study is restricted.
These data are not publicly available.Cancers 2021, 13, 4374 15 of 17
Acknowledgments: We would like to thank the staff of the screening management structures of the
départements of Ain, Aisne, Alpes-Maritimes, Calvados, Charente-Maritime, Corrèze, Côte-d’Or, Creuse,
Dordogne, Doubs, Eure, Finistère, Indre-et-Loire, Isère, Jura, Lot-et-Garonne, Manche, Marne, Meurthe-et-
Moselle, Morbihan, Moselle, Pas-de-Calais, Puy-de-Dôme, Pyrénées-Atlantiques, Pyrénées-Orientales, Rhône,
Haute-Saône, Saône-et-Loire, Savoie, Seine-Maritime, Somme, Tarn, Tarn-et-Garonne, Vaucluse, Vienne,
Haute-Vienne, Yonne, Territoire de Belfort, Essonne, Seine-Saint-Denis, Val-d’Oise, Guadeloupe, Martinique
and Guyane who participated in this study by providing data, and the MapInMed platform staff
(Catherine Grin, Charlene Daix and Fanny Deshayes Pinçon) who ensured geolocalisation. We also
thank Santé Publique France for their permission to use their départements opportunistic screening
rates estimations. Finally, we thank Poppy Evenden who provided English writing assistance.
Conflicts of Interest: The authors declare that they have no competing interests.
Ethics Approval and Consent to Participate: The study protocol was approved by the Commission
Nationale de l’Informatique et des Libertés (authorization no. 917208).
Consent for Publication: Not applicable.
References
1. Sung, H.; Ferlay, J.; Siegel, R.L.; Laversanne, M.; Soerjomataram, I.; Jemal, A.; Bray, F. Global Cancer Statistics 2020: GLOBOCAN
Estimates of Incidence and Mortality Worldwide for 36 Cancers in 185 Countries. CA Cancer J. Clin. 2021, 71, 209–249. [CrossRef]
2. Defossez, G.; Le Guyader-Peyrou, S.; Uhry, Z.; Grosclaude, P.; Colonna, M.; Dantony, E.; Delafosse, P.; Molinié, F.; Woronoff, A.-S.;
Bouvier, A.-M. National Estimates of Cancer Incidence and Mortality in Metropolitan France between 1990 and 2018; Santé Publique
France: Saint-Maurice, France, 2019; p. 372.
3. Broeders, M.; Moss, S.; Nyström, L.; Njor, S.; Jonsson, H.; Paap, E.; Massat, N.; Duffy, S.; Lynge, E.; Paci, E.; et al. The Impact of
Mammographic Screening on Breast Cancer Mortality in Europe: A Review of Observational Studies. J. Med. Screen 2012, 19
(Suppl. 1), 14–25. [CrossRef]
4. Perry, N.; Broeders, M.; de Wolf, C.; Törnberg, S.; Holland, R.; von Karsa, L. European Guidelines for Quality Assurance in Breast
Cancer Screening and Diagnosis. Fourth Edition-Summary Document. Ann. Oncol. 2008, 19, 614–622. [CrossRef] [PubMed]
5. Taux de Participation au Programme de Dépistage Organisé du Cancer du Sein 2018–2019 et Évolution Depuis 2005. Available
online: https://www.santepubliquefrance.fr/maladies-et-traumatismes/cancers/cancer-du-sein/articles/taux-de-participation-
au-programme-de-depistage-organise-du-cancer-du-sein-2018-2019-et-evolution-depuis-2005 (accessed on 12 April 2021).
6. Dépistage du Cancer du Sein. Available online: https://www.has-sante.fr/jcms/r_1501534/fr/depistage-du-cancer-du-sein
(accessed on 12 April 2021).
7. Le Plan Cancer 2009–2013. Available online: https://www.e-cancer.fr/Institut-national-du-cancer/Strategie-de-lutte-contre-les-
cancers-en-France/Les-Plans-cancer/Le-Plan-cancer-2009--2013 (accessed on 23 August 2021).
8. Devaux, M. Income-Related Inequalities and Inequities in Health Care Services Utilisation in 18 Selected OECD Countries. Eur. J.
Health Econ. 2015, 16, 21–33. [CrossRef]
9. Carrieri, V.; Wuebker, A. Assessing Inequalities in Preventive Care Use in Europe. Health Policy 2013, 113, 247–257. [CrossRef]
10. Jusot, F.; Goldzahl, L. Les déterminants du recours régulier au dépistage du cancer du sein en France. Rev. Fr. D’economie 2016, 31,
109–152.
11. Sicsic, J.; Franc, C. Obstacles to the Uptake of Breast, Cervical, and Colorectal Cancer Screenings: What Remains to Be Achieved
by French National Programmes? BMC Health Serv. Res. 2014, 14, 465. [CrossRef]
12. Menvielle, G.; Richard, J.-B.; Ringa, V.; Dray-Spira, R.; Beck, F. To What Extent Is Women’s Economic Situation Associated with
Cancer Screening Uptake When Nationwide Screening Exists? A Study of Breast and Cervical Cancer Screening in France in 2010.
Cancer Causes Control 2014, 25, 977–983. [CrossRef] [PubMed]
13. Bussière, C.; Le Vaillant, M.; Pelletier-Fleury, N. The Use of Cervical, Breast and Colorectal Cancer Screening among People with
Disability Living in Institution in France, April 2013: Clémence Bussière. Eur. J. Public Health 2013, 23, ckt126.083. [CrossRef]
14. Duport, N. Characteristics of Women Using Organized or Opportunistic Breast Cancer Screening in France. Analysis of the 2006
French Health, Health Care and Insurance Survey. Rev. Epidemiol. Sante Publique 2012, 60, 421–430. [CrossRef]
15. Guillaume, E.; Launay, L.; Dejardin, O.; Bouvier, V.; Guittet, L.; Déan, P.; Notari, A.; De Mil, R.; Launoy, G. Could Mobile
Mammography Reduce Social and Geographic Inequalities in Breast Cancer Screening Participation? Prev. Med. 2017, 100, 84–88.
[CrossRef]
16. Ouédraogo, S.; Dabakuyo-Yonli, T.S.; Roussot, A.; Pornet, C.; Sarlin, N.; Lunaud, P.; Desmidt, P.; Quantin, C.; Chauvin, F.;
Dancourt, V.; et al. European Transnational Ecological Deprivation Index and Participation in Population-Based Breast Cancer
Screening Programmes in France. Prev. Med. 2014, 63, 103–108. [CrossRef] [PubMed]
17. Pornet, C.; Dejardin, O.; Morlais, F.; Bouvier, V.; Launoy, G. Socioeconomic and Healthcare Supply Statistical Determinants
of Compliance to Mammography Screening Programs: A Multilevel Analysis in Calvados, France. Cancer Epidemiol. 2010, 34,
309–315. [CrossRef] [PubMed]Cancers 2021, 13, 4374 16 of 17
18. Deborde, T.; Chatignoux, E.; Quintin, C.; Beltzer, N.; Hamers, F.F.; Rogel, A. Breast Cancer Screening Programme Participation
and Socioeconomic Deprivation in France. Prev. Med. 2018, 115, 53–60. [CrossRef] [PubMed]
19. von Elm, E.; Altman, D.G.; Egger, M.; Pocock, S.J.; Gøtzsche, P.C.; Vandenbroucke, J.P. The Strengthening the Reporting of
Observational Studies in Epidemiology (STROBE) Statement: Guidelines for Reporting Observational Studies. Bull. World Health
Organ. 2007, 85, 867–872. [CrossRef] [PubMed]
20. Pornet, C.; Delpierre, C.; Dejardin, O.; Grosclaude, P.; Launay, L.; Guittet, L.; Lang, T.; Launoy, G. Construction of an Adaptable
European Transnational Ecological Deprivation Index: The French Version. J. Epidemiol. Community Health 2012, 66, 982–989.
[CrossRef]
21. Deborde, T. Participation Au Dépistage Organisé Du Cancer Du Sein et Défavorisation Socioéconomique En France. 2018. Avail-
able online: http://www.sudoc.abes.fr/cbs/xslt//DB=2.1/SET=2/TTL=1/CLK?IKT=1016&TRM=Participation+au+de%CC%81
pistage+organise%CC%81+du+cancer+du+sein+et+de%CC%81favorisation+socioe%CC%81conomique+en+France (accessed on
29 August 2021).
22. Statistiques OCDE. Available online: https://stats.oecd.org/?lang=fr (accessed on 23 August 2021).
23. Merlo, J.; Chaix, B.; Yang, M.; Lynch, J.; Råstam, L. A Brief Conceptual Tutorial of Multilevel Analysis in Social Epidemiology:
Linking the Statistical Concept of Clustering to the Idea of Contextual Phenomenon. J. Epidemiol. Community Health 2005, 59,
443–449. [CrossRef]
24. Goldstein, H.; Browne, W.; Rasbash, J. Partitioning Variation in Multilevel Models. Underst. Stat. 2002, 1, 223–231. [CrossRef]
25. Steele, F. LEMMA: 5.3 Allowing for Different Slopes across Groups: Random Slope Models: C 5-3. LEMMA VLE, University of
Bristol, Centre for Multilevel Modelling. Available online: https://www.cmm.bris.ac.uk/lemma/mod/lesson/view.php?id=28
0&pageid=345 (accessed on 23 August 2021).
26. Merlo, J.; Yang, M.; Chaix, B.; Lynch, J.; Rastam, L. A Brief Conceptual Tutorial on Multilevel Analysis in Social Epidemiology:
Investigating Contextual Phenomena in Different Groups of People. J. Epidemiol. Community Health 2005, 59, 729–736. [CrossRef]
[PubMed]
27. Rollet, Q.; Tron, L.; De Mil, R.; Launoy, G.; Guillaume, É. Contextual Factors Associated with Cancer Screening Uptake: A
Systematic Review of Observational Studies. Prev. Med. 2021, 150, 106692. [CrossRef]
28. Rey, G.; Jougla, E.; Fouillet, A.; Hémon, D. Ecological Association between a Deprivation Index and Mortality in France over the
Period 1997–2001: Variations with Spatial Scale, Degree of Urbanicity, Age, Gender and Cause of Death. BMC Public Health 2009,
9, 33. [CrossRef]
29. Ouédraogo, S.; Dabakuyo-Yonli, T.S.; Roussot, A.; Dialla, P.O.; Pornet, C.; Poillot, M.-L.; Soler-Michel, P.; Sarlin, N.; Lunaud, P.;
Desmidt, P.; et al. Dépistage du cancer du sein dans treize départements français. Bull. Cancer 2015, 102, 126–138. [CrossRef]
30. SPF Baromètre Santé 2005. Available online: https://www.santepubliquefrance.fr/docs/barometre-sante-2005 (accessed on 29
January 2021).
31. Kalecinski, J.; Régnier-Denois, V.; Ouédraogo, S.; Dabakuyo-Yonli, T.S.; Dumas, A.; Arveux, P.; Chauvin, F. Dépistage organisé ou
individuel du cancer du sein ? Attitudes et représentations des femmes. Sante Publique 2015, 27, 213–220. [CrossRef]
32. Palència, L.; Espelt, A.; Rodríguez-Sanz, M.; Puigpinós, R.; Pons-Vigués, M.; Pasarín, M.I.; Spadea, T.; Kunst, A.E.; Borrell, C.
Socio-Economic Inequalities in Breast and Cervical Cancer Screening Practices in Europe: Influence of the Type of Screening
Program. Int. J. Epidemiol. 2010, 39, 757–765. [CrossRef]
33. Walsh, B.; Silles, M.; O’Neill, C. The Importance of Socio-Economic Variables in Cancer Screening Participation: A Comparison
between Population-Based and Opportunistic Screening in the EU-15. Health Policy 2011, 101, 269–276. [CrossRef]
34. Dalton, S.O.; Düring, M.; Ross, L.; Carlsen, K.; Mortensen, P.B.; Lynch, J.; Johansen, C. The Relation between Socioeconomic and
Demographic Factors and Tumour Stage in Women Diagnosed with Breast Cancer in Denmark, 1983–1999. Br. J. Cancer 2006, 95,
653–659. [CrossRef]
35. Bryere, J.; Dejardin, O.; Launay, L.; Colonna, M.; Grosclaude, P.; Launoy, G. Socioeconomic Status and Site-Specific Cancer
Incidence, a Bayesian Approach in a French Cancer Registries Network Study. Eur. J. Cancer Prev. 2018, 27, 391–398. [CrossRef]
[PubMed]
36. La Participation au Dépistage du Cancer du Sein Des Femmes de 50 à 74 ans en France. Available online: https://www.has-sante.
fr/jcms/c_1194998/fr/la-participation-au-depistage-du-cancer-du-sein-des-femmes-de-50-a-74-ans-en-france (accessed on 23
August 2021).
37. SPF Dépistage Individuel du Cancer du Sein des Femmes de 50 à 74 ans en France en 2009. Numéro Thématique. Dépistage
Organisé du Cancer du sein. Available online: https://www.santepubliquefrance.fr/maladies-et-traumatismes/cancers/
cancer-du-sein/depistage-individuel-du-cancer-du-sein-des-femmes-de-50-a-74-ans-en-france-en-2009.-numero-thematique.
-depistage-organise-du-cancer-du-sein (accessed on 23 August 2021).
38. Theall, K.P.; Scribner, R.; Broyles, S.; Yu, Q.; Chotalia, J.; Simonsen, N.; Schonlau, M.; Carlin, B.P. Impact of Small Group Size on
Neighbourhood Influences in Multilevel Models. J. Epidemiol. Community Health 2011, 65, 688–695. [CrossRef] [PubMed]
39. Pickett, K.E.; Pearl, M. Multilevel Analyses of Neighbourhood Socioeconomic Context and Health Outcomes: A Critical Review.
J. Epidemiol. Community Health 2001, 55, 111–122. [CrossRef] [PubMed]
40. Ponti, A.; Anttila, A.; Ronco, G.; Senore, C.; Basu, P.; Segnan, N.; Tomatis, M.; Primic Žakelj, M.; Dillner, J.; Fernan, M.; et al.
Cancer Screening in the European Union. Report on the Implementation of the Council Recommendation on Cancer Screening
(Second Report). Available online: https://screening.iarc.fr/EUreport.php (accessed on 23 August 2021).You can also read