YOUTH ISSUES PROFILE - 2017 A RESEARCH REPORT INTO THE PRIORITY NEEDS OF YOUNG PEOPLE IN - YO Bendigo
←
→
Page content transcription
If your browser does not render page correctly, please read the page content below
Attachment 3

     YOUTH ISSUES PROFILE

   A RESEARCH REPORT INTO THE
PRIORITY NEEDS OF YOUNG PEOPLE IN
         GREATER BENDIGO
              2017

                                    1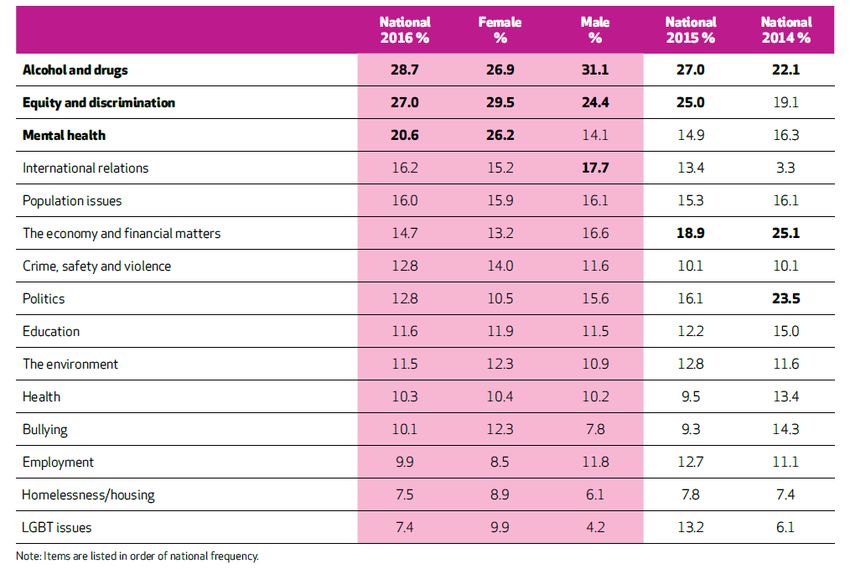
Acknowledgement of Country
The City of Greater Bendigo is on both Dja Dja Wurrung and Taungurung Country, whose
ancestors and their descendants are the traditional owners of this Country.

We acknowledge that they have been custodians for many centuries and continue to perform age
old ceremonies of celebration, initiation and renewal. We acknowledge their living culture and their
unique role in the life of this region.

Contact:
City of Greater Bendigo
195 Lyttleton Terrace
Bendigo Vic 3550
Telephone: (03) 5434 6000
Website: www.yobendigo.com.au

                                                                                                   2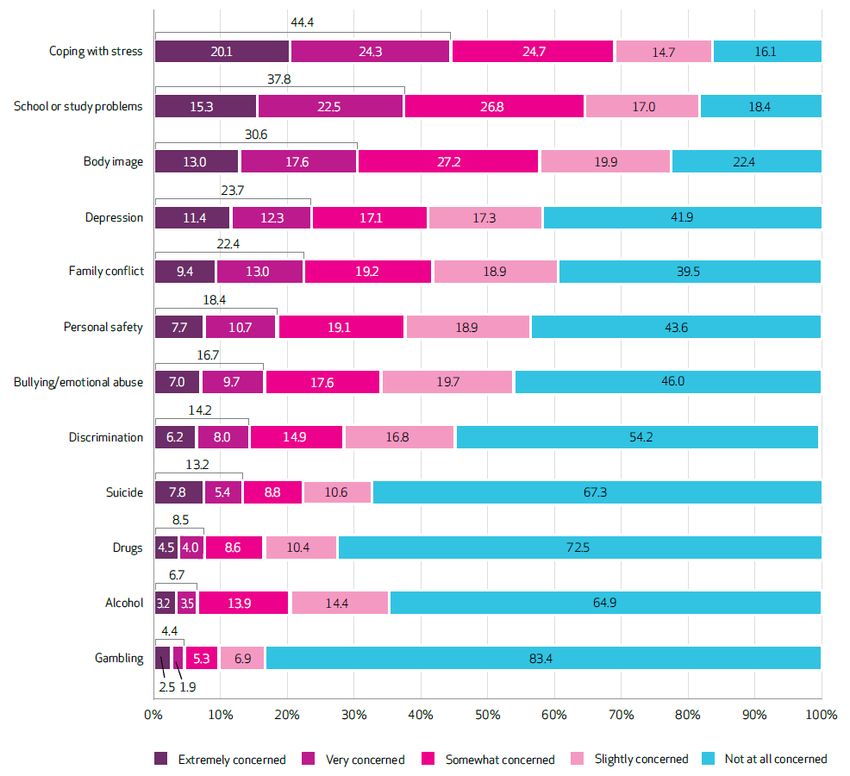
CONTENTS

CONTENTS .................................................................................................................................... 3
TABLES .......................................................................................................................................... 5
EXECUTIVE SUMMARY ................................................................................................................ 7
INTRODUCTION ............................................................................................................................ 8
BACKGROUND .............................................................................................................................. 8
YOUTH ISSUES AT A NATIONAL LEVEL .................................................................................... 10
      Mission Australia Youth Survey 2016 ..................................................................................... 10
      Analysis ................................................................................................................................. 12
GREATER BENDIGO YOUTH REPORTS & SURVEYS ............................................................... 13
      Youth Wellbeing Survey 2015 ................................................................................................ 13
      Youth Summit 2015 ............................................................................................................... 14
      Youth Summit 2016 ............................................................................................................... 14
      Youth Strategy Engagement Report 2016 .............................................................................. 15
      Citizen’s Jury Report 2016 ..................................................................................................... 16
      Analysis ................................................................................................................................. 16
GREATER BENDIGO YOUTH ISSUES ........................................................................................ 17
   MENTAL HEALTH..................................................................................................................... 17
      Mental Health......................................................................................................................... 17
      Level of Happiness ................................................................................................................ 19
      Analysis ................................................................................................................................. 21
   EDUCATION, TRAINING AND EMPLOYMENT ........................................................................ 22
      Education and Training .......................................................................................................... 22
      Year 12 Destinations 2016 ..................................................................................................... 24
      Current Youth Unemployment ................................................................................................ 27
      Analysis ................................................................................................................................. 28
   INCOME & MONEY .................................................................................................................. 29
      Money .................................................................................................................................... 29
      Income of 15 to 19 year olds .................................................................................................. 29
      Income of 20 to 24 year olds .................................................................................................. 29
      Youth Allowance .................................................................................................................... 30
      Analysis ................................................................................................................................. 31
   PERSONAL SAFETY ................................................................................................................ 32
      Perceptions of Safety ............................................................................................................. 32
      Crime ..................................................................................................................................... 33
      Bullying .................................................................................................................................. 34
                                                                                                                                                  3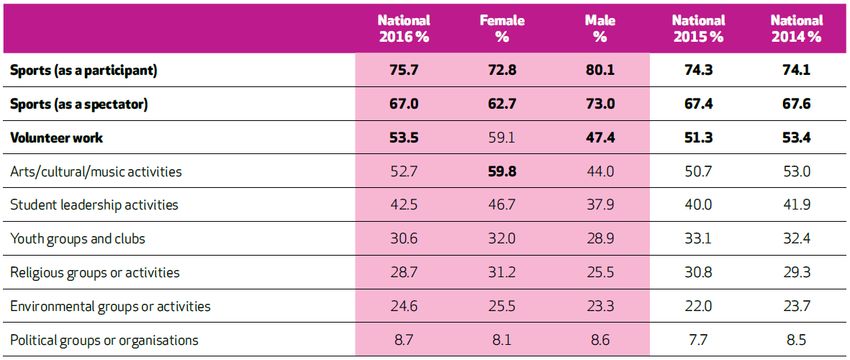
Analysis ................................................................................................................................. 35
   DRUGS & ALCOHOL ................................................................................................................ 37
      Drugs & Alcohol ..................................................................................................................... 37
      Analysis ................................................................................................................................. 38
   TRANSPORT ............................................................................................................................ 39
      Transport ............................................................................................................................... 39
      Analysis ................................................................................................................................. 41
   PHYSICAL & SEXUAL HEALTH ............................................................................................... 42
      Physical Health ...................................................................................................................... 42
      Sexual Health ........................................................................................................................ 43
      Analysis ................................................................................................................................. 44
   DISCRIMINATION..................................................................................................................... 45
      Discrimination ........................................................................................................................ 45
      Analysis ................................................................................................................................. 47
   CONNECTING TO COMMUNITY.............................................................................................. 48
      Connecting to Community ...................................................................................................... 48
      Connectedness to Peers ........................................................................................................ 48
      Having a say in the Community.............................................................................................. 50
      Analysis ................................................................................................................................. 51
REFERENCES ............................................................................................................................. 52

                                                                                                                                                 4
TABLES
Table 1: Issues of personal concern to young Australians............................................................. 11
Table 2: Most important issues in Australia today according to young people ............................... 12
Table 3: Issues concerning young people in Greater Bendigo ...................................................... 13
Table 4: Issues young people think are of concern to the Greater Bendigo community ................. 14
Table 5: Issues identified by the Youth Strategy consultation process .......................................... 15
Table 6: Youth Strategy survey responses .................................................................................... 16
Table 7: Key indicators of adolescent mental health ..................................................................... 18
Table 8: Bendigo Headspace services in 2016 ............................................................................. 19
Table 9: Bendigo Headspace client age groups in 2016................................................................ 19
Table 10: National level of happiness amongst young people ....................................................... 20
Table 11: Level of happiness amongst young people in Greater Bendigo ..................................... 20
Table 12: Greater Bendigo - enrolments in education institutions.................................................. 22
Table 13: Year 12 completion ....................................................................................................... 23
Table 14: NAPLAN literacy results ................................................................................................ 23
Table 15: NAPLAN numeracy results ............................................................................................ 23
Table 16: Destinations of Year 12 or equivalent completers who exited school in 2015 ................ 24
Table 17: Proportion of Year 12 or equivalent completers who deferred tertiary study in 2012 to
2016.............................................................................................................................................. 25
Table 18: Destinations of Year 12 or equivalent completers who deferred tertiary study - 2014 to
2016.............................................................................................................................................. 25
Table 19: Reasons provided by Year 12 or equivalent completers for deferring tertiary study in
2016.............................................................................................................................................. 25
Table 20: Post-school destinations of early school leavers who exited school in 2015 .................. 26
Table 21: Early school leavers who are unemployed 6 months after leaving school in 2015 ......... 27
Table 22: Youth unemployment .................................................................................................... 28
Table 23: Income of 15 to 19 year olds ......................................................................................... 29
Table 24: Income of 20 to 24 year olds ......................................................................................... 30
Table 25: Youth allowance payments for 16 to 24 year olds ......................................................... 30
Table 26: Perceptions of personal safety ...................................................................................... 33
Table 27: Substantiated adolescent child abuse ........................................................................... 33
Table 28: Number of young people who are victims of crime ........................................................ 33
Table 29: Number of young people convicted and placed on community orders ........................... 34
Table 30: Number of young offenders ........................................................................................... 34
Table 31: Percentage of adolescents who report being bullied...................................................... 35
Table 32: Percentage of young people who have experienced cyber bullying ............................... 35
Table 33: Adolescent drug and alcohol usage............................................................................... 38
Table 34: Drug and alcohol treatment ........................................................................................... 38
                                                                                                                                                   5
Table 35: Young people’s experience of transport in Greater Bendigo .......................................... 40
Table 36: Mode of transport for young people in Greater Bendigo ................................................ 40
Table 37: Proportion of adolescents whose lack of transport impacts on their capacity to work,
study, see a doctor or socialise ..................................................................................................... 40
Table 38: Indicators of physical health .......................................................................................... 43
Table 39: Indicators of sexual health ............................................................................................. 43
Table 40: Rate of sexually transmitted infections in young people ................................................ 44
Table 41: Perceived reasons for unfair treatment or discrimination experienced by young people
nationally ...................................................................................................................................... 46
Table 42: Number of young people who have experienced discrimination in Greater Bendigo ...... 46
Table 43: Connectedness to peers ............................................................................................... 49
Table 44: Activities young people have participated in over the past year (National) ..................... 50
Table 45: Activities young people have participated in (Greater Bendigo) ..................................... 50
Table 46: Young people’s say in community ................................................................................. 51

                                                                                                                                                  6
EXECUTIVE SUMMARY
Young people in Greater Bendigo, like young people all around Australia, are concerned about a
range of issues that directly and indirectly impact on them personally and the communities in which
they live. Greater Bendigo’s young people have shown through a series of surveys and
consultations that while they identify some issues of personal concern such as coping with stress,
school and study issues, body image, education, and employment, they also identify other issues
they believe are of concern to the local community such as, crime and safety, mental health, and
discrimination.
The Youth Issues Profile provides an overview and analysis of the key issues raised by young
people. The priority areas examined in this profile include mental health, education, training and
employment, income, personal safety, drugs and alcohol, transport, physical and sexual health,
discrimination, and connecting to community. Where possible this profile compares Greater
Bendigo data to National or Victorian data.
The Profile demonstrates that young people in Greater Bendigo:
Have higher levels of mental health related issues than young people on average in
Victoria.
Are overall happier than young people at a national level, but that, slightly more young
people in Greater Bendigo are very unhappy compared to young people nationally.
Have lower levels of Year 12 attainment and higher levels of early leavers from school.
Have lower levels of further education or training and higher levels of deferral from further
education or training. With higher levels of part-time employment for those deferring than
the average Victorian rate leading to a higher risk of disengagement from education,
training, and employment.
Have higher levels of receiving youth allowance than on average in Victoria.
Feel less safe in their community, including while at home and on public transport.
Are more likely to be a victim of crime and more likely to commit a crime than the average
in Victoria.
Have higher drug and alcohol usage rates and treatment rates than on average in Victoria.
Have some issues with transport, especially young people living in rural areas of Greater
Bendigo.
Have lower levels of health in most health indicators than on average in Victoria, except for
exercise levels.
Have experienced less discrimination because of ethnicity than nationally.
Are less connected to their peers than on average in Victoria.
More active in participating in sport, but less active in participating in other community
activities than nationally, and felt less able to have their say than on average in Victoria,
except at school.
This profile also identifies several gaps in local data. These include suicide rates, cyber bullying
rates, more in-depth data on the impacts of transport issues in rural areas, a better understanding
as to why many health indicators are below the State average, and data on discrimination
experienced by young people because of disability, gender, and sexuality. As well, it would be
helpful if more recent data regarding many major issues was available than is currently the case.
7INTRODUCTION
Welcome to the City of Greater Bendigo’s (the City) Youth Strategy 2017 - 2021 Youth Issues
Profile.
The new Youth Strategy titled Explore Engage Empower: Young People in Greater Bendigo
focuses on the needs of young people aged from 12 to 24 years. A focus on young people in this
age range is in accordance with the State Government’s youth policy “Building Stronger Youth
Engagement in Victoria” and the most recent Commonwealth Government youth policy the
“National Strategy for Young Australians (2010)”.1
The Youth Issues Profile is a key element in the youth strategy evidence base that comprises six
other reports, these being: the Youth Demographic Profile, Review of Plans, Policies and Reports,
Having Our Say - Community Engagement Report, Service Mapping Report, Benchmarking
against two other local governments; and the COG Vision and Strategy Plan (45 Mundy Street
Facility). Along-side these reports the Youth Issues Profile provides a comprehensive evidence
base to support the development and implementation of the Youth Strategy 2017 – 2021.
The Youth Issues Profile contains findings and analysis concerning the priority issues identified by
young people during the engagement process undertaken to assist focus the development of the
Youth Strategy for the next four years. Where possible the report provides a comparison to the
National and/or Victorian data and trends. To help prepare the profile, research and reports have
been sourced via various government departments and organisations whose primary concern is
youth health and wellbeing. There are some gaps in the data that appear throughout this report
due to the unavailability of local data, while some data is dated and therefore possibly not totally
representative of current trends, but is the only data available. This suggests new research is
required to ensure that the City and community is informed and has a good understanding about
the needs and issues being faced by young people in Greater Bendigo.
BACKGROUND
At the time of the Census in 2011, there were 18,315 young people aged between 12 and 24 years
in Greater Bendigo, which accounted for 18.2% of the overall population of 100,611. The suburb
with the highest percentage of 12 to 24 years olds was Flora Hill – Quarry Hill – Spring Gully –
Golden Gully with 24.4% of the population, while the suburb with the lowest percentage of 12 to 24
years olds was Heathcote and District with 12.9%. The projected population of Greater Bendigo in
2036 is expected to be 156,151, representing an average growth rate of 1.7% per annum from
2011 to 2036. While the projected population of 12 to 24 year olds in Greater Bendigo for 2036 is
expected to be 25,890 or 16.9% of the population. The suburb forecast to have the highest number
of 12 to 24 years olds in 2036 is Flora Hill – Quarry Hill – Spring Gully – Golden Gully with 2,607
residents aged 12 to 24. But while suburbs like Flora Hill will continue to have high numbers of
young people, the suburb of Huntly is expected to grow by 225.8% to 1,900 by 2036.2
The City plans and delivers programs that prioritise community development, youth participation,
capacity building, and advocacy. The current youth development service aims to provide targeted
and meaningful opportunities for young people to participate in decision making that impacts on
1
Victorian Government, Department of Health & Human Services, Building Stronger Youth Engagement in Victoria, 2016 &
Commonwealth of Australia, National Strategy for Young Australians, 2010.
2
Profile id, City of Greater Bendigo Community Profile: http://profile.id.com.au/bendigo and Forecast id, City of Greater Bendigo:
http://forecast.id.com.au/bendigo
8community life, responds to their priority issues and raises the profile of young people to achieve
better outcomes for themselves and their peers.
Through the Youth Strategy 2017 – 2021, the City aims to inform, enable, and provide
opportunities for young people to build their capacity by developing support networks and skills;
and strengthen their connections to increase participation in the social, civic and economic aspects
of their community.
9YOUTH ISSUES AT A NATIONAL LEVEL
There are many issues that the young people of Australia are concerned about. Young people
across Australia make their concerns heard every year through Mission Australia’s Youth Survey.
Coping with stress, school problems and body image are common themes. But young people also
show that they are concerned about societal issues like drugs and alcohol, equity and
discrimination and mental health.
Mission Australia Youth Survey 2016
One of the most reliable sources of information on young people in Australia is the Mission
Australia Youth Survey. This survey of young people aged 15 to 19 is conducted annually across
Australia in all States and Territories. The aim of the survey is to identify the issues of concern,
activities, and experiences of young people across Australia, with over 20,000 young people
responding to the survey in 2016.3 The results to this survey provide a comparative benchmark to
Greater Bendigo data.
The table below (see Table 1) outlines the national key issues identified by young people as issues
of “most concern to them personally”. Participants were asked to rate issues on a five-point scale
from “not at all concerned”, “slightly concerned”, “somewhat concerned”, “very concerned”, and
“extremely concerned”. Issues of concern were then identified by combining the categories “very
concerned” and “extremely concerned”.
The issues of most concern to young Australians in 2016 – combining the categories of “very
concerned” and “extremely concerned” were:
Coping with stress (44.4%)
School and student problems (37.8%)
Body image (30.6%)
Depression (23.7%)
Family conflict (22.4%)
Personal safety (18.4%)
Bullying/emotional abuse (16.7%)
Discrimination (14.2%)
Suicide (13.2%)
Drugs (8.5%)
Alcohol (6.7%)
Gambling (4.4%)
The top three issues of personal concern – coping with stress, school and study problems, and
body image remained unchanged from previous years.4
3
Mission Australia, Youth Survey, 2016: https://www.missionaustralia.com.au/what-we-do/research-evaluation/youth-survey
4
Mission Australia, Youth Survey, 2016: https://www.missionaustralia.com.au/what-we-do/research-evaluation/youth-survey
10Table 1: Issues of personal concern to young Australians
Source: Mission Australia, Youth Survey, 2016: https://www.missionaustralia.com.au/what-we-do/research-evaluation/youth-survey
Young Australians also identified the issues that they thought were important to the nation (see
Table 2). This highlighted some differences from the issues they saw as of personal concern.
Alcohol and drugs, equity and discrimination, and mental health were the top three issues
identified. All of the issues identified in this question were also identified as personal issues of
concern (either directly or indirectly) but not as the top three issues. The issues young Australian
thought were of most concern for Australia overall were:
Alcohol and drugs (28.7%)
Equity and discrimination (27.0%)
Mental health (20.6%)
International relations (16.2%)
Population issues (16.0%)
The economy and financial issues (14.7%)
Crime, safety and violence (12.8%)
Politics (12.8%)
Education (11.6%)
11 The environment (11.5%)
Health (10.3%)
Bullying (10.1%)
Employment (9.9%)
Homelessness and housing (7.5%)
LGBTI issues (7.4%)5
Table 2: Most important issues in Australia today according to young people
Source: Mission Australia, Youth Survey, 2016: https://www.missionaustralia.com.au/what-we-do/research-evaluation/youth-survey
Analysis
An analysis of the results of the Mission Australia Youth Survey on young people’s personal
concerns and what they see as issues of national importance shows some disconnect between
personal concerns and perceived national concerns. Personal concerns are more immediately
related to young people’s lives (as would be expected), while perceived importance to Australia
tends to be issues that are either related to personal issues such as mental health which can be
linked to coping with stress, or larger macro socio-political or socio-economic issues such as
international relations and the economy and financial matters. It is also obvious that the degree of
concern is more pronounced in the issues of personal concern (concern to the young person
themselves) compared to the issue of concern to the nation, as the first three issues of personal
concern (coping with stress, school and study, and body image) are all above 30% “concerned”,
while the first three issues of national concern are all between 20% and 29%, perhaps explained
by the fact that they are perceived as less of an immediate day-to-day impact on young people
themselves.
5
Mission Australia, Youth Survey, 2016: https://www.missionaustralia.com.au/what-we-do/research-evaluation/youth-survey
12GREATER BENDIGO YOUTH REPORTS & SURVEYS
Throughout 2015 and 2016 the City of Greater Bendigo engaged with young people via several
methods and on several occasions. This engagement included a Youth Wellbeing Survey in 2015,
two Youth Summits in 2015 and 2016, and Youth engagement for the Youth Strategy in 2016. All
engagement activities provided insights into the issues and priorities of Bendigo’s young people. In
2016 the City of Greater Bendigo also held a Citizen’s Jury. This process also highlighted several
youth related issues and provided ideas aimed at meeting the future requirements of the City’s
young people. Below are summaries of each report and the key youth based issues and priorities
identified.
Youth Wellbeing Survey 2015
The 2015 City of Greater Bendigo Youth Wellbeing Survey identified several issues that concerned
local young people. Coping with stress, school and study problems, and body image, depression,
and family conflict were the five issues identified. Over 40% said they were either “extremely
concerned” or “very concerned” about coping with stress, while 35% said they were either
“extremely concerned” or “very concerned” about both school or study problems and body image.
In addition over 27% said they were either “extremely concerned” or “very concerned” about
depression, and over 24% said were either “extremely concerned” or “very concerned” about family
conflict (see Table 3).
Table 3: Issues concerning young people in Greater Bendigo
What issues are of personal concern to you?
2.8%
Gambling 4.0% 8.5% 11.0% 73.7%
4.2%
Alcohol 6.8% 9.7% 12.2% 67.1%
4.4%
Drugs 7.2% 7.8% 10.6% 70.0%
Discrimination 8.3% 9.6% 11.5% 17.8% 52.9%
Suicide 10.0% 8.3% 8.5% 10.9% 62.3%
Personal safety 9.8% 16.4% 19.0% 20.7% 34.1%
Bullying/emotional abuse 8.0% 12.9% 17.1% 19.0% 42.9%
Family conflict 11.0% 13.2% 16.8% 18.9% 40.1%
Depression 13.5% 13.7% 17.3% 15.2% 40.4%
Body image 16.4% 18.6% 23.8% 20.9% 20.3%
School or study problems 11.5% 23.5% 30.2% 21.3% 13.5%
Coping with Stress 16.5% 23.6% 29.1% 17.5% 13.3%
0% 10% 20% 30% 40% 50% 60% 70% 80% 90% 100%
Extremely Concerned Very Concerned Somewhat Concerned
Slightly Concerned Not at all Concerned
Source: City of Greater Bendigo, Youth Wellbeing Survey, 2015
Young people in Greater Bendigo also identified in this survey the issues they thought were of
most important to the Greater Bendigo community overall. The three top issues were: crime, safety
and violence with 42.1%; mental health with 41.0%; and equity and discrimination with 38.9% (see
13Table 4). Again like the national survey, (see Table 2) this confirms there are some differences
from issues of personal concern to issues young people think are of concern to the whole
community.
Table 4: Issues young people think are of concern to the Greater Bendigo community
What issues do you think are the most important in Bendigo today?
(Please select top three)
41.0% 42.1%
38.9%
31.9%
27.9% 29.2%
25.4% 24.7%
20.5%
16.9% 18.4%
12.1% 12.5% 13.5%
6.8%
Source: City of Greater Bendigo, Youth Wellbeing Survey, 2015
Youth Summit 2015
In 2015, the City of Greater Bendigo’s Youth Development Team conducted a Youth Summit
attended by 120 young people. This provided an outline of the issues and concerns young people
in Greater Bendigo were experiencing. The three broad issues to emerge from the Youth Summit
were: mental health, drugs and alcohol, and safety. The summit also identified youth employment,
bullying, and the public image of young people as concerns.6
Youth Summit 2016
In 2016, the City’s Youth Development Team conducted a Youth Summit focused on developing
the new youth strategy. The summit was attended by 65 young people from several schools
including Eaglehawk Secondary College, Crusoe College, Bendigo Technical Education College,
Bendigo South East Secondary College and Marist College Bendigo. The purpose of the youth
summit was to provide young people with an opportunity to discuss issues that were important to
them, to make connections with students from other schools, and have a say in decisions that
impact them directly. Students were also asked to provide their ideas to help develop a new Youth
Strategy for the City. The key themes to emerge from the Summit were that young people want to:
Contribute
Participate
6
City of Greater Bendigo, Youth Summit Report, 2015
14 Be included
Be supported
Be heard
Be empowered to make decisions
Be informed7
Youth Strategy Engagement Report 2016
The Youth Strategy consultation process in 2016 engaged several key groups of youth
stakeholders including young people via a survey, several workshops, and a youth agency forum.
These combined engagement strategies identified numerous priority issues impacting young
people. The three top priorities identified were mental health, education, and employment. Other
highly rated issues include bullying, drugs, transport, and physical health. But of some importance
were violence, personal safety, and discrimination. Issues that did not rate in the top 10 from these
three sources include housing and training (see Table 5).
Table 5: Issues identified by the Youth Strategy consultation process
Engagement Report - top issues
Issue Weighted Score Percentage
Mental health 28 17%
Education 24 14%
Employment 24 14%
Bullying 17 10%
Drugs 13 8%
Transport 12 7%
Physical health 11 7%
Violence 10 6%
Personal safety 9 5%
Discrimination 6 4%
Alcohol 3 2%
Environment 3 2%
LGBT issues 3 2%
Money 3 2%
Sexual health 1 1%
Housing 0 0%
Training 0 0%
Total 167 100%
Source: City of Greater Bendigo, Youth Strategy Engagement Report, 2016
However, when the survey of young people is analysed without the responses from agency
stakeholders, the priorities then alter. The top three issues identified are education with 44.3%,
mental health with 35.7%, and employment with 32.9% (see Table 6).
7
City of Greater Bendigo, Youth Summit Report, 2016
15Table 6: Youth Strategy survey responses
Please tick the three issues of most importance or concern to you.
50.0% 44.3%
45.0%
40.0% 35.7%
32.9%
35.0% 28.6%
30.0%
25.0% 20.0%
17.1% 17.1% 15.7%
20.0% 14.3% 14.3%
15.0% 11.4% 10.0%
8.6% 7.1% 7.1%
10.0% 5.7%
5.0% 0.0% 1.4%
0.0%
Source: City of Greater Bendigo, Youth Strategy Survey, 2016
Citizen’s Jury Report 2016
In 2016, the City of Greater Bendigo conducted a Citizen’s Jury process with 28 jurors
participating. The subsequent Citizen’s Jury report identified three broad areas of issues they
identified as being relevant to young people. These were: a youth hub to engage with young
people in their own space, a youth mentoring program, and a mechanism to promote opportunities
and engage and build creativity in young people.8
Analysis
The numerous City of Greater Bendigo youth reports and surveys of the last couple of years
highlight several key themes that often repeated. In a broad sense, these reports show that young
people are concerned about similar issues that young people are at a national level such as
education, employment, and mental health, but that they also wish to be better connected to the
community, and to be actively included, involved, informed, and empowered in their community.
These surveys also show (like the Mission Australia national survey) that young people’s personal
concerns are different to what they see as issues of concern for Greater Bendigo. For example, the
issues of coping with stress, school/education, body image, and employment are top rating issues
of personal concern across many of the surveys, but when asked about issues of concern for the
Greater Bendigo community, crime and safety, mental health, and discrimination are rated as the
most important. However, the common theme between the personal and perceived local issues is
mental health, as both questions highlight issues related to mental health (either directly or
indirectly) such as coping with stress and body image.
8
City of Greater Bendigo, Citizen’s Jury Report, 2016
16GREATER BENDIGO YOUTH ISSUES
After the consultation process for the youth strategy, several youth summits, and youth surveys
several key issues are highlighted as priorities to young people in Greater Bendigo. The key youth
issues to be examined in this report are mental health, education, training and employment,
income, personal safety, drugs and alcohol, transport, physical and sexual health, discrimination,
and connecting to community.
MENTAL HEALTH
Mental health is a key issue identified by young people in the Mission Australia Youth Survey and
in City surveys and other engagement processes. This section will examine several mental health
indicators relating to young people at a national, Victorian and Greater Bendigo level. This will
include the national rate of mental illness in young people, the national suicide rate of young
people, and mental health indicators of adolescents in Greater Bendigo in comparison to Victoria
such as intentional self-harm, psychiatric hospitalisation, levels of psychological distress, eating
dis-orders, and levels of wellbeing. It will also explore the level of concern amongst young people
about mental health issues at a local level in comparison to national data, as well as Headspace
service statistics, and levels of happiness in young people.
Mental Health
Current statistics show that youth is a period of high risk for developing mental illness with 26.4%
of young Australians or approximately 750,000 young people aged 16 to 24 experiencing a mental
health disorder in the last 12 months.9 Indeed, the highest chance of developing a mental illness is
between the ages of 12 and 25. While mental illness can then impact and increase the chance of
increased physical health and sexual health problems, and can be linked to rates of self-harm and
suicide.10
In 2015, the suicide rate for 15 to 19 year olds in Australia was 9.8 in 100,000 people and 14.8 for
20 to 24 year olds.11 To place this in perspective, more young Australians aged between 15 and 24
years of age died by suicide in 2015 than by any other cause, including transport accidents. Of
these suicides 72% were males. There are also high rates of suicide among Aboriginal and Torres
Strait Islander young people, LGBTIQ young people, and young people living in rural and remote
areas. Furthermore, 5.1% of young people aged 16-24 years have experienced suicidal thoughts.12
These statistics illustrate the significance of mental health as a national issue amongst young
Australians. This is reinforced with regards to young people and mental health in Greater Bendigo.
This is because rates of intentional self-harm, eating disorders, and young people with high levels
of psychological distress are higher in Greater Bendigo than the Victorian average. For example,
the most recent data on self-harm among adolescents in Greater Bendigo shows that in 2009 0.9
persons per 1,000 persons self-harmed while the Victorian average was 0.6 per 1,000. The story
was similar for eating disorders as 2.7% of Greater Bendigo adolescents in 2009 had eating
disorders compared to the Victorian average of 2.4%. Greater Bendigo adolescents also
experienced higher levels of psychological distress in 2009 with 15.1% of adolescents compared to
the Victorian average of 13%, and experienced lower levels of emotional wellbeing compared to
Victoria with 56.1% compared to 61.1%. However, psychiatric hospitalisation rates were lower for
9
Beyond Blue, Mental Health Statistics, 2017
10
Orygen, Raising the Bar for Youth Suicide Prevention, Report, 2016
11
Australian Bureau of Statistics, Cause of Death, Cat 3303.0, 2016
12
Orygen, 2016
17adolescents in Greater Bendigo with 6.1 persons per 1,000 compared to the Victorian average of
6.7 per 1,000 persons (see Table 7).
Table 7: Key indicators of adolescent mental health
Mental health indicators
Key Indicators of Adolescent Mental Health 10-
Greater Bendigo Victoria Difference
17 year olds - 2009
Intentional self-harm (rate per 1,000)
0.9 (no. 10) 0.6 (no. 310) +0.3
2008-2009
Psychiatric hospitalisation ( rate per 1,000)
6.1 (no. 70) 6.7 (no. 3655) -0.6
2009-2010
Proportion of adolescents with the highest level
15.1% 13% +2.1%
of psychological distress in 2009
Proportion of adolescents with an eating
2.7% 2.4% +0.3%
disorder in 2009
Proportion of adolescents with a high level of
56.1% 61.1% -5%
emotional wellbeing in 2009
Source: Department of Education and Early Childhood Development, City of Greater Bendigo, Adolescent Community Profile, 2010:
https://www.eduweb.vic.gov.au/edulibrary/public/govrel/Policy/children/adolescentprofiles/lgaprofiles/greaterbendigo.pdf
In addition to the above statistics, several City of Greater Bendigo surveys such as the Youth
Wellbeing Survey and the Youth Survey for the Youth Strategy have identified mental health as a
major issue of concern for young people. During the consultation process for the new Youth
Strategy in 2016 mental health was identified through a survey of young people as the second
highest issue of concern after education (see Table 6). But when all consultation feedback was
aggregated (this included student workshops and a youth agency forum) then mental health was
identified as the top issue of concern (see Table 5). A year earlier in 2015 the Youth Wellbeing
survey conducted by the City identified mental health as an important issue with 41.0% of young
people saying it was a concern for the community of Greater Bendigo (see Table 4). This was
second only after crime, safety, and violence.
But when asked what concerned them personally most young people in Greater Bendigo identified
coping with stress as the top issue with 40.1% either “extremely concerned” or “very concerned”,
study problems & school and body image as the second and third highest issues with 35% either
“extremely concerned” or “very concerned” each, and depression the fourth highest issue with
27.2% either “extremely concerned” or “very concerned” (see Table 3). All of which can be
identified with mental health.
When compared to national statistics, young people in Greater Bendigo are more concerned about
mental health as an issue in Bendigo than young people are at a national level (see Table 2), with
mental health identified as the third most important issues concerning Australia (after alcohol and
drugs, and equity and discrimination) compared to second in Greater Bendigo.
But when asked about what is of personal concern to themselves (see Table 1) then again the
issue coping with stress was the top issue with 44.4% either “extremely concerned” or “very
concerned”, body image as the third highest issue with 30.6% either “extremely concerned” or
“very concerned”, and depression as the fourth highest issue with 23.7% either “extremely
concerned” or “very concerned”. Compared to national statistics, there are a lower percentage of
young people in Greater Bendigo personally concerned about coping with stress, but a higher
percentage of young people concerned about body image and depression (see Table 3).
Fortunately there are a number of services available in Greater Bendigo to assist young people
who are experiencing mental health issues, including: Bendigo Community Health Services;
18Headspace; Secondary School nurses; St Luke’s; and Youth Support and Advocacy Service
(YSAS). As well as locally based services, there are a number of online or telephone based
counselling services, including: Beyond Blue, Kids Help Line, and Lifeline. The tables presented
below indicate the number of youth presenting at a Headspace centre, both nationally and locally.
The Headspace data shows that both the number of young people serviced by Headspace
Bendigo and the number of occasions serviced in Bendigo are higher than the national average,
with the number of young people serviced 27.9% higher in Bendigo and occasions of service
61.7% higher in Bendigo than the national average (see Table 8). It also shows that the largest age
group of young people serviced in Bendigo was the 15 to 17 age group which accounted for 36.8%
of all clients compared to the national average of 33.1% (see Table 9).
Table 8: Bendigo Headspace services in 2016
Headspace Bendigo – services
Bendigo National (Centre Difference between Difference between Bendigo
2016
2016 average) Bendigo and National and National %
Occasions of 61.7% more than national
5,113 3,161 1,952
Service average
Serviced Young 27.9% more than national
949 742 207
People average
Source: Headspace Bendigo Centre, Service Data, 2016
Table 9: Bendigo Headspace client age groups in 2016
Headspace Bendigo – client age groups
Age group percentage
2016
Under 12 12-14 15-17 18-20 21-23 24-25 Over 25
Bendigo 0% 23.5% 36.8% 23.5% 13.3% 2.7% 0.2%
National 0% 20.6% 33.1% 23.5% 17.0% 5.4% 0.3%
Source: Headspace Bendigo Centre, Service Data, 2016
Level of Happiness
One of the key measures Mission Australia uses every year in its Youth Survey is happiness – an
indicator linked to positive emotional wellbeing. This is also an indicator that the City of Greater
Bendigo measured in it Youth Wellbeing Survey in 2015. Therefore comparisons of happiness
between young people at a national level and at the local level can be provided. Both surveys use
a 0 to 10 scale with 0 representing very unhappy/very sad, 5 representing neither happy/or sad,
and 10 being very happy.
The Mission Australia Youth Survey shows that the percentage of young Australians who indicated
they feel happy (that is the total percentage of happiness – above 50%) was 74.7% in 2016, while
10.9% stated they were neither happy/or sad, and 14.4% stated they felt sad (see Table 10).
The Greater Bendigo survey shows that the percentage of young people who indicated they feel
happy (that is the total percentage of happiness) was of 77.2%, while 6.1% stated they were
neither happy/or sad, and 16.8% stated they felt sad (see Table 11).
However, when we compare the two surveys for levels of very happy (100%) or those who rated
their happiness levels at 10 out of 10, then fewer young people in Greater Bendigo are very happy
compared to very happy at a national level with 9.1% and 12.8% respectively. Furthermore there
are marginally more young people in Greater Bendigo who are very sad than at a national level
19with 3.0% compared to 2.6% at a national level. Finally, fewer young people in Greater Bendigo
were neither happy/or sad with 6.1% compared to 10.9% at a national level (see Tables 10 and
11).
Table 10: National level of happiness amongst young people
Source: Mission Australia, Youth Survey, 2016: https://www.missionaustralia.com.au/what-we-do/research-evaluation/youth-survey
Table 11: Level of happiness amongst young people in Greater Bendigo
How happy are you?
25.9%
17.7%
14.6%
9.9% 9.1%
6.8% 6.1%
3.0% 3.0% 3.2%
0.8%
Source: City of Greater Bendigo, Youth Wellbeing Survey, 2015
20Analysis
An analysis of young people and mental health related issues and statistics in Greater Bendigo
and nationally highlights the significance of mental health as an issue impacting on young people
both locally and nationally. It also shows that young people in Greater Bendigo are not only
concerned about mental health as a societal issue but a personal issue as well. The difference
between Greater Bendigo and Victoria mental health indicators shows that young people in
Greater Bendigo have higher levels of self-harm, psychiatric hospitalisation, psychological distress,
and eating disorders, with lower levels of emotional wellbeing. This is supported by Headspace
statistics showing a higher utilisation rate of services than the national average. In addition, the
level of happiness surveys shows that while more young people in Greater Bendigo are on the
happy end of the happiness scale than at a national level, less local young people did however
identify as very happy compared to national levels and slightly more were very sad compared to
national. Finally, analysis shows us that there are some gaps in local data, specifically a shortage
of recent research and age related suicide data.
21EDUCATION, TRAINING AND EMPLOYMENT
Education, Training and Employment are key issues identified by young people in the Mission
Australia Youth Survey and in City of Greater Bendigo surveys. This section will examine several
education and training, and employment indicators relating to young people at a national, Victorian
and Greater Bendigo level. This will include educational institutions in Greater Bendigo and their
enrolments, Year 12 attainment, NAPLAN literacy and numeracy levels, Year 12 destinations
(further education, training, and labour force), year 12 deferrals from tertiary studies and reasons
for deferral, and early school leavers in Greater Bendigo all compared to Victorian trends. This
section will also examine young people’s concerns about employment and education in Greater
Bendigo in comparison to national data, and youth unemployment.
Education and Training
In 2015, when young people in Greater Bendigo were asked to rate the issues of most personal
concern to them in the Youth Wellbeing Survey, the issue of school and study problems was rated
second with 35% saying they were either “extremely concerned” or “very concerned” about school
or study related problems (see Table 3). This is slightly below national data on the same issue, as
in 2016 at a national level young people rated school and study problems as the second most
important issues with 37.8% saying they were either “extremely concerned” or “very concerned”
about school and study related problems (see Table 1). This is supported by the City’s
engagement process for the current youth strategy which found that education was the equal
second highest issue of concern along with employment with 14% of young people stating it was
an issue of concern (see Table 5).
It is not surprising that young people in Greater Bendigo rate school and study problems as a
priority, as Greater Bendigo’s population of over 18,000 young people are - to varying degrees and
at some stage in their lives - linked to the numerous secondary colleges and several tertiary
institutions. The local secondary schools: Bendigo Senior Secondary College, Catholic College
Bendigo and Bendigo South East College all have student populations of well over 1,000 students
each, with 1,765, 1,195, and 1,454 respectively. Tertiary institutions La Trobe University and
Bendigo TAFE also have student populations of several thousand each with 4,771, and 4,517
respectively (see Table 12). Greater Bendigo is also served by various Registered Training
Organisations such as Access Skills Training and CVGT which provide accredited training for the
regions young people.
Table 12: Greater Bendigo - enrolments in education institutions
Enrolments in education institutions
Institution Year levels Year of data Number of students
Bendigo Senior Secondary College 11 & 12 2016 1765
Catholic College Bendigo 7 to 12 2014 1195
Girton Grammar 7 to 12 2016 745
Bendigo South East College 7 to 10 2016 1454
Weeroona College 7 to 10 2016 605
Eaglehawk 7 to 10 2016 566
Crusoe 7 to 10 2016 597
DOXA 12 to 18 year olds 2014 45
Marist College Bendigo 7 to 9 2015 351
Bendigo Special Development School 7 to 12 2016 128
Kalianna Special School 7 to 12 2016 233
Bendigo TAFE 15 to 24 2013 4517
LaTrobe University All ages 2015 4771
Sources: Department of Education & Training, Schools & Enrolments 2016, Catholic School Enrolments 2014, Girton Grammar 2016,
Marist College 2015, Bendigo TAFE 2013, La Trobe University 2015
22Nevertheless, Greater Bendigo’s Year 12 completion rate of 80.4% for 19 year olds is below the
Victorian State average of 88.2%. However while year 12 completions is lower in Greater Bendigo
than the Victorian average there has been an increase in Year 12 completion rates in Greater
Bendigo over the period from 2010 to 2014, with rates rising from 77.3% in 2010 to 80.4% in 2014
(see Table 13).
Table 13: Year 12 completion
Proportion of young people aged 19 years who have
attained Year 12 or equivalent in Greater Bendigo
90.0%
87.7% 88.3% 88.2%
88.0%
86.0% 84.9%
84.0% 82.5% 82.8%
82.0%
82.0% 80.4%
80.0% Greater Bendigo
77.4%
78.0% 77.3% Victoria
76.0%
74.0%
72.0%
70.0%
2010 2011 2012 2013 2014
Source: Department of Education & Training, VCAMS Portal, 2017:
http://www.education.vic.gov.au/about/research/Pages/vcamstableau.aspx
The National Assessment Program - Literacy and Numeracy (NAPLAN) results in Greater Bendigo
schools show that the majority of Year 7 and Year 9 students achieved the national minimum
standards for literacy and numeracy. In 2015 the percentage of Year 7 students achieving the
minimum standard in literacy was 93.8%, below the Victorian average of 95.9%, while the
percentage of Year 9 students achieving the minimum standard of literacy was 90.7%, again below
the Victorian average of 93.5% (see Table 14).
In 2015 the percentage of Year 7 students achieving the minimum standard in numeracy was
94.5%, below the Victorian average of 96.3%, while the percentage of Year 9 students achieving
the minimum standard of numeracy was 93.1%, again below the Victorian average of 95.6% (see
Table 15).
Table 14: NAPLAN literacy results
Students achieving national minimum standards in literacy - 2015
Year Level Greater Bendigo Victoria
Year 7 93.8% 95.9%
Year 9 90.7% 93.5%
Source: Department of Education & Training, VCAMS Portal, 2017:
http://www.education.vic.gov.au/about/research/Pages/vcamstableau.aspx
Table 15: NAPLAN numeracy results
Students achieving national minimum standards in numeracy - 2015
Year Level Greater Bendigo Victoria
Year 7 94.5% 96.3%
Year 9 93.1% 95.6%
Source: Department of Education & Training, VCAMS Portal, 2017:
http://www.education.vic.gov.au/about/research/Pages/vcamstableau.aspx
23Year 12 Destinations 2016
Current Department of Education & Training On Track 2016 Destinations data suggests that 2015
Year 12 completers or equivalent have continued on to further education or training at a lower rate
than the Victoria rate, as only 56.4% of Greater Bendigo students continued in 2016 with further
education or training, while 76.8% of Victorian students continued on to further education and
training. This is a sizeable difference between the state average and Greater Bendigo. Of the
43.6% of Year 12 completers who were not in further education or training, 37.0% were employed
(much higher than the Victorian rate of 17.7%), 5.7% were looking for work, and 1.0% were not in
either the labour force, education or training. Both the categories of looking for work and not in the
labour force, and education or training were marginally higher than the Victoria rates of 4.5% and
0.9% respectively (see Table 16).
Table 16: Destinations of Year 12 or equivalent completers who exited school in 2015
Destinations of Year 12 or equivalent completers in 2015
Destination Greater Bendigo Victoria
Post-school destination Number % Number %
In further education or training 337 56.4 22800 76.8
Bachelor degree 216 36.1 16081 54.2
Certificates/Diplomas 62 10.4 4327 14.6
Certificate IV or higher 20 3.3 756 2.5
Certificate I to III 42 7.0 3571 12.0
Apprentice/Trainee 59 9.9 2392 8.1
Apprenticeship 41 6.9 1645 5.5
Traineeship 18 3.0 747 2.5
Not continuing in further education or training 261 43.6 6871 23.2
Employed 221 37.0 5256 17.7
Employed full-time 72 12.0 1793 6.0
Employed part-time 149 24.9 3463 11.7
Looking for work 34 5.7 1346 4.5
NILFET(Not in the labour force, employment or training) 6 1.0 269 0.9
Unknown 8 0.0
Total respondents 598 100.0 29679 100.0
Source: Department Education and Training - On Track Reports for Victorian Local Government Areas – Greater Bendigo, 2016:
http://www.education.vic.gov.au/about/research/Pages/localgovatoz.aspx
Importantly, 21.3% of Greater Bendigo’s Year 12s deferred tertiary studies in 2016. This is over
one in five students – and more than twice the Victorian rate of 9.7% (see Table 17). This poses
the question, what are they doing? The data suggests that the majority are working – although
more than half are employed part-time (55.8%) and only 30.2% are working full time, with a further
7.8% looking for work (see Table 18). While these figures are significant and the rate of deferrals is
over twice the level of Victoria, the level of those employed in both in part-time and full-time work is
slightly higher in Greater Bendigo than the Victorian average for both part-time and full-time work,
and the level of those either looking for work is slightly lower than the Victoria average. However, it
is concerning that the number of tertiary deferrals in Greater Bendigo has over the years 2012 to
2016 increased from 17.6% to 21.6%, while the Victorian average has actually decreased slightly
during this period from 10.3% to 9.7% (see Table 17).
24The reasons as to why young people in Greater Bendigo are deferring at higher level than the state
average are: “wanted to start working/earn money” (the most cited reason), “needed a break from
study”, “wanted other experiences like travel before continuing study”, and “would have to move
away from home” (see Table 19). The level of those in employment whether full-time or part time
and those looking for work suggests that the response of wishing to work was by far the largest
driver of students deferring tertiary studies. But other factors like needing a break from study did
influence their decisions to defer their studies.
Table 17: Proportion of Year 12 or equivalent completers who deferred tertiary study in 2012 to 2016
Year 12 or equivalent completers - deferrals
Deferrals 2012 2013 2014 2015 2016
Area % % % % %
Greater Bendigo 17.6 18.5 19.0 16.1 21.6
Victoria 10.3 9.7 9.4 9.1 9.7
Source: Department Education and Training - On Track Reports for Victorian Local Government Areas – Greater Bendigo, 2016:
http://www.education.vic.gov.au/about/research/Pages/localgovatoz.aspx
Table 18: Destinations of Year 12 or equivalent completers who deferred tertiary study - 2014 to 2016
Year 12 or equivalent completers - deferral destinations
Greater Bendigo Victoria
Post-school Destination
2014 % 2015 % 2016 % 2014 % 2015 % 2016 %
Employed full-time 30.0 31.1 30.2 26.2 26.4 28.3
Employed part-time 59.2 55.3 58.9 54.3 54.0 55.0
Looking for work 10.8 11.7 7.8 14.7 14.1 12.4
NILFET - np np 4.6 5.3 4.1
Unknown - - - 0.2 np np
Source: Department Education and Training - On Track Reports for Victorian Local Government Areas – Greater Bendigo, 2016:
http://www.education.vic.gov.au/about/research/Pages/localgovatoz.aspx
Table 19: Reasons provided by Year 12 or equivalent completers for deferring tertiary study in 2016
Year 12 or equivalent completers – reasons why deferred
Reasons Why Deferred Greater Bendigo Victoria
Reason Provided Number % Number %
You just needed a break from study 97 77.6 2150 78.8
You wanted some other experiences, like travel,
87 69.6 1934 70.8
before continuing your education
You wanted to start working / earning your own
113 90.4 2214 81.1
money
You would have had to move away from home 65 52.0 607 22.2
Total respondents 125 2730
Note: Respondents may have agreed to more than one statement.
Source: Department Education and Training - On Track Reports for Victorian Local Government Areas – Greater Bendigo, 2016:
http://www.education.vic.gov.au/about/research/Pages/localgovatoz.aspx
25You can also read