Racial Healing and Achieving Health Equity in the United States
←
→
Page content transcription
If your browser does not render page correctly, please read the page content below
Embargoed
ISSUE BRIEF

               until Tuesday,
               December 17
               at 10:00 AM ET

                                Racial Healing and Achieving Health
                                Equity in the United States
                                “Of all the forms of inequality, injustice in health care is the most shocking
                                and inhumane.”
                                -- Rev. Martin L. King, Jr.

                                The Truth, Racial Healing & Transformation       promote positive and lasting change across
                                (TRHT) effort was created by the W.K.            issues — including to:
                                Kellogg Foundation as a national and
                                                                                 1. Find ways to reinforce and honor our
                                community-based process to plan for and
                                                                                    common humanity and create space to
                                bring about transformational and sustainable
                                                                                    celebrate the distinct differences that
                                change and to address the historic and
                                                                                    make our communities vibrant;
                                contemporary effects of racism.
                                                                                 2. Acknowledge that there are still deep
                                Among the many aspects of TRHT is                   racial divisions in America that must be
                                the need to address serious racial and              overcome and healed; and
                                ethnic health inequities — and the causes
                                that contribute to them. Good health is          3. Commit to engage people from all racial, eth-
                                essential to ensuring everyone is able to live      nic, religious and identity groups in genuine
                                a high-quality life, be engaged with their          efforts to increase understanding, communi-
                                families, communities and workplaces, and           cation, caring and respect for one another.1
                                have the opportunity to flourish and thrive      This issue brief was developed to help identify
                                in everything they do. TRHT’s National           and acknowledge health inequities, influencing
                                Day of Racial Healing identifies key steps       factors and policy recommendations that can
                                that will help take collective action to         help the nation achieve health equity.

                                “Health equity means that everyone has a fair and just opportunity to be
                                as healthy as possible. This requires removing obstacles to health such as
JANUARY 2018

                                poverty, discrimination, and their consequences, including powerlessness
                                and lack of access to good jobs with fair pay, quality education and
                                housing, safe environments and health care.”2
REACHING FOR
                                              Health Equity
                              Reducing health disparities brings us closer to reaching health equity. The programs
                                 below are examples of how addressing disparities can advance health equity.

                                                           T HEALT                                                            T HEALT
                                                      ES                                                                 ES

                                                                                                                                    H
                                                                  H

                                                                                                                     B
                                                  B

                                                      PO                                                                 PO
                                                           SSIBLE                                                             SSIBLE

                                                                                                          Future
                                                                                                        Strategies

                                                   Case management and home visits by                                                   Client and provider reminders
                                                   community health workers decreased                    Ongoing                        and patient navigators increased
                                                   asthma-related hospitalizations                        Efforts                       colorectal cancer screening rates

                                                   Expanded vaccination recommendations   Personalized counseling reduced               Programs and policies supporting
                                                   eliminated some disparities in         HIV risk behaviors                            better neighborhood conditions
                                                   Hepatitis A disease                                                                  reduced violence

                                                   Curriculum for living well with a      Tribally driven efforts to reclaim            Lay health advisors reduced HIV
                                                   disability improved quality of life    traditional food systems facilitated          risk behaviors
                                                                                          dialogue about health

                                                                                                     PROGRAMS

                                                                                    POPULATIONS

         Black and           Racial/ethnic     People living             Men who have         American Indian               Low income                  High risk           Hispanic and Latino
      Hispanic children     minority groups   with disabilities          sex with men        and Alaska Native            populations and             communities             immigrant men
                                                                                                populations               Alaska Natives

                      HEALTH EQUITY is when                                HEALTH DISPARITIES are differences in health outcomes and
                      everyone has the opportunity to be                   their causes among groups of people.
                      as healthy as possible.
                                                                           EXAMPLE: African American children are more likely to die
                                                                           from asthma compared to non-Hispanic White children.

2   TFAH • healthyamericans.org
                  Learn more about these programs at: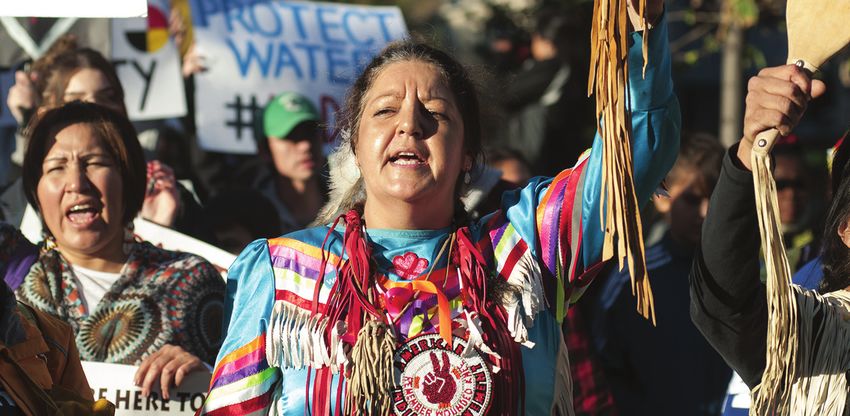
Existing Inequities
The causes of health inequities are multifaceted and often intertwined with lower socioeconomic
status, differential access to opportunities and other factors that influence health, such as quality
healthcare, income, education, housing, transportation and others, sometimes referred to as the
“social determinants of health.”

Health inequities have a high economic                 housing provide significant opportunities       l   Infants born to Black women are 1.5 to
cost. A study by the Urban Institute found             to be healthier.12                                  almost 3 times more likely to die than
that for a set of preventable diseases (dia-       l    ow-income neighborhoods are less
                                                       L                                                   infants born to women of other
betes, heart disease, high blood pressure,             likely to have places where children can            races/ethnicities regardless of
renal disease and stroke), differences                 be physically active or have access to              education level.25 American Indian and
in the rates of diseases among Blacks,                 fully-stocked supermarkets with healthy,            Alaska Native infants die from Sudden
Hispanics and Whites cost the healthcare               affordable foods — contributing                     Infant Death Syndrome (SIDS) at
system $23.9 billion annually.3 By 2050,               to higher rates of obesity and poor                 about twice the rate of White infants. 26
this is expected to double to $50 billion a            nutrition in these communities.13, 14, 15       l   Asthma rates for Black children grew
year.4 Eliminating health inequities could                                                                 by 50 percent between 2001 and
                                                   l    ow-income and minority communities
                                                       L
lead to reduced medical expenditures                                                                       2009, while the overall asthma rates
                                                       also experience higher air pollution,
of $54 to $61 billion a year, and recover                                                                  increased 15 percent.27 Differences in
                                                       which affects respiratory and cardiovas-
around $13 billion annually due to work                                                                    asthma rates between Black and White
                                                       cular health as well as birth outcomes.16
lost by illness and around $240 billion per                                                                children reached a peak in 2011 (with
year due to premature deaths (2003-2006            Examples of some health inequities                      Black children twice as likely as White
spending).5,6 According to the U.S. Cen-           include:                                                children to have asthma).28 And,
ters for Disease Control and Prevention            l   American Indians and Alaska Natives                asthma-related hospitalizations and
(CDC), the rate of preventable hospital-               are twice as likely to have diabetes                deaths are more than twice as high
izations for Blacks is almost double that of           as Whites, and diabetes rates among                 among Blacks as Whites.29, 30
Whites — which contributes to over a half              Blacks and Hispanics are more than              l   Blacks, Hispanics, and American Indians
million hospitalizations and $3.7 billion in           1.5 times higher than for Whites.17                 and Alaska Natives received worse
hospitalization costs annually.7
                                                   l   Blacks are seven to nine times more                care than Whites for about 40 percent
The following are a number of examples                 likely to die from HIV, and are six times           of quality measures, according to the
highlighting factors that contribute to                more likely to die from homicide.18                 2015 National Healthcare Quality and
inequity:                                          l   Black children have the highest rate of            Disparities Report.31 Blacks and Hispanics
l    lacks and Latinos have lower median
    B                                                  lead poisoning (5.6 percent).19                     were more likely than Whites to report
    household incomes than Whites and                                                                      poor communication from healthcare
                                                   l   Blacks have the highest death rate
    are more likely to live in poverty.8                                                                   providers. Some examples of implicit
                                                       and shortest survival for most cancers
                                                                                                           bias in healthcare identified by The
l    lack men earned 70 cents for every
    B                                                  of any racial and ethnic group in the
                                                                                                           Joint Commission, Division of Health
    dollar earned by White men in 2014                 United States.20
                                                                                                           Care Improvement include: non-White
    and Hispanic men earned 60 cents on            l    lack women with breast cancer are 40
                                                       B                                                   patients receive fewer cardiovascular
    the dollar.9, 10                                   percent more likely to die than White               interventions and renal transplants;
l   People living in neighborhoods with high          women with breast cancer, despite                   non-White patients are less likely to be
    levels of poverty have a higher risk of less       similar incidence rates of the disease.21, 22       prescribed pain medications; Black men
    healthy behaviors —such as smoking,            l    lack men are about twice as likely to
                                                       B                                                   are less likely to receive chemotherapy
    physical inactivity or poor nutrition—             die from prostate cancer as Whites. 23              and radiation therapy for prostate
    which are related to inequities in the                                                                 cancer; and patients of color are more
                                                   l   Hispanic women are more than 1.5
    physical and social environment.11                                                                     likely to be blamed for being too passive
                                                       times as likely to have cervical cancer
    Access to safe neighborhoods and                                                                       about their healthcare.32
                                                       as Whites. 24
    amenities, supermarkets and quality
                                                                                                                        TFAH • healthyamericans.org     3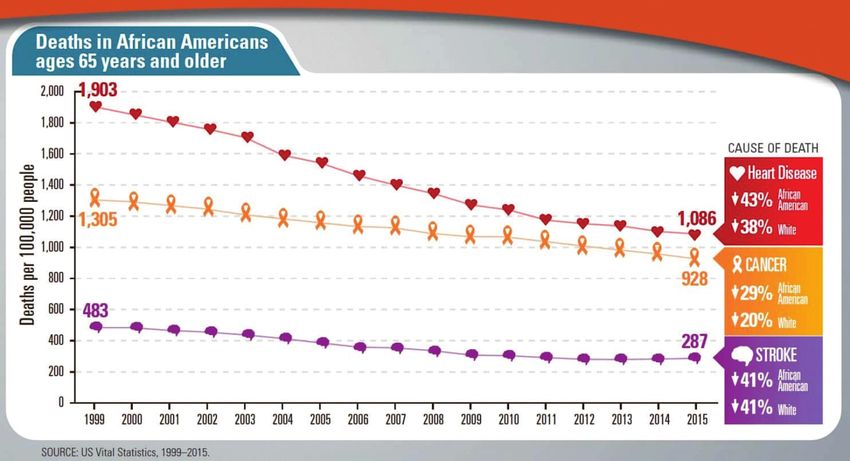
INEQUITIES IN LIFE EXPECTANCY

    Life expectancy rates vary by as much as      As of 2014, five counties had life                  comprised of more than 75 percent
    20 years between counties in the United       expectancies below 70 years (the lowest             non-Hispanic White.
    States.33 Race/ethnicity, socioeconomics      at 66.8 years) — with four of those
                                                                                                  l   Of the 50 counties with the lowest
    and healthcare explained the differences      counties having high American Indian
                                                                                                      life expectancy rates (72.6 years and
    by 74 percent, 60 percent and 27              populations. Two counties had life
                                                                                                      lower), seven had majority American
    percent respectively.                         expectancies above 86 years.
                                                                                                      Indian populations (with five above 79
                                                  l   Of the 50 counties with the highest life       percent) and 18 had majority Black
                                                      expectancy rates (82 years and above),          populations (with nine at 70 percent
                                                      35 of them had a population that was            or above).

    THE BLACK WHITE MORTALITY GAP
    Currently, on average, the life expectancy
    for Black men is 4.5 years shorter than
    for White men; and 3 years shorter for
    Black women than White women.34

    The mortality gap among Blacks and Whites
    has narrowed by around half — from 33
    percent to 16 percent — over the past 17
    years. Blacks experienced a 25 percent
    decline in overall death rates during this
    time compared to a 14 percent decrease
    among Whites.35

    Still, Blacks are more likely to die at
    relatively younger ages from a wide range
    of causes — including that Blacks ages
    18 to 49 were nearly twice as likely to die
    from diabetes, heart disease and stroke
    than Whites. However, Blacks ages 65 and
    older have a lower death rate than Whites
    ages 65 and older from heart disease,
    cancer and stroke. CDC attributes the
    consequences of psychosocial, economic
    and environmental stressors are the key
    contributors to these disparities.

4     TFAH • healthyamericans.org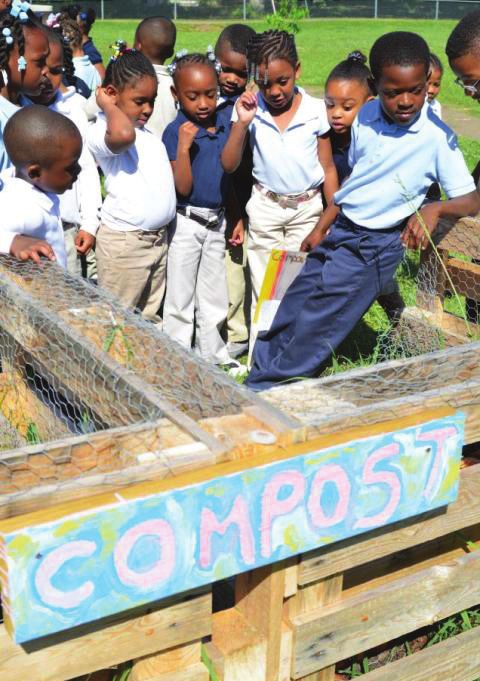
Age-adjusted death rates for selected populations: United States, 2015 and 201636
                                              1,200                                                                                            2015          2016
                                                                                21,081.2
                                                                          1,070.1

                                              1,000
Deaths per 100,000 U.S. standard population

                                                                                                         881.3 879.5

                                               800
                                                      733.1   1
                                                                  728.8                    731.0 734.1

                                                                                                                       644.1 1637.2 628.9 631.8
                                               600

                                                                                                                                                  438.3 436.4
                                               400

                                               200

                                                 0
                                                         To tal            Black male Black female White male White female             Male         Female
                                                                                               Non-Hispanic                                   Hispanic
  1
   Statistically significant decrease in age-adjusted death rate from 2015 to 2016 (p < 0.05).
  2
   Statistically significant increase in age-adjusted death rate from 2015 to 2016 (p < 0.05).
  NOTE: Access data table for Figure 2 at: https://www.cdc.gov/nchs/data/databriefs/db293_table.pdf#2
                                                                                            .
  SOURCE: NCHS,
 Source:     NCHS, National
                        NationalVitalVital
                                     Statistics System, System,
                                           Statistics   Mortality. Mortality.

  AMERICAN INDIAN LIFE EXPECTANCY
  Life expectancy for a number of counties
  with high American Indian populations
  are 20 percent lower than other counties
  in the United States.37,38 Much of the
  difference is attributed to socioeconomics
  and access to healthcare in addition to
  race/ethnicity. For instance, Oglala Lakota
  County in South Dakota, which includes
  the Oglala Sioux Tribe’s reservation, had
  the lowest life expectancy in the country
  in 2014 — at 66.8 years, and three other
  counties with tribal communities were also
  among the five lowest for life expectancy
                                                                                                                                                                    arindambanerjee / Shutterstock.com
  rates (Todd County, South Dakota with
                                                                                                         overall national rates also increased.
  the Rosebud Sioux Tribe; Buffalo County,
                                                                                                         For instance, the Oglala Lakota County
  South Dakota with the Crow Creek Sioux
                                                                                                         average life expectancy increased by 5.4
  Tribe; and Sioux County, North Dakota
                                                                                                         years during this time, from 61.3 years in
  which includes the northern portion of the
                                                                                                         1980 to 66.8 years in 2014. However,
  Standing Rock Sioux Tribe reservation).
                                                                                                         the average life expectancy for those in
  Life expectancy rates in nearly all                                                                    predominantly American Indian counties
  counties with tribal communities                                                                       is 12.5 years shorter than the overall life
  increased between 1980 and 2014, as                                                                    expectancy rate in South Dakota.

                                                                                                                                                                    TFAH • healthyamericans.org          5
Policy Recommendations
                                  TFAH has issued the following set of                and universities, must be taken into
                                  recommendation to help the nation                   account in this process. Proven,
                                  achieve health equity:                              effective programs, such as CDC’s
                                                                                      REACH (Racial and Ethnic
                                  l    reate strategies to optimize the
                                      C
                                                                                      Approaches to Community Health)
                                      health of all Americans, regardless
                                                                                      should be fully-funded and expanded.
                                      of race, ethnicity, income or where
                                      they live. All levels of government         l    ollect data on health and related
                                                                                      C
                                      must invest in analyzing needs and              equity factors — including social
                                      increasing effective policies and               determinants of health — by
                                      programs to address the systematic              neighborhood. There should be a
                                      inequities that exist and the factors           priority on improving data collection
                                      that contribute to these differences,           at a very local level to understand
                                      including poverty, income, racism               connections between health status
                                      and environmental factors. These                and the factors that impact health to
                                      should include community-driven                 help identify concerns and inform
                                      approaches, including using place-              the development of strategies to
                                      based approaches to target programs,            address them. Collecting and
                                      policies and support effectively.               reporting data by neighborhood at
                                                                                      a zip code or even more granular
                                  l    xpand cross-sector collaborations
                                      E
                                                                                      neighborhood level are essential.
                                      addressing health equity. Improving
                                      equity in health will require supporting    l    upport Medicaid coverage and
                                                                                      S
                                      and expanding cross-sector efforts to           reimbursement of clinical-community
                                      make communities healthy and safe.              programs to connect people to
                                      Efforts should engage a wide range of           services that can help improve health.
                                      partners, such as schools and businesses,       Medicaid should reimburse efforts
                                      to focus on improving health through            that support improved health beyond
                                      better access to high-quality education,        the doctor’s office — programs such
                                      jobs, housing, transportation and               as asthma and diabetes prevention and
                                      economic opportunities.39                       care management and community-
                                                                                      based initiatives, can help better
                                  l    ully fund and implement health
                                      F
                                                                                      address the root causes that contribute
                                      equity, health promotion and
                                                                                      to inequities.
                                      prevention programs in communities.
                                      Partner with a diverse range of             l    ommunicate effectively with diverse
                                                                                      C
                                      community members to develop                    community groups. Federal, state,
                                      and implement health improvement                local and tribal officials must design
                                      strategies. Federal, state, local and           culturally competent, inclusive
                                      tribal governments must engage                  and linguistically appropriate
                                      communities in efforts to address               communication campaigns that use
                                      both ongoing and emergency health               respected, trusted and culturally
                                      threats. The views, concerns and                competent messengers to communicate
                                      needs of community stakeholders,                their message. Communication
                                      such as volunteer organizations,                channels should reflect the media
                                      religious organizations and schools             habits of the target audience.

6   TFAH • healthyamericans.org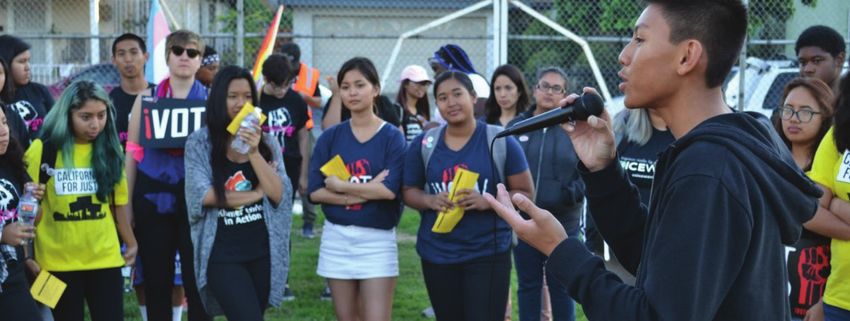
l    rioritize individual and community
    P
    resiliency in health emergency
    preparedness efforts. Federal, state,
    local and tribal government officials
    must work with communities and
    make a concerted effort to address
    the needs of low-income, minority and
    other vulnerable groups during health
    emergencies. Public health leaders
    must develop and sustain relationships
    with trusted organizations and
    stakeholders in diverse communities on
    an ongoing basis—including working
    to improve the underlying health of
    at-risk individuals, sub-population
    groups and communities, so these
    relationships are in place before a
    disaster strikes. Communication and
    community engagement must be
    ongoing to understand the disparate
    needs of various populations.
                                                                                                  Linda Parton / Shutterstock.com
l    liminate racial and ethnic bias
    E                                           l   I ncorporate strategies that foster
    in healthcare. Policies should                  community agency—or a community’s
    incentivize equity and penalize                 collective ability and opportunity to
    unequal treatment in healthcare, and            make purposeful choices—into the
    there should be increased support               design, implementation and governance
    for programs to increase diversity              of multi-sector collaborations. Building
    in and across health professions.               community agency can contribute
    Some of The Joint Commission’s                  to improved community health by
    recommendations for combatting                  yielding a deeper understanding of
    implicit bias include: assiduously              the challenges and opportunities
    practicing evidence-based medicine;             influencing a community, and relies
    supporting cultural understanding               on an asset-based approach to leverage
    and avoiding stereotypes; supporting            existing community strengths and
    the National Standards for Culturally           resources. Multi-sector collaborations
    and Linguistically Appropriate Services         should include dedicated resources for
    in Health and Health Care; and                  fostering and measuring community
    supporting techniques that de-bias care,        agency. Efforts should maximize and
    including through training, perspective-        bolster community voice and power as
    taking, emotional expression and                a means to influencing larger policy-
    counter-stereotypical exemplars.40 In           and systems-level changes (including
    addition, efforts should be increased           those within and outside of the
    to train more healthcare professionals          traditional health sector).
    from under-represented populations so
    that the workforce reflects the diversity
    of the patient population.

                                                                                               TFAH • healthyamericans.org          7
Examples     The following examples illustrate several current initiatives
                                  that target the higher rates of preventable injuries, illnesses
                  of Programs
                                  and deaths. They highlight diverse practices that incorporate
                   Addressing     organizations and individuals from multiple sectors including
                 Health Equity    education, criminal justice and business as well as public health
                                  and healthcare. While every community and effort is unique,
                                  they all share an approach of focusing on equity and inclusive
                                  work at the local community level.

                                  The California Endowment’s Building Healthy Communities
                                  The California Endowment (TCE) created an      undocumented; the promotion of healthy
                                  ambitious $1 billion, 10-year project called   school environments and altered school
                                  Building Healthy Communities (BHC) in          policies such as those related to discipline
                                  2010. Its goal is to improve the health and    and suspension; the reform of the justice
                                  well-being of young people in underserved      system; and the implementation of multiple
                                  communities by reducing or eliminating         local changes that make communities
                                  harmful conditions. It has provided funding    safer and more walkable.
                                  to 14 community-based organizations
                                                                                 BHC is noteworthy in its commitment to
                                  across the state to undertake activities
                                                                                 developing long-term relationships with
                                  that were customized to the specific local
                                                                                 specific partners, placing the decision-
                                  conditions but which had the potential
                                                                                 making authority for the usage of the
                                  to affect state policies and practices
                                                                                 grants at the community level and focusing
                                  as well. As a result of its work, BHC
                                                                                 on youth leadership and organizing.
                                  has seen improvements in healthcare
                                  coverage, including for those who were

8   TFAH • healthyamericans.org
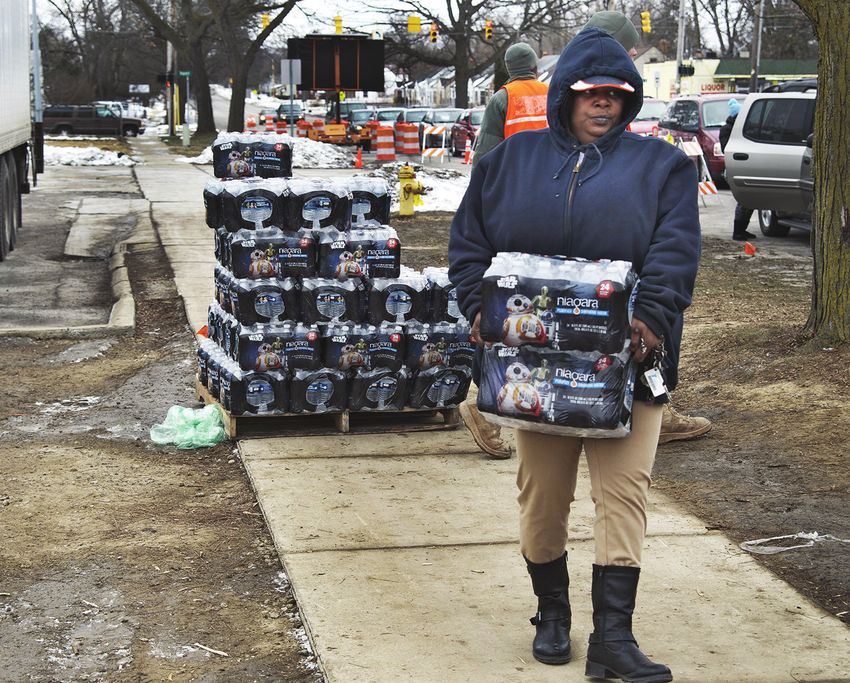
Minnesota Public Health Department
The Minnesota Department of Health               Triple Aim of Health Equity
prioritized work on health equity. It created
                                                  Assess & Influence the                          Crosswalk to the 7 Foundational Practices
an internal Center for Health Equity and
                                                  Policy Context
a Health Equity Advisory and Leadership
(HEAL) Council as part of a broad effort.                                                                    Lead with an Equity Focus
The Center has awarded scores of grants                                                                      Use Data to Advance Health
to community agencies including ones              Build Partnerships                                         Equity
that identify and address the social and          & Community                                                Develop Workforce via
                                                  Capacity                   Implement Health                Continuous Learning
economic conditions that contribute to                                         in All Policies
inequities and ones that support the                                                                         Use & Target Resources
                                                                                                             Strategically
improvement of the health status of
groups with poorer health. The Health
Department has taken steps to establish                                                                                 Expand the
an open participatory process for this                              Strengthen                  Expand                  Understanding of
work, including many members of the                                 Community                Understanding              Health
populations at highest risk of illness, injury                       Capacity                  of Health
and preventable deaths on the Advisory
Council and holding statewide meetings to
discuss progress toward health equity.
                                                 policies, expanding the understanding            state including materials on emergency
It has developed a framework for                 of health and strengthening community            communications, paid sick leave and health
considering the work that is known as            capacity. The Health Department has              statistics (http://www.health.state.mn.us/
the Triple Aim of Health Equity with three       developed a series of reports and resources      divs/opi/healthequity/resources/).
components: implementing health in all           on the topic for those in and beyond the

Roadmap to Health Equity
The health indicators for the Black              nutrition and provide them with healthy
population of Mississippi are significantly      foods. It offers a leadership program for
worse than for the White population. Black       young students that provides educational
residents live on average 4 years less than      lessons in school-work, presentation
Whites and have more deaths from cancer,         skills and beneficial eating and exercising
heart disease, HIV and many other chronic        practices.
conditions. The Mississippi Roadmap
                                                 For adults, the Roadmap runs a Mobile
to Health Equity, Inc., a community-
                                                 Farmer’s Market that delivers fresh fruit
based organization in Jackson, is actively
                                                 and vegetables to older residents of
engaged in improving those statistics with
                                                 geographically isolated housing complexes.
its focus on changing the conditions in the
                                                 And it runs a fitness center for adults and
lives of the low-income Black population.
                                                 children that is accessible and affordable
It has a strong focus on the health of           with minimal membership fees. Support
children by supporting food and nutrition        for the Roadmap has been provided
awareness policies within schools. It is         by the W. K. Kellogg Foundation. More
responsible for multiple school gardens          information on the Roadmap is available at
that are used to teach children about            http://mississippiroadmap.org/.

                                                                                                                 TFAH • healthyamericans.org   9
Colorectal Cancer Screening
                                   Racial and ethnic minority populations
                                   often have lower colorectal cancer
                                   screening rates than White populations
                                   (U.S. White rates were 65 percent
                                   compared to 62 percent, 54 percent and
                                   50 percent rates for Black, American Indian
                                   and Latino populations respectively).41

                                   Specialized outreach and education                         Colorectal Health
                                                                                             Protect Yourself, Your Family, and Our Community
                                                                                                                                                    C
                                                                                                                                                   Prote
                                   programs have been shown to be effective
                                   at closing the gap by using multiple targeted
                                   approaches such as patient reminders
                                                                                   The Washington State program utilized pa-
                                   and patient navigators for outreach and
                                                                                   tient care coordinators at community health
                                   assistance. Two examples of such successful
                                                                                   center sites to implement client and provider
                                   efforts are the Alaska Native Tribal Health
                                                                                   telephone and electronic health record re-
                                   Consortium and Washington State’s Breast,
                                                                                   minder systems and to provide staff training
                                   Cervical and Colon Health program.
                                                                                   on the protocols for scheduling of screening.
                                   The Alaska Consortium collaborated with
                                                                                            Colorectal
                                                                                   In both cases,      colonoscopy
                                                                                           Protect Yourself,
                                                                                                                           Health
                                                                                                                              rates
                                                                                                             Your Family, and Our    for popula-
                                                                                                                                  Community
                                                                                                                                                    C
                                                                                                                                                   Prote

                                   regional tribal health organizations to hire    tions of color dramatically increased,
                                   patient navigators to do outreach and one-      sometimes doubling what they were
                                   on-one patient education and to assist          before.42, 43 More information about evi-
                                   with transportation and other barriers to       dence-based programs to reduce chronic dis-
                                   accessing appointments. In addition, they       eases that disproportionately affect specific
                                   developed an electronic system to send both     populations is available at https://www.cdc.
                                   clinician and client informational reminders.   gov/chronicdisease/healthequity/index.htm.

                                   Healthy Heartlands
                                   The Healthy Heartlands initiative is an         the social determinants of health for low-
                                   eight-state network of public health            income communities and communities
                                   professionals and faith-based community         of color using a racial health equity lens.
                                   organizers working to reduce health             Leaders from across the participating
                                   inequities through democracy building and       Midwestern states gather regularly to
                                   policy and system changes.44 The initiative     share best practices and advance an
                                   combines the research, institutional            action agenda for racial and health equity.
                                   legitimacy and content expertise of public      Past efforts have included campaigns to
                                   health leaders with the local voice, power      increase employment opportunities for
                                   and engagement capacities of community          formerly incarcerated persons, expand
                                   organizers. Through their collaborative         access to healthy food and promote free,
                                   actions, the network of interdisciplinary       quality early education.
                                   leaders works to identify and address

10   TFAH • healthyamericans.org
Robert Wood Johnson Foundation Culture of Health Sentinel
Communities—Stockton, CA
Located in Northern California, Stockton and community stakeholders to
has long been plagued by crime and improve their city’s safety, education,
poverty. The crime rate in Stockton housing, job creation, and health.
is more than three times the rate in RSSC deploys four outreach workers to
California. And there are high levels of build trust and relationships between
poverty, which are highest among racial community members and government
and ethnic minority communities, where officials, assess community needs
nearly 50 percent of Black residents and appropriately connect residents
and more than 29 percent of Hispanic to available services/supports. Other
residents were living below the federal efforts include a 2014 ¾ cent tax to
poverty level (compared with less than increase the capacity of the police force
17 percent of White residents).45 from 400 officers in 2015 to a goal of
485 by 2017.
Community members and public officials
are collaborating to address these Stockton, CA is one of RWJF’s 30 Sentinel
issues by elevating early intervention Communities chosen to collect, analyze
and education, fostering cross-sector and disseminate community-level data
collaboration, reducing barriers to to provide insight on the best practices
housing and homeownership, and and lessons for improving health and
strengthening integration of health wellbeing. Baseline data was collected
services and systems. In 2015, city in 2016 and future community snapshot
council and community members reports will include more in-depth analysis
created the Reinvent South Stockton and insight on health equity outcomes
Coalition (RSSC) to empower residents and process measures.
TFAH • healthyamericans.org 11Endnotes
1 W.K. Kellogg Foundation. Taking Collective 18 Cunningham TJ, Croft JB, Liu Y, Lu H, Eke PI, 34 N ational Center for Health Statistics. Health,
Action for Racial Healing. http://healourcom- Giles WH. Vital Signs: Racial Disparities in Age- United States, 2015: With Special Feature on
munities.org/ndorh-2018/. Specific Mortality Among Blacks or African Amer- Racial and Ethnic Health Disparities—Table 18.
2 Braveman P, Arkin E, Orleans T, Proctor D, icans — United States, 1999–2015. MMWR Morb Hyattsville, MD: National Center for Health
and Plough A. What Is Health Equity? And Mortal Wkly Rep 2017;66:444–456. DOI: http:// Statistics, 2016
What Difference Does a Definition Make? Princ- dx.doi.org/10.15585/mmwr.mm6617e1. 35 C unningham TJ, Croft JB, Liu Y, Lu H, Eke
eton, NJ: Robert Wood Johnson Foundation, 19 T rust for America’s Health, Blueprint for a PI, Giles WH. Vital Signs: Racial Disparities in
2017. https://www.rwjf.org/content/dam/ Healthier America 2016: Policy Priorities and Age-Specific Mortality Among Blacks or Afri-
farm/reports/issue_briefs/2017/rwjf437343. Recommendations for the Next Administration and can Americans — United States, 1999–2015.
3 Waidmann, TA. Estimating the Cost of Racial Congress (2015) (available at http://tfah.org/ MMWR Morb Mortal Wkly Rep 2017;66:444–
and Ethnic Health Disparities. Washington, assets/files/TFAH-2016-Blueprint-FINAL.pdf) 456. DOI: http://dx.doi.org/10.15585/
DC: Urban Institute, 2009. 20 Cancer Facts and Figures for African Ameri- mmwr.mm6617e1
4 Ibid. cans. In American Cancer Society. http://www. 36 K ochanek KD, Murphy SL, Xu JQ, Arias E.
cancer.org/research/cancerfactsstatistics/ Mortality in the United States, 2016. NCHS Data
5 LaVeist TA, Gaskin D, Richard P. Estimat- cancer-facts-figures-for-african-americans (ac- Brief, no 293. Hyattsville, MD: National Cen-
ing the economic burden of racial health cessed September 2016). http://www.cancer. ter for Health Statistics. 2017.
inequalities in the United States. Int J Health org/research/cancerfactsstatistics/cancer- 37 D wyer-Lindgren L, Bertozzi-Villa A, Stubbs
Serv. 2011;41(2):231-8. facts-figures-for-african-americans RW, Morozoff C, Mackenbach JP, van Lenthe
6 LaVeist TA, Gaskin D, Richard P. The Economic 21 Hunt BR, Whitman S and Hurlbert MS. Increas- FJ, Mokdad AH, Murray CJL. Inequalities
Burden Of Health Inequalities in the United ing Black: White disparities in breast cancer mor- in Life Expectancy Among US Counties,
States. Washington, DC: Joint Center for Po- tality in the 50 largest cities in the United States. 1980 to 2014Temporal Trends and Key Driv-
litical and Economic Studies, n.d. Cancer epidemiology. Apr 30;38(2):118-123, 2014. ers. JAMA Intern Med. 2017;177(7):1003–1011.
7 Centers for Disease Control and Prevention. doi:10.1001/jamainternmed.2017.0918
22 Breast Cancer Rates by Race and Ethnicity. In
CDC Health Disparities and Inequalities Report — Centers for Disease Control and Prevention. http:// 38 K rul, DU. Life Expectancy Falling in the US
United States, 2013. Atlanta, GA: CDC, 2013. www.cdc.gov/cancer/breast/statistics/race.htm — But in Tribal Communities Not So Much.
8 Proctor BD, JL Semega and MA Kollar. Income Indian Country Today. May 11, 2017. https://
23 Prostate Cancer Rates by Race and Ethnicity.
and Poverty in the United States: 2016. Wash- indiancountrymedianetwork.com/culture/
In Centers for Disease Control and Prevention.
ington , DC: United States Census Bureau, health-wellness/life-expectancy-falling-us-
http://www.cdc.gov/cancer/prostate/statis-
2016. https://www.census.gov/content/dam/ tribal-communities-not-much/.
tics/race.htm
Census/library/publications/2016/demo/
24 Cervical Cancer Rates by Race and Ethnicity. 39 N ational Prevention Council. National
p60-256.pdf.
In Centers for Disease Control and Prevention. Prevention Strategy: Elimination of Health
9 Wilson, V. “New Census Data Show No Prog- Disparities. Washington, DC: National
http://www.cdc.gov/cancer/cervical/statis-
ress in Closing Stubborn Racial Income Gaps. Prevention Council, 2014.
tics/race.htm
Working Economics Blog September 16,
25 Centers for Disease Control and Prevention. 40 T he Joint Commission. Implicit Bias in Health
2015. https://www.epi.org/blog/new-census-
CDC Health Disparities and Inequalities Report — Care. April 2016. https://www.jointcom-
data-show-no-progress-in-closing-stubborn-ra-
United States, 2013. Atlanta, GA: CDC, 2013. mission.org/assets/1/23/Quick_Safety_
cial-income-gaps/ https://www.epi.org/blog/ Issue_23_Apr_2016.pdf
new-census-data-show-no-progress-in-closing- 26 Sudden Unexpected Infant Death and Sud-
stubborn-racial-income-gaps/. den Infant Death Syndrome. In Centers for 41 https://www.cancer.org/content/dam/can-
Disease Control and Prevention. http://www.cdc. cer-org/research/cancer-facts-and-statistics/
10 DeNavas-Walt C, Proctor BD. Income and
gov/sids/data.htm colorectal-cancer-facts-and-figures/colorectal-
Poverty in the United States: 2014. Washing- cancer-facts-and-figures-2017-2019.pdf
ton , DC: United States Census Bureau, 2015. 27 Centers for Disease Control and Prevention.
Vital Signs: Asthma in the U.S. Atlanta, GA: 42 J oseph DA, Redwood D, DeGroff A, Butler
11 C
ubbin C, Pedregon V, Egerter, S, Braveman P.
Centers for Disease Control and Prevention, EL. Use of evidence-based interventions
Issue Brief 3: Neighborhoods and Health. Princ-
2011. http://www.cdc.gov/vitalsigns/asthma/ to address disparities in colorectal cancer
eton, NJ: Robert Wood Johnson Foundation, screening. MMWR Suppl 2016:2016;65(No.
Commission to Build a Healthier America, 2008. 28 Akinbami LJ, Simon AE and Rossen LM. Suppl 1).
12 Meyer PA, Yoon PW, Kaufmann RB. Introduc- Changing trends in asthma prevalence
among children. Pediatrics, 137(1):1-7, 2016. 43 C ommunity Preventive Services Task Force.
tion: CDC Health Disparities and Inequalities Updated recommendations for client- and
Report — United States, 2013. Morb Mort Sur- 29 Centers for Disease Control and Prevention. provider-oriented interventions to increase
veil Summ, 2013; 62(3): 3-5 National Surveillance of Asthma: United States, breast, cervical, and colorectal cancer screen-
13 Powell L, Slater S, and Chaloupka F. The 2001-2010. National Center for Health Sta- ing. Am J Prev Med 2012;43:92–6 .
Relationship between Community Physical tistics Data Brief, 2012. http://www.cdc.gov/
nchs/data/series/sr_03/sr03_035.pdf 44 H ealthy Heartlands. In ISAIAH. https://isa-
Activity Settings and Race, Ethnicity and So- iahmn.org/healthy-heartlands/
cioeconomic Status. Evidence-Based Preventive 30 Most Recent Asthma Data — Mortality. In Cen-
Medicine, 1(2): 135-44, 2004. ters for Disease Control and Prevention. http:// 45 RWJF. RWJF Culture of Health Sentinel Commu-
www.cdc.gov/asthma/most_recent_data.htm nity Snapshot: Stockton, California. Princeton,
14 Bell JF, Wilson JS, and Liu GC. Neighborhood NJ: RWJF, 2017. https://www.cultureofhealth.
Greenness and 2-Year Changes in Body Mass 31 2 015 National Healthcare Quality and Disparities org/content/dam/COH/PDFs/stockton-
Index of Children and Youth. American Jour- Report and 5th Anniversary Update on the National california-full-snapshot.pdf
nal of Preventive Medicine, 35(6): 547-553, 2008. Quality Strategy. Rockville, MD: Agency for
15 Why Low-Income and Food Insecure People Healthcare Research and Quality; April 2016.
are Vulnerable to Obesity. In Food Research AHRQ Pub. No. 16-0015. http://www.ahrq.
and Action Center. http://frac.org/initiatives/ gov/sites/default/files/wysiwyg/research/
hunger-and-obesity/why-are-low-income-and- findings/nhqrdr/nhqdr15/2015nhqdr.pdf
food-insecure-people-vulnerable-to-obesity/. 32 The Joint Commission. Implicit Bias in Health
16 Miranda ML, Edwards SE, Keating MH, Paul Care. April 2016. https://www.jointcom-
CJ. Making the Environmental Justice Grade: mission.org/assets/1/23/Quick_Safety_
The Relative Burden of Air Pollution Expo- Issue_23_Apr_2016.pdf
sure in the United States. Int J Environ Res 33 Dwyer-Lindgren L, Bertozzi-Villa A, Stubbs
Public Health. 2011 Jun; 8(6): 1755–1771. RW, Morozoff C, Mackenbach JP, van Lenthe
FJ, Mokdad AH, Murray CJL. Inequalities
1730 M Street, NW, Suite 900
17 Centers for Disease Control and Prevention. Di-
abetes Report Card 2014. Atlanta, GA: Centers for in Life Expectancy Among US Counties, Washington, DC 20036
1980 to 2014Temporal Trends and Key Driv-
Disease Control and Prevention, 2015. http://
ers. JAMA Intern Med. 2017;177(7):1003–1011.
(t) 202-223-9870
www.cdc.gov/diabetes/pdfs/library/diabetes-
reportcard2014.pdf (accessed September 2016). doi:10.1001/jamainternmed.2017.0918. (f) 202-223-9871You can also read