Facts Figures a n d - Papworth Trust
←
→
Page content transcription
If your browser does not render page correctly, please read the page content below
Facts    and
Figures
2 0 1 8
Disability in the United Kingdom
Contents
Section Page
01 Foreword 4
02 Methodology 5
03 Key Statistics 6
04 Class/Income and Poverty 8
05 Age 11
06 Gender 12
07 Ethnicity & Geography 13
08 Hearing 15
09 Sight Loss 17
10 Mental Health 18
11 Children 20
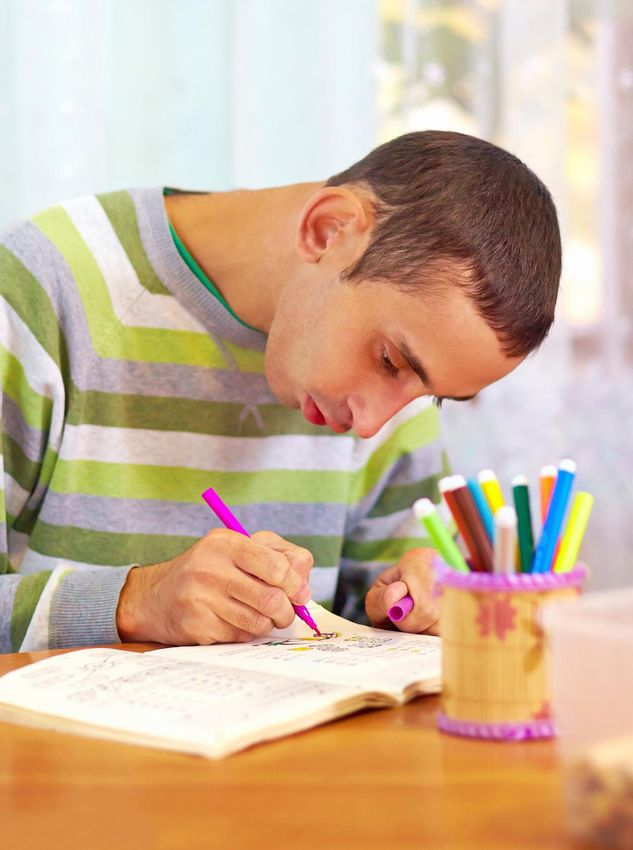
12 Learning Disabilities 22
13 Carers 25
14 Social Care 28
15 Employment 32
16 Education 38
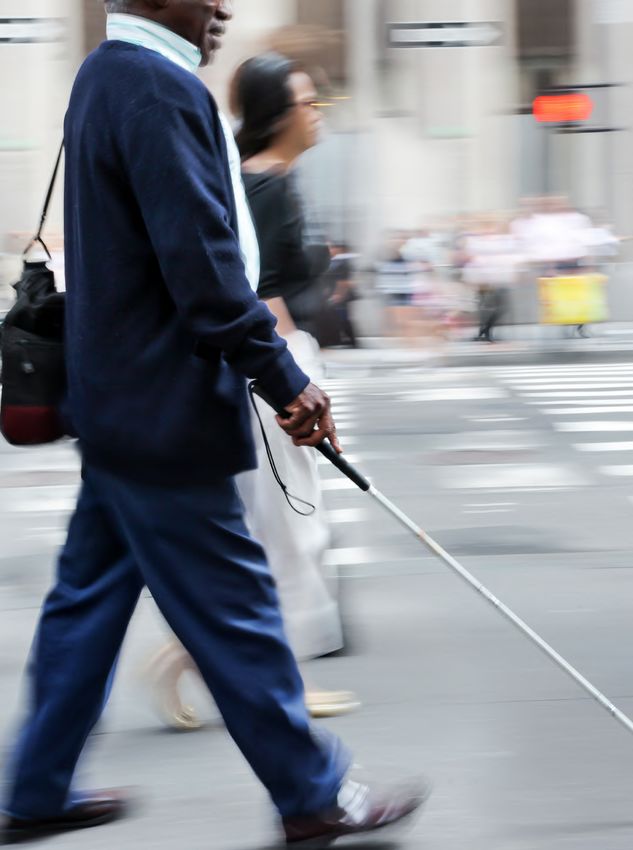
17 Transport 40
18 Housing 42
19 Accessibility 48
20 References 51
2 01480 357 200 policy@papworthtrust.org.uk www.papworthtrust.org.uk 3
01                                                                                           02
    Foreword                                                                                      Methodology
    Welcome to the eighth edition of            This year’s edition includes a new                This report gives an overview on the         It is important to note that the different
    Papworth Trust’s Disability Facts and       chapter on Carers, exploring the                  most recent facts and figures about          sources are not necessarily compatible
    Figures. This includes information on the   challenges the current care funding               disability in the United Kingdom today.      and that the data may be based on
    key areas of disabled people’s lives and    crisis brings and the impact on                   It covers the key policy areas that          different definitions. However, most of
    outlines the challenges they face every     individuals who provide unpaid care.              Papworth Trust focuses on, including         the information in this report has been
    single day. We hope that you find this                                                        employment, social care and housing.         provided in line with the Equality Act
    report both useful and informative.         Facts and Figures is designed to                  It also covers key areas including           2010 definition, which states:
                                                inform, initiate and encourage debate             education, transport and accessibility
    In line with Papworth Trust’s priorities,   around the key issues affecting                   as well as well as the prevalence of         A person has a disability if:
    this year’s edition pays particular         disabled people. If you would like more           specific impairments.
    attention to employment, social care        information or wish to provide us with                                                          • They have a physical or mental
    and housing, our key policy areas.          any feedback, please contact us on                This report is a result of a comprehensive        impairment
    We believe they hold the greatest           policy@papworthtrust.org.uk.                      search into the latest statistics on all      • The impairment has a substantial
    inequality for disabled people and are                                                        aspects of disability. It uses information        and long-term adverse effect on
    therefore the areas that require the                                                          from the most recent surveys and                  their ability to perform normal
    greatest socio-economic and political                                                         reports, as well as data derived                  day-to-day activities.
    change. Through the services provided                                                         from other charities. We believe that
    by Papworth Trust, we work hard to                                                            information from a variety of different
    support disabled people to have                                                               sources will help capture the breadth
    equality, choice and independence in                                                          of issues affecting disabled people.
    their                                       Rob Hammond
    daily lives.                                Chair

4                                               01480 357 200      policy@papworthtrust.org.uk   www.papworthtrust.org.uk                                                                   5
03
Hearing Carers Education
• Hearing loss increases with age. • There are around 7 million carers in • Disabled young people aged 16-
More than 70% of over 70 year olds the UK, this is equivalent to 1 in 10 18 were at least twice as likely as
and 40% of over 50 year olds have people. 13 their non-disabled peers to not be in
some form of hearing loss. 6 education, employment or training. 21
• In the UK, 3 in 5 people will be carers
at some point in their lives. 14 • The proportion of disabled people
Sight Loss with no qualifications is nearly three
Key • Every day in the UK, 250 people
start to lose their sight. 7
Social Care
• Carers are currently providing
times that of non-disabled people. 22
Statistics care worth £132 billion a year,
Transport
• The number of people living with
sight loss will increase to more than the equivalent to the UK’s total • The main modes of transport for
2.7 million in 2030 and four million healthcare annual spend, and over people with a mobility difficulty are:
in 2050. 8 two million people have already
- Driving (38%)
given up work to care. 15
- Being a passenger in a car (30%)
• Disabled people between the ages
Mental Health of 18-65 represent one third of social
- Walking (16%)
Class, Income & Pay • By 2030, there are expected to be care users.
- Bus (9%)
- Other (8%). 23
• Full-time disabled workers earn on two million more adults with mental
• The social care funding gap –
average 12.6% less (£75 a week) health problems than in 2013. 9
i.e. the gap between costs and
than full-time non-disabled people. 1 • 50% of mental health problems are revenue – is projected to reach
Housing
• There are 4.2 million disabled established by age 14 and 75% by £2.1bn by 2019/20. 16 • There are 1.8 million disabled people
people living in poverty, which is age 24. 10 with unmet housing needs, 580,000 of
29% of all people living in poverty. 2 whom are of working age. 24
Employment
Children • Disabled people are twice as
• As a result of unmet housing needs
Gender • 7% of children in the UK are likely to be unemployed than non-
for accessible housing, disabled
people are four times more likely to be
• There are more disabled women disabled and 10% of children in the disabled people. 17
unemployed or not seeking work. 25
than men in the UK (23% compared UK live in a family with at least one
to 19%). 3 • By the age of 26, disabled people
disabled child. 11 • Two thirds of single disabled people
are four times more likely to be out of
living alone are in poverty. 26
• It costs three times more to raise a work or not in education, compared
Location disabled child, as it does to raise to non-disabled people. 18
a non-disabled child. 12 Accessibility
• In 2016, Wales had the highest • Early intervention is key to prevent
percentage of disabled people people from falling out of work. 19 • The most commonly reported
(26%). 4 difficulties for disabled people
• 1 in 5 employers say they would
in accessing goods and public
• London had the lowest percentage be less likely to employ a disabled
services:
of disabled people (14%). This is person. 20
equivalent to 1.2 million disabled - Shopping (20%)
people. 5 - Cinema/theatre/concerts (15%)
- Pubs and restaurants (14%). 27
6 01480 357 200 policy@papworthtrust.org.uk www.papworthtrust.org.uk 7
04                                                                                                                                                                    £30
                                                                                                    The Wage Gap and Income
                                                                                                    •

                                                                                                    •
                                                                                                        Disabled people who are in employment often face a
                                                                                                        significant pay gap.31

                                                                                                        On both relative and absolute low income measures,
                                                                                                                                                                         a week
                                                                                                        those living in a family with a disabled member are more         Disabled people
                                                                                                        likely to be in low income than non-disabled families. 32        working part-time

    Class/Income
                                                                                                    •   Full-time disabled workers earn on average 12.6% less            earn on average
                                                                                                        (£75 a week) than full-time non-disabled people. 33              14.1% less, £30 a
                                                                                                                                                                         week, than part-

    and Poverty
                                                                                                    •   Disabled people working part-time earn on average
                                                                                                        14.1% less (£30 a week) than part-time non-disabled              time non-disabled
                                                                                                        workers. 34
                                                                                                                                                                         workers.
                                                                                                    •   Disabled people are more likely to be in low-paid jobs
                                                                                                        than non-disabled people. 35

                                                                                                    •   30% of disabled men and 35% of disabled women are
    •   The main reason why so many disabled people are                                                 paid below the living wage compared with 25% of
        in low-income households is a result of their high                                              non-disabled men and 29% of non-disabled women. 36
        levels of unemployment. 28
                                                                                                    •   Among types of impairment, the largest proportion of
    •   Three-quarters of households using food banks                                                   workers paid below the living wage (about 35%) is those
        contain someone with a health condition and/or                                                  with a mental impairment.37
        disability, with one-third of households containing
        someone with a mental health issue. 29                                                      •   The pay gaps for those with physical impairments are
                                                                                                        also substantial. Men with physical impairments generally
    •   After housing costs, the proportion of working age                                              experience pay gaps in the range of 15% to 28%,
        disabled people living in poverty (28%) is higher                                               depending on the nature of the disability.38                     Disabled people
        than the proportion of working age non-disabled
                                                                                                    •   The difference between non-disabled women’s pay
                                                                                                                                                                         are more likely
        people (18%). 30
                                                                                                        and that of women with physical impairments ranges               to be in low-paid
                                                                                                        from 8% to 18%. 39                                               jobs than non-
                                                                                                                                                                         disabled people.
                                                                                                    Living Standards

              £75 a week                                                                            •   The spending power of families with at least one disabled
                                                                                                        person is estimated by the Government to be over
                                                                                                        £200bn a year. 40
        Full-time disabled workers earn on
        average 12.6% less, £75 a week,                                                             •   Disabled people’s day-to-day living costs are 25% higher
                                                                                                        than those of non-disabled people. 41
        than full-time non-disabled people.
                                                                                                    •   Across Great Britain, 59% of families with children, that were
                                                                                                        in income poverty and that contained a disabled person,
                                                                                                        lived in material deprivation in 2014/15, compared with an
                                                                                                        average material deprivation rate of 20%. 42

8                                                     01480 357 200   policy@papworthtrust.org.uk    www.papworthtrust.org.uk                                                                9
•   Disabled people over the age of 65 were twice as likely
         as non-disabled people in the same age group to be in
         food poverty: 6.8% compared with 3.3%. 43

     Extra Costs
                                                                                  £
                                                                                                          05
                                                                                                           Age
     •   Disabled people spend an average of £550 a month on
         costs related to their disability. 44

     •   This may include buying specialised equipment, having
         to spend more on heating bills, or being subject to higher
         insurance premiums. 45                                           £108,000
                                                                          On average,

                                                                                                                                                                          13.3
     •   Disabled people and their families in the UK had an
         aggregate annual household income of £249 billion                                                  Disability in the UK varies by age group
                                                                          disabled people
         in 2014/15. 46
                                                                          have £108,000                      • There are 13.3 million disabled people living in the UK:

                                                                                                                                                                          million
     •   Over a third of disabled people spend additional money
                                                                          less in savings and                   • 7% of children are disabled
         on clothing and bedding as a result of their impairment. 47
                                                                          assets than non-                      • 18% of working age adults are disabled
     •   1 in 3 disabled people spend money on specialised                disabled people.
         equipment. 48                                                                                          • 44% of pension age adults are disabled.54               Disabled people
                                                                                                                                                                          living in the UK

     Impact                                                                                                 Health and Age                                                7%
     •   Disabled people are twice as likely to have unsecured                                              •   The Family Resources Survey reported that in the          of children
         debt totalling more than half of their household income. 49                                            last three years, mobility was the most prevalent         are disabled
                                                                                                                impairment reported. However, reporting of this type
     •   On average, disabled people have £108,000 less in
         savings and assets than non-disabled people. 50
                                                                                                                of impairment decreased from 55% in 2013/14 to 52%
                                                                                                                in 2015/16.55                                             18%
                                                                                                            •   Only 17% of disabled people were born with their
                                                                                                                                                                          of working age
                                                                                                                impairment. The majority of disabled people acquire       adults are disabled
     Poverty                                                                                                    their disability later in life. 56

     •   There are 4.2 million disabled people living in poverty,                                           •   Disabled people of state pension age are more             44%
         which is 29% of all people living in poverty. 51                                                       likely than those of working age to report multiple       of pension age
     •   Of disabled people living in poverty, 2.8 million are
                                                                                                                impairments, including mobility (68%), hearing (23%)      adults are disabled.
                                                                                                                and vision (18%). 57
         working aged adults, 1.1 million are pensioners and
         320,000 are children. 52

     •   Disability is strongly linked to poverty. 30% of people
         in families with disabled members live in poverty,
         compared to 19% of those who do not. 53

10                                                        01480 357 200     policy@papworthtrust.org.uk   www.papworthtrust.org.uk                                                               11
06                                                                                                 07
     Gender                                                                                              Ethnicity &
                                                                                                         Geography
                                                                       23%
     •   There are more disabled women than men in the UK
         (23% compared to 19%). 58

     •   In the most recent Family Resources Survey, for every
         age group over the age of 20, a greater proportion            of women                            • The prevalence of disability varies by ethnicity.
                                                                                                             Research from the Centres for Disease Control and
         of females than males reported having a disability.
         The difference was greatest in the 45 to 49 age range                                               Prevention (CDC) found:
                                                                       compared to
         (5%). In the 50 to 54 age range, 25% of women and                                                   • 1 in 4 black/African/ adults have a disability

                                                                       19%
         21% of men reported a disability. 59
                                                                                                             • 1 in 5 White adults have a disability
     •   According to an analysis of living conditions in Europe, a
                                                                                                             • 1 in 6 Hispanic adults have a disability

                                                                       of men
         quarter of women and 1 in 6 men aged 65 and above
         will be physically disabled in Europe by 2047, according                                            • 1 in 10 Asian adults have a disability.62
         to an analysis of living conditions in Europe. 60

     •   The most recent Family Resources Survey highlighted
                                                                       have a disability.
                                                                                                           • Adults with an impairment from black or black British
         the percentage of adults providing informal care                                                    ethnic backgrounds report the highest number of life
         varied by gender:                                                                                   areas (for example, education or leisure) in which
                                                                                                             participation is restricted, while adults from white
         • Women are more likely to provide informal care
                                                                                                             ethnic backgrounds report the lowest. 63
           than men up to the 65-74 age group

         • From the age of 75, men are more likely to provide
           informal care than women

         • Of those aged 85 and over, 11% of men are providers
           of informal care compared to only 2% of women

         • Women providing informal care were much more
           likely to be in part-time employment than men: 23%
           of women providing informal care worked part-time
           compared to 9% of men. 61

12                                                     01480 357 200      policy@papworthtrust.org.uk   www.papworthtrust.org.uk                                     13
Health and Social Care
• Research shows that when people from black minority
ethnic communities have health or social care needs,
they are more likely than other people to have difficulty
finding and using appropriate services, and are more
21%
22%
25%
20%
08
likely to experience poor outcomes. 64
Hearing
• Demographics from 2016/17 found that Black, Asian and 20%
Minority Ethnic (BAME) workers made up 20% of the adult
social care workforce. This was more diverse than the 26%
overall population of England (14% BAME). 65 14%
• The percentage of disabled people varies across the UK.
In 2016, Wales had the highest percentage of disabled 19%
people (26%) followed by the North East and the North Demographics Age and Hearing
West (25%). 66
• Hearing loss increases with age. More
• 360 million people worldwide have a
• The percentage of disabled people living in Scotland than 70% of over 70 year olds and 40%
disabling hearing loss, and 32 million of
was 22% and in Northern Ireland was 21%. 67 of over 50 year olds have some form
these are children. 74
of hearing loss. 82
• London had the lowest percentage of disabled people
(14%). This is equivalent to 1.2 million people.68 The percentage of • In 2015, 11 million people were living
with hearing loss. This is equivalent to
• This was closely followed by the South East (19%), Yorkshire
disabled people 1 in 6 of the UK population. 75
and Humber (20%) and the East of England (20%). 69 varies across the UK:
70%
• It has been estimated that by 2035
• For men and women living in England and Wales, there • Wales (26%) 15.6 million people will be living with
is a general pattern of increasing rates of disability with hearing loss. This is equivalent to of over 70 year olds
increasing socio-economic disadvantage. 70 • North East and 1 in 5 of the UK population. 76 have some form of
• The Local Authorities with the highest proportions of
the North West (25%) • Over 6 million people (1 in 10) are
hearing loss.
disabled people or who have a limiting long-term • Scotland (22%) living with tinnitus. 77
condition are East Lindsey (26%), Blackpool (25.6%), and
Tendring (25.5%). The lowest levels are in Wandsworth
• Northern Ireland (21%) • 17% of 40 to 69 year olds and 25 to • There are 50,000 children with hearing
30% of adults over 70 are affected loss in the UK. Around half are born
(11.2%), Richmond upon Thames (11.5%), and the City • Yorkshire and by tinnitus. 78 with hearing loss while the other half
of London (11.5%). 71
Humber (20%) lose their hearing during childhood. 83
• Research has shown that tinnitus can
• Disabled adults living in the North and the South West
• East of England (20%) lead to depression, anxiety, stress and • There are approximately 390,000
report the highest number of life areas (for example,
sleep problems. 79 deafblind people in the UK. This figure
education or leisure) in which participation is restricted.72 • South East (19%) is set to increase to over 600,000 by
• An estimated 900,000 people in the UK
• Disabled adults living in the West Midlands and South • London (14%). 2035. 84
have severe or profound hearing loss. 80
East report the lowest number of life areas (for example,
• Action on Hearing Loss reports that
education or leisure) in which participation is restricted. 73 • 24,000 people across the UK use British
it takes an average of 10 years for
Sign Language as their main form of
people to address their hearing loss. 85
language. 81
14 01480 357 200 policy@papworthtrust.org.uk www.papworthtrust.org.uk 1509 250
Every day in the UK, 250
people start to lose their
sight
Sight Loss
• In the UK, more than two million people • This figure is even worse for people who
are living with sight loss, which is severe are completely blind. Only around 1 in
enough to have a significant impact 10 people with poor functional vision is
on their daily lives such as not being in paid employment. 92
able to drive. 86
• The disability employment gap for
• Every day in the UK, 250 people start to registered blind and partially sighted
lose their sight. 87 people is around double that for
other disabled people and this gap
• 1 in 5 people will live with sight loss at
is widening. 93
some point in their lives. 88
• Research suggests that the number of
Living with Sight Loss
people living with sight loss will increase
to more than 2.7 million in 2030 and • Only 17% of people experiencing sight
four million in 2050, driven by an loss are offered emotional support in
increase in the UK’s older population. 89 relation to their deteriorating vision. 94
• An estimated 100,000 adults with • Feelings of wellbeing were lower
learning disabilities are blind or partially among blind and partially sighted
sighted. 90 people when compared to the rest
of the population. 95
Employment and Sight Loss
• There has been a significant decrease
in the proportion of registered blind
and partially sighted people of working
age in any form of employment over
the last decade from 1 in 3 in 2005 to
around 1 in 4 in 2015. 91
16 01480 357 200 policy@papworthtrust.org.uk www.papworthtrust.org.uk 1710
Children and Mental Health
• 1 in 10 children can experience mental health problems
in any one year. 104
• 50% of mental health problems are established by age
50%
14 and 75% by age 24. 105
• The Mental Health Foundation reports that around 70%
of children who experience mental health have not had
Mental Health
appropriate intervention at a sufficiently early age. 106 of mental health
problems are
Health Services established by
age 14 and 75%
• People with poor mental health also experience an
increased risk of other health problems. For example, by age 24.
depression has been linked to a 67% increased risk of
2
• In the UK, nearly two-thirds of people (65%) say that
heart disease. 107
they have experienced a mental health problem. 96
• The UK invests £115 million a year on mental health
• This rises to 7 in every 10 for women, young adults
research. This means it receives 5.5% of the UK’s health
aged 18-34 and people living alone. 97
research spend. 108
• Women are more likely than men to report having
being diagnosed with a mental health problem (33% million • A report by the Care Quality Commission found that an
average of 1 in 4 full-time GP patients require treatment
300,000
compared to 19%). 98
for a mental health condition. 109
• People over the age of 55 experience better mental
• The effect of poor mental health on physical illnesses
health than average and are more likely to take people with long-term
costs the NHS around £8 billion a year. 110
positive steps to deal with everyday life. 99 By 2030, there is mental health
• The King’s Fund reports the close link between physical expected to be Employment problems lose their
health problems and an increased risk of poor mental two million more job each year.
• There are 1.5 million individuals in the UK with a
health. 30% of people with long-term physical health adults with mental diagnosed long-term mental health condition in work. 111
conditions also have a mental health condition. 100
health problems • The great majority (85%) of people out of work have
• By 2030, there are expected to be two million more than in 2013. experienced a mental health problem compared to two
adults with mental health problems than in 2013. 101 thirds of people in work and just over half of people who
• Poor mental health is costing the economy between have retired. 112
£74-99bn a year and costing the Government • 300,000 people with long-term mental health problems
between £24-27bn. 102 lose their job each year. 113
• Up to 1.5 million people in the UK care for someone • 15% of those in work in England have symptoms of a
with mental ill health. 103 mental health condition. 114
• Those with a long-term mental health condition lose
their jobs every year at around double the rate of those
without a mental health condition and at a much higher
rate than those with a physical health condition. 115
• Poor mental health is costing employers between
£33-42bn a year. 116
18 01480 357 200 policy@papworthtrust.org.uk www.papworthtrust.org.uk 1911
• Disabled children are more likely than non-disabled
children to live in a single-parent family (32% compared
with 22%). They are also more likely to have increased risk
of parental separation during the first two years of their
life. 124
Children and Poverty
Children
• Disability Rights UK has estimated that 40% of disabled
children are living in poverty. 125
• Families with disabled children can face additional
barriers to avoiding poverty. For example, parents can
be less able to work and find it more difficult to access
childcare. 126
7%
• 7% of children in the UK are disabled and 10% of
• In 2012, the Children’s Society reported that 4 in every
children in the UK live in a family with at least one
10 disabled children live in poverty. 127
disabled child. 117
x2
• 36% of disabled children report having a learning • According to a Contact a Family survey in 2012, 1 in 6
impairment and 42% report a social/behavioural
of children in the families (17%) with disabled children go without food,
impairment. 118 UK are disabled 1 in 5 (21%) go without heating, 1 in 4 (26%) go without
specialist equipment or adaptations, and 86% go
and
without leisure activities. 128
Families and Support
• Low-income families with disabled children can often
• It costs three times more to raise a disabled child as find it harder to access family support as well as help
Disabled young
it does to raise a non-disabled child. 119 such as respite care and suitable childcare. 129 people aged
16-18 were at
10%
• 99.1% of disabled children live at home and are
supported by their families. 120 Later Life least twice as
• 84% of mothers of disabled children do not work, • Disabled young people aged 16-18 were at least
likely as their
compared with 39% of mothers of non-disabled
of children in the twice as likely as their non-disabled peers to not be in non-disabled
children. Only 3% of mothers of disabled children
UK live in a family education, employment or training. 130 peers to not be
work full-time. 121
with at least one • Disabled children growing up in poverty generally in education,
• Research by Contact a Family shows that 65% of
disabled child. achieve employment, economic independence, employment or
families caring for disabled children reported feeling
isolated either frequently or all of the time. 56% felt
personal autonomy and independent housing to a training.
lesser degree and later than non-disabled adults. 131
that the cause of their isolation was due to a lack of
support from statutory services, such as social care • The transition from children’s services to adult services
and education services. 122 is often very challenging for young people with a
learning disability and their families: it combines a
• Disabled children are three to four times more likely change of services and professionals at the very
to be abused and/or neglected than non-disabled time when they are also negotiating wider changes
children. 123 to their life, for example in their educational
circumstances. 132
20 01480 357 200 policy@papworthtrust.org.uk www.papworthtrust.org.uk 2112
• 34% of children on the autism spectrum say that the
worst thing about being at school is being picked on. 139
• 4 out of 5 children with Special Educational Needs (SEN)
have a moderate learning difficulty and 1 in 20 have
profound multiple learning difficulties. 140
• Children from poorer backgrounds are more likely to
have a learning disability. 141
Learning Disabilities Autism
• More than 1 in 100 people are on the autistic spectrum
in the UK, the equivalent of 700,000 people in the UK. 142
18
• Without understanding, autistic people and families are
• Currently, around 1.5 million people in the UK have a at greater risk of being isolated and developing mental
years
learning disability meaning that they face difficulty health problems. 143
with:
6.6%
• Understanding new and complex information Employment and Education
• Learning new skills Females with learning • In 2010/11, only 6.6% of adults with learning disabilities were
disabilities have reported to be in some form of paid employment. 144
• Coping independently. 133
around an 18-year
• People with a learning disability who have a job are likely In 2010/11, only 6.6%
shorter life expectancy
to work fewer hours than the general population. 145 of adults with learning
• There are an estimated 930,000 adults with a learning than the general
population. disabilities were reported
disability in England, 129,000 of whom receive Local • Research has identified that the main barriers that
to be in some form of
Authority social care support. 134 prevent adults with learning difficulties from finding a
paid employment.
14
job, keeping a job and progressing in that job are:
• In 2017, there were 23,186 adults known to Local
years
Authorities across Scotland and just under a third • Negative attitudes or low expectations
(31.4%) live with a family carer. 135
• Skills and qualification gaps for people with a learning
• Central and Local Government spend £8 billion a year disability
between them on supporting adults aged 18–64 who
• A lack of flexible employment support programmes
have a learning disability. 136 Males with learning
and appropriate job opportunities
disabilities have around
• Females with learning disabilities have around an
a 14-year shorter life • Unfair treatment in the workplace such as bullying
18-year shorter life expectancy than the general expectancy than the and discrimination
population, and males have around a 14-year shorter general population.
life expectancy than the general population. 137 • Issues around access to the working environment
(including transport and physical access). 146
• The majority of people with learning difficulties who
Children
are in employment, work part-time. 147
• There are approximately 193,707 children of school
age in the UK who have a learning disability. 138
22 01480 357 200 policy@papworthtrust.org.uk www.papworthtrust.org.uk 232.5 13
Health and Care
• People with learning disabilities are 2.5 times more
times
likely to have health problems than any other people. 148
• Between 25-40% of people with learning disabilities
also experience mental health problems. 149
• People with a learning disability are 10 times more
Carers
likely to have a serious sight problem, and this will People with
be much higher for people with severe or profound
learning disabilities. 150
learning disabilities
are 2.5 times more
• There are approximately 2,500 people with a learning
disability who are in mental health hospitals as they
likely to have health
are considered a danger to themselves or to others. 151 problems than any
other people. • There are around 7 million carers in the UK, this is
• Research by NHS Digital recorded that obesity is
equivalent to 1 in 10 people and this number is rising. 154
twice as common in people aged 18-35 with learning
disabilities. 152 • By 2037, it is predicted that that the number of carers
will have increased to 9 million. 155
• Being underweight is twice as common in people
aged over 64 with learning disabilities, compared • There are 4.27 million carers of working age living in the
with people with no learning disabilities. 153 UK; 57% are women and 43% are men. 156
• The number of full-time employees who are sole carers
for another adult is 628,000. 157
• The number of households where all adults were
in full-time employment and at least one member
7million
provides adult care is 466,000. 158
• In the UK, 3 in 5 people will be carers at some point in
their lives. 159
• Over 1.3 million people each provide over 50 hours of
There are around
care per week. 160
7 million carers in
• The employment rate for carers is at 67%. This includes the UK.
72% of men and 62% of women. Over half of those
who are not working say that they want to do so. 161
Public Attitudes to Carers
• Only 10% of the public feel that unpaid carers are
sufficiently valued by society. 162
• 83% of people who have had a caring role in the past
say they are not sufficiently not valued by society. 163
24 01480 357 200 policy@papworthtrust.org.uk www.papworthtrust.org.uk 25• Research by Carers Week found that the public The Impact of being a Carer
underestimate how likely they are to take on the role of
a carer. Only 26% of people with no experience of caring • As a result of the stress and physical demands of caring,
think that it is likely for them to take on the role of a carer. 625,000 carers suffer from mental and physical health
This includes 24% of men and 32% of women. 164 conditions. 174
• 20% of workers with no experience of caring said that • Over 3 million people juggle care with work. However the
they would turn to their employer for support with a significant demands of caring mean that 1 in 5 carers are
caring role. 165 forced to give up work altogether. 175
• 28% of full-time students said that they would turn to their • Being a carer comes with significant financial pressure.
In a survey by the Carers Trust:
university for support with a caring role with flexible study In the UK,
3 in 5
hours or extended deadlines. 166
• 53% of carers have borrowed money as a result
of a caring role
Young Adult Carers • 60% of carers have used their savings to cover
• Young adult carers between the ages of 16-18 are twice the cost of caring
people will be
as likely to not be in education, employment or training.167
carers at some • 23% of carers have re-mortgaged their homes
• 56% of young carers in university admit to struggling with or downsized to a smaller property
point in their lives.
their studies because of their caring role and appear to
• 35% of carers have missed out on state benefits
be four times more likely to have dropped out of their
as they did not realise they are eligible to claim. 176
college or university course than other students. 168
• 45% of young adult carers reported they have mental
health problems. 169
Older Carers
• 1 in 5 people aged 50-64 are carers in the UK. 170
• 65% of older carers (aged 60–94) have long-term health
problems or a disability themselves. 171
• 69% of older carers say that being a carer has an
adverse effect on their mental health. 172
• One third of older carers say they have cancelled
treatment or an operation for themselves because of
their caring responsibilities. 173
26 01480 357 200 policy@papworthtrust.org.uk www.papworthtrust.org.uk 2714 funding
The Problems with Social Care
• The Care Quality Commission (CQC) report that the
current problems around the state of adult social care
are:
gap
• an ageing population with increased needs
of
• difficulties recruiting and retaining staff to care
£2.1
Social Care
for people
•
•
rising costs of adult social care
funding to meet increasing needs and a reliance
billion
on those who pay for their own care. 184 By 2019/20
An Ageing Population
1.2
• Currently, 1.2 million older people do not receive the
• By the time people reach their late 80s, over 1 in 3 people
care they need. This has increased by 17.9% since last
have difficulty undertaking five or more activities of daily
year and is a 48% increase since 2010. 177
living unaided (like eating, bathing and dressing). 185
million
• Nearly 1 in 8 older people now live with some level of
• The number of people aged 85 and over in England is set
unmet need with vital everyday tasks. 178
to more than double over the next two decades.186
• The Kings Fund has estimated that together the health
and social care workforce employ 1 in 10 of the UK
older people do
not receive the Funding Social Care
population. 179 The social care
care they need. • Despite a rapidly increasing demand because of the funding gap – i.e. the
• Disabled people between the ages of 18-65 represent ageing population, there has been a £160 million cut in
one third of social care users. 180 total public spending on older people’s social care in the
gap between costs
• A report by Scope into the experiences of working- last five years. 187 and revenue – is
aged disabled people found that more people were projected to reach
• Carers are currently providing care worth £132 billion, the
receiving the “basics of care” and fewer people were equivalent to the UK’s total healthcare annual spend, £2.1bn by 2019/20.
receiving support to meet their “wider needs and and over two million people have already given up work
aspirations”, such as employment, education and to care. 188
training. 181
• Constraints on funding have led to Councils providing
• Potential changes to immigration policy resulting from care and support to fewer people and concentrating
the vote to leave the European Union could have it on those with the highest needs. 189
serious consequences for the social care workforce. 182
• Age UK estimates that an additional £4.8 billion a year
• Around 6% of England’s growing social care workforce is needed to ensure that every older person with unmet
are non-British European Economic Area nationals. needs has access to social care, rising to £5.57 billion in
This is equivalent to 84,000 people. 183 2020/21. 190
• 1 in 10 older people face future lifetime costs of over
£100,000 for their social care needs. 191
• The social care funding gap – i.e. the gap between costs
and revenue – is projected to reach £2.1bn by 2019/20. 192
28 01480 357 200 policy@papworthtrust.org.uk www.papworthtrust.org.uk 29Papworth Trust
Policy priority
Around Equivalent to
6%
of England’s growing
84,000
people
social care workforce
are non-British European
Economic Area nationals.
1.2
one
third
x2
million The number of people
aged 85 and over in
older people do not Disabled people between England is set to more
receive the care they the ages of 18-65 represent than double over the
need. one third of social care users. next two decades.
Nearly 1 in 8 older people
now live with some level Carers are currently
of unmet need with vital providing care worth
everyday tasks.
£132 the equivalent to the
billion UK’s total health care
annual spend.
30 01480 357 200 policy@papworthtrust.org.uk www.papworthtrust.org.uk 3115
• 9 in 10 disabled people who are not in work are
economically inactive and are not actively looking
for work. 203
• By the age of 26, disabled people are four times more
likely to be out of work or not in education, compared
to non-disabled people. 204 Economically
• Fewer than 50% of working-age disabled people are in inactive: The
Employment
work, compared to 75% of non-disabled people. 205 economically
• The employment rate for disabled men is 50% and for inactive are
disabled women the rate is 48.6%. 206 defined as
• Between April and June 2017, there were around two people who
million disabled women in work and 1.5 million disabled are not in
x2
• Between April and June 2017, there were 3.5 million
men. 207 employment or
disabled people of working age in employment, an • A report by Scope found that only 49% of disabled unemployed.
employment rate of 49.2%. 193 employees are aware of their employment rights. 208
• The employment rate for non-disabled people was • New research by Opinium found the following results:
80.6%. 194 • Disabled people need to apply for 60% more jobs
• The employment rate for disabled people was 1.3% than non-disabled jobseekers before they are
successful in finding work
higher in April-June 2017 than in the same period in Disabled people are
2016. 195
twice as likely to be • More than 51% of job applications from disabled
people result in an interview, compared with 69%
• Between April and June 2017, the number of disabled unemployed than
people in employment rose by 104,000. 196 of non-disabled applications. 209
non-disabled people.
• Despite this progress, disabled people still have much
lower employment rates than non-disabled people. 197
• Disabled people have an unemployment rate of 9%
compared to 3.8% for those without. 198
• Only 1 in 4 registered blind or partially sighted people
of working age is in employment. 199
• Only 16% of autistic adults in the UK are in full-time paid
employment, and only 32% are in some kind of paid
work. 200
• Between April and June 2017, 3.8 million disabled
people of working age were economically inactive.
The economic inactivity rate for disabled people was
45.9%. The economic inactivity rate for non-disabled
people was 16.2%. 201
• Disabled people are twice as likely to be unemployed
than non-disabled people. 202
32 01480 357 200 policy@papworthtrust.org.uk www.papworthtrust.org.uk 33The Employment Gap Attitudes
• The disability employment gap can be defined as the • 1 in 5 employers say they would be less likely to employ a
difference in the employment rate of disabled people disabled person. 220
and non-disabled people. 210
• Research by the Centre for Social Justice found that
• Between April and July 2017, the disability employment
The disability perceived barriers for employers to employing disabled
gap stood at 31.3%. 211 employment people were:
• Between April to June 2013 and April to June 2017, the
gap can be • The ability to do their jobs (34%)
defined as the
1 in 5
number of disabled people in employment increased • The cost of making reasonable adjustments (31%)
by around 596,000, an increase of 21%. 212 difference in the • The inconvenience of making reasonable adjustments
employment (19%). 221
Health rate of disabled • A recent report by Scope found that 48% of disabled
employers say
people and people have worried about sharing information about
• Almost 12 million working age people in the UK have a
their impairment or condition with their employer. 222 they would be less
long-term health condition. And of these seven million non-disabled
likely to employ a
are disabled. 213 people. • They also found that some disabled people who had
positive experiences said this helped them get the disabled person.
• Early intervention is key to prevent people from falling
support they needed. 223
out of work and return-to-work programmes are more
likely to succeed when implemented early. Currently, • A survey by the Centre for Social Justice found only
around 300,000 people a year are falling out of work 25% of employers knew what the ‘Access to Work’
due to health conditions. 214 programme was and understood the help that they
could get from this service. 224
• Just under 1 in 7 people (14.7%) experience mental Between April
health problems in the workplace, with women in and July 2017, the • Only 45% of employers understand clearly what it means
full-time employment twice more likely to have a to make reasonable adjustments for disabled people
disability employment
48%
mental health problem than men (19.8% vs 10.9%). 215 under the Equality Act 2010. 225
gap stood at
• Over half of disabled people who are out of work • Recent findings show that more than a third (37%) of
31.3%
experience mental health and/or musculoskeletal disabled people who don’t feel confident about getting
conditions (54%). 216 a job believe employers won’t hire them because of their
impairment or condition. 226 of disabled people
• Mental health is one of the biggest causes of sickness
absence in the UK. 217
have worried
The Economy about sharing
• Employees with mental health conditions are less likely
to discuss their health with employers than those with
• A report by Scope found that a 10% rise in the disability information about
physical conditions. 218
employment rate, the equivalent of supporting one their impairment or
million disabled people into work, would increase Gross condition with their
• In the most recent Office of National Statistics Survey Domestic Product (GDP) by £45 billion by 2030. 227
employer.
on Life Opportunities, adults aged between 16 and
• The cost of poor mental health to the economy as
64 with impairments who were economically inactive
a whole is £74-£99 billion a year. This includes costs in
reported the following reasons for their inactivity:
providing benefits, falls in tax revenue, costs to the
• A health condition, illness or impairment (63%) NHS and lost output. 228
• A disability (32%) • Ill-health amongst working age people costs the
• Family responsibilities (12%) economy £100 billion and sickness absence and is
estimated to cost employers £9 billion per year. 229
• Anxiety/lack of confidence (8%) 219
34 01480 357 200 policy@papworthtrust.org.uk www.papworthtrust.org.uk 35Papworth Trust
Policy priority By the age of 26, disabled
people are four times more
likely to be out of work or
not in education, compared
Disabled people need to More than 51% of job to non-disabled people.
apply for 60% more jobs applications from disabled
than non-disabled job people result in an interview,
seekers before they are compared with 69% of
successful in finding work non-disabled applicants.
100
48%
A recent report by Scope
60%
found that 48% of disabled
people have worried about
sharing information about their
impairment or condition with
their employer.
0
Disabled Non-disabled
applicants applicants
Disabled people are
twice as likely to be
unemployed than
non-disabled people.
x2 1 in 5
employers say they would
be less likely to employ a
disabled person.
36 01480 357 200 policy@papworthtrust.org.uk www.papworthtrust.org.uk 3716
Education
Early Education Skills and Qualifications
• The number of students with special • The proportion of disabled people
educational needs (SEN) in England with no qualifications was nearly
remains at 14.4%. This is an increase three times that of non-disabled
from 1,228,785 in January 2016 to people in 2015/16, and the proportion
1,244,255 in January 2017. 230 of disabled people with a degree
remained lower than non-disabled
• Based on their primary need, all groups
people. 234
of children with SEN have significantly
lower proportions achieving at least • Of the 899,400 apprenticeships
five A*-C GCSE’s, including English participating in 2015/16, 9.3% declared
and mathematics, than having a learning difficulty and/or
non-disabled children in both 2009/10 disability. 235
and 2014/15.231
Higher Education
x2
• Across Britain in 2015/16, disabled
young people aged 16-18 were
at least twice as likely as their non-
disabled peers to not be in education,
employment or training. 232 Disabled young people
• Disabled students are more likely to aged 16-18 were at least
study creative arts and design courses twice as likely as their
than their non-disabled peers, 14.7%
compared with just 6.5%. Disabled
non-disabled peers to
students are most under-represented not be in education,
in business and administrative courses, employment or training.
8.2% compared to 14.9% of non-
disabled students. 233
38 01480 357 200 policy@papworthtrust.org.uk www.papworthtrust.org.uk 3917
• In 2014/15, 70 million journeys were made by disabled
passengers but less than 1% of these involved the pre-
booked assistance service. 242 Disabled
• 1.2 million rail passenger assists were made in 2016/17. 243
badge
holders
• Only 10% of disabled people had seen, heard or
read information from train operators about disabled
only
passengers’ rights to assistance. 244
Transport Cars and Taxis
• As of March 2017, 58% of taxis in England were 2.38
accessible. 245
million
• The main modes of transport for people with a mobility
difficulty are:
94% • This included all 22,500 London taxis, which are
wheelchair accessible under Transport for London’s
‘Conditions for Fitness’ licensing policy. 246
blue badges were
held in England.
• Driving (38%) • In 2016, 2.38 million blue badges were held in England,
• Being a passenger in a car (30%) equivalent to 4.3% of the population. This is a 0.7%
decrease since 2015. 247
• Walking (16%)
• Bus (9%) • The number of blue badges held has declined every
year since reforms of the Blue Badge application process
• Other (8%). 236 In March 2016, 94% in 2011/12. 248
of buses in England
• 2 in 3 wheelchair users say they have been overcharged
• One of the key barriers to accessibility identified by had been issued for a taxi or private hire vehicle because of their
many disabled people is a lack of consistency in the with an accessibility wheelchair. 249
way that services and facilities are delivered. 237
certificate
Buses London
• In March 2016, 94% of buses in England had been • Over a quarter of Tube stations (71) and half of London
issued with an accessibility certificate. 238 Overground (57) stations have step-free access. 250
• In 2015/16, there were 912,000 concessionary
disabled bus passes in England. 239 75% • According to Transport for London, all 9,000 London Buses
are low-floor level wheelchair accessible and fitted with
ramps. 251
Train Travel • According to Transport for London, all of London’s taxis
• In July 2017, 75% of trains were accessible to disabled are fitted with wheelchair ramps. 252
people. This is an increase of 5% since July 2016. 240
• At the end of 2016, 207,311 disabled person’s railcards In July 2017,
were in circulation. This is a 7.7% increase compared to 75% of trains were
the previous year. 241 accessible to
disabled people
40 01480 357 200 policy@papworthtrust.org.uk www.papworthtrust.org.uk 4118
• Two thirds of single disabled people living alone are in
poverty. 260
• In Scotland the number of wheelchair-adapted local
authority housing for physically disabled people has
decreased. 261
• 47% of the British public say they would be more likely
to consider moving to a property if it had a downstairs
2/3
bathroom. 262
Housing • 59% of disabled people who are 65 and over say they will
need accessible housing features in the next five years. 263
Tenure Types Two thirds of single
disabled people
1.8
• Disabled people are twice as likely as non-disabled
• Disabled people face problems in finding adequate people to be social housing tenants. 264 living alone are
housing and this is a major barrier to independent in poverty.
living. 253 • In 2015-16, 23% of households in the private rented sector
million
included at least one member who had a long-term
• There are 1.8 million disabled people with unmet illness or disability. 265
housing needs, 580,000 of whom are of working age. 254
• In 2015-16, 49% of households in the social rented sector
• Of all owner occupied households, 1 in 4 (480,000) disabled people included someone with a long-term illness or disability. 266
needing accessible housing have incomes above the with unmet housing
• Among homeowners, 29% of households had at least
median income after housing costs (£448 per week). 255 needs one member with a disability or long-term illness. 267
• Of the 1.8 million disabled people needing accessible
homes, 55% are homeowners. 256 • Private renters under the age of 55 who have a long-term
condition are more likely (32%) to feel that their home is
• As a result of unmet housing needs for accessible unsuitable for their needs. Those people over the age of WC
housing, disabled people are four times more likely to 75 were least likely to feel their home was unsuitable. 268
be unemployed or not seeking work. 257
• There is a shortage of accessible housing across Britain. Adaptations
Of the councils in England with a housing plan, fewer
than 17% of councils have set out strategies to build • 1.9 million households in England (9%) had one or more
47%
disabled-friendly homes. 258 people with a long-term limiting illness or disability that
580,000
required adaptations to their home. 269
• According to an Ipsos MORI poll, 50% of people
said they would most favour staying in their current • 81% of households, that required adaptations due to their
long-term limiting disability, felt their home was suitable
home with some adaptions to allow them to live
of whom are of for their needs. 19% (around 365,000 households) who
of the British public
independently, and 19% of (which equates to 9.8
million) people would favour moving to a different working age. considered their household unsuitable for their needs say they would
property specifically designed or adapted to enable accounted for 2% of all households in England. 270 be more likely to
them to live independently. 259 consider moving
to a property if it
had a downstairs
bathroom.
42 01480 357 200 policy@papworthtrust.org.uk www.papworthtrust.org.uk 43• The four most common home adaptations needed The four most
inside the home are:
common home
• Grab rail inside the home (40%) adaptations needed
• A bath/shower seat or other aids (30%) inside the home are:
• A specialist toilet seat (25%)
• A shower to replace the bath (19%). 271
Grab rail inside
40% the home
• The most common reasons why homes did not have
the required adaptations in 2014/15 were:
A bath/shower
• Not enough time to carry them out (24%) 30% seat or other aids
• Could not afford to pay for them (21%)
• Modifications were not worth doing (13%). 272
A specialist
25% toilet seat
Adaptions for Later Life
• There is strong evidence that minor home adaptions
A shower to
are an effective and cost-effective intervention for 19% replace the bath
preventing falls and injuries, improving performance
and everyday activities and improving mental health. 273
• Preventive work to manage worse-than-average
hazards associated with falls on stairs, with an adult
aged 65 and over, is estimated to cost in the region
of £290 million and deliver a benefit of £470 million to
society. 274
• There is good evidence that people can be put
off installing adaptations until they reach a point of
crisis, in part because they do not wish to change or
‘medicalise’ their home. 275
Visitability
• The four features considered to be the most important
for a home to be ‘visitable’ by people with mobility
impairments are:
• Level access
• Flush threshold
• Sufficiently wide door and circulation space
to move around
• Use of a toilet on the ground or at entrance level. 276
• In 2014/15, 1.7 million (7%) households had all four
visitability features. 277
44 01480 357 200 policy@papworthtrust.org.uk www.papworthtrust.org.uk 45Papworth Trust The four most common home adaptations
Policy priority
needed inside the home are:
Grab rail inside A bath/shower A specialist A shower to replace
the home seat or other aids toilet seat the bath
There are
1.8 The most common reasons why homes did not
have the required adaptations in 2014/15:
million 580,000
disabled people with of whom are of
unmet housing needs working age.
Not enough time Could not afford to Modifications were
to carry them out pay for them not worth doing
The 4 features considered to be the most
2/3
important for a home to be ‘visitable’ by
people with mobility impairments are:
1 2 3 4
Two thirds of single disabled
people living alone are
in poverty.
Level Sufficiently wide Flush Use of a toilet
access door and circulation threshold on the ground or
space to move around at entrance level.
46 01480 357 200 policy@papworthtrust.org.uk www.papworthtrust.org.uk 4719 93%
Accessing Social, Health and Leisure
Services
• Poor access to leisure can affect the community and
social life of disabled people, creating a barrier to
independence and their enjoyment of leisure activities. 280
of GPs would
recommend
• The most commonly reported difficulties for disabled
people in accessing goods and public services are:
specific training on
how to care better
Accessibility 20% Shopping
15% Cinema/theatre/concerts
for people with a
learning disability
to all health
14% Pubs and restaurants. 281 professionals.
Outside the Home • Research from the 2011 Life Opportunities survey found
that:
• Around a third of disabled people experience
difficulties related to their impairment in accessing • 72% of disabled adults had at least one barrier to
public, commercial and leisure goods services. 278 playing sport compared with 54% of non-disabled
adults. 282
Barriers • 68% of disabled adults had at least one barrier to
going to museums or historical places of interest
• The most common barriers to accessing buildings for
compared with 58% of non-disabled adults. 283
adults with impairments are:
• A higher proportion of disabled adults reported having
44% Moving around the building (stairs, doors or narrow little choice over their free time compared with non-
corridors) disabled adults (22% and 13% respectively). 284
39% A health condition, illness or impairment • 54% of disabled adults had six or more close contacts
compared with 65% of non-disabled adults. 285
23% Inadequate lifts or escalators • 93% of GPs would recommend specific training on
how to care better for people with a learning disability
22% Difficulty with approach areas due to lack of ramps/ to all health professionals. 286
handrails
21% Parking problems
17% Bathroom facilities (location, layout, size)
54% of disabled adults had
15% Footpath design and surfaces
six or more close contacts
14% Difficulty with transport getting to the building compared with 65% of
non-disabled adults.
13% Lack of help or assistance. 279 disabled adults non-disabled
adults
48 01480 357 200 policy@papworthtrust.org.uk www.papworthtrust.org.uk 49Businesses
3/4
• Three quarters of disabled people have left a shop
or business because of poor disability awareness or
understanding. 287
20
• Households with a disabled person spend a combined
£212 billion a year on goods and services, labelled the Three quarters of
‘purple pound’, and this is frequently recognised as a disabled people have
failed opportunity for businesses to take advantage of. 288 left a shop or business
• By failing to meet the demands of disabled people, because of poor
businesses could be missing out on a share of £420 million disability awareness
in revenue each week. 289
or understanding.
Reference
• 6 in 10 businesses would find information about the
consumer behaviour and preferences of disabled people
useful in order to help them determine how to meet the
demands of disabled people. 290
pages
£212 billion
Households with a disabled
person spend a combined
£212 billion a year on goods
and services, labelled the
‘purple pound’.
50 01480 357 200 policy@papworthtrust.org.uk www.papworthtrust.org.uk 51References • 22
Equality and Human Rights Commission, April 2017, Being disabled: a journey less equal, (Online),
Available at:
1
• TUC, May 2016, Disability and employment, (Online), Available at:
Available at: case for accessible homes(Online), Available at:
(Online), Available at: case for accessible homes(Online), Available at:
(Online) Available at:
5
• Department for Work and Pensions, March 2017, Family Resources Survey: financial year 2015/16, • 27
Department for Work and Pensions, August 2015, Opinions and lifestyle survey data for the 2014
(Online) Available at: • 28
The Poverty Site, 2014, Key facts, (Online), Available at: • 29
The Trussell Trust, June 2017, Financial Insecurity, food banks and disability, (Online), Available at:
• 8
RNIB, 2017, The state of the nation eye health 2017: A year in review, (Online), Available at: • 30
Scope, 2017, Disability facts and figures, (Online), Available at:
10
• Mental Health Foundation, Mental Health Statistics: Children and young people, (Online), Available • 32
Department for Work and Pensions, March 2017, Households below average income: an analysis
at: of the UK income distribution: 1994/95-2015/16, (Online), Available at:
33
• 12
Contact a family, Research, (Online), Available at: • TUC, May 2016, Disability and employment, (Online), Available at:
13
• Carers Trust, 2017, Key facts about carers and people they care for, (Online), Available at: • TUC, May 2016, Disability and employment, (Online), Available at:
14
• Carers Trust, 2017, Key facts about carers and people they care for, (Online), Available at: • Equality and Human Rights Commission, 2017, The disability pay gap, (Online), Available at: < https://
www.equalityhumanrights.com/sites/default/files/research-report-107-the-disability-pay-gap.pdf>
15
• CSA, 2017, Social workers speak out about the state of care today, (Online), Available at:
37
• 16
The Health Foundation, May 2017, Election Briefing: NHS and social care funding – three unavoidable • Equality and Human Rights Commission, 2017, The disability pay gap, (Online), Available at: • 38
Equality and Human Rights Commission, 2017, The disability pay gap, (Online), Available at: • 39
Equality and Human Rights Commission, 2017, The disability pay gap, (Online), Available at:
disabled person, (Online) Available at: families in 2014/15, (Online), Available at
centreforsocialjustice.org.uk/core/wp-content/uploads/2017/06/CSJJ5158_Disability_report_110517_ • 41
Leonard Cheshire, 2014, Disability facts and figures, (Online), Available at: leonardcheshire.org/about-us/disability-facts-and-figures>
20
• Leonard Cheshire, December 2017, One in five employers say they would be less likely to employ a • 42
Equality and Human Rights Commission, 2017, Being disabled in Britain, (Online), Available at:
21
• Equality and Human Rights Commission, April 2017, Being disabled: a journey less equal, (Online),
Available at:
52 01480 357 200 policy@papworthtrust.org.uk www.papworthtrust.org.uk 53You can also read