Covid-19 Infection in India: A Comparative Analysis of the Second Wave with the First Wave - MDPI
←
→
Page content transcription
If your browser does not render page correctly, please read the page content below
pathogens
Article
Covid-19 Infection in India: A Comparative Analysis of the
Second Wave with the First Wave
Arnab Sarkar, Alok Kumar Chakrabarti * and Shanta Dutta

                                          Division of Virology, ICMR-National Institute of Cholera Enteric Diseases (ICMR-NICED), P-33, C.I.T. Road,
                                          Scheme-XM, Beliaghata, Kolkata 700010, West Bengal, India; arnabsarkar2006@gmail.com (A.S.);
                                          drshantadutta@gmail.com (S.D.)
                                          * Correspondence: aloke8@yahoo.com or chakrabarti.alok@icmr.gov.in

                                          Abstract: Coronavirus disease 2019 (COVID-19) is considered as the most dreaded disease that has
                                          spread all over the world in the recent past. Despite its outbreak in December 2019–January 2020, a
                                          few continents and countries such as India started to experience a significant number of COVID-19-
                                          positive cases from March 2020. GISAID clade variation analysis in the period March 2020–February
                                          2021 (period I) and March 2021–first week of April 2021 (period II) showed a rapid variation of
                                          SARS-CoV-2 in all continents and India over time. Studying the relationship of patient age or gender
                                          with viral clades in these two periods revealed that the population under 10 years of age was the
                                          least affected, whereas the 11–60-year-old population was the most affected, irrespective of patient
                                          gender and ethnicity. In the first wave, India registered quite a low number of COVID-19-positive
                                          cases/million people, but the scenario unexpectedly changed in the second wave, when even over
                                          400,000 confirmed cases/day were reported. Lineage analysis in India showed the emergence of new

                                   SARS-CoV-2 variants, i.e., B.1.617.1 and B.1.617.2, during April–May 2021, which might be one of the
Citation: Sarkar, A.; Chakrabarti,
                                          key reasons for the sudden upsurge of confirmed cases/day. Furthermore, the emergence of the new
A.K.; Dutta, S. Covid-19 Infection in     variants contributed to the shift in infection spread by the G clade of SARS-CoV-2 from 46% in period
India: A Comparative Analysis of the      II to 82.34% by the end of May 2021. Along with the management of the emergence of new variants,
Second Wave with the First Wave.          few factors viz., lockdown and vaccination were also accountable for controlling the upsurge of new
Pathogens 2021, 10, 1222. https://        COVID-19 cases throughout the country. Collectively, a comparative analysis of the scenario of the
doi.org/10.3390/pathogens10091222         first wave with that of the second wave would suggest policymakers the way to prepare for better
                                          management of COVID-19 recurrence or its severity in India and other countries.
Academic Editors: Florian Liegeois,
Mathieu Bourgarel, Hélène de Nys          Keywords: COVID-19; SARS-CoV-2; first wave; second wave; clades
and Laure Guerrini

Received: 16 June 2021
Accepted: 30 August 2021
                                          1. Introduction
Published: 21 September 2021
                                               SARS-CoV-2, a highly contagious coronavirus, expanded from Wuhan, China to all
Publisher’s Note: MDPI stays neutral
                                          over the world within few months and by the end of March 2020, COVID-19 spread was
with regard to jurisdictional claims in
                                          considered as the first wave of infection. Isolation, sequencing and phylogenetic analysis
published maps and institutional affil-   confirmed the severe acute respiratory syndrome-coronavirus-2 (SARS-Cov-2) as a novel
iations.                                  etiological agent which belongs to the same family of SARS-CoV-1 and sequence-wise
                                          close to bat derived Yunnan/RaTG13/2013 coronavirus strain [1]. To date, seven human
                                          coronaviruses have been isolated, of which OC43, NL63, HKU1 and 229E [2] cause self-
                                          limited mild symptoms, while SARS, MERS and SARS-CoV-2 are responsible for severe
Copyright: © 2021 by the authors.
                                          respiratory syndromes [3]. Phylogenetic studies showed that the rodent is the primary host
Licensee MDPI, Basel, Switzerland.
                                          for HCoV-43 and HKU1, while bat is the primary host for the remaining five viruses [4].
This article is an open access article
                                          The primary host is the place where genetic recombination, deletion, insertion, missense
distributed under the terms and           mutations, etc. give rise to different variants which may be capable of infecting other hosts
conditions of the Creative Commons        such as dogs, camels and humans. In this article, we will focus on SARS-CoV-2, more
Attribution (CC BY) license (https://     specifically on the infectivity of SARS-CoV-2 in humans.
creativecommons.org/licenses/by/               Proteomic analysis of the first SARS-CoV-2 isolated in Wuhan revealed the presence
4.0/).                                    of four major viral proteins, i.e., the spike surface glycoprotein (S), the envelope protein

Pathogens 2021, 10, 1222. https://doi.org/10.3390/pathogens10091222                                       https://www.mdpi.com/journal/pathogens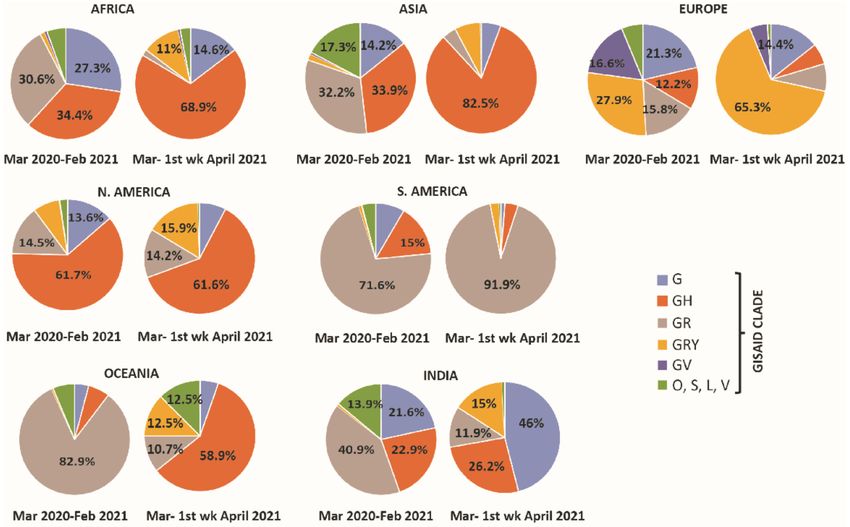
Pathogens 2021, 10, 1222                                                                                            2 of 15

                           (E), the matrix protein (M) and the nucleocapsid protein (N). Moreover, 16 non-structural
                           proteins (NSP1-16) and 8 accessory proteins viz., 3a, 3b, p6, 7a, 7b, 8, 9b, 9c, and 10 were
                           also found in SARS-CoV-2 [5,6]. Structural and biochemical analysis disclosed that the S
                           protein, crucial for virus binding with the host receptor, comprised two subunits- S1 and S2.
                           The S1 subunit (14–684 residues) contains an N-terminal domain and a receptor-binding
                           domain (RBD). The RBD domain of S1 has an affinity for the ACE2 receptor of humans and
                           other species. The junction between S1 and S2 has a polybasic cleavage site (RRAR) and
                           during viral infection, cleavage of this junction is carried out by the host serine proteases
                           TMPRSS2 [7].
                                 The S1/S2 cleavage site is the key region for determining virus infectivity and muta-
                           tions (deletion/missense) in S1/S2 cleavage site generated more transmissible SARS-CoV-2
                           variants [8]. The SARS-CoV-2 strain isolated in Wuhan, China, continually modifies itself
                           by random mutations, developing new variants with higher transmissibility and severity.
                           To track the genetic diversity of SARS-CoV-2, GISAID has introduced a nomenclature of
                           viral clades. Although at the onset of the pandemic, there were three clades—O, S, and
                           L—soon the situation changed with the appearance of six additional clades, namely, G, GR,
                           GH, GRY, GV, and V [9,10]. Clade G was defined as carrying the D614G mutation in the
                           spike protein; the other clades, which emerged in September 2020 and spread globally, were
                           defined as follows: GH (S: D614G, NS3: Q57H), GR (S: D614G, N: G204R), GV (S: D614G,
                           S: A222V) and GRY (S: H69del, S: V70del, S: Y144del, S: N501Y, S: D614G, N: G204R) [9].
                                 Irrespective of the clade, SARS-CoV-2 viral proteins are capable of activating the
                           secretion of pro-inflammatory cytokines including IL-6 and IL-8 [11] at the onset of infection.
                           At the late stage of infection, uncontrolled secretion of pro-inflammatory cytokines results
                           in the generation of cytokine storm and associated multi organ failure [12]. However, the
                           impact of COVID-19 infection is not restricted to the physical health of the patient but
                           is also evident on patient’s mental health. Patients suffering from chronic autoimmune
                           diseases such as Systemic Lupus Erythematosus and Hashimoto’s disease experience
                           pandemic-related anxiety and depression and are at risk of insomnia [13,14]. The continual
                           evolution in the viral genome has made COVID-19 unmanageable over the time because of
                           its more contagious nature, and the virus has developed the ability to evade neutralizing
                           antibodies, which has contributed to the surge of the fatality rate (CFR).
                                 While the first case of COVID-19 in India was registered in January 2020 [15], it
                           took more than a year to complete the first wave of infection. During the prolonged
                           first wave, India registered a low number of daily confirmed cases/million inhabitants in
                           comparison to many other countries; however, the scenario started changing from March
                           2021, with the rapid rise of COVID-19-positive cases throughout the country. A comparison
                           of COVID-19 positive cases/day between India and the rest of the world, as represented
                           in the repository ‘ourworldindata’, showed that the first wave in India started in March
                           2020, achieved a peak in September 2020 with more than 90,000 confirmed cases/day,
                           and gradually decreased in intensity with 10,000 confirmed cases/day in February 2021.
                           Except for few countries including India, most of the other countries/continents witnessed
                           the first wave of COVID-19 before August 2020 while the second wave started appearing
                           in August–September 2020 [16] followed by the third wave in March 2021, which is still
                           ongoing [17].
                                 A comparative analysis of the number of COVID-19-positive patients in India with
                           respect to other continents showed that India was behind or missed one wave that raised
                           from September 2020 to February 2021. In this article, we comprehensively examined the
                           scenario in India and comparatively analyzed the global COVID-19 dataset to describe
                           clade variation, patient age and gender distribution, emergence of new lineages, and the
                           Government’s stringent policies in the first and the second wave of COVID-19.
Pathogens 2021, 10, 1222 3 of 15
2. Results
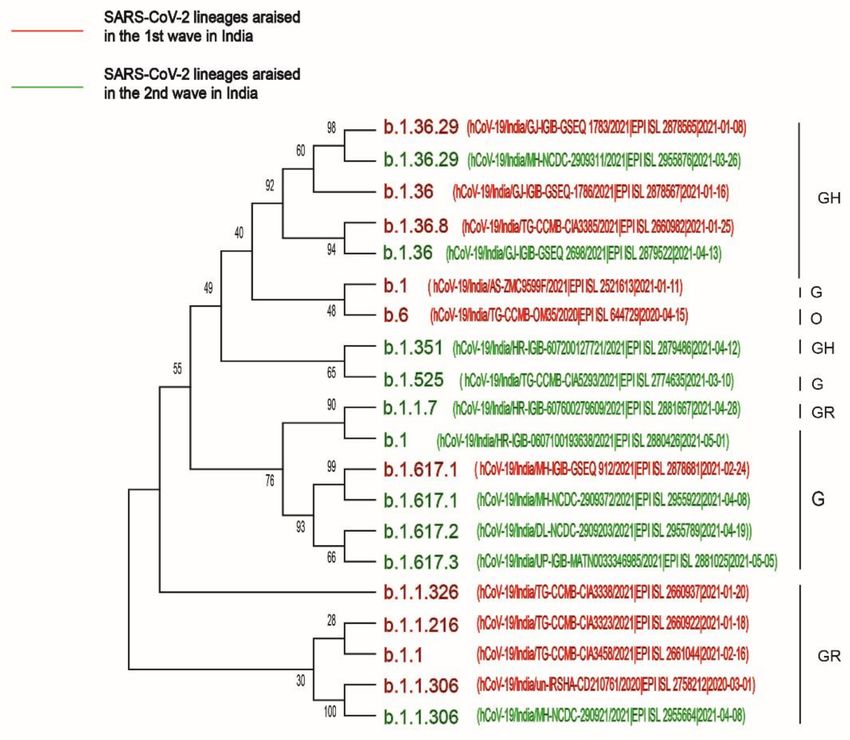
2.1. Global Distribution of Clade Variations in March 2020–February 2021 (Period I) and March
2021–First Week of April 2021 (Period II)
In this study, metadata were downloaded from the GISAID EpiCoV™ Database. We
categorized the globally collected COVID-19 patient data into period I and period II,
during which India faced the first and second waves of COVID-19infection respectively.
Continent-wise analysis in period I (n = 2, 76,049) showed that among all clades, GR was
highly prevalent in Oceania (82.8%) and South America (71.5%) and GH diffused in three
continents, i.e., North America (61.73%), Africa (34.4%) and Asia (33.9%), whereas, GRY
was mostly prevalent in Europe (27.9%). Surprisingly, clade distribution completely trans-
formed over time, as in period II (n = 55,029), the GH clade became the most common clade
in Asia (82.5%), Africa (68.9%), North America (61.65%) and Oceania (58.9%). Although
the high prevalence of the GH clade in Oceania in period II looks surprising, this is not
the case for Asia, North America and Africa, as this clade dominated these continents
earlier in period I. On the other hand, the GRY and GR clades were mostly prevalent in
Europe (65.3%) and South America (91.9%) in both the periods (Figure 1). Lineage analysis
in Oceania revealed the absence of the prevalent D.2 lineage (GR clade) of SARS-CoV-2
in period II, which might be one of the key reasons for the variation in clade distribution.
Clade distribution also varied in India with a shift from the highly prevalent GR clade
(40.09%) in period I to the G clade (46%) in period II. As clade variation corresponded to
the emergence of new variants or the disappearance of prevalent variants, PANGOLIN
lineage analysis in these two periods in India revealed that the outbreak was due to the
emergence of B.1.617 and B.1.618 SARS-CoV-2 variants, which might be responsible for the
variation in clade distribution.
Figure 1. Clade distribution in all continents including India. The clade distribution pattern revealed
that over time, the prevalence of the GH clade was higher in Africa, Asia, North America, and
Oceania in March 2021–first week of April 2021 (period II) as compared to March 2020–February 2021
(period I). Similarly, in the second period, infectivity of the GRY and GR clades were higher in the
European and South American populations respectively. The analysis clearly revealed an increased
percentage of the G clade in the second period of infection as compared to the first period in India.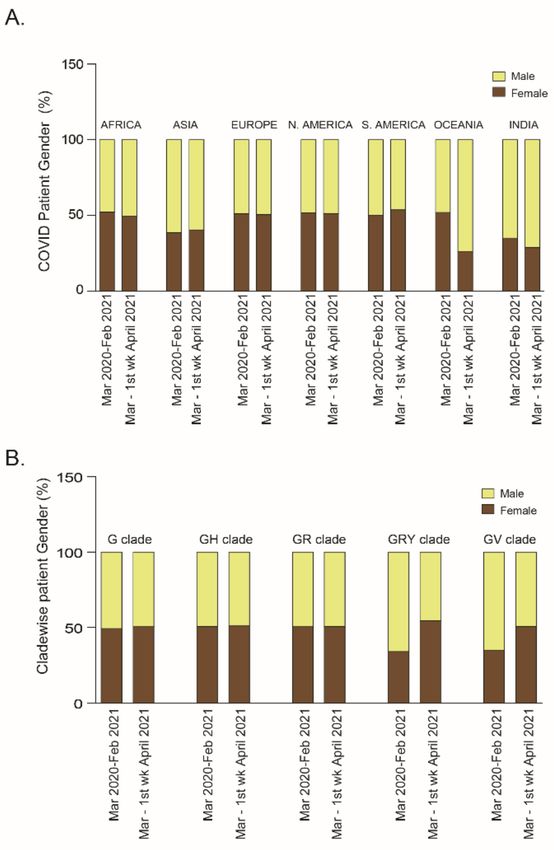
Pathogens 2021, 10, 1222                                                                                                4 of 15

                           2.2. Relationship of Patient Age or Gender with SARS-CoV-2 Clade Variations: A Global Analysis
                           2.2.1. Patient Age
                                Patient age is considered as one of the important factors for hospitalization and
                           mortality [18]. Irrespective of gender and ethnicity, older patients appear to be at higher risk
                           of mortality than younger patients. However, in terms of viral transmission, all age groups
                           were equally susceptible to COVID-19 infection [19]. In a recent report, it was claimed
                           that the population under 35 years of age has a high risk of SARS-CoV-2 infection [20].
                           In the dataset used in the current study, epidemiologically categorized patient data were
                           compared with COVID-19 patient age in periods I and II. The analysis showed that in
                           both periods, three age groups, viz., 11–30 years, 31–45 years and 46–60 years were the
                           most affected followed by the 61–80 years, 81–100 years and 1–10 years age groups. A
                           comparative analysis showed the most affected population was aged 31–45 years in Africa
                           and Asia and 11–30 years in North America and Oceania. However, in Europe, three age
                           groups, i.e., 11–30 years, 31–45 years and 46–60 years appeared to be equally vulnerable
                           in both periods of infection. Surprisingly, in South America, the most affected age group
                           in period I was the 31–45 years (31.23%), though in the following two months it was the
                           11–30 years (29.73%) (Figure 2A). Similarly, in India the most highly infected patient age
                           groups were the 11–30 years (30.01%) and the 31–45 years (30.48%) in period I, which
                           changed to the 31–45 years (32.03%) and the 46–60 years (30.47%) groups (Figure 2A) in
                           period II of COVID-19.

                           Figure 2. (A) Stacked diagram of patient populations with different ages, arranged continent-wise
                           for both period-I (March 2020–February 2021) and period-II (March 2021–first week of April 2021).
                           (B) For both periods, the percentage of COVID-19 patients grouped according to their age was plotted
                           in relation to infection with each specific clade (G, GH, GR, GRY and GV).

                               To test whether the viral clade has any impact on the age group, clade-wise analysis
                           was performed and it was found that the GH clade (currently the most prevalent SARS-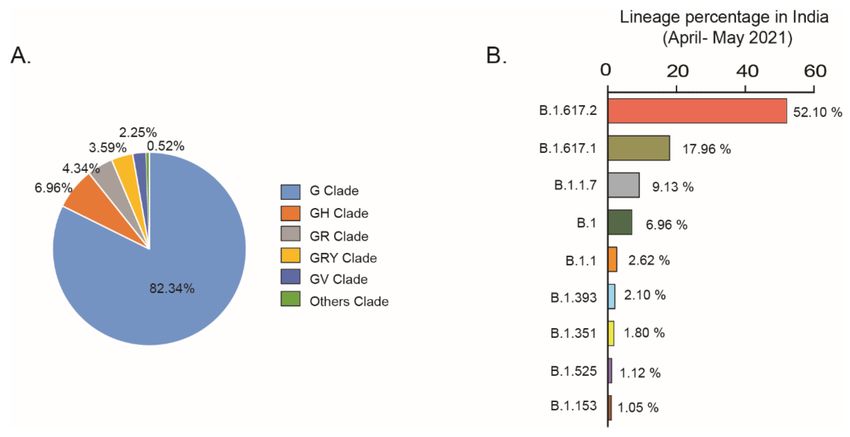
Pathogens 2021, 10, 1222                                                                                            5 of 15

                           CoV-2 clade) infected a higher percentage of the people of the 11–30 years group, from 8%
                           in period I (odds ratio 0.3, CI 95% 0.29–0.31) to 34.3% in period II (odds ratio 1.41, CI 95%
                           1.38–1.49) (Figure 2B). In contrast, the percentage of GRY clade-infected patients in the
                           31–45 years group was reduced from 37.52% in period I (odds ratio 1.25 CI 95% 1.21–1.28)
                           to 22.85% in period II (odds ratio 0.93 CI 95% 0.89–0.97) (Figure 2B). Notably, children
                           under 10 years of age were affected less compared to adults [21] irrespective of ethnicity
                           and clade. In this study, clade-wise and continent-wise analysis also showed that children
                           under 10 years were at low risk of infection in both the periods of COVID-19 spread.

                           2.2.2. Patient Gender
                                A literature survey revealed that male patients were more strongly affected than fe-
                           males in terms of mortality or disease severity [22,23]. However, with respect to COVID-19
                           incidence and patient gender, no significant relation has been reported [24,25] so far. To
                           study whether COVID-19 spread was affected by gender, confirmed cases in all continents
                           were arranged depending on patient’s gender in the two periods of this study; no increased
                           susceptibility in relation to gender was found. However, India and the rest of the Asia
                           registered a higher number of male than female patients in both period I (male patients:
                           Asia, 61.4%, India, 64.9%) and period II (male patients: Asia, 59.54%, India, 71.09%). In-
                           terestingly, COVID-19 spread in Oceania showed no significant relationship to gender in
                           period I (female patients, 51.9%, male patients, 48.08%) but the percentage of male patients
                           was higher (73.68%) than that of the female patients (26.3%) in period II (Figure 3A). To
                           understand these changes, PANGOLIN lineages were studied and it was found that the
                           new lineage B.1.466.2 infected preferentially the Oceanian male population (n = 19) than the
                           female (n = 1) population but infected equally males and females in the Asian community.
                           Therefore, more information may be required for any further conclusion.

                           Figure 3. (A) Continent-wise and (B) clade-wise analysis based on COVID-19 patients’ gender for
                           both period I (March 2020–February 2021) and period II (March 2021–first week of April 2021).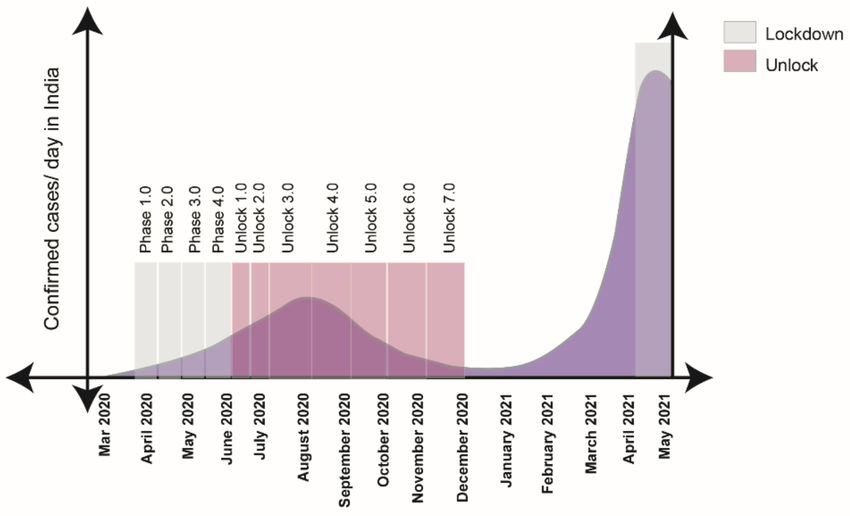
Pathogens 2021, 10, 1222                                                                                                  6 of 15

                                To identify any relationship between clades and COVID-19 patient gender, a clade-
                           wise analysis was performed. A dataset analysis showed no significant relationship be-
                           tween G, GH, and GR with patient gender in both periods. However, the male population
                           was more likely to be susceptible to the GRY (odds ratio 1.83 CI 95% 1.78–1.88) and GV
                           clades (odds ratio 1.71 CI 95% 1.66–1.75) in period I as compared to period II (GRY: odds
                           ratio 0.85 CI 95% 0.82–0.88; GV: odds ratio 1.05 CI 95% 0.94–1.18) (Figure 3B).

                           2.3. Phylogenetic Analysis of the First and Second Waves of COVID-19 Infection in India
                                To determine the route of evolution of the highly infective SARS-CoV-2 variants,
                           whole-genome sequences of 10 highly prevalent variants in the first wave of infection
                           (B.1.36, B.1.1.306, B.1, B.1.36.29, B.1.1, B.1.1.216, B.1.617.1, B.1.1.326, B.1.36.8, B.6) and 10
                           highly prevalent variants in the second wave of infection in India (B.1.617.2, B.1.617.1,
                           B.1.17, B.1, B.1.617.3, B.1.36.29, B.1.351, B.1.525, B.1.1.306) were downloaded from the
                           GISAID repository and analyzed by the MEGA-X software. The results showed that
                           the SARS-CoV-2 variants of the GH and GR clades were highly prevalent in the first
                           wave of infection. However, in the second wave of infection, the G clade infected the
                           Indian population at a higher rate as compared to the GH and GR clades. Moreover,
                           the phylogenetic analysis revealed that B.1.617.1, present in both the waves, was the
                           evolutionary ancestor of B.1.617.2 and B.1.617.3 (Figure 4) and might be responsible for
                           the variation in clade distribution in India from the GR clade to the G clade, as shown
                           in Figure 1.

                           Figure 4. Phylogenetic analysis of 10 highly prevalent SARS-CoV-2 lineages in the two waves of
                           infection in India. Red color designates highly prevalent lineages in the first wave, and green color
                           designates highly prevalent lineages that appeared in the second wave of infection.

                           2.4. Current Scenario (April 2021–May 2021) in India
                               In India, COVID-19-positive cases increased and touched a peak during the period
                           of April–May 2021. However, in comparison to the rate of infection, the number of
                           deaths/million Indian inhabitants is not alarming. As the emergence of highly propagating
Pathogens 2021, 10, 1222 7 of 15
SARS-CoV-2 lineages may contribute to the rise of COVID-19 cases, it is essential to study
the appearance of new variants and clades in April–May 2021 in India. Analysis using the
COVID-19 CoV genetic tool (COVID-19 CG), an open-source tool for visualizing GISAID
SARS-CoV-2 data, showed a sudden increase of infections due to the G clade (82.34%)
in the period of April–May 2021 (Figure 5A). The spread of the G clade corresponded to
the outbreak of the new variant carrying the D614G spike mutation, which is capable of
infecting people at a higher transmission rate than other clade variants. Lineage analysis
showed that in this period, B.1.617.2 (52%) and B.1.617.1 (17.96%) were the two prevalent
SARS-CoV-2 variants in India (Figure 5B).
Figure 5. (A) COVID CG analysis showed that in the period of April–May 2021, G clade infection increased from 46%
to 82.34%; (B) lineage analysis shows the percentages of SARS-CoV-2 PANGOLIN lineages in India in the period of
April–May 2021.
In Table 1, we listed the nine most prevalent variants in India and studied their
mutation status. Among these, the B.1.617.1 and B.1.617.2 variants were most preva-
lent in India compared to the rest of the World. Analysis based on an available public
resource (https://outbreak.info/situation-reports, accessed on 27 May 2021) showed that
B.1.617.2 has mutations in ORF1b, S, ORF3a, ORF7a, ORF8, M and N genes, as shown in
Table 1. Location-wise analysis showed that the prevalence of the B.1.617.2 lineage in India
was 14% as compared to 1% worldwide. Similarly, B.1.617.1 has mutations in ORF1b, S,
ORF3a, ORF7a and N genes and this lineage has been highly prevalent in India (19%) in
comparison to the World (5%) [26].
2.5. Government Stringent Policies
The emergence of new SARS-CoV-2 variants in the second wave of infection may be
considered as a predominant reason for the rising of COVID-19 confirmed cases in the
Indian community as compared to the first wave. The implementation of Government’s
stringent policies was another key factor for COVID-19 case management in both periods I
and II. To track the transmission of infectious diseases, a real-time reproduction number
(Rt) is calculated depending on the number of cases. Rt > 1 indicates that the infection
transmission is progressing exponentially [27]. During the first wave, nearly all countries’
governments calculated the Rt on a daily basis to follow up viral transmission and imple-
ment stringent policies. Near all countries except Sweden and Japan, implemented partial
or full lockdown on the onset of the COVID-19 outbreak. Lockdown has several positive
effects such as (1) it could break the chain of the exponential increase of virus infection
by inhibiting the rates of contact between people [28]; (2) provided time to strengthen
countries’ medical capacity, such as obtaining test kits and personal protective equipmentPathogens 2021, 10, 1222 8 of 15
(PPE) kit, organizing quarantine centers, increasing the number of beds and ventilation
equipment etc.; (3) as high dust or air particulates may act as virus carriers [29], a long
lockdown markedly reduced pollution as well as viral transmission; (4) could limit viral
diffusion, since as reported, high ground ozone levels and low nitrous oxide levels favor
viral growth in summer (April–June), a time when India was under full lockdown [30].
A detailed description of the lockdown and the unlock phases in India is presented in
Figure 6. With the onset of the first wave in India, the Government imposed a lockdown
all over the country in four phases, i.e., Phase 1: 25 March–14 April 2020, Phase 2: 15
April –3 May 2020, Phase 3: 4 May–17 May 2020, Phase 4: 18 May–31 May 2020. The
lockdown was gradually withdrawn in several steps to balance the need to provide safety
from the virus and restore the economic growth of the country. Lockdown withdrawal
phases were as follows: Unlock 1.0: 30 May–8 June 2020, Unlock 2.0: 1 July–31 July 2020,
Unlock 3.0: August 2020, Unlock4.0: September 2020, Unlock 5.0: October 2020, Unlock
6.0: November 2020, Unlock 7.0: December2020. Over time, India started experiencing a
low number of CODID-19-positive cases and during February 2021, the number of COVID-
19 confirmed cases/day was very low, which indicated that the first wave of COVID-19
was close to an end. However, the unexpected sharp rise of confirmed cases towards
the end of March 2021 indicated the initiation of the second wave in India. State-wide
lockdown was found beneficial for managing COVID-19 confirmed cases in the second
wave of infection as after few weeks of the implementation of the lockdown, the number of
confirmed cases/day dropped evidently.
Figure 6. Diagram showing that in the first wave, the nationwide lockdown in India started at
the end of March and lasted up to June 2020, followed by unlocking from the end of June 2020 to
December 2020. In second wave, the state-wise lockdown has been implemented from April 2021 to
the present.
Along with lockdown implementation, early tracing of variants, maintaining strict
preventive measures like wearing a face mask, frequent use of sanitizers, maintaining social
distance of at least six feet, increasing the number of tests/day, ensuring the availability of
test kits, performing timely serosurveys were found helpful to restrict the spread of new
variants to other states.Pathogens 2021, 10, 1222 9 of 15
Table 1. Mutations of emerged variants of SARS-CoV-2 in April–May in India.
Location
Lineage Clade ORF1a ORF1b S ORF3a ORF6 ORF7a ORF8 M E N
Percentage
T19R, del157/158, D63G,
P314L, G662S, V82A India (14%),
B.1.617.2 G —– L452R, T478K, S26L —– Del119/120 I82T —– R203M,
P1000L T12OI Worldwide (1%)
D614G, P681R, D950N D377Y
T1567I, T3646A,
L452R, E484Q, D614G, R203M, India (19%),
B.1.617.1 G —– P314L, M1352I, S26L —– V82A —– —– —–
P681R, Q1071H D377Y Worldwide (0.5%)
K2310R
T1001I, Del69/70, del144/145,
A17O8D, N501Y, A570D, D614G, Q27, R25I, D3L, R203K, India (10%),
B.1.1.7 GRY P314L —– —– —– —– —–
I2230T, P681H, T716I, Y73C G204R, S235F Worldwide (42%)
del3675/ 3677 S982A, D1118H
India (11%),
B.1 G/GH —– P314L D614G —– —– —– —– —– —– —–
Worldwide (5%)
R203K, India (7%),
B.1.1 GR —– P314L D614G —– —– —– —– —– —–
G204R, Worldwide (3%)
India (1%),
B.1.393 unknown —– P314L D614G —– —– —– —– —– —– —–
Worldwide (0.5%)
D80A, D215G,
T265I, K1655N,
del241/243, K417, Q57H, India (2%),
B.1.351 GH K3353R, P314L —– —– —– —– P71L T205I
E484K,N501Y, S171L Worldwide (1%)
del3675/3677
D614G, A701V
Q52R, A67V, del69/70,
T2007I, del T205I, del3, India (1%),
B.1.525 G P314L del144/145, E484K, —– Del2/3 —– —– I82T L21F
3675/3677 A12G Worldwide (0.5%)
D614G, Q677H,F888L
India (1%),
B.1.153 G —– —– D614G —– —– —– —– —– —– —–
Worldwide (0.5%)
Data access to https://outbreak.info, accessed on 23 May 2021.Pathogens 2021, 10, 1222 10 of 15
The Government of India started to vaccinate the community in January 2021, which
might be a key factor to restrict community transmission and reduce case fatality rate (CFR).
The government continually encourages the public to be vaccinated against COVID-19,
as experts estimate that if 80–90% of the population is vaccinated or has recovered from
COVID-19, herd immunity would be achieved. However, there is always a disagreement
as to whether COVID vaccines create herd immunity; in fact, continuous viral transmission
and variants generation, as well as waning of vaccine-induced immunity are the three
hurdles for achieving the herd immunity threshold [31]. The average numbers of daily
vaccinations and average daily full vaccinations are summarized in Table 2. A rapid vacci-
nation is the only way to limit community transmission and restrict COVID-19 recurrence
in India.
Table 2. COVID-19 vaccination in India (data accessed on 27 May 2021).
Month, 2021 Average Vaccination/Day Average Full Vaccination/Day
January 2,50,589 0
February 2,88,794 87,721
March 14,17,358 2,21,887
April 23,19,791 5,76,215
Up to 25 May 11,25,377 6,14,969
Data accessed to https://github.com, accessed on 27 May 2021.
3. Discussion
The goal of this study was to comprehensively analyze the key factors responsible for
the sharp rising of confirmed COVID-19 cases in India in the second wave of infection as
compared to the first wave. Dataset analysis explored the link between gradual changes in
clade distribution due to virus mutations and the emergence of new SARS-CoV-2 variants
globally. Continual mutations in spike gene, ORF1a, ORF1b, ORF3a, ORF8, N gene, E gene
and M gene generated different clades (G, GH, GR, GRY), leading to the different degrees
of virulence across the world. The frequent determination of viral load in patients and
associated clades of the circulating viral strains may be crucial to understand the molecular
evolution of the virus and make decisions regarding COVID-19 treatment. Our study
showed that clade distribution in India varied over time, with a rise of the G clades from
21.6% in period I to 46% in period II and an escalation to 82.34% by the end of May
2021. COVID CG analysis confirmed that during the period of April–May 2021, the rapid
emergence of few lineages such as B.1.617.2 (52%) and B.1.617.1 (17.96%) of the G clade
might have been responsible for the expansion of the G clade in India. Phylogenetic analysis
confirmed that the B.1.617.1 lineage evolutionary generated the B.1.617.2 and B.1.617.3
lineages in the second wave of infection in India. As the G clade was associated with a
higher viral load than other clades [32], it can be inferred that the rapid rising of the G clade
in India during period II of infection played a significant role in augmenting the rate of
COVID-19 infection. Previous studies showed that infection with SARS-CoV-2 clade L/V
was strongly associated with the generation of pro-inflammatory cytokines [33], severe
COVID-19 lung infection [34] and increased creatinine levels in COVID-19 patients [35].
On the contrary, infection with viral clades carrying the 614G amino acid mutation in
the spike protein did not increase patient severity significantly [32]. Therefore, the high
number of daily confirmed cases but the low number of deaths /million Indian individuals
could be explained by the high distribution of the G clades across India in period II of
COVID-19 infection.
Studying the distribution of the SARS-CoV-2 clades in relation to patient age indicated
that all viral clades infected patients irrespective of their age. However, in terms of mortality,
G clades viral infection led to mortality in 37.43% of older patients in 58 countries [36].
The presence of comorbid factors like hypertension, cardiovascular disease, deep venous
thrombosis and chronic renal disease in older patients may have contributed to the rise of
patient mortality due to COVID-19 [37]. Our study showed that patients in the age groups
of 11–30 years, 31–45 years and 61–80 years were at high risk of COVID-19 infection in bothPathogens 2021, 10, 1222 11 of 15
periods across the world. Moreover, the clade-wise analysis showed that the 11–30-year-old
population was at high risk of infection with the GH clade in period II of COVID-19 spread.
A metadata analysis by Hamid et al. concluded that disease severity and mortality in
male patients were higher than those in female patients of the same age [38]. One report
explained that this gender bias was due to a dwindling T cell activation system in older
males compared to older females [39]. Our analysis revealed that except for India and the
rest of Asia, the two genders were equally infected in periods I and II of COVID-19 spread
across the world. However, the clade-wise analysis showed that in period II, both genders
were equally susceptible to infection globally.
Along with the emergence of highly transmissible variants in India, the ‘implementa-
tion of lockdown’ factor need to be discussed. In India, the calculated Rt in the first week of
March 2020 was 3.2 and further stabilized to 1.09 in the third week of April when India was
under lockdown [40]. The Rt went below 1 from September 2020 to February 2021, when
the Government of India relieved the lockdown in the country. In April 2021, the Rt in India
reached 1.37, and this time, lockdown was necessary to arrest the virus diffusion [41]. State-
wise lockdown proved effective in terms of managing daily COVID-19 cases, as imposing
lockdown in April–May 2021 lowered the number of COVID-19 confirmed cases/day from
400,000 cases on 8 May 2021 to 127,000 cases on 31 May 2021.
Along with its strengths, this study has several limitations. The first limitation is
that the data derived from the GISAID database do not contain patient clinical history.
Several studies showed that diseases like hypertension, diabetes, cardiovascular disease,
renal disease may be important comorbid factors influencing patient hospitalization and
mortality. Secondly, along with comorbid factors, the presence of influenza A H1N1 and
other seasonal coinfections and the type of care provided by different hospital systems
need to be considered. Thirdly, the information on the number of recovered and deceased
patients in relation to each viral clade was also not available. Fourthly, we did not include
asymptomatic or pauci-symptomatic patients in this study.
Collectively, our results demonstrate that the analysis of viral clade distribution is
important to understand changes in COVID-19 clinical manifestations over time. The
shifting of highly prevalent viral clades from 1st wave to 2nd wave of COVID-19 infection
in India explains the high infection rate per million of individuals. Studies explored that
the 31–45-year-old Indian population was infected more extensively in the second wave
as compared to the first wave of infection. The implementation of lockdown was one of
the most effective strategies to manage viral propagation and helped lower COVID-19
spread in India. In addition, a rapid diagnosis of SARS-CoV-2 variants, strict adherence
to preventive measures, prompt diagnosis and treatment, appropriate and rapid launch
of vaccination throughout the whole population were equally important to restrict viral
transmission in the Indian community.
4. Conclusions
The current study indicates the importance of clade variation analysis to understand
the evolution of the current COVID-19 pandemic. The analysis presented in this study
indicates that the emergence of SARS-CoV-2 clade G was one of the prime reasons for the
onset of the second wave and associated increase of COVID-19-positive cases in India,
which were >400,000/day in May 2021. Besides the emergence of new SARS-CoV-2 lineages,
a comparative analysis also showed the importance of lockdown in preventing the spread
of infection in India. Considering the current trend of the pandemic, India is still in
the second wave of infection and there is a fear that the third wave will develop. Only
time can tell whether the third wave of SARS-CoV-2 infection will hit India, but results
from this comparative analysis would definitely encourage to create new and appropriate
policies to mitigate COVID-19 severity and manage the second and third waves of the
pandemic successfully.Pathogens 2021, 10, 1222 12 of 15
5. Materials and Methods
5.1. SARS-CoV-2 Metadata Analysis
Deposited COVID-19 information as metadata was downloaded from the GISAID
database (https://www.epicov.org, accessed on 21 April 2021). Metadata of COVID-19
included information on date of collection, geographic location, patient gender, patient
age, and viral genome clade. Firstly, depending upon the date of collection, the data were
categorized into two periods i.e. period I (March 2020–February 2021) and period II (March
2021–first week of April 2021). Only data having proper information viz. patient gender,
patient age (1–100 years), and viral isolation from the human host were included in the
study. By using ‘filter’ in Microsoft excel, we screened the data and found n = 212,550
out of n = 850,559 and n = 55,029 out of n = 170,776, which were subsequently selected
for the current study of period I and period II respectively. All the filtered data used in
this study were further assorted depending on the geographic location viz. Africa, Asia,
Europe, North America, South America, Oceania and India. The collected data included
in the current study were as follows: Africa 8,953 (period I), 164 (period II); Asia 17,724
(period I), 873 (period II); Europe 83,850 (period I), 22,091 (period II); North America 82,969
(period I), 31,429 (period II); South America 8,035 (period I), 419 (period II); Oceania 11,524
(period I), 58 (period II); India 6,438 (period I), 128 (period II). For comparing the changes
over these two periods, clades variations i.e. G, GH, GR, GRY, GV and others clades (S, L, V,
O), patient age groups (1–10 years, 11–30 years, 31–45 years, 46–60 years, 61–80 years, and
81–100 years) and patient gender (male or female) were further classified in their respective
continents or India.
5.2. Case Study of Clades and Lineages in April–May 2021 in India
To analyze the current scenario of COVID-19 spread in India in the period April–
May 2021, GISAID Initiative COVID CG (https://covidcg.org, accessed on 27 May 2021)
developed by the Broad Institute of MIT and Harvard (USA) was used. Setting of clade
or lineages in the period of April–May 2021 in India was used to understand the current
scenario of clades and lineages distribution in India [9].
5.3. Mutation Status of SARS-CoV-2 Variants in India
GISAID Initiative ‘Mutation Situation Reports’, developed by the Anderson Lab at
Scripps Research (USA), explored the mutation status of nine highly prevalent lineages in
India. This data were also used to analyze the prevalence percentages of these SARS-CoV-2
variants in India and worldwide [26].
5.4. Vaccination Data Sources
For information regarding vaccination in India, data were collected from the GitHub
repository (https://github.com/owid/covid-19-data/blob/master/public/data/vaccinations/
country_data/India.csv, accessed on 27 May 2021). The data were divided into groups
recording the number of daily vaccinations/month and that of daily fully vaccinations/month.
The vaccination data for January–25 May 2021 reflect the current situation of vaccination
in India.
5.5. Phylogenetic Analysis
Whole genome sequence of SARS-CoV-2 lineages in period I and period II of COVID-
19 pandemic in India were downloaded from the GISAID database (www.epicov.org/,
accessed on 15 July 2021). The sequences were aligned, and a neighbor-joining phylogeny
tree was constructed by using MEGA-X software.
5.6. Statistical Analysis
All the data in the figures are presented as percentages. For evaluating the association
of a viral clade with population age or patient gender, odds ratios were calculated. An odds
ratio > 1 indicated that a clade infection was more likely to be associated with the patientPathogens 2021, 10, 1222 13 of 15
age or gender, whereas an odds ratio < 1 indicated that a clade infection was less likely
to be associated with patient age or gender. Confidence of interval (CI) was set at 95%.
All calculations were done by using https://select-statistics.co.uk/calculators/confidence-
interval-calculator-odds-ratio/software, accessed on 31 May 2021.
Author Contributions: Conceptualization, A.K.C. and A.S.; methodology, A.S. and A.K.C.; software,
A.S.; validation A.K.C. and A.S.; formal analysis, A.K.C. and A.S..; investigation, A.K.C. and A.S.;
resources, A.K.C., S.D. and A.S.; data curation, A.S.; writing—original draft preparation, A.S. and
A.K.C.; writing—review and editing, A.K.C., S.D. and A.S.; visualization, A.K.C. and A.S.; super-
vision, A.K.C.; project administration, A.K.C. and S.D.; funding acquisition, S.D. and A.K.C. All
authors have read and agreed to the published version of the manuscript.
Funding: This research received no external funding.
Institutional Review Board Statement: Not applicable.
Informed Consent Statement: Not applicable.
Data Availability Statement: GISAID EpiCoV™ Database was used for analyzing the metadata for
further exploration of relevant data. We would like to thank the GISAID Initiative and are grateful
to all data contributors, i.e., the Authors, the originating laboratories responsible for obtaining the
specimens, and the submitting laboratories for generating the genetic sequence and metadata and
sharing them via the GISAID Initiative, on which this research is based [26]. We used the data
available in the github repository (github.com/owid/covid-19, accessed on 27 May 2021) for the
collection of vaccination data in India.
Acknowledgments: We gratefully acknowledge all the Authors from the originating laboratories
responsible for obtaining the specimens and the submitting laboratories where genetic sequence data
were generated and shared via the GISAID Initiative, on which this research is based [9].
Conflicts of Interest: The authors declare no conflict of interest.
References
1. Biswas, A.; Bhattacharjee, U.; Chakrabarti, A.K.; Tewari, D.N.; Banu, H.; Dutta, S. Emergence of Novel Coronavirus and
COVID-19: Whether to Stay or Die Out? Crit. Rev. Microbiol. 2020, 46, 182–193. [CrossRef]
2. Zhang, Y.-Z.; Holmes, E.C. A Genomic Perspective on the Origin and Emergence of SARS-CoV-2. Cell 2020, 181, 223–227.
[CrossRef]
3. Zhu, Z.; Lian, X.; Su, X.; Wu, W.; Marraro, G.A.; Zeng, Y. From SARS and MERS to COVID-19: A Brief Summary and Comparison
of Severe Acute Respiratory Infections Caused by Three Highly Pathogenic Human Coronaviruses. Respir. Res. 2020, 21, 224.
[CrossRef]
4. Forni, D.; Cagliani, R.; Clerici, M.; Sironi, M. Molecular Evolution of Human Coronavirus Genomes. Trends Microbiol. 2017, 25,
35–48. [CrossRef] [PubMed]
5. Wu, A.; Peng, Y.; Huang, B.; Ding, X.; Wang, X.; Niu, P.; Meng, J.; Zhu, Z.; Zhang, Z.; Wang, J.; et al. Genome Composition and
Divergence of the Novel Coronavirus (2019-NCoV) Originating in China. Cell Host Microbe 2020, 27, 325–328. [CrossRef]
6. Gordon, D.E.; Jang, G.M.; Bouhaddou, M.; Xu, J.; Obernier, K.; White, K.M.; O’Meara, M.J.; Rezelj, V.V.; Guo, J.Z.;
Swaney, D.L.; et al. A SARS-CoV-2 Protein Interaction Map Reveals Targets for Drug Repurposing. Nature 2020, 583, 459–468.
[CrossRef] [PubMed]
7. Huang, Y.; Yang, C.; Xu, X.; Xu, W.; Liu, S. Structural and Functional Properties of SARS-CoV-2 Spike Protein: Potential Antivirus
Drug Development for COVID-19. Acta Pharmacol. Sin. 2020, 41, 1141–1149. [CrossRef]
8. Sasaki, M.; Uemura, K.; Sato, A.; Toba, S.; Sanaki, T.; Maenaka, K.; Hall, W.W.; Orba, Y.; Sawa, H. SARS-CoV-2 Variants with
Mutations at the S1/S2 Cleavage Site Are Generated in Vitro during Propagation in TMPRSS2-Deficient Cells. PLoS Pathog. 2021,
17, e1009233. [CrossRef]
9. Shu, Y.; McCauley, J. GISAID: Global Initiative on Sharing All Influenza Data—From Vision to Reality. Eurosurveillance 2017, 22.
[CrossRef] [PubMed]
10. Rambaut, A.; Holmes, E.C.; O’Toole, Á.; Hill, V.; McCrone, J.T.; Ruis, C.; du Plessis, L.; Pybus, O.G. A Dynamic Nomenclature
Proposal for SARS-CoV-2 Lineages to Assist Genomic Epidemiology. Nat. Microbiol. 2020, 5, 1403–1407. [CrossRef]
11. Magro, G. SARS-CoV-2 and COVID-19: Is Interleukin-6 (IL-6) the ‘Culprit Lesion’ of ARDS Onset? What Is There besides
Tocilizumab? SGP130Fc. Cytokine X 2020, 2, 100029. [CrossRef]
12. Mokhtari, T.; Hassani, F.; Ghaffari, N.; Ebrahimi, B.; Yarahmadi, A.; Hassanzadeh, G. COVID-19 and Multiorgan Failure: A
Narrative Review on Potential Mechanisms. J. Mol. Hist. 2020, 51, 613–628. [CrossRef] [PubMed]Pathogens 2021, 10, 1222 14 of 15
13. Wańkowicz, P.; Szylińska, A.; Rotter, I. Evaluation of Mental Health Factors among People with Systemic Lupus Erythematosus
during the SARS-CoV-2 Pandemic. JCM 2020, 9, 2872. [CrossRef]
14. Wańkowicz, P.; Szylińska, A.; Rotter, I. The Impact of the COVID-19 Pandemic on Psychological Health and Insomnia among
People with Chronic Diseases. JCM 2021, 10, 1206. [CrossRef] [PubMed]
15. Andrews, M.; Areekal, B.; Rajesh, K.; Krishnan, J.; Suryakala, R.; Krishnan, B.; Muraly, C.; Santhosh, P. First Confirmed Case of
COVID-19 Infection in India: A Case Report. Indian J. Med. Res. 2020, 151, 490. [CrossRef] [PubMed]
16. Seong, H.; Hyun, H.J.; Yun, J.G.; Noh, J.Y.; Cheong, H.J.; Kim, W.J.; Song, J.Y. Comparison of the Second and Third Waves of
the COVID-19 Pandemic in South Korea: Importance of Early Public Health Intervention. Int. J. Infect. Dis. 2021, 104, 742–745.
[CrossRef] [PubMed]
17. Taboada, M.; González, M.; Alvarez, A.; Eiras, M.; Costa, J.; Álvarez, J.; Seoane-Pillado, T. First, Second and Third Wave of
COVID-19. What Have We Changed in the ICU Management of These Patients? J. Infect. 2021, 82, e14–e15. [CrossRef] [PubMed]
18. Gili, T.; Benelli, G.; Buscarini, E.; Canetta, C.; La Piana, G.; Merli, G.; Scartabellati, A.; Viganò, G.; Sfogliarini, R.; Melilli, G.; et al.
SARS-COV-2 Comorbidity Network and Outcome in Hospitalized Patients in Crema, Italy. PLoS ONE 2021, 16, e0248498.
[CrossRef]
19. Cunningham, J.W.; Vaduganathan, M.; Claggett, B.L.; Jering, K.S.; Bhatt, A.S.; Rosenthal, N.; Solomon, S.D. Clinical Outcomes in
Young US Adults Hospitalized With COVID-19. JAMA Intern. Med. 2021, 181, 379. [CrossRef]
20. Goldstein, E.; Lipsitch, M.; Cevik, M. On the Effect of Age on the Transmission of SARS-CoV-2 in Households, Schools, and the
Community. J. Infect. Dis. 2021, 223, 362–369. [CrossRef]
21. Davies, N.G.; Klepac, P.; Liu, Y.; Prem, K.; Jit, M.; Eggo, R.M.; CMMID COVID-19 Working Group. Age-Dependent Effects in the
Transmission and Control of COVID-19 Epidemics. Nat. Med. 2020, 26, 1205–1211. [CrossRef]
22. Jin, J.-M.; Bai, P.; He, W.; Wu, F.; Liu, X.-F.; Han, D.-M.; Liu, S.; Yang, J.-K. Gender Differences in Patients With COVID-19: Focus
on Severity and Mortality. Front. Public Health 2020, 8, 152. [CrossRef]
23. Peckham, H.; de Gruijter, N.M.; Raine, C.; Radziszewska, A.; Ciurtin, C.; Wedderburn, L.R.; Rosser, E.C.; Webb, K.; Deakin, C.T.
Male Sex Identified by Global COVID-19 Meta-Analysis as a Risk Factor for Death and ITU Admission. Nat. Commun. 2020, 11,
6317. [CrossRef]
24. Mukherjee, S.; Pahan, K. Is COVID-19 Gender-Sensitive? J. Neuroimmune Pharmacol. 2021, 16, 38–47. [CrossRef] [PubMed]
25. Lakbar, I.; Luque-Paz, D.; Mege, J.-L.; Einav, S.; Leone, M. COVID-19 Gender Susceptibility and Outcomes: A Systematic Review.
PLoS ONE 2020, 15, e0241827. [CrossRef]
26. Elbe, S.; Buckland-Merrett, G. Data, Disease and Diplomacy: GISAID’s Innovative Contribution to Global Health: Data, Disease
and Diplomacy. Glob. Chall. 2017, 1, 33–46. [CrossRef]
27. Thompson, R.N.; Stockwin, J.E.; van Gaalen, R.D.; Polonsky, J.A.; Kamvar, Z.N.; Demarsh, P.A.; Dahlqwist, E.; Li, S.; Miguel, E.;
Jombart, T.; et al. Improved Inference of Time-Varying Reproduction Numbers during Infectious Disease Outbreaks. Epidemics
2019, 29, 100356. [CrossRef]
28. Madewell, Z.J.; Yang, Y.; Longini, I.M.; Halloran, M.E.; Dean, N.E. Household Transmission of SARS-CoV-2: A Systematic Review
and Meta-Analysis. JAMA Netw. Open. 2020, 3, e2031756. [CrossRef]
29. Comunian, S.; Dongo, D.; Milani, C.; Palestini, P. Air Pollution and COVID-19: The Role of Particulate Matter in the Spread and
Increase of COVID-19’s Morbidity and Mortality. IJERPH 2020, 17, 4487. [CrossRef] [PubMed]
30. Zoran, M.A.; Savastru, R.S.; Savastru, D.M.; Tautan, M.N. Assessing the Relationship between Ground Levels of Ozone (O3) and
Nitrogen Dioxide (NO2) with Coronavirus (COVID-19) in Milan, Italy. Sci. Total Environ. 2020, 740, 140005. [CrossRef] [PubMed]
31. COVID-19 Vaccine Key to Reaching ‘Herd Immunity’. Available online: https://www.muhealth.org/our-stories/covid-19
-vaccine-key-reaching-herd-immunity (accessed on 21 September 2020).
32. Young, B.E.; Wei, W.E.; Fong, S.-W.; Mak, T.-M.; Anderson, D.E.; Chan, Y.-H.; Pung, R.; Heng, C.S.; Ang, L.W.; Zheng, A.K.E.; et al.
Association of SARS-CoV-2 Clades with Clinical, Inflammatory and Virologic Outcomes: An Observational Study. EBioMedicine
2021, 66, 103319. [CrossRef]
33. Liu, J.; Li, S.; Liu, J.; Liang, B.; Wang, X.; Wang, H.; Li, W.; Tong, Q.; Yi, J.; Zhao, L.; et al. Longitudinal Characteristics of
Lymphocyte Responses and Cytokine Profiles in the Peripheral Blood of SARS-CoV-2 Infected Patients. EBioMedicine 2020, 55,
102763. [CrossRef]
34. He, L.; Ding, Y.; Zhang, Q.; Che, X.; He, Y.; Shen, H.; Wang, H.; Li, Z.; Zhao, L.; Geng, J.; et al. Expression of Elevated Levels
of Pro-Inflammatory Cytokines in SARS-CoV-Infected ACE2 + Cells in SARS Patients: Relation to the Acute Lung Injury and
Pathogenesis of SARS. J. Pathol. 2006, 210, 288–297. [CrossRef]
35. Esper, F.P.; Cheng, Y.-W.; Adhikari, T.M.; Tu, Z.J.; Li, D.; Li, E.A.; Farkas, D.H.; Procop, G.W.; Ko, J.S.; Chan, T.A.; et al. Genomic
Epidemiology of SARS-CoV-2 Infection During the Initial Pandemic Wave and Association With Disease Severity. JAMA Netw.
Open 2021, 4, e217746. [CrossRef]
36. Pandit, B.; Bhattacharjee, S.; Bhattacharjee, B. Association of Clade-G SARS-CoV-2 Viruses and Age with Increased Mortality
Rates across 57 Countries and India. Infect. Genet. Evol. 2021, 90, 104734. [CrossRef]
37. Nakamichi, K.; Shen, J.Z.; Lee, C.S.; Lee, A.; Roberts, E.A.; Simonson, P.D.; Roychoudhury, P.; Andriesen, J.; Randhawa, A.K.;
Mathias, P.C.; et al. Hospitalization and Mortality Associated with SARS-CoV-2 Viral Clades in COVID-19. Sci. Rep. 2021, 11,
4802. [CrossRef]Pathogens 2021, 10, 1222 15 of 15
38. Hamed, S.M.; Elkhatib, W.F.; Khairalla, A.S.; Noreddin, A.M. Global Dynamics of SARS-CoV-2 Clades and Their Relation to
COVID-19 Epidemiology. Sci. Rep. 2021, 11, 8435. [CrossRef]
39. Takahashi, T.; Ellingson, M.K.; Wong, P.; Israelow, B.; Lucas, C.; Klein, J.; Silva, J.; Mao, T.; Oh, J.E.; Yale IMPACT Research
Team; et al. Sex Differences in Immune Responses That Underlie COVID-19 Disease Outcomes. Nature 2020, 588, 315–320.
[CrossRef]
40. Marimuthu, S.; Joy, M.; Malavika, B.; Nadaraj, A.; Asirvatham, E.S.; Jeyaseelan, L. Modelling of Reproduction Number for
COVID-19 in India and High Incidence States. Clin. Epidemiol. Glob. Health 2021, 9, 57–61. [CrossRef]
41. Ranjan, R.; Sharma, A.; Verma, M.K. Characterization of the Second Wave of COVID-19 in India. medRxiv 2021. [CrossRef]You can also read