Why is China investing in Africa? Evidence from the firm level
←
→
Page content transcription
If your browser does not render page correctly, please read the page content below
Why is China investing in Africa?
                                Evidence from the firm level
                                 By Wenjie Chen, David Dollar, and Heiwai Tang1

                                                     August 2015

                                                       Abstract

    China’s increased trade with and investment in Africa has boosted the continent’s growth rate but has also
generated considerable controversy. In this paper we investigate China’s outward direct investment (ODI) in
Africa using macro and micro data. The aggregate data on China’s ODI in African countries reveal that China’s
share of the stock of foreign investment is small, though growing rapidly. China’s attraction to resource-rich
countries is no different from Western investment. China’s ODI is uncorrelated with a measure of property
rights and rule of law, whereas Western investment favors the better governance environments. As a result,
Chinese investment in strong and weak governance environments is about the same, but its share of foreign
investment is higher in the weak governance states. The micro data that we use is MOFCOM’s database on all
Chinese firms investing in Africa between 1998 and 2012. We use key words in project descriptions to code
the investments into 25 sectors. This database captures the small and medium private firms investing in
Africa. Contrary to common perceptions, there are few projects in natural resource sectors. Most projects are
in services, with a significant number in manufacturing as well. In our country-sector-level regressions based
on firms’ transaction-level data, we find that Chinese ODI is profit-driven, just like investors from other
countries. In particular, our regressions show that Chinese ODI is relatively more concentrated in skill-
intensive sectors in skill-abundant countries, but in capital-intensive sectors in capital-scarce countries. These
patterns are mostly observed in politically unstable countries, suggesting stronger incentives to seek profits in
tougher environments. Finally, the predominance of Chinese ODI in services appears to be related to the
recipient countries’ natural resource abundance, which is also consistent with the profit-driven nature of
Chinese ODI.

1
  Affiliations: Chen, George Washington University and International Monetary Fund; Dollar, John L. Thornton China
Center, Brookings; and Tang, Johns Hopkins University. Views expressed are those of the authors and do not necessarily
represent official views of the IMF. We thank Wei Wang for excellent research assistance.

                                                           1
1. Introduction
Since 2000 China has emerged as Africa’s largest trading partner. Chinese direct investment in
and lending to African countries has grown rapidly as well. This Chinese engagement in Africa has no
doubt led to faster growth and poverty reduction on the continent. Per capita growth rate of the
average African economy surged from 0.6% per annum in the 1990s to 2.8% in the 2000s. African
countries have strengthened their institutions and macroeconomic policies, and that is one factor in
the growth acceleration. But demand from China for the continents’ main exports – oil, iron, copper,
zinc, and other primary products – led to better terms of trade and higher export volumes, other
important factors in the growth accelerations.
In the Pew Global Attitudes survey for 2015, African respondents had a significantly more positive
view of China (70% with a favorable view) than respondents in other regions such as Europe (41%),
Asia (57%), or Latin America (57%). This likely reflects the positive impact of China’s engagement on
African growth. At the same time, China’s involvement in Africa is not without controversy, as
conveyed by some typical headlines from the Western press: “Into Africa: China’s Wild Rush”: “China
in Africa: Investment or Exploitation?”; “Clinton warns against ‘new colonialism’ in Africa.” The
criticism comes not just from Western voices. In an op-ed essay last year in The Financial Times,
Lamido Sanusi, who was recently suspended as Nigeria’s central bank governor, wrote: “In much of
Africa, they have set up huge mining operations. They have also built infrastructure. But, with
exceptions, they have done so using equipment and labor imported from home, without transferring
skills to local communities. So China takes our primary goods and sells us manufactured ones. This
was also the essence of colonialism.”
In this paper we investigate one aspect of China’s engagement in Africa, its outward direct
investment (ODI). We start, in Section 2, by examining the allocation of Chinese investment across 49
2African countries and by comparing it to the continent’s total foreign direct investment (FDI). A first
important point is that at end-2012 China’s share of the stock of FDI in Africa was on the order of 3%.
While its investment may be growing rapidly, it is still a small player, and the vast majority of FDI in
Africa comes from Western sources. In this section we show that Chinese investment and Western
investment are similar in that they are attracted to larger markets and to countries with natural
resource wealth. Controlling for those factors, Western investment tends to stay away from
countries with poor governance in terms of property rights and rule of law. Chinese investment, on
the other hand, is indifferent to those governance measures, with the result that the countries where
China’s investment share is large tend to be ones with weak governance.
China’s investment in Africa includes some large deals that have been highly publicized. In DR
Congo, for example, the Sicomines iron mine involves the Chinese state-owned enterprises China
Railway Engineering Corporation and Sinohydro and the private company Zhejiang Huayou Cobalt, in
partnership with Congolese state-owned companies. Other high-profile deals include CNPC’s gas
investment in Mozambique, Chinalco’s mining investment in Guinea, and Sinopec’s oil and gas
acquisition in Angola. In the data on the stock of Chinese investment in different African countries,
these large state-to-state deals no doubt play an important role.
In Section 3 we turn to a different kind of data source. All Chinese enterprises making direct
investments abroad have to register with the Ministry of Commerce. The resulting database provides
the investing company’s location in China and line of business. It also includes the country to which
the investment is flowing, and a description in Chinese of the investment project. However, it does
not include the amount of investment. The investment to Africa over the period 1998 – 2012 includes
about 2000 Chinese firms investing in 49 African countries. We think of the typical entry as a private
firm that is much smaller than the big state-owned enterprises involved in the mega-deals. These
3data provide insight into what the Chinese private sector is doing in Africa. Section 3 introduces this
firm-level database. Based on the descriptions of the overseas investment, we categorize the
projects into 25 industries covering all sectors of the economy (primary, secondary, and tertiary). The
allocation of the projects across countries and across sectors provides a snapshot of Chinese private
investment in Africa.
Section 4 then investigates the allocation of projects more rigorously. In particular we ask
whether factor endowments and other country characteristics influence the number and types of
investment projects from Chinese investors. If Chinese investment is similar to other profit-oriented
investment, then the number and nature of projects should be related to the factor endowments and
other characteristics of the recipient countries. Indeed, we find that while Chinese ODI is less
prevalent in skill-intensive sectors in Africa, it is more prevalent in the more skill-abundant countries,
suggesting that Chinese investors aim to exploit the local comparative advantage. We also find that
Chinese ODI is more concentrated in capital-intensive sectors in the more capital-scarce countries,
suggesting its importance as a source of external financing to the continent. These patterns are
mostly observed in politically unstable countries, implying firms’ stronger incentives to seek profits in
tougher environments. We also find that the prevalence of Chinese ODI in services is positively
related to the recipient countries’ natural resource abundance.
Our paper is related to various strands of literature. First, it relates to the classical theory of
multinational enterprises (MNEs) about how firms use their capabilities and resources to generate
competitive advantage over indigenous firms in host countries (Caves 1971, Hymer 1976,
Kindleberger 1969 and 1970). More recent studies show that in addition to facilitating foreign sales,
firms undertake ODI to acquire resources, assets and technology to develop their competitive
4advantage (Child and Rodrigues 2005, Makino et al. 2002, Mathews 2006).2 Second, our paper
contributes to the growing literature on Chinese ODI. Most of the earlier studies were descriptive in
nature, sometimes relying on case studies (e.g., Deng 2003 and 2004, Wu and Chen 2001). Cai (1999)
proposes that Chinese firms invest overseas mainly to seek markets, natural resources, technology,
managerial skills, and financial capital.3 More recent studies focus on the empirical examination of
the determinants of Chinese ODI (e.g., Buckley et al. 2007), but most of these studies rely on
aggregate data for analysis. There are a few notable exceptions that use micro-level data. For
instance, Luo et al. (2011) show empirically that ODI by private Chinese firms had been prompted to
exploit firm-specific advantages as well as to tackle market imperfection due to underdevelopment of
China’s domestic institutions. Other studies on Chinese overseas M&As support the resource-seeking
and technology-seeking motives (Antkiewicz and Whalley 2007, Rui and Yip 2008). Using aggregate
data, Cheng and Ma (2007) and Cheung and Qian (2007) show that China’s investment was motivated
by both market seeking and resource seeking.
Our paper contributes to this literature by showing that the African investment by private sector
firms that predominate in the MOFCOM database is driven by the profit-oriented motivations that
drive outward investment from other countries.
2. Allocation of Chinese ODI and total FDI across African countries
China’s official statistics on the country’s overseas direct investment (ODI) in Africa reveal a
number of paradoxes. Simply put, China’s investment in Africa is both big and small. It is small in the
2
Here, technology is broadly defined to include production technology, management skills, and brand names.
3
Deng (2004) identifies two additional motives: strategic assets (e.g., brands, marketing networks) and diversification.
The focus of our paper focuses on the non-financial type of OFDI. Clearly, because the PRC was itself a low-cost
production base, cost minimization was not a major motivation of Chinese ODI.
5sense that China is a latecomer to Africa and accounts for only a very small share of the total stock of
foreign investment on the continent. At end-2011, that total stock was $629 billion, of which the
Chinese share was 3.2%. China’s investment in Africa has been growing rapidly and its share will rise
over time, but slowly, starting from a low base. China’s investment in Africa is big in a relative sense,
however. The world as a whole has six times as much direct investment in the U.S. as in Africa,
reflecting the fact that most FDI goes to advanced economies. China’s pattern of investment is
different, however. As of end-2013, China had more ODI in Africa ($26 billion) than in the U.S. ($22
billion). So, China’s relative focus on Africa is large, though it is still a small player in investment
overall.
What about the allocation of China’s investment among African countries? Is it similar to or
different from the pattern seen from existing, mostly Western investors? To answer this question we
use the data on the stock of Chinese ODI in 49 African countries at end-2012 from the Ministry of
Commerce.4 A useful point of departure is the allocation of the overall stock of FDI among those 49
countries. Those data are available at end-2011.5 Globally, the allocation of FDI can be explained
quite well by a parsimonious set of variables that measure (1) market size (total PPP GDP); (2) natural
resource rents as a share of the economy; and (3) governance. For governance we consider two
distinct measures, from the World Governance Indicators:
Rule of law “captures perceptions of the extent to which agents have confidence in and abide by
the rules of society, and in particular the quality of contract enforcement, property rights, the
police, and the courts, as well as the likelihood of crime and violence”;
4
Ministry of Commerce of China, 2012 Statistical Bulletin of China’s Outward Foreign Direct Investment.
5
The stocks of FDI end-2011 are from the updated online database originally published as Lane and Milesi-Ferretti (2007).
6 Political Stability and Absence of Violence/Terrorism “measures perceptions of the likelihood
that the government will be destabilized or overthrown by unconstitutional or violent means,
including politically-motivated violence and terrorism.”
Regression 1 in Table 1 shows that the allocation of FDI across 49 African countries follows the global
pattern. FDI is attracted to larger markets with an elasticity of 0.74. Other things equal, resource rich
countries receive more FDI. The standard deviation across African countries of the resource rents
variable is 17.6, so that the coefficient indicates that one standard deviation richer in resource wealth
attracts 49% more FDI. Finally, FDI prefers an environment of good property rights and rule of law.
Across African countries the standard deviation of the rule of law index is 0.49, so one standard
deviation better on rule of law attracts 31% more investment. Figure 1, a partial scatter plot of the log
of total FDI and the rule of law index, shows this strong relationship.
How does the allocation of Chinese ODI compare? Specification 2 in Table 1 shows that Chinese ODI
is positively correlated with market size and natural resource wealth, with coefficients similar to those
in the equation for overall FDI. However, Chinese ODI has a modest, negative correlation with the Rule
of Law index (specification 3). While property rights/rule of law may not matter, Chinese ODI is
positively correlated with the index of political stability (specification 4). Also, population seems to
matter as a measure of economic size, not just total GDP (specification 5). Comparing the FDI equation
in specification 1 and the Chinese ODI allocation in specification 5: China has a modestly stronger
attraction to natural resources and in terms of governance favors political stability over property
rights/rule of law. The partial scatter of the log of Chinese ODI and the political stability index is shown
in Figure 2. This relationship makes sense given that some significant part of the volume of Chinese
investment in Africa is tied up in state-to-state resource deals. China is more concerned with the
7political stability of the government than with the environment of rule of law in the domestic economy.
Political stability and rule of law are fairly highly correlated (0.59 across African countries). Still, there
are countries that are rated to be significantly better on political stability than on rule of law. Some
examples are Angola, Eritrea, Madagascar, Zambia, and Zimbabwe – all of which have significant
Chinese investment relative to their total FDI. Dollar (2015) finds that these relationships exist globally:
total FDI is strongly attracted to good property rights and rule of law, whereas Chinese ODI is attracted
to politically stable environments, without reference to the rule of law. So, the relationship is not
special to Africa but says something about Chinese ODI in general.
Since Chinese investment is indifferent to the property rights/rule of law environment, there are
similar amounts of Chinese investment in good governance countries and poor governance countries.
For example, if we divide the 49 African countries into three groups based on the Rule of Law index in
2012, the stock of Chinese ODI is nearly the same in the good governance countries, as in the poor
governance ones (Figure 3). For the stock of FDI, on the other hand, nearly 60% is in the good
governance environments, compared to 25% in the poor governance environments (Figure 4). These
patterns together mean that the countries in which China’s share of inward investment is large tend to
be ones with poor governance. Still, note that it is only a minority of Chinese investment that is in those
environments.
3. Data on Chinese Outward Direct Investment
The data on Chinese ODI transactions was obtained from the Ministry of Commerce (MOFCOM)
and includes deals that were approved by the ministry between January 1, 1998 and December 31,
2012. For each ODI deal, the data set reports the name of the investing firm, the firm's sector of
business, the province of origin, and the recipient country of the ODI flow. There is, however, no
8information on the amount of the deal or the name of the target for mergers and acquisitions. The
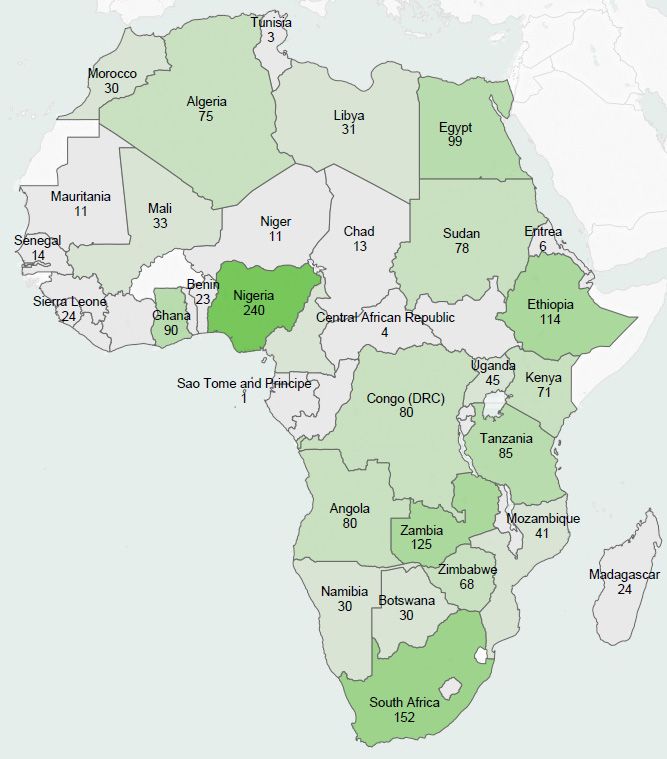
raw data contains 2,005 deals at the firm level, covering 49 countries on the African continent.6 The
top five destination countries for Chinese ODI are: Nigeria, South Africa, Zambia, Ethiopia, and Egypt,
with Nigeria taking the clear lead, representing 12% of all deals. Figure 5 depicts the geographical
distribution of the number of deals by country. Deals tend be more concentrated in the East and
South African regions, whereas Central and West Africa, with the exception of Nigeria, have relatively
fewer deals. In East Africa, countries such as Ethiopia, and to some extent Kenya and Tanzania are
relatively resource poor compared to some of the Southern African countries such as Zambia, Angola,
and South Africa. Some of the reasons why East Africa stands out as a popular destination for these
private Chinese investments are its relatively more developed infrastructure, including ports, and its
relative closeness to China. The East Africa Community (EAC), in particular, forms a customs and
single market trading union that has invested heavily in infrastructure investments, mostly with loans
from the Chinese government, such as the Standard Gauge Rail project originating in Kenya as well as
the Karuma Hydroelectric power project in Uganda. These projects will enhance the connectivity
between these countries and supply reliable energy in the future years to come, thus, making the
region an attractive destination.
Within each transaction, we categorize the types of projects the Chinese investing firm is
conducting in the destination countries. By using key words in the deal descriptions provided in the
data, we categorize projects into different industries. Since most of the deals involve multiple
projects, sometimes in different industries, we obtain a sample of 3,989 projects. For the remainder
of the analysis, we use the project-based sample that we categorize into different industries based on
the United Nations 34 sector industry classification, which we then further condense into 17
6
Chen and Tang (2014) provide a detailed description of the distribution of Chinese ODI outside Africa, and study the
causes and consequences of ODI at the firm level.
9manufacturing sectors, 7 service sectors, and 1 mining sector. Table 2 presents the country
breakdown in terms of number of Chinese investing firms and the number of projects that we
identified based on the firm-level deals. Table 3 presents the sectoral distribution in terms of number
of projects.
We find that about 60 percent of the projects are in service sectors, with the remaining portion
almost evenly split between manufacturing and natural resources. The two sectors that received the
most Chinese ODI in terms of the number of deals are business service (1053 deals) and import and
export (539 deals). Thus, against popular perception, most of the Chinese ODI deals are not engaging
in raw material related projects, but rather, are involved in service sectors. For instance, in oil-rich
Nigeria, about two-thirds of the projects are actually in service sectors. In Figure 6, we divide the
countries in terms of the resource intensities of their exports. Following the IMF’s categorization for
oil exporters, non-oil resource intensive countries, and the rest of African economies, we can see that
regardless of the degree of raw material export intensity of the country, the majority of Chinese ODI
projects tend to be in the service sector.
4. Sectoral Distribution of Chinese Investments in Africa
Next we exploit the transaction-level data to study the distribution of Chinese ODI in Africa.
Specifically, we examine whether the distribution of Chinese ODI across countries and sectors is
related to various country and sector characteristics. For the country characteristics, we focus on the
levels of factor endowment and institutional development. We measure a country’s capital
abundance as the (log) capital endowment per worker, using data from the Penn World Tables. We
measure a country’s human capital abundance as the fraction of high-school graduates in the
workforce, using data from Barro and Lee (2014). Countries’ levels of institutional development are
measured by rule of law and political stability, as discussed in Section 2 above.
10For the sector characteristics, we explore the varying factor intensity of production across sectors.
We measure labor intensity of a sector as the ratio of total wage bill to value added of all firms in the
sector, following Romalis (2004). Capital intensity is defined as one minus labor intensity. Skill
intensity is defined as the share of non-production workers in the employment of the sector,
multiplied by its labor intensity. To construct these measures, we use industry-level data from the
database put together jointly by the National Bureau of Economic Research and the U.S. Census
Bureau's Center for Economic Studies (CES).7 Because of the lack of the required data to construct
factor intensity measures for service sectors, we exclude them in the baseline analysis, and include
them only at the later part of the analysis when we examine the determinants of Chinese ODI
specialization in services.8 As such, our baseline analysis focuses on explaining the distribution of
Chinese manufacturing ODI in Africa. Despite the prevalence of Chinese ODI projects in services in the
continent, such analysis is still important as it can shed light on the low level of industrialization in the
continent.
Without information on the value of each ODI deal, we explore the determinants of the
investment pattern by using two dependent variables in the following regression analyses: (1) a
dummy variable to indicate whether there was any ODI within a sector-country during the sample
period (the extensive margin); and (2) the (log) number of ODI deals at the sector-country level (the
intensive margin). In Table 4, we regress either of these two variables on country fixed effects and the
interaction between a country’s capital (human capital) endowment and a sector’s capital (skill)
intensity. In columns (1)-(3), we use the ODI dummy as the dependent variable and estimate the
specification using a Probit model. We find a negative and significant coefficient on the stand-alone
7
The idea of using the same measures of factor intensity based on U.S. firms for other countries is originally proposed by
Rajan and Zingales (1998).
8
Even if we have the same set of data for service firms in the U.S., it is not clear whether we can apply the Cobb-Douglas
production functional form to measure factor intensity of a sector.
11term of the sector’s skill intensity, but a positive and significant coefficient on the interaction
between a country’s skill endowment and a sector’s skill intensity. These results suggest that while
Chinese firms are less likely to invest in skill-intensive sectors in Africa on average, they are more
likely to do so in the relatively more skill-abundant countries. In other words, African nations that are
relatively more successful in investing in human capital tend to attract more Chinese ODI in the skill-
intensive sectors. We also find a negative coefficient on the interaction between a country’s capital
endowment and a sector’s capital intensity, but it is not statistically significant.
In columns (4) to (6), we use the (log) number of ODI deals at the sector-country level as the
dependent variable. We add 1 to the number of deals in order to include sector-countries with zero
ODI deals in the regression sample. To tackle the resulting estimation bias due to sample censoring at
zero, we estimate the specification using a Tobit model. We find a positive and significant coefficient
on the interaction between a country’s skill endowment and a sector’s skill intensity, after controlling
for country fixed effects. These results suggest that while Chinese ODI tends to be concentrated in
low-skill intensive sectors in Africa on average, it is biased toward the more skill-intensive sectors in
skill-abundant countries. Together with the results about the extensive margin of Chinese ODI, this
finding suggests that Chinese firms tend to exploit the local comparative advantage of the host
country when investing abroad.
Interestingly, we find that Chinese firms are less likely to invest in capital-intensive sectors in the
more capital-abundant host countries. While this result appears to contradict the predictions based
on the Heckscher-Ohlin theory, it is consistent with the idea that Chinese ODI serves as a source of
external financing to the continent, especially in the capital-scarce host countries. To the extent that
capital is more mobile than labor, the opposing signs on the two interaction terms actually offer a
coherent portrait of the main hypothesis of this paper -- Chinese investors are largely profit-driven
and are responsive to market conditions, just like investors from other countries.
12We have shown in Table 1 that Chinese ODI is attracted to African countries that are politically
stable. What extra lessons can we learn from a sector-level analysis? To this end, we split our sample
into two subsamples based on whether a country has rule of law that is above or below the
continent’s median. Similarly, we also split the sample into two based on whether a country is above
or below the median value of political stability. We then use the two subsamples to repeat the
analysis of Table 4.
Table 5 reports the regression results. In columns (1)-(4), we examine the probability of Chinese
ODI across sectors and countries. Supporting the conclusions of the cross-country analysis, we find
that host countries’ levels of rule of law do not seem to matter for Chinese firms’ investments in
Africa; however, political stability is crucial. In particular, we find that the results reported in the
previous table about how Chinese firms respond to market conditions are mostly observed for the
group of politically unstable nations (column (3)). A potential explanation is that in politically unstable
business environments, investment is risky but the expected return could be high. Facing a risky
investment environment, investors need to be more cautious when choosing projects to invest. Such
investment incentives imply that investors will be more motivated to exploit the host country’s
comparative advantage. The finding that Chinese ODI deals are more concentrated in skill-intensive
sectors in the more skill-abundant countries, especially in politically unstable countries, confirms this
hypothesis. For the same reason, investors should be driven to seek projects that promise a higher
return in a riskier environment. Such hypothesis is confirmed by the positive coefficient on the
interaction between a country’s capital abundance and a sector’s capital intensity, as reported in
column (3), when the sample of below-median rule-of-law countries is used. In other words, Chinese
ODI is concentrated in the more capital-intensive sectors in countries that are both politically
unstable and scarce in capital. No such pattern is found for the more politically stable countries.
13By using the (log) number of deals as the dependent variable, we find evidence confirming the
same pattern of Chinese ODI at the extensive margin. The last four columns of Table 5 report these
regression results based on a Tobit model. Not only do we find that Chinese investors are more
responsive to market conditions in politically unstable countries, we also observe the same pattern in
countries that have worse rule of law.
So far our sector-level analysis is restricted to manufacturing sectors, due to the data limitation
on measuring sectors’ factor intensities. In Table 6, we extend our analysis to the entire sample that
covers both manufacturing and service sectors. We have already shown the prevalence of service
sectors in Chinese ODI in Table 3. We now examine whether and how this concentration of Chinese
ODI in services in Africa is related to the host country’s economic fundamentals. To this end, we
repeat the analysis of Table 4, but instead of including the interactions between a country’s factor
endowment and a sector’s factor intensity as our regressors of interest, as there is no factor intensity
measures for service sectors, we use the interactions between a country’s factor endowment and the
service-sector dummy. The regression results are reported in Table 6. Panel A reports results when
the ODI dummy is used as the dependent variable while Panel B reports those when the number of
(log) ODI deals is used. As reported in Panel A, we find a positive and marginally significant coefficient
on the service dummy after controlling for country fixed effects. This finding is consistent with our
earlier point about the predominance of service ODI from China in Africa. A country’s economic
fundamentals (capital, human capital, and natural resource abundance) do not appear to have any
additional effects on the probability of Chinese ODI in service sectors. However, when we split the
sample into two subsamples along the median value of the country’s rule of law, we find that Chinese
firms are more likely to invest in services in the resource-rich countries that also have a low level of
rule of law. The finding could be related to our cross-country results that while direct investment
14from advanced countries in the region tends to be concentrated in countries with a high level of rule
of law, Chinese investors, on the other hand, are not discriminatory in this regard.
The findings that Chinese firms are more likely to invest in services in the resource-rich but
institutionally poor countries cannot be explained by the standard factor proportions theory, as we
have used to explain the high skill intensity of Chinese ODI in skill-abundant countries. That said, such
pattern is consistent with many anecdotes about the co-location of mining and service ODI from
China. When Chinese firms and its government invest in mining projects in Africa, they often induce
different kinds of service FDI to facilitate not only mining (e.g., construction), but also to meet the
demand of Chinese workers and businessmen who work in the region (e.g., wholesale-retail
businesses, hotels and restaurants, etc.). The fact that business services, wholesale and retail, and
import-export are among the top three service sectors in terms of Chinese ODI may well be related to
that reason.
In Panel B of Table 7, we further examine the relation between the host countries’ economic
fundamentals and the specialization of Chinese ODI in services, using a Tobit model and
log(1+number of deals) as the dependent variable. We find confirming evidence that Chinese ODI is
more prevalent in services than in manufacturing on average, regardless of the host country’s
economic fundamentals. That said, when we split the sample into two subsamples along the median
value of the countries’ rule of law, once again we find that for countries with a low level of rule of
law, their human capital and natural resource endowments are both positively related to the number
of Chinese ODI deals in service sectors. There is no such pattern when we split countries based on
their levels of political stability. To the best of our knowledge, this mining-induced ODI in services in
Africa has not been empirically examined before, despite the recent phenomenon of increasing
servicification in the continent. Further research along this line is warranted to understand the
continent’s progress in industrialization.
155. Concluding Remarks
Our analysis provides a nuanced view of China’s direct investment into Africa. First, using
aggregate data on China’s direct investment in each African country, we debunk a number of popular
myths about China’s activity on the continent. According to the most recent data, China accounts for
about 3% of the stock of direct investment in Africa. No doubt that figure is growing rapidly, but still
China’s investment is relatively small. Chinese investment is attracted to natural resource wealth, but
no more so than Western investment. A final point about the allocation of Chinese investment
overall is that it is indifferent to the recipient countries’ property rights/rule of law, whereas Western
investment tends to stay away from the poor governance environments. Since Chinese investment is
equally distributed between good and poor governance environments, whereas Western investment
is concentrated in the former, the share of Chinese investment in the poor governance environments
tends to be high.
The aggregate data is naturally influenced to a large extent by some very large deals, which tend
to involve state-enterprise investment in natural resource projects. The second main contribution of
our paper is to use MOFCOM’s database on all Chinese firms that invested in Africa between 1998
and 2012. We argue that this database gives a more accurate picture of what small- and medium-
sized private Chinese firms are doing in Africa. In this database relatively few investments are in the
natural resource sectors. Service sector investments dominate, and there are a significant number of
investments in manufacturing as well. These investments are spread throughout the continent.
Using the unique firms’ transaction-level ODI data, we examine how Chinese ODI is distributed
according to the recipient countries’ and sector characteristics. We find that Chinese ODI is attracted
to politically stable countries, but not necessarily those with good rule of law, consistent with what
we found in the aggregate data. We also find evidence that Chinese ODI is profit-driven, just like
16investors from other countries. Specifically, our cross-sector regressions show that Chinese firms
invest in the more skill-intensive sectors in skill-abundant countries, but the less capital-intensive
sectors in capital-abundant countries. These patterns are mostly observed in politically unstable
countries, suggesting stronger incentives to maximize profits in tougher environments. Finally, the
predominance of Chinese ODI in services appears to be related to host countries’ natural resource
abundance, which is also consistent with the profit-driven nature of Chinese ODI.
17References
Antkiewicz, Agata and John Whalley. 2007. Recent Chinese Buyout Activity and the Implications for Wider
Global Investment Rules. Canadian Public Policy, 33(2):207–26
Barro, Robert and Jong-Wha Lee. 2010. A New Data Set of Educational Attainment in the World, 1950-2010.
Journal of Development Economics, 104, pp.184-198
Bartelsman, Eric, Randy A. Becker, and Wayne B. Gray. 2000. NBER-CES manufacturing industry database.
National Bureau of Economic Research (NBER) and U.S. Census Bureau's Center for Economic Studies (CES)
Buckley, Peter, L. Jeremy Clegg, Adam Cross, Xin Liu, Hinrich Voss, and Ping Zheng. 2007. The Determinants of
Chinese Outward Foreign Direct Investment. Journal of International Business Studies, 38(4):499–518
Cai, Kevin. 1999. Outward Foreign Direct Investment: A Novel Dimension of China’s Integration into the
Regional and Global Economy. China Quarterly, 160: 856–80
Caves, Richard. 1971. International Corporations: The Industrial Economics of Foreign Investment. Economica,
38(149):1–27.
Chen, Wenjie and Heiwai Tang. 2014. The Dragon is Flying West: Micro-level Evidence of Chinese Outward
Direct Investment, Asian Development Review, vol. 31 no. 2, pp. 109-140.
Cheng, Leonard, and Zihui Ma. 2007. China’s Outward FDI: Past and Future. In China’s Growing Role in World
Trade, edited by Robert Feenstra and Shangjin Wei. Chicago: University of Chicago Press
Cheung, Yin-Wong, and Xinwang Qian. 2009. Empirics of China’s Outward Direct Investment. Pacific Economic
Review, 14(3):312–41.
Child, John, and Rodrigues, Suzana. 2005. The Internationalization of Chinese Firms: A Case for Theoretical
Extension? Management and Organization Review, 1(3):381–410.
China in Africa: investment or exploitation? 2014. Al Jazeera. Accessed May 8, 2015.
http://www.aljazeera.com/programmes/insidestory/2014/05/china-africa-investment-exploitation-
201454154158396626.html
Deng, Ping. 2003. Foreign Direct Investment by Transnationals from Emerging Countries: The Case of China.
Journal of Leadership and Organizational Studies, 10(2):113–24.
Dollar, David. 2015. “United States-China Two-way Direct Investment: Opportunities and Challenges,” John L.
Thornton China Center Working Paper, Brookings Institution.
French, Howard W. 2014. Into Africa: China’s Wild Rush. New York Times. Accessed May 8, 2015.
http://www.nytimes.com/2014/05/17/opinion/into-africa-chinas-wild-rush.html?_r=0
Hymer, Stephen H. 1976. The International Operations of National Firms: A Study of Direct Foreign Investment.
Cambridge, Mass.: MIT Press
18Kindleberger, Charles. 1969. American Business Abroad: Six Lectures on Direct Investment. New Haven,
Connecticut: Yale University Press
Kindleberger, Charles, ed. 1970. The International Corporation: A Symposium. Cambridge, Mass.: MIT Press
Lane , Philip R. and Gian Maria Milesi-Ferretti. 2007. The external wealth of nations mark II: Revised and
extended estimates of foreign assets and liabilities, 1970–2004. Journal of International Economics, 73,
November, 223-250.
Luo, Yadong, Hongxin Zhao, Yagang Wang, and Youmin Xi. 2011. Venturing Abroad by Emerging Market
Enterprises: A Test of Dual Strategic Intents. Management International Review, 51(4):433–59.
Makino, Shige, Lau Chung-Ming, and Yeh Rhy-Song. 2002. Asset-exploitation versus Asset Seeking: Implications
for Location Choice of Foreign Direct Investment from Newly Industrialized Economies. Journal of International
Business Studies, 33(3):403–21.
Mathews, John. 2006. Dragon Multinationals: New Players in 21st Century Globalization. Asia Pacific Journal of
Management, 23(1):5–27.
Ministry of Commerce of China and National. 2012. Statistical Bulletin of China’s Outward Foreign Direct
Investment, Beijing: China Statistics Press
Quinn, Andrew and Mark Heinrich. 2011. Clinton warns against "new colonialism" in Africa. Reuters. Accessed
April 10, 2015. http://www.reuters.com/article/2011/06/11/us-clinton-africa-idUSTRE75A0RI20110611
Rajan, R. and L. Zingales 1998. Financial Dependence and Growth. American Economic Review 88, p.559-86.
Romalis, John 2004. Factor Proportions and the Structure of Commodity Trade. American Economic Review,
Vol. 94, No. 1, pp. 67-97.
Rui, Huaichuan, and George Yip. 2008. Foreign Acquisitions by Chinese Firms: A Strategic Intent Perspective.
Journal of World Business, 43(2):213–27.
Wu, Hsiu-Ling, and Chien-Hsun Chen. 2001. An Assessment of Outward Foreign Direct Investment from China’s
Transitional Economy. Europe-Asia Studies, 53(8):1235–54.
Sanusi, Lamido. 2013. Africa must get real about Chinese ties. Accessed April 12, 2015.
http://www.ft.com/cms/s/0/562692b0-898c-11e2-ad3f-00144feabdc0.html#axzz3ZaBFDod4
1920
21
Figure 5. Number of Deals by Country

Source: MOFCOM and authors’ calculations.

                                            22
Figure 6. Distribution of Chinese ODI Projects by Country
450
400
manufacturing services raw material
350
300
250
200
150
100
50
0
Oil Exporters Non-oil resrouce intensive countries Rest of African countries
Source: MOFCOM and authors’ calculations.
23Table 1. Allocation of FDI and Chinese ODI among African Countries
Specification (1) (2) (3) (4) (5)
Dependent Variable FDI Chinese ODI Chinese ODI Chinese ODI Chinese ODI
Number of Countries 49 49 49 49 49
PPP GDP(ln) .74 .97 1.00 .99 .24
(9.24) (5.59) (5.65) (5.45) (0.76)
Natural Resource 0.028 0.036 0.030 0.037 0.052
Rents/GDP (3.59) (2.21) (1.71) (2.23) (3.20)
Rule of Law .64 -- -.55 -- --
(2.36) (0.37)
Political Stability -- -- -- .15 0.72
(0.42) (1.81)
Population (ln) -- -- -- -- 1.05
(2.82)
R-squared 0.75 0.49 0.50 0.49 0.57
Note: t-statistics in parentheses
24Table 2. Top 20 Destination Countries
Country Number of projects Number of firms
Nigeria 404 240
South Africa 280 152
Zambia 273 125
Ethiopia 255 114
Egypt 197 99
Congo (DRC) 193 80
Ghana 192 90
Angola 189 80
Zimbabwe 167 68
Tanzania 149 85
Sudan 148 78
Kenya 137 71
Algeria 123 75
Mozambique 94 41
Uganda 89 45
Gabon 71 23
Mali 68 33
Namibia 66 30
Mauritius 65 40
Cameroon 60 28
Source: China’s Ministry of Commerce Transaction-level ODI Data.
25Table 3. Sector Distribution
Sector ID Sector Description Nb of Deals
Agricultural and Manufacturing
4 mineral products 319
14 base metals and articles of base metal 148
12 articles of stone, plaster, cement, etc. 96
15 machinery and mechanical appliances; electrical equipment; parts thereof. 76
10 textiles and textile articles 75
2 vegetable products 72
3 prepared foodstuffs; beverages, spirits and vinegar; tobacco 64
11 footwear, headgear, umbrellas, etc. 54
5 products of the chemical or allied industries 45
13 other manufacturing 45
1 live animals; animal products 41
16 vehicles, aircraft, vessels and associated transport equipment 40
8 wood and articles of wood. 35
6 plastics and articles thereof; rubber and articles thereof 22
17 miscellaneous manufactured articles 17
9 pulp of wood or of other fibrous cellulosic material 15
7 raw hides and skins, leather, etc. 9
Service
21 business service 1053
20 wholesale and retail 693
24 import and export 539
18 construction, transportation, storage and postal services 392
22 finance 68
19 information transmission, computer services and software 14
23 social service 12
Mining
25 petroleum, water and electricity production and supply 45
Source: China’s Ministry of Commerce Transaction-level ODI Data (1998-2012).
26Table 4. The Effects of Host Countries' Factor Endowment
Dep var ODI dummy ln(nb deals + 1)
(1) (2) (3) (4) (5) (6)
ln(K/L) x k -1.166 -1.281 -1.553*** -1.671***
(-1.590) (-1.449) (-3.235) (-2.613)
capital intensity (k) 16.84** 17.23* 21.30*** 22.01***
(2.105) (1.747) (3.890) (2.984)
ln(H/L) x s 0.358 0.230 0.367* 0.167
(1.185) (0.838) (1.829) (1.010)
skill intensity (s) -16.29*** -9.042* -16.42*** -6.400*
(-3.608) (-1.862) (-4.628) (-1.847)
Country FE Y Y Y Y Y Y
N 704 560 528 704 560 528
ll -304 -266 -338 -588 -494 -454
R-squared 0.313 0.294 0.328 0.252 0.199 0.225
t statistics in parentheses; * pTable 5. Differential Factor Endowment Effects Depending on Countries' Political Environment
Dep var ODI dummy ln(nb deals + 1)
(1) (2) (3) (4) (5) (6) (7) (8)
Rule of Law Political Stability Rule of Law Political Stability
Low High Low High Low High Low High
ln(K/L) x k -1.128 -0.320 -1.547* 1.316 -0.618** 0.369 -1.306*** 1.028**
(-0.745) (-0.238) (-1.904) (0.593) (-2.487) (0.951) (-7.759) (2.491)
ln(H/L) x s 0.230 0.0598 2.044** 0.224 -0.362 0.199 1.025*** -0.112
(0.248) (0.177) (2.309) (0.743) (-0.491) (0.933) (3.424) (-0.507)
capital intensity (k) 17.17 4.956 21.61** -11.74 8.753*** -3.252 15.04*** -10.47**
(1.118) (0.310) (2.471) (-0.480) (3.320) (-0.680) (8.772) (-2.214)
skill intensity (s) -10.40 -4.724 -22.59** -14.73** -11.53** -8.837* -16.86*** -4.329
(-1.414) (-0.612) (-2.439) (-2.444) (-2.089) (-1.776) (-4.394) (-1.215)
Country FE Y Y Y Y Y Y Y Y
N 256 272 256 272 256 272 256 272
ll -116 -120 -114 -119 -232 -297 -217 -274
R-square 0.315 0.352 0.328 0.356 0.133 0.060 0.198 0.126
Notes: t statistics in parentheses. * pTable 6. Specialization in Service Sectors
Panel A Dep var = ODI dummy
(1) (2) (3) (4) (5)
Sample All Rule of Law Political Stability
Low High Low High
Service Dummy 1.862** 1.170 2.069* 0.950 2.905
(0.888) (1.342) (1.113) (1.213) (2.490)
ln(K/L) x Service -0.120 -0.137 -0.103 -0.0420 -0.227
(0.097) (0.142) (0.115) (0.100) (0.284)
ln(H/L) x Service 0.0106 0.0471 -0.00383 -0.00243 0.0153
(0.017) (0.031) (0.017) (0.031) (0.027)
ln(M/L) x Service 0.0214 0.200** -0.0257 0.106 0.0302
(0.063) (0.095) (0.082) (0.100) (0.105)
Country FE Y Y Y Y Y
N 800 400 400 400 400
ll -421 -222 -198 -214 -207
R-sq 0.2361 0.19 0.2855 0.2191 0.253
Panel B Dep Var = ln(nb deals + 1)
(1) (2) (3) (4) (5)
Sample All Rule of Law Political Stability
Low High Low High
Service Dummy 2.201*** 0.483 2.060 1.368 1.760
(0.709) (0.857) (1.264) (0.883) (1.493)
ln(K/L) x Service -0.0589 0.0157 -0.0416 0.00764 -0.0159
(0.074) (0.081) (0.120) (0.080) (0.167)
ln(H/L) x Service 0.00124 0.0442** 0.000244 -0.0196 0.00168
(0.008) (0.018) (0.007) (0.024) (0.014)
ln(M/L) x Service -0.0549* 0.177*** -0.0740** 0.0806 -0.0722
(0.031) (0.053) (0.030) (0.088) (0.056)
Country FE Y Y Y Y Y
N 800 400 400 400 400
ll -851 -428 -430 -417 -440
R-sq 0.176 0.147 0.1893 0.168 0.1718
Notes: t statistics in parentheses. * pAppendix
Table A1: Summary Statistics
10% 25% 50% 75% 90% mean nb of obs
Sector Level
Capital intensity 0.59 0.63 0.66 0.70 0.79 0.68 22
Skill intensity (btw 0 and 1) 0.06 0.07 0.09 0.11 0.12 0.09 22
Country Level
Rule of law (btw 0 and 1) 0.08 0.22 0.36 0.54 0.68 0.39 47
Political stability (btw 0 and 1) 0.14 0.30 0.54 0.72 0.90 0.52 47
% of secondary sch complete 3.38 6.02 12.13 16.53 26.38 13.42 35
ln(capital per worker) 9.06 9.73 10.61 11.36 12.49 10.66 44
30You can also read