AUSTRALIA'S PLACE IN THE GLOBAL ECONOMY - TIM RILEY HSC ECONOMICS DAY UNIVERSITY OF WOLLONGONG
←
→
Page content transcription
If your browser does not render page correctly, please read the page content below
AUSTRALIA’S PLACE IN THE

   GLOBAL ECONOMY

              TIM RILEY
                  Director

       Economic Literacy Centre
                 and
     Tim Riley Publications Pty Ltd

        HSC ECONOMICS DAY

   UNIVERSITY OF WOLLONGONG

      Tuesday September 3rd 2019

    Australiaʼs Place in the Global Economy
                        1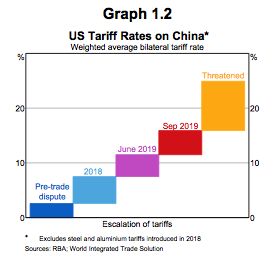
The Link Between Internationalisation and Globalisation

In the 1980s Australia became more internationalised and integrated with the global
economy through a series of government policy induced changes. These changes
were designed to increase Australia’s trade share of GDP and to modernise the
economy by making it more open to international trade and internationally
competitive:
•     In 1983 the Australian financial system was deregulated and the exchange rate
      was floated. Financial deregulation led to much greater accessibility of
      Australian firms to world capital markets and reduced the cost of exporting,
      although it also increased the volatility of the exchange rate, because of
      changes in Australia’s international trade and economic performance.
•     In the 1980s, 1990s and 2000s the Australian government reduced the levels of
      protection of Australian industry through cuts to tariffs, subsidies, local
      content schemes and quotas. This encouraged Australian manufacturers to
      export to the world market.
•     Globally, the Australian government participated in international trade
      forums such as the Cairns Group of countries to secure better market access
      for Australian agricultural exports. In the World Trade Organisation (WTO)
      the USA and EU agreed to cut their agricultural subsidies after the Uruguay
      Round of GATT was completed in 1994. In the Asia Pacific Economic
      Co-operation (APEC) forum, Australia played an important role in
      negotiations with member countries who agreed to reduce their trade
      barriers by 2020 through the signing of the Bogor Declaration by APEC
      members in 1994 in Bogor, Indonesia.
Major market induced changes also occurred in the 1990s with a more integrated
global economy based on increasing economic integration between countries
through greater trade liberalisation leading to rapid globalisation This was also
underpinned by new information and communications technologies (ICT) and the
increasing conduct of electronic commerce.
In the 2000s the global resources boom and China’s increasing demand for resources
greatly influenced Australia’s trade pattern, its terms of trade and the exchange rate.
The Australian government also negotiated bilateral trade agreements with the
USA, ASEAN, Korea, Japan and China to strengthen trade relationships and signed
the regional Trans Pacific Partnership Agreement (TPP) in 2015.
Trends in the Value and Composition of Australia’s Trade Pattern
The Australian economy has become more internationalised over time, with exports
and imports of goods as a percentage of GDP (i.e. the level of trade intensity) rising
from 12% of GDP in the mid 1980s to 21% of GDP by 2017-18. The total value of
exports of goods was $315,031m in 2017-18. The value of goods exports was 7.8%
higher in 2017-18 than in 2016-17 mainly due to a 12% increase in the value of mining
exports from $178,978m to $200,358m as commodity prices recovered in the second
half of 2017. The value of rural exports in 2017-18 rose by only 1% to $47,075m
because of drought. The total value of imports of goods in 2017-18 was -$302,901m
consisting of consumption, capital and intermediate goods as shown in Table 1.
Australia recorded a large surplus in the goods balance of $12,130m in 2017-18 as the
                      Australiaʼs Place in the Global Economy
                                          2
Table 1: Exports of Goods and Services 2017-18
Exports of Goods $315,031m Imports of Goods -$302,901m
Rural Goods $47,075m Consumption Goods -$102,435m
Non Rural Goods $247,637m Capital Goods -$73,823m
Other Goods $20,319m Intermediate Goods -$126,643m
Goods Balance $12,130m surplus
Exports of Services $85,635m Imports of Services -$91,546m
Net Services -$5,911m deficit
Total Exports $400,666m Total Imports -$394,447m
Goods and Services Balance $6,219m surplus
Source: ABS (2018), Balance of Payments and International Investment Position,
Catalogue 5302.0, June. Tables 6-9
total value of exports ($315,031m) exceeded the total value of imports (-$302,901m).
Rural exports were 14.9% of total exports of goods in 2017-18 and mining exports
were 63.6% of total goods exports in 2017-18 due to higher commodity prices for
coal and iron ore. Manufactured exports were 21.5% of total goods exports in 2017-
18. Australia has a diverse export base of rural, mining and manufactured goods in
its trade pattern, helping to sustain export income for the Australian economy.
Another feature of Australia’s trade is the strong recovery in service exports
between 2012 and 2018. In 2017-18 Australia exported services worth $85,635m, an
increase of $12,173m or 16.6%, from 2016-17. Service exports grew between 2012-13
and 2017-18 due to stronger global growth and the impact of a lower exchange rate
increasing competitiveness. Service exports include freight, transport, travel,
tourism, education, communications, finance, business and insurance.
Imports of services grew strongly in 2017-18 by $16,430m to -$91,546m as domestic
growth strengthened to nearly 3%, increasing the demand for imports. Service
imports include freight, travel, tourism, education, communications, transport and
business. The net services deficit rose from -$1,654m in 2016-17 to -$5,911m in 2017-
18 as service exports (16.6%) grew by less than service imports (21.9%).
The total value of exports of goods and services in 2017-18 was $400,666m,
consisting of $315,031m of goods and $85,635m of services. The composition of
Australia’s exports of goods and services in 2017-18 is shown in Figure 1. Rural
exports were 11.7% of the total, with mining’s share a massive 50%, manufacturing’s
share at 16.9%, and the services share at 21.4% of the total.
Australia imports consumption (e.g. food, beverages, clothing, footwear and cars),
capital (e.g. machinery, industrial and transport equipment and computers) and
intermediate goods (e.g. parts, fuels, chemicals, textiles, plastics and paper) used in
Australiaʼs Place in the Global Economy
3Figure 1: Australia's Exports in 2017-18
Rural 11.7%
Mining 50%
Manufacturing 16.9%
A B C D
1 Services 21.4%
Rural Mining Manufacturing Services
2 11.7 50 16.9 21.4
Source: ABS (2018), Balance of Payments
and International Investment Position,
Catalogue 5302.0, June. Tables 6-9
the production of other goods. The total value of imports of goods and services was
-$394,447m in 2017-18 (-$302,901m of goods and -$91,546m of services).
The composition of Australia’s imports of goods and services in 2017-18 is shown in
Figure 2. Consumer goods were 26% of the total, with intermediate goods at 32.1%,
capital goods at 18.7% and services at 23.2%. Australia’s imports of capital goods
surged during the mining investment boom as Australia relies on imported capital
goods to mine, excavate and transport minerals, coal and iron ore to ports for
export to world markets, particularly to Asian countries such as China, Japan, Korea
and ASEAN.
Australia recorded a surplus in goods and services of $6,219m in 2017-18 because the
value of exports of goods and services ($400,666m) exceeded the value of imports of
goods and services (-$394,447m).
Figure 2: Australia's Imports 2017-18
Consumption Goods 26%
Intermediate Goods 32.1%
Capital Goods 18.7%
A B C Services 23.2%
D
1 Consumption Goods Intermediate Goods Capital Goods Services
2 26 32.1 18.7 23.2
Source: ABS (2018), Balance of Payments
and International Investment Position,
Catalogue 5302.0, June. Tables 6-9
Australiaʼs Place in the Global Economy
4Trends in the Direction of Australia’s Trade Pattern
Asian countries accounted for 77.4% of exports in 2017-18 (China 33.5%, Japan 15.3%,
ASEAN 10.4%, Korea 6.6%, India 5.1%, Hong Kong 3.6% and Taiwan 2.9%). The
Pacific Rim countries of the USA (3.7%) and New Zealand (2.9%) accounted for 6.6%
of Australian exports in 2017-18. Together Asian and Pacific Rim countries
accounted for 84% of Australian exports in 2017-18, with the EU accounting for a
further 5.6% of exports.
China is Australia’s number one export market with 33.5% of total exports in 2017-
18, having surpassed Japan (15.3% of total exports) in 2009-10. In third position as an
export market in 2017-18 was the Association of South East Asian Nations (ASEAN),
with a 10.4% share of Australia’s exports. Korea (6.6%), India (5.1%), the USA (3.7%),
Hong Kong (3.6%) and Taiwan (2.9%) were also key export markets in 2017-18. In
terms of trade groupings total Australian merchandise exports in 2017-18 went to
APEC countries (80.5%), ASEAN (10.4%), developing countries (68.5%), least
developed countries (0.9%), the European Union (5.6%) and the OECD (35.9%). Of
these groups, APEC, developing countries and the OECD were the major export
markets.
Figure 3 shows the major destinations for Australia’s exports in 2017-18 according to
major region or country:
• North East Asia includes China, Japan, Korea, Taiwan and Hong Kong, which
accounted for 61.9% of exports in 2017-18. This is largely due to the
recommendations of the Garnaut Report (1989), Australia and the NE Asian
Ascendancy, which the Hawke government implemented. For example,
China’s export share rose from 14.9% in 2007-08 to 33.5% in 2017-18 because
of its large demand for Australian mineral and agricultural resources.
• A further 10.4% of exports went to the ten ASEAN countries; 5.6% to the EU,
5.1% to India, 3.7% to the USA; and 13.3% to other markets in Asia, Europe,
the Middle East, South America, Africa and the Pacific.
Figure 3: Australian Export Markets in 2017-18
NE Asia 61.9%
ASEAN 10.4%
EU 5.6%
A B C D E F
India 5.1%
1 NE Asia ASEAN EU India USA Other
2 USA 3.7%
61.9 10.4 5.6 5.1 3.7 13.3
Other 13.3%
Source: ABS (2018), International
Trade in Goods and Services,
Catalogue 5368.0, June. Table 14a
Australiaʼs Place in the Global Economy
5Table 2: Merchandise Trade Shares by Selected Countries and Country Groups 2017-18
Annual Australian Exports (% of total) Annual Australian Imports (% of total)
ASEAN 10.4 ASEAN 15.7
China 33.5 China 22.5
European Union 5.6 European Union 17.9
Hong Kong 3.6 Hong Kong 0.2
India 5.1 Japan 7.3
Japan 15.3 New Zealand 2.6
Republic of Korea 6.6 Republic of Korea 7.2
Taiwan 2.9 Taiwan 1.4
United States of America 3.7 United States of America 9.9
Source: ABS (2018), International Trade in Goods and Services, Catalogue 5368.0, June.
Tables 14a and 14b
In terms of imports, China (22.5%), the European Union (17.9%) and ASEAN (15.7%)
were the most important sources of Australian imports in 2017-18 as shown in Table
2. Singapore, Thailand, Malaysia and Indonesia were the most important export
markets and sources of imports in ASEAN for Australia in 2017-18.
Within the EU, Britain, Italy, Germany, Holland and France had the highest trade
shares for both exports and imports in 2017-18. Next in importance as sources of
Australian imports in 2017-18 were the USA (9.9%), Japan (7.3%) and Korea (7.2%).
Figure 4 shows the major sources of Australian imports in 2017-18 by region or
major country. North East Asia (38.6%), the EU (17.9%) and ASEAN (15.7%) were
the major sources of Australian imports in 2017-18. China (22.5%) was the single
most important country for imports, followed by the USA with 9.9% of imports.
China and the ASEAN countries are major sources of low cost Australian
manufactured imports. The USA and countries in the EU are major sources of
finished consumption goods and capital goods.
Figure 4: Sources of Australian Imports in 2017-18
NE Asia 38.6%
A B C D E F
EU 17.9%
1 NE Asia EU ASEAN USA New Zealand Other
ASEAN 15.7%
2 38.6 17.9 15.7 9.9 2.6 15.3
USA 9.9%
New Zealand 2.6%
Other 15.3%
Source: ABS (2018), International Trade
in Goods and Services, Catalogue
5368.0, June. Table 14b
Australiaʼs Place in the Global Economy
6The growth in Australia’s export and import merchandise trade over time has been
due to greater trade intensity (i.e. the ratio of exports and imports to GDP); trade
liberalisation within the Asia Pacific region under WTO, APEC, AANZFTA and TPP
agreements; and bilateral free trade agreements with Australia’s major trading
partners such as the USA, Singapore, Thailand, Korea, Japan and China.
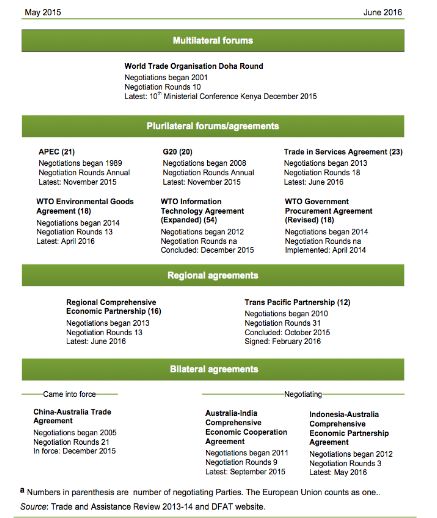
Figure 5 from the Productivity Commission (2017) lists the major recent
developments in Australian trade policy including multilateral, plurilateral, regional
and bilateral forums and agreements.
Figure 5: Recent Developments in Australia’s Trade Policy
Australiaʼs Place in the Global Economy
7US-China Trade Tensions
Since January 2018, a sequence of US tariff actions on solar panels, washing
machines, steel, aluminium and a range of Chinese products plus retaliation by
trading partners has complicated global trade relations. In June 2018 the USA
announced a 25% tariff on imports from China worth US$50b and China announced
retaliation on a similar scale. In September 2018 the USA imposed a 10% tariff on an
additional US$200b in imports from China. In response, China announced tariffs on
a further US$60b of US imports. Meanwhile the preliminary agreement between the
USA and Mexico on some bilateral trade issues has been a step forward. However
the future of the trilateral North American Free Trade Agreement (NAFTA) remains
uncertain as the United States and Canada work to resolve remaining issues.
Whilst the global economic outlook remains positive, conditions vary across
economies. In most advanced economies spare capacity is likely to diminish in 2019
as growth rates strengthen and unemployment rates continue to fall. Some labour
markets have tightened and there has been a slight rise in wages growth which will
help to underpin consumption spending. This is likely to lead to an increase in global
inflation and a gradual tightening of monetary policies. However trade tensions
between the USA and some of its major trading partners such as China, the EU,
Canada and Mexico will weigh on growth prospects for the global economy.
More US-China tariff measures came into effect in late 2018 and trade restrictions
appear to be having a negative effect on export orders for some economies. The
possibility of trade tensions escalating further would mean that other economies and
business investment decisions are affected. For example, in East Asia growth has
been moderate but could be adversely affected in 2019 because the region is
important in global supply chains. It is in the interest of all countries that make up
the world economy for the USA and China to resolve their trade differences
through negotiations rather than by imposing more protection on imports from
each other. Refer to the Appendix on pages 21-22 for the latest details.
Chinese growth forecasts for 2019 have been downgraded as the trade conflict with
the USA is expected to reduce Chinese export growth. The US government plans
further tariff rate increases if trade negotiations with China do not lead to a
resolution of the dispute. The US government has already re-negotiated the US-
Mexico-Canada trade agreement on more favourable terms to the USA. It is also
having trade discussions with Japan and the European Union to resolve policy
differences over trade matters.
With Trump dissatisfied with the lack of progress in trade negotiations between the
USA and China he announced a further increase in tariffs on $US200b worth of
Chinese goods on May 11th 2019. The increase in tariffs was from 10% to 25%
covering a wide range of Chinese imports such as pet food, mattresses, soldering
irons, chemicals, woven fabrics and bicycles. This would have the following effects:
• Further raising the price of Chinese imports to American consumers
• Raising the cost of imported intermediate goods for US businesses
• Creating further uncertainty over investment in trade
• Forcing some US businesses to shift their production to lower lower cost
countries such as Vietnam and Cambodia
• Disruption of regional supply chains
Australiaʼs Place in the Global Economy
8Figure 6: IMF Forecasts for Global Growth and Trade
Annual %∆
6 World Output
5 World Trade
4
3
2
1
0
2016 2017 2018 (f) 2019 (f)
The World Trade Organisation’s forecast for global trade is an expansion of 3.4% in
2019. This is down from 3.8% in 2018 and 5.4% in 2017 (see Figure 6) as US-China
trade tensions undermine world output, trade and investment prospects. These
forecasts are far below the average 7% annual growth in world trade in goods and
services achieved between 1987 and 2006 when globalisation led to faster average
growth in world trade compared to the growth in world output or GDP (average
3.7% per annum). Much of this growth in trade was driven by China and other
emerging Asian economies which pursued export oriented growth strategies.
However deep uncertainty about short term economic and policy developments
particularly in the USA, Britain and Euro Area with a rise in protectionist and anti-
immigration sentiment raise risks that this figure may not be achieved. The
unpredictable direction of the global economy in the near term and lack of clarity
about government action on monetary, fiscal and trade policies raises the risk that
trade activity will be stifled. A spike in inflation leading to higher interest rates,
tighter fiscal policies and the imposition of measures to curtail trade could all
undermine higher trade growth over the next two years. According to WTO
Director General, Roberto Azevedo:
"Weak international trade growth in the last few years largely reflects continuing
weakness in the global economy. Trade has the potential to strengthen global
growth if the movement of goods and supply of services across borders remains
largely unfettered. However, if policymakers attempt to address job losses at home
with severe restrictions on imports, trade cannot boost growth and may even
constitute a drag on the recovery. Although trade does cause some economic
dislocation in certain communities, its adverse effects should not be overstated - nor
should they obscure its benefits in terms of growth, development and job creation.
Trade is part of the solution to economic difficulties, not part of the problem. In fact,
innovation, automation and new technologies are responsible for roughly 80% of
the manufacturing jobs that have been lost and no one questions that technological
advances benefit most people most of the time. The answer is to pursue policies that
reap the benefits from trade, while also applying solutions to unemployment which
embrace education and training to help workers compete for the jobs of the future."
Australiaʼs Place in the Global Economy
9Australia’s Balance of Payments
The balance of payments is a record of all transactions between Australian residents
and the rest of the world. It consists of three main accounts:
1. The current account records items of a current nature such as exports,
imports, net primary income and net secondary income.
2. The capital account records items associated with foreign aid, migrants'
funds and workers' remittances.
3. The financial account records items that are long term in nature such as
portfolio and direct investment, financial derivatives, other investment, and
changes in the Reserve Assets held by the Reserve Bank of Australia.
The Australian Bureau of Statistics (ABS) classifies Australia's exports of goods into
the categories of rural goods (such as meat, cereals and wool), non rural goods (such
as mining and manufactured goods), and other goods including non monetary gold.
Australia exported goods to the value of $315,031m in 2017-18.
Australia imported goods in 2017-18 valued at -$302,901m. Since imports represent a
leakage out of the circular flow of income they are recorded as debits in the balance
of payments by the ABS and are given a negative sign. Imports of goods are
classified by the ABS in the following three categories:
1. Consumption goods include food, beverages, electrical and transport
equipment, textiles, clothing and shoes and other consumption goods.
2. Capital goods include machinery and industrial equipment, all data
processing (ADP) equipment and other capital goods.
3. Intermediate goods include parts, fuels, lubricants, plastics and paper used in
the production of other goods.
There was a large surplus in the goods balance of $12,130m in 2017-18 as shown in
Table 3. Exports and imports of services include freight, travel and tourism,
education and business services. The net services balance was deficit of -$5,911m in
2017-18. The goods and services balance is calculated by adding the goods balance to
the net services balance and this was a surplus of $6,219m in 2017-18.
Table 3: Australia’s Goods and Services Balance 2015-16 to 2017-18
2015-16 2016-17 2017-18
Goods Balance -$27,827m $13,819m $12,130m
Net Services -$9,071m -$1,654m -$5,911m
Goods and Services Balance -$36,898m $12,165m $6,219m
Source: ABS (2018), Balance of Payments and International Investment Position,
Catalogue 5302.0 June, Tables 6-7.
Australiaʼs Place in the Global Economy
10Net Primary and Secondary Income
Financial flows recorded in the current account of the balance of payments include
net primary income and net secondary income. Net primary income is calculated as
credits less debits of income received and paid, mainly due to the servicing cost of
direct, portfolio and other investment and includes dividends, interest and profits.
Australia has a large inflow of foreign investment and therefore the servicing cost of
these overseas borrowings in terms of income remitted overseas is larger than the
income received from Australian investment overseas.
Therefore Australia tends to have a large net primary income deficit in the current
account of the balance of payments. This deficit forms the underlying or structural
base of the current account deficit since Australia borrows foreign saving to finance
much of its domestic investment. This is especially the case in the mining industry
which has a very high level of foreign investment and foreign ownership.
In 2017-18 the net primary income deficit was -$59,064m and accounted for all of the
current account deficit of -$54,123m. Net secondary income is calculated as credits
less debits associated with government transfers such as foreign aid, the personal
transfers of migrants (such as pensions) and workers remittances of wages to their
families. In 2017-18 net secondary income was a small deficit of -$1,278m.
The Current Account Balance
The current account balance in 2017-18 was a deficit of -$54,123m which represented
-2.5% of GDP. This meant that the current account deficit was largely sustainable and
not a constraint to Australia's rate of domestic economic growth since the growth in
national income was sufficient to service the cost of foreign borrowings which is
represented by the size of the current account deficit measured as a percentage of
GDP. The main components of Australia's current account in 2017-18 are shown in
Table 4 and Figure 7.
The current account deficit tends to increase when domestic growth is higher than
world growth leading to increased imports and a trade deficit. This occurred in 2012-
13 at the height of the mining investment boom which led to large imports of capital
equipment.
Table 4: Australia's Current Account Deficit in 2017-18
Goods Credits $315,031m
Goods Debits -$302,901m
Goods Balance $12,130m
Net Services -$5,911m
Net Primary Income -$59,064m
Net Secondary Income -$1,278m
Balance on Current Account -$54,123m
Source: ABS (2018), Balance of Payments and International Investment Position,
Catalogue 5302.0 June, Tables 6-7.
Australiaʼs Place in the Global Economy
11Figure
A 7: Australia's CurrentBAccount C
$b 1
Current Account Balance Goods and Services Balance Net Primary Income
20000 2 -56979 -21025 -34034
Current Account Balance
10000 3 -72828 -36898 -34199
Goods and Services Balance
0 4 -29469 12165 -39811
Net Primary Income
-10000 5 -54123 6219 -59064
-20000
-30000
-40000
-50000
-60000
-70000
-80000
2014-15 2015-16 2016-17 2017-18
The current account deficit tends to decrease when world growth exceeds domestic
growth and strong export demand leads to higher export earnings and a trade
surplus as in 2016-17 and 2017-18 when there was a large goods and services surplus.
Australia's Financial Flows
Australia's financial flows primarily refer to Australian debt and equity borrowings
from foreign residents. Financial flows are associated with direct and portfolio
investment flows, financial derivatives, other investment (such as loans) and changes
in the Reserve Assets of the Reserve Bank of Australia. Financial flows are recorded
in the capital account and the financial account of the balance of payments. They are
also recorded by the ABS as changes in the stock of net foreign debt and equity.
The capital account records credits and debits for the acquisition and disposal of non
produced and non financial assets such as net capital transfers of foreign aid and net
capital brought into Australia by migrants. The capital account balance is usually a
small deficit and in 2017-18 it was -$689m.
The financial account records credits and debits for transactions associated with
direct and portfolio investment, financial derivatives, other investment (such as
loans) and changes in the value of Reserve Assets held by the Reserve Bank of
Australia through its foreign currency dealings and its holdings of Special Drawing
Rights (SDRs) with IMF.
Since Australia records persistent deficits in the current account they must be
financed by recording surpluses in the financial account. Under a floating or flexible
exchange rate system, the sum of the current account balance and the capital and
financial account balance must equal zero. In other words the current account deficit
is financed by a financial account surplus. In 2017-18 Australia recorded a financial
account surplus of $52,802m and a deficit in the capital account of -$689m. This
resulted in a surplus balance on the capital and financial account of $52,113m.
Australiaʼs Place in the Global Economy
12Table 5: Australia's Capital and Financial Account Balance in 2017-18
Capital Account -$689m
Financial Account $52,802m
- Direct Investment $59,555m
- Portfolio Investment $9,308m
- Financial Derivatives -$8,446m
- Other Investment -$16,544m
- Reserve Assets $8,929m
Balance on Financial Account $52,802m
Balance on Capital and Financial Account $52,113m
Net Errors and Omissions $2,010m
Source: ABS (2018), Balance of Payments and International Investment Position,
Catalogue 5302.0 June, Tables 6-7.
Net errors and omissions (adjustments made by the ABS for errors and non
reporting in the balance of payments) were $2,010m in 2017-18 and when added to
the balance on capital and financial account of $52,113m equalled $54,123m which
exactly offset the current account deficit of -$54,123m. The capital and financial
account balances for 2017-18 are shown in Table 5.
Countries like Australia and the USA which record current account deficits borrow
funds from current account surplus countries such as Japan, China and Germany.
These countries export capital to deficit countries and record capital and financial
account deficits.
International Account Ratios
The sustainability of the current account deficit, net foreign debt and net foreign
equity are measured by ratios to GDP. The sustainability condition for the current
account deficit is that it should be kept to under -5% of GDP so that net primary
investment income can be serviced.
If the current account deficit increased to over -5% of GDP this would mean the
economy’s growth rate and the rate of increase in national income would not be
sufficient to service the net primary income deficit. Therefore more foreign
borrowings in the form of foreign debt and foreign equity would have to be
undertaken. This would lead to an increase in net foreign liabilities and increase the
debt servicing cost on the Australian economy.
In 2017-18 as shown in Table 6 the current account deficit was sustainable at -2.5% of
GDP largely because the goods and services balance was in surplus and helped to
offset much of the current account deficit. This was due to an improved export
performance, especially mining exports.
Net foreign liabilities were $953,430m in 2017-18 consisting of net foreign debt of
$1,036,408m and net foreign equity of -$82,978m. Australia’s net foreign equity has
Australiaʼs Place in the Global Economy
13Table 6: International Accounts Ratios - 2017-18 (seasonally adjusted)
Current Account Deficit to GDP -2.5%
Net Primary Income Ratio to GDP -3.3%
Net Foreign Debt to GDP 55.7%
Net Foreign Equity to GDP -4.1%
Net International Investment Ratio to GDP 51.6%
Source: ABS (2018), Balance of Payments and International Investment Position,
Catalogue 5302.0 June
changed from a net liability to a net asset position in recent years with investment in
overseas shares and other assets by superannuation funds and other financial
institutions. The stock of net foreign debt represented 55.7% of GDP in 2017-18 and
net foreign equity -4.1% of GDP. Net international investment (net foreign liabilities
or net debt plus net equity) was 51.6% of GDP.
Year Current Account % of GDP Net Foreign % of GDP Net Foreign % of GDP
Deficit Liabilities Debt
14-15 -$56,979m -3.6% $905,996m 56.9% $976,056m 61.3%
15-16 -$72,828m -3.8% $1,035,858m 63.3% $1,044,505m 63.8%
16-17 -$29,469m -2.1% $1,000,264m 59.5% $990,599m 58.9%
17-18 -$54,123m -2.9% $953,430m 52.5% $1,036,408m 57.1%
Question 28 2018 HSC Examination
Assess the importance of factors that determine the size and composition of
Australia’s current account.
- Impact of domestic and global growth on exports and imports
- Terms of trade and competitiveness
- Exchange rate and interest rates
- World interest rates and debt servicing costs
- Savings/investment gap
Australiaʼs Place in the Global Economy
14The Exchange Rate
The Australian dollar exchange rate expresses the value of one Australian dollar in
terms of other major currencies. These currencies include the US dollar, Japanese
yen, euro, Great Britain pound (GBP) and Chinese renminbi (RMB) which are some
of the major currencies that make up the Trade Weighted Index (TWI).
The Trade Weighted Index
Aside from bilateral exchange rates such as the $US/$A and euro/$A, the Trade
Weighted Index is a measure of the value of the Australian dollar in terms of the
trade weighted value of a basket of currencies of Australia's major trading partners.
The value of the TWI and the Australian dollar in terms of the US dollar are
calculated and published by the Reserve Bank of Australia each day and are available
on its website (www.rba.gov.au).
The weights for the 19 currencies that make up the TWI in 2019 are shown in Table
7. The Chinese RMB has the highest weight (27.71), followed by the Japanese yen
(10.92), the European euro (9.73) and the US dollar (9.67). The currencies in the TWI
account for over 90% of Australia’s aggregate trade and Asia-Pacific currencies
account for the majority of the TWI.
Table 7: Weights in the Trade Weighted Index in 2019
1. Chinese renminbi 27.71 11. Malaysian ringgit 3.04
2. Japanese yen 10.92 12. Hong Kong dollar 2.69
3. European euro 9.73 13. Indonesian rupiah 2.36
4. US dollar 9.67 14. New Taiwan dollar 2.20
5. South Korean won 5.47 15. Vietnamese dong 1.86
6. Indian rupee 4.14 16. Canadian dollar 0.97
7. New Zealand dollar 4.02 17. Swiss franc 0.94
8. Singapore dollar 3.97 18. UAE dirham 0.88
9. UK pound sterling 3.95 19. PNG kina 0.85
10. Thai baht 3.52
Source: Reserve Bank of Australia (2019), website, www.rba.gov.au
Movements in the Australian dollar exchange rate occur daily because the Australian
dollar is a freely floating or flexible exchange rate. This means that the market forces
of demand and supply determine the value of the Australian dollar against a variety
of currencies in the foreign exchange market.
Changes in the TWI basket of currencies is published daily on the Reserve Bank’s
website as well as the changes in the value of the Australian dollar against each
individual currency in the TWI. This gives a broad and general picture of the
Australian dollar’s value or purchasing power each day.
Changes in the Value of the Australian Dollar
Changes in the value of the Australian dollar, especially against the currencies of
major trading partners will have an impact on the traded goods sector of the
Australiaʼs Place in the Global Economy
15Figure 8: The Equilibrium Exchange Rate for the Australian Dollar in Terms of US Dollars
$US/$A
D$A S$A = f (Ms, Ko)
E
$US0.68
S$A D$A
= f (Xs, Ki)
0 Quantity of $As
Q$As
Australian economy. This includes the exporters of agricultural and mining products,
manufactures and a variety of services such as tourism and education.
The other major part of the traded goods sector are those businesses that compete
with imports such as local manufacturers of consumer goods and providers of
services such as domestic travel and tourism. The demand for the Australian dollar is
largely derived from the demand for Australian exports of goods and services (Xs),
and the demand for Australian assets such as Australian equities and bonds and
other financial assets such as real estate and derivatives (capital inflow or Ki).
The supply of Australian dollars is derived from the Australian demand for foreign
goods and services (imports or Ms) and foreign assets such as equities, bonds and
real estate (capital outflow or Ko). In a freely floating or flexible exchange rate
system the demand and supply of Australian dollars will determine the equilibrium
exchange rate in the foreign exchange market. This is illustrated in Figure 8 where
the equilibrium exchange rate of $US0.68 is equal to $A1.00.
For most of 2019 the Australian dollar has been trading at about $US0.70 but more
recently has fallen to between $US0.69 and $US0.68 mainly due to lower official
interest rates in Australia after the Reserve Bank cut the cash rate to 1.25% in early
June 2019. This is the equilibrium point (E) in Figure 8 where the demand for
Australian dollars (D$A) equals the supply of $A (S$A) with Q$As traded in the
foreign exchange market. In late June 2019 the Australian dollar traded at 4.77 RMB,
74.70 Japanese yen, 0.61 European euro and 59.2 in TWI terms (refer to Table 8).
There was a a steady depreciation of the Australian dollar against most major
currencies and in TWI terms in 2018-19. This helped to support international
competitiveness and Australia’s rate of economic growth.
Australiaʼs Place in the Global Economy
16Appreciation and Depreciation of the Exchange Rate
Movements in the Australian dollar exchange rate in a flexible exchange rate system
are known as an appreciation and a depreciation. An appreciation in the exchange
rate for example is when the Australian dollar increases in value from $US0.68 to
$US0.75 leading to greater purchasing power for Australian consumers in buying
foreign imports and cheaper prices for foreign assets by Australian investors.
Although an appreciation of the Australian dollar exchange rate leads to greater
purchasing power for Australians in terms of buying foreign goods, services and
assets, it also leads to a reduction in international competitiveness. This occurs
because Australian exports and assets become more expensive in foreign currency
terms and may lead to less foreign demand and lower export earnings for
Australian exporters.
At the same time an appreciation leads to foreign imports becoming less expensive
for Australian consumers and businesses, who may switch their expenditure from
domestically produced goods and services and assets and buy more foreign goods,
services and assets. This could lead to lower revenue for Australian businesses that
compete with imports. An appreciating exchange rate restricts economic growth
because of a lack of competitiveness.
A depreciation in the exchange rate is when the Australian dollar for example
decreases in value from $US0.75 to $US0.68 leading to lower purchasing power for
Australian consumers in buying foreign imports and assets because they are more
expensive in Australian dollar terms.
Although a depreciation of the Australian dollar exchange rate leads to lower
purchasing power for Australians in terms of buying foreign goods, services and
assets, it also leads to an increase in international competitiveness. This occurs
because Australian exports become less expensive or cheaper in foreign currency
terms and may lead to greater foreign demand and higher export earnings for
Australian exporters.
At the same time foreign imports become more expensive for Australian consumers
and businesses who may switch their expenditure from foreign produced goods and
services and assets and buy more domestically produced goods, services and assets.
This could lead to higher revenue for Australian businesses that compete with
imports.
Recent Movements in the Australian Dollar
The most recent movement in the Australian dollar in 2018-19 has been a
depreciation. In October 2018 it reached a two and a half year low by trading at
$US0.70 after reaching a three year high of $US0.81 in January 2018. This
represented a 13% depreciation in the value of the Australian dollar. The Australian
dollar fell by around 9% against the US dollar, 5% against the euro and 8% against
the Yen in 2018. Overall movements in the value of the Australian dollar between
March 2017 and June 2019 are shown in Table 8. In this period there was a trend
depreciation in the Australian dollar against the US dollar, Japanese yen, euro, UK
pound and in TWI terms. This helped to improve Australia’s competitiveness and
Australiaʼs Place in the Global Economy
17Table 8: Quarterly Exchange Rates for the Australian Dollar - March 2017 to June 2019
Month/Year US dollar Japanese yen euro UK pound TWI
March 2017 0.75 86.18 0.71 0.61 66.2
June 2017 0.75 83.43 0.68 0.58 65.5
Sept. 2017 0.78 87.59 0.67 0.60 66.2
Dec. 2017 0.76 86.75 0.65 0.57 64.9
March 2018 0.78 85.20 0.63 0.56 62.3
June 2018 0.75 82.61 0.63 0.55 62.6
Sept. 2018 0.73 81.50 0.62 0.56 62.2
Dec. 2018 0.71 81.02 0.62 0.55 60.7
June 2019 0.68 74.06 0.61 0.54 59.2
Source: ABS (2019), Catalogue 5302.0, Balance of Payments and International
Investment Position, December 2018 and Reserve Bank of Australia (2019),
www.rba.gov.au
support domestic economic growth as the economy transitioned to non mining
sources of growth such as consumption and services.
Foreign exchange traders view the value of the Australian dollar trading in a narrow
band of between $US0.68 and $US0.75 in the future barring any unforeseen shock to
the Australian economy from either domestic or global sources. A possible domestic
shock could come from a collapse in the housing market and rising household debt.
Possible global shocks could occur if China’s growth rate stalls leading to lower
demand for Australia’s exports.
So far the Australian dollar’s depreciation has been most noticeable against the US
dollar but to a lesser extent against the currencies of our major trading partners. The
Australian dollar began to depreciate in early 2018 as the US Federal Reserve began
to lift US interest rates and the US dollar began to appreciate against other
currencies. Other factors which have contributed to the Australian dollar's
depreciation include the slowdown in Chinese growth and the consequent more
pessimistic outlook for Australian exports to China. In domestic terms the Australian
economy continues to record positive but below trend growth as wages growth has
stalled leading to more subdued domestic demand. At the same time the unwinding
of the housing boom and the high level of household debt have constrained
domestic spending and growth.
In more detail amongst the major factors contributing to the Australian dollar's
recent depreciation have been the following:
• The release of data on the China's Purchasing Managers’ Index (PMI)
has shown a significant slowing in China's manufacturing sector. This has
implications for imports of iron ore and coal from Australia to China's large
steel industry.
The Chinese government has used an easing in both monetary and fiscal
policy to try to sustain Chinese growth but the growth target for 2019 was
revised down to around 6.2%, well below China's average growth of 8% to
Australiaʼs Place in the Global Economy
1810% over the last decade. Chinese government policies to support growth
are in Australia's interest since they could help to support iron ore and coal
prices which would benefit Australian commodity exporters to China.
With a slower projected growth rate and increased trade tensions with the
USA, the Chinese RMB has depreciated by about 10% against the US dollar.
However the RMB would have depreciated by more if it were not managed
by the People's Bank of China as opposed to a freely floating exchange
rate like the Australian dollar. The People's Bank of China has been selling
US dollars and using its foreign exchange reserves to support the RMB
to prevent depreciation induced inflation through higher import prices.
To some extent the depreciation of the RMB has offset some of the effect of
US tariffs on Chinese imports into the USA by maintaining China's
international competitiveness. The RMB has traded at around 7 RMB to
the US dollar and 4.77 RMB to the Australian dollar.
• Higher official interest rates in the USA implemented by the Federal
Reserve in 2018 were used to dampen inflationary expectations as the US
economy recorded above average growth and the unemployment rate fell.
This improved economic performance was underpinned by the Trump
Administration's cuts to taxes upon winning office in 2016.
Higher US interest rates have led to higher yields on US Government bonds
and this has attracted capital inflow and put upward pressure on the US
dollar. A consequence of this has been the depreciation of the currencies of
the US's major trading partners such as the euro, UK pound and Japanese
yen.
The Australian dollar as the fifth most traded currency in the world, has also
depreciated significantly by around 15% against the US dollar. The Reserve
Bank of Australia had held official interest rates previously at 1.5% and the
rise in US interest rates widened the interest rate differential between
Australia and the USA and other major advanced economies, providing
higher returns to investors in US financial assets such as US Treasury bonds.
The widening of the interest rate differential between Australia and the
USA has tended to offset the effect of higher commodity prices which would
have been expected to result in an appreciating Australian dollar. Since
the Australian dollar is heavily influenced by commodity price movements
and the terms of trade, these factors have been nullified to a large
extent by the widening interest rate differential between Australia and the
rest of the world.
• Another factor weighing on the Australian dollar has been the increased trade
tensions between the USA and China with the imposition of a 10% increase in
US tariffs on $200b worth of Chinese imports and a similar amount on US
imports into China. The rise in protectionism has raised import costs in both
countries and led to lower export earnings for Chinese and US exporters. It
has also started to impact on the growth in world trade and investment by
creating uncertainty over the future of free trade.
Australiaʼs Place in the Global Economy
19Further rises in tariffs could occur if US-China trade negotiations fail to
deliver concessions on both sides in resolving trade issues. This especially
applies to China as the US is demanding the abandonment of its ‘One Belt
One Road’ policy which seeks to project Chinese political and economic
power globally and threatens US global economic interests.
The major implication for Australia is the slowing Chinese economy and
lower export demand for Australian exporters of commodities, manufactures
and services to China. Trade tensions have also impacted on a number of
major US technology companies like Apple and Google which rely on China
for their supply chains because of manufacturing of components and finished
products. Their earnings are projected to fall under Trump's higher tariff
regime.
Overall the recent depreciation of the Australian dollar has been positive in shoring
up international competitiveness. The depreciation has been gradual and modest
and not led to any upsurge in imported inflationary pressures through higher
import prices. There has also been low exchange rate volatility.
Reserve Bank research (2016) suggests that a 10% real depreciation in the exchange
rate can lead to a 4% increase in exports in the long run and help to reduce the
current account deficit and increase the rate of economic growth.
HSC Extended Response Questions 2013-18
Question 25 2018 HSC Examination
*Assess the extent to which the move towards free trade restricts the
Australian Government’s ability to achieve its economic objectives of full
employment, distribution of income and external stability. In your response
refer to the economic information provided.
Question 25 2017 HSC Examination
Analyse the implications of a decline in global economic activity for
Australia’s economic policies. In your response refer to the economic
information provided.
Question 28 2016 HSC Examination
Analyse the influence of different factors on Australia’s trade and financial
flows.
Question 27 2015 HSC Examination
Discuss the contributions of international organisations and trade
agreements to global economic growth and development.
Question 27 2013 HSC Examination
Analyse the effects of domestic AND global free trade and protection policies
on the Australian economy.
Australiaʼs Place in the Global Economy
20Appendix: Trade and Technology Disputes between the USA and China Escalate
According to the Reserve Bank (August, 2019):
“The US–China trade dispute has escalated over recent months after negotiations
between the two countries stalled. In June, the United States increased tariffs from
10% to 25% on US$200b of imports from China, and China retaliated with higher
tariffs on US$60b of imports from the United States. About half of US imports from
China are now covered by a 25% tariff rate and most Chinese imports from the
United States are covered by 5%–25% tariffs (Graph 1.2); average US tariff rates on
Chinese imports are now 12%, which is substantially above those on other US
trading partners at around 1%.
More recently, the US administration announced it will impose a 10% tariff on
almost all remaining imports from China from 1st September and further tariff
increases have been threatened. A decision by the US administration on increasing
tariffs on automotive imports from a number of countries has been delayed to
November. Trade tensions have broadened in recent months, with some countries
using them to address political disputes. For example, the United States threatened,
but then suspended, higher tariffs on imports from Mexico in response to a dispute
over immigration flows.
The escalation in the trade dispute is weighing on global economic activity. The
direct impact of the measures currently in place is relatively small, but the indirect
effects of uncertainty on investment have been more significant. The risk of further
escalation also poses a major downside risk to global growth, particularly through
adverse effects on business investment and confidence more generally, and the
potential for amplification through highly integrated global supply chains.
Nonetheless, some economies that provide a competitive production alternative to
China, such as Vietnam, appear to be benefiting from trade diversion due to the
trade dispute.
Australiaʼs Place in the Global Economy
21The US–China technology dispute has also escalated in recent months. The United
States imposed export and transfer controls that restricted access to key US
technologies for certain Chinese entities, particularly targeting advanced
semiconductor integrated circuits; the United States is the dominant global producer
of advanced circuits. The Chinese Government is reportedly considering
controlling exports of rare earth minerals; China is the largest global producer of
these minerals, which have various uses in high-technology processes. The economic
effects of the technology disputes are uncertain and are likely to play out over a long
period.”
Source: Reserve Bank of Australia (2019), Statement on Monetary Policy, August.
The reaction of the Chinese government to the latest Trump threat to raise tariffs on
more Chinese goods was swift. With Chinese GDP growing by just 6.2% in the June
quarter 2019 the weakest growth in nearly 30 years, the People’s Bank of China
revealed it was devaluing the yuan or RMB to below RMB7 to the US dollar for the
first time. A weaker currency could help China to offset the escalation in tariffs on
their imports into the USA. The response of the Trump Administration was this was
currency manipulation and unfair. However fears over the escalating trade war in
early August (6th - 10th) led to a mass of panic selling on world share markets and
the New Zealand government cut interest rates to 1%. On the ASX market
capitalisation fell by close to $38b on August 5th when trading opened after the
tweet from President Trump about new tariff measures from September 1st 2019.
Former US Treasury Secretary Lawrence Summers said that the world “May well be
at the most dangerous financial moment since the 2009 financial crisis.”
The impact on Australia could be profound if China’s growth slows and it demands
less resources such as iron ore and coal from Australia as well as tourism and
education exports.
China’s Claims in the South China Sea
In July 2016 the Permanent Court of Arbitration in the Hague declared that China’s
claim to most of the South China Sea was invalid. China has pursued an aggressive
policy of building, reclaiming and occupying islands in the Spratly Islands group and
claiming sovereignty. The Court found that China’s controversial island building
violated neighbouring Philippines’ sovereign rights and the freedom of navigation
for other countries in using major commercial shipping lanes in the South China Sea.
China rejected the Court’s ruling and has continued its occupation and development
of the Spratly Islands including building airstrips and military infrastructure,
threatening the security of the region.
In addition it is providing loans to small Pacific island nations to develop their
resources and infrastructure. In response the World Bank has cautioned against
these small nations from building up foreign debt. China faces the long term
challenge of re-balancing its economy away from its previous pattern of investment
and export led growth, to more sustainable growth generated by expanding
household consumption and the services sector. In order to sustain economic
growth of 6.5% to 7% the Chinese government has also pursued a policy of
supporting its global SOEs to undertake outward bound foreign investment to
secure resource supplies in overseas markets.
Australiaʼs Place in the Global Economy
22Protests Paralyse Hong Kong
In February 2019 new laws were proposed that would allow the extradition of
criminals from Hong Kong to mainland China. Upon the bill’s introduction to Hong
Kong’s Legislative Council mass protests involving thousands of people on the
streets of Hong Kong began.
Continuing protests by students and young Hong Kongers were met by violence on
the part of the police who used pepper spray and batons to disperse crowds. In June
2019 Hong Kong Chief Executive Carrie Lam announced the bill would be
suspended but this does not lead to the protests ending. They in fact escalate with
occupation of MTR stations and eventually Hong Kong Airport. These actions
together with a backlash against the protesters from some Hong Kong residents
leads to more violence and the total disruption of Hong Kong’s economy.
Tourists have abandoned Hong Kong in large numbers after weeks of violent
protests and the occupation of Hong Kong Airport. The Hong Kong government
announced a HK$19b financial relief package for small businesses and households in
the hope that increased spending could occur because of lower taxes and fees,
government rents and the provision of HK$2,000 to eligible households to help
meet their electricity bills. The more the protests go on and are linked to the pro-
democracy movement the more of a crisis it becomes. For the Chinese government
there is a need to exert control over Hong Kong as a Special Administrative Region
(SAR) of China, whilst maintaining its privileged position of having many
democratic freedoms. However the ongoing concern is that the Chinese
government may use the People’s Liberation Army (PLA) to destroy the protests,
arrest and imprison and torture protesters.
The immediate risk to Hong Kong’s economy and the region are the following:
• A breakdown of law and order and the rule of law.
• Disruption of the Hong Kong share market and the Hang Seng Index.
• Disruption of Hong Kong’s transportation system including the MTR, buses,
ferries and taxis.
• Disruption of Hong Kong’s leading role in global and regional supply chains.
• Falling numbers of visitor arrivals including tourists with large spending
power.
• A large decline in consumer and business confidence and spending on
consumption and investment.
• The continuing conflict between pro-democracy demonstrators and the
Hong Kong government and Chinese government.
Some have suggested that there is growing opposition to Xi Jinping’s hold on power
if he does not reign in the protesters and get Hong Kong functioning as an
important trade port and financial capital in the region as well as the world
economy.
Australiaʼs Place in the Global Economy
23You can also read