Working Paper Series On secular stagnation and low interest rates: demography matters - European Central Bank
←
→
Page content transcription
If your browser does not render page correctly, please read the page content below

Working Paper Series
 Giuseppe Ferrero, Marco Gross, Stefano Neri    On secular stagnation and
                                                low interest rates:
                                                demography matters

                                                   No 2088 / July 2017

Disclaimer: This paper should not be reported as representing the views of the European Central Bank
(ECB). The views expressed are those of the authors and do not necessarily reflect those of the ECB.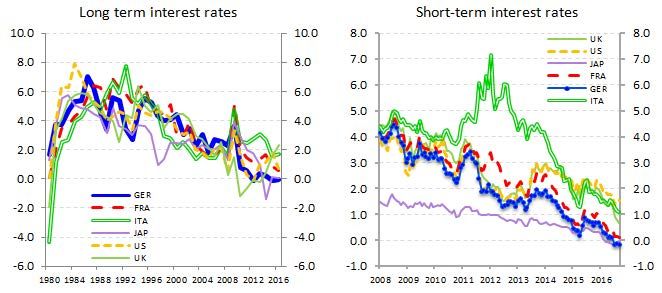
Abstract

      Nominal and real interest rates in advanced economies have been decreasing since the mid-1980s
      and reached historical low levels in the aftermath of the global financial crisis. Understanding why
      interest rates have fallen is essential for both monetary policy and financial stability. This paper fo-
      cuses on one of the factors that have been put forward in the literature within the secular stagnation
      view: adverse demographic developments. The main conclusion that we draw from our empirical,
      panel equation system-based assessment is that these developments have exerted downward pres-
      sures on real short- and long-term interest rates in the euro area over the past decade. Moreover,
      building on the European Commission projections for dependency ratios until 2025, we illustrate
      that the foreseen structural change in terms of age structure of the population may dampen eco-
      nomic growth and continue exerting downward pressure on real interest rates also in the future.

      Keywords: Secular stagnation; demographic developments; real interest rates; monetary policy.

      JEL classification: C32; E52; J11.

ECB Working Paper 2088, July 2017                                                                                1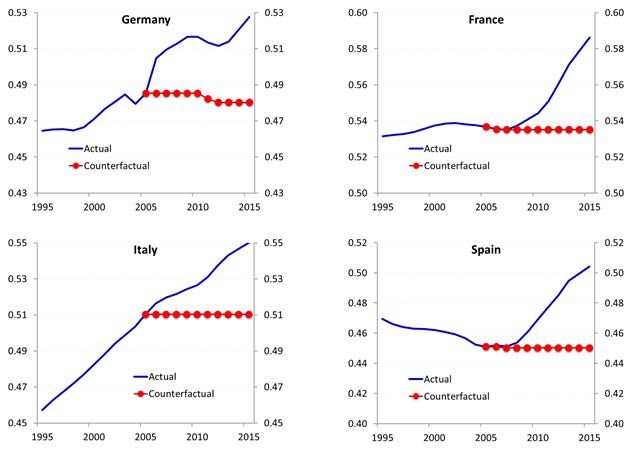
Non-technical summary

Nominal and real interest rates have been decreasing since the mid-1980s and have reached historical
low levels in the aftermath of the global financial crisis. Understanding why interest rates have fallen is
essential for both the conduct of monetary policy and the assessment of the risks to financial stability.
The ability of central banks to preserve price stability and keep output at its potential in the future
will be conditioned by the level of the natural or equilibrium interest rate.

   Against this backdrop, we focus in this paper on one specific factor that has been put forward
within the debate on the secular stagnation as a source of the declining trend of interest rates: adverse
demographic developments. The demographic structure in many European countries has developed
adversely according to various indicators already over the past one to two decades, and the adverse
trends are expected to turn even more adversely over the coming decade.

   The empirical model that we develop for the euro area countries (a dynamic panel model) reveals
an economically important role for demographic structure to shape the outcome of macroeconomic
aggregate dynamics. We conduct a backward-looking counterfactual scenario analysis by assuming that
dependency ratios (the ratio of old and young to the working age population) behave more favorably than
they did over the 10-year period from 2006-15. In addition, we present a forward-looking counterfactual
assessment, assuming that the dependency ratios move in line with the quite adverse projections by the
European Commission (EC), along with more favorable alternative assumptions over the 2016-25 period.
In both cases, the counterfactual projections suggest an economically and statistically relevant role for
demography. Interest rates would have been higher and economic activity growth measures stronger
under the assumed more favorable historical demographic assumptions. Concerning the forward-looking
assessment, interest rates would remain at relatively low levels under the assumption that demography
develops as projected by the EC, and would rise visibly only under the assumed more favorable forward
paths for dependency ratios.

   The findings concerning the role of demographics imply a clear role for structural, fiscal policy
measures that encourage later retirement and promote innovation and investment in R&D. Such policies
would be necessary in order to limit the negative impact of ageing on long-term growth prospects. They
may, however, take an extended period of time to exert their impact as time lags for policies to affect
demographic structures are naturally relatively long, spanning up to several decades.

ECB Working Paper 2088, July 2017                                                                         2
1     Introduction

      Demographic shifts, in particular the increase in life expectancy, can go a long way in
      explaining the decline in real interest rate over the past couple of decades. This is quite
      likely to be the main explanation for the sharp increase in house prices over the past couple of
      decades. This trend endangers the possibility for monetary policy to achieve full employment
      [...]. (Axel Gottfries and Coen Teulings, VoxEU, 30 January 2015)

     Nominal and real short- and long-term interest rates have been decreasing since the mid-1980s and
reached historical low levels in the aftermath of the global financial crisis. Understanding why interest
rates have fallen is essential for both monetary policy and financial stability. To the extent that nominal
and real interest rates are low in normal times, monetary policy may be constrained by the presence
of the effective lower bound (ELB) of policy rates, potentially limiting the ability of the central bank
to preserve price stability in the aftermath of a recessionary shock (Kiley and Roberts (2017)). This
is, indeed, one of the lessons of the last decade: the probability of hitting the ELB of policy rates is
higher than previously thought, as the real rate required for equating the supply and the demand for
funds when output is at its potential, unemployment is at its natural level and inflation is on target,
has declined (Holston et al. (2017), Cúrdia et al. (2015) and Christensen and Rudebusch (2017)). Low
nominal and real interest rates may also pose risks to financial stability, reducing financial institutions’
profitability and resilience, raising the likelihood of bubbles and potentially leading to excessive risk-
taking by investors.

    Two explanations for the persistent decline of interest rates have been put forward in the literature:
one relying on financial-cyclical factors, the other one on changes in the structure and the functioning
of the economy (Ferrero and Neri (2017)). According to Borio (2012) and Lo and Rogoff (2015) during
the “Great Moderation”, financial deregulation, excessively expansionary monetary policies and overly
optimistic expectations about future returns have favored an excessive increase in the supply of funds,
a compression of risk premia and a reduction of interest rates; the sharp correction in the financial cycle
occurred with the outbreak of the financial crisis, followed by a persistent contraction in aggregate
demand and an increase in the demand for safe assets, have led to a further reduction in interest
rates. Looking forward, interest rates will remain low for an extensive period of time; however, as
the deleveraging process ends and expansionary monetary policies are phased out, interest rates will
increase from their current low levels.

    Summers (2014), Eggertsson and Mehrotra (2014) and Gordon (2016) examine the role of structural
economic changes that have led to a persistent imbalance between demand for investment and supply
of savings, and to the consequent reduction in equilibrium real interest rates. A number of demand
and supply factors, all characterized by a high degree of persistence, have been considered in the
literature: adverse demographic developments, a falling (relative) price of investment goods, lower pace
of technological innovation, rise in savings rates and scarcity of safe assets, increasing wealth and income
inequality. According to this view, the global financial crisis added further downward pressure on real
interest rates. Looking forward, structural factors would continue to keep real interest rates low for a
long time, even after the effects of the crises fade away. While technological progress is very difficult to

ECB Working Paper 2088, July 2017                                                                          3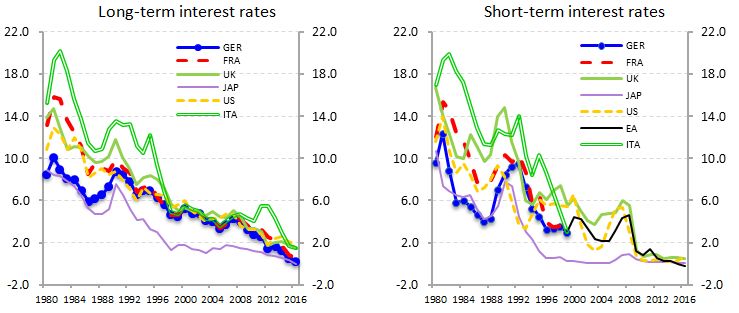
predict, demographic developments are very persistent and more predictable.
The high persistence of demographic factors makes them particularly relevant from a monetary
policy and financial stability perspective, to the extent that they affect medium-term trends in nominal
and real interest rates. However, only few papers have empirically assessed the role of demographic
factors on real interest rates. Aksoy et al. (2016) examine the effects of changes in the demographic
structure on macroeconomic trends using a panel VAR for the OECD economies; Favero and Galasso
(2016), using a panel regression, conclude that demographic trends in Europe do not support empirically
the secular stagnation hypothesis; Carvalho et al. (2016) and Gagnon et al. (2016) develop and calibrate
a life-cycle model to assess the impact of demographic changes on the short-term real interest rate in
developed economies.
The objective of this paper is to provide new evidence related to the impact of demographics on
real interest rates and other macroeconomic variables in the euro area, adopting both a backward- and
forward-looking perspective. The empirical analysis is based on a dynamic panel vector autoregressive
model, the estimates of which suggest that an increase in dependency ratios, which results from the
aging of the population, and a decrease in population growth have a clear potential to push nominal
and real interest rates downward. The policy implication is that in advanced economies the ability of
central banks to preserve price stability and keep output at its potential could be impaired to an extent
by the decline in the natural rate of interest, over which slow-moving factors such as demographic ones
may have a significant impact.
The paper is organized as follows. Section 2 discusses the long-term trends in nominal and real rates.
Section 3 presents the explanations put forward in the literature. Section 4 presents the empirical model
and the backward- and forward-looking counterfactual assessment. Section 5 concludes the paper, by
highlighting the implications for monetary policy.
2 Stylized facts on nominal and real interest rates
The current macroeconomic environment is characterized by exceptionally low nominal rates in ad-
vanced economies. The decline of long- and short-term nominal interest rates started in the mid-1980s
(Figure 1, panels a and b), as part of a global phenomenon and coincided with a decline of real interest
rates, a strong and persistent reduction of inflation and a period of low macroeconomic volatility, the
so-called “Great Moderation”.
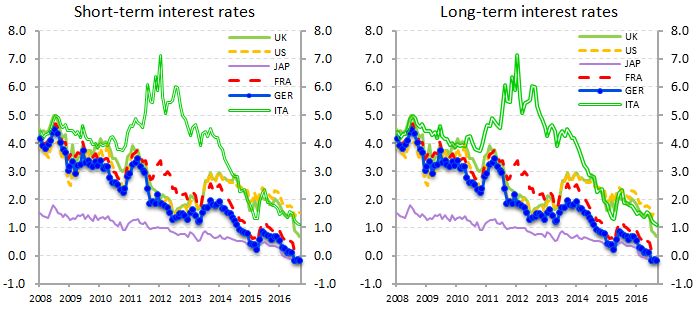
The decline accelerated with the outbreak of the global financial crisis. Since late 2008-early 2009,
the slack in the economy and protracted low inflation rates contributed to further reducing nominal
interest rates, as monetary policies turned very accommodative (Figure 2, left), also by means of
unconventional measures. In some countries a strong compression of risk premia and flight to quality
phenomena pushed nominal interest rates into negative territory even at long maturities (Figure 2,
right).
Since mid-2013, long-term interest rates in the euro area have declined at a faster pace than in the
ECB Working Paper 2088, July 2017 4Figure 1: Nominal interest rates in advanced economies: 1980-2016
Source: European Commission, AMECO Database.
Figure 2: Nominal interest rates in advanced economies: 2008-2016
Source: Datastream.
ECB Working Paper 2088, July 2017 5Figure 3: Real interest rates in main advanced economies
Source: European Commission, AMECO Database.
U.S. due to the consequences of the sovereign debt crisis and the new measures adopted by the European
Central Bank (ECB) to preserve the proper functioning of the monetary transmission mechanism and to
provide further monetary accommodation when the policy rates reached the effective lower bound. The
decline in short- and long-term interest rates brought about a decline in the financing costs of banks,
non-financial corporations, households and governments, which reached historical minima (European
System Risk Board (2016).
Real interest rates have been decreasing since the second half of the 1980s (Figure 3). This trend,
too, has accelerated with the outbreak of the global financial crisis, and in the euro area after the
sovereign debt crisis.
According to some recent analyses (Cúrdia et al. (2015) and Holston et al. (2017)), a similar trend
has characterized the evolution of the natural interest rate, which is defined as the real short-term
interest rate that keeps output at its potential, unemployment at its natural rate and inflation at the
central bank’s target. Holston et al. (2017) show that the natural rate of interest decreased in recent
years in the main advanced countries, from around 3% in the 1980s to close to zero in the U.S. and
to negative values in the euro area. Cúrdia et al. (2015) and Gerali and Neri (2017), using dynamic
stochastic general equilibrium models, have shown that the natural rate in the U.S. between 2008 and
2016 has remained well below zero; in the euro area, the natural rate has become negative in the
aftermath of the sovereign debt crisis. Being an unobservable variable, however, there is no consensus
neither on how to estimate nor on the specific estimates of the natural rate, in particular for the period
after the global financial crisis.
The debate about the drivers of the dynamics of real interest rates over the past decades is open
and lively especially at the policy-making level.1 Two views have been put forward in the literature:
1 See, among others, International Monetary Fund (2014), Bean et al. (2015), Council of Economic Advisers (2015),
ECB Working Paper 2088, July 2017 6the “real/structural” and the “cyclical/financial” views. Among the “real/structural” explanations, the
“secular stagnation” is probably the most famous (Summers (2014)). As for the “financial/cyclical”
explanation, Borio (2012) and Lo and Rogoff (2015) are two key references.
The two views share some common elements (Borio (2017)). First, they take a long-term perspective.
Second, they question the presumption that the economy is always self-equilibrating. Third, they
encourage academics and policy-makers to question the prevailing macroeconomic framework and to
invest in developing models in which real and financial factors influence each other.
3 Low interest rates: the structural and cyclical views
According to the structural view, advanced economies suffer from a persistent imbalance resulting
from an increasing propensity to save and a decreasing propensity to invest; in this context, excessive
savings act as a drag on growth and inflation, exerting a downward pressure on real interest rates. This
explanation implies that the natural interest rate has structurally declined in the last decades; this would
explain why during the Great Moderation period, inflation remained on target even if nominal interest
rates were low in historical perspective. The structural view also highlights that after the outbreak of
the global financial crisis, the effective lower bound to policy rates has prevented central banks from
providing the necessary accommodation through conventional (i.e. interest rate) policies, prompting
the adoption of non-standard measures. Looking forward, the structural factors may continue to keep
real interest rates low even after the effects of the global financial crisis have completely faded away.
According to the financial cycle view, low real interest rates are consistent both with periods of
credit expansion and credit contraction. Periods characterized by deregulation in the financial sector,
excessively expansionary monetary policies and overly optimistic expectations of future returns con-
tribute to a large and persistent increase in the supply of funds that allow economies to accumulate
excessive (often housing) debt at low interest rates and grow at a sustained pace. As credit increases,
asset prices are pushed up, raising their value as collateral, relaxing borrowing constraints and inducing
a further increase in credit and asset prices. According to Lo and Rogoff (2015), Borio (2015), Bo-
rio (2017), these developments have characterized the main advanced economies between mid-90s and
mid-2000s. During periods of growing indebtedness, resources may be allocated towards low produc-
tivity growth sectors, notably construction (Borio et al. (2015)), which do not contribute to increasing
potential output growth.
When financial shocks hit the economy, both the supply and demand of funds decrease. To coun-
teract the effects on inflation and economic activity, the central bank significantly eases monetary
conditions. When expansionary monetary policies begin exerting a positive effect on the supply of
funds, however, an extensive need for deleveraging and a high degree of uncertainty about future in-
come dampen investment and consumption, further reducing real interest rates.
The bust in the financial cycle can cause a long-lasting damage to the economy (Reinhart and
Reinhart (2010), Jorda et al. (2013) and Mian et al. (2017)). This sharp correction is seen to cause a
Rachel and Smith (2015), Praet (2017) and Williams (2016).
ECB Working Paper 2088, July 2017 7permanent loss in output and a slow and protracted recovery. To some extent, this persistent effect may
arise from the fact that in an over-indebted economy, financial institutions may not be in the position
to reallocate resources away from the sectors that have been hit by the bust in the financial cycle and
the consequent recession.
3.1 Demographic factors and interest rates
Demographic trends affect both the demand and the supply side of the economy. Lower fertility and
longer longevity, which lead to a higher old-age dependency ratio, require more savings for old age, unless
these are offset by an increase in the retirement age, and may cause a decline in aggregate consumption
as a share of income. Population trends also affect investment demand, as lower population growth
implies that lower investment is required to maintain a given capital-to-labor ratio, reducing real interest
rates. An increasing proportion of elderly people leads to a shrinking working-age population; given
the capital stock, this lowers the real rate due to the higher capital intensity. As time goes by, however,
the elderly consume their own wealth and reduce their savings, potentially exerting upward pressure on
real interest rates.
Several contributions on the role of demographic factors have recently appeared in the literature,
conveying different conclusions as to their impact on interest rates. Aksoy et al. (2016) investigate the
impact of changes in the demographic structure and show that ageing leads to subdued output growth,
higher savings and lower interest rates. Favero et al. (2016) show that the common persistent component
of the term structure of interest rates is related to the ratio of middle-aged to young population.
Projections based on the estimated model show that real interest rates would remain negative only
for the next few years, and then would recover rather than continuing their secular decline. Favero
and Galasso (2016) show that interest rates are depressed by increased savings by the middle-aged
population, due to longer life expectancy. However, this effect is compensated by longevity, as the
longer-living generations of retirees raise aggregate consumption and interest rates. All in all, a change
in the age composition of the population measured by the replacement of population between 40 and
59 with the population aged 60 and over, has a negative impact on output and a positive effect on real
interest rates.
Carvalho et al. (2016) develop and calibrate a life-cycle model to capture the salient demographic
features in developed economies. Demographic trends between 1990 and 2014 reduced, ceteris paribus,
the equilibrium interest rate by 1.5 percentage points. Gagnon et al. (2016) develop an overlapping-
generation model with a rich demographic structure to assess the impact of the demographic changes
occurred in the U.S. since the early 80s on real interest rates and real GDP growth. The model accounts
for around one percentage point of the decline in both real GDP growth and the equilibrium real rate
and suggests that they may remain low in a “new normal” economy. Ikeda and Saito (2014) develop a
model for the Japanese economy and show that an exogenous decline in the ratio of workers to total
population causes a reduction in the real interest rate. Backus et al. (2014) assess the persistence of
international capital flows (i.e. “global imbalances”), showing that demographic factors could be a
factor that is driving these developments. The authors show that among demographic factors, changes
in life expectancy can explain much of the pattern of capital flows across countries. These changes are
ECB Working Paper 2088, July 2017 8consistent, ceteris paribus, with the pattern of declining interest rates over the past decades.
The relationship between demographic trends and inflation has also been examined in the literature.
Juselius and Takats (2015) find evidence of a stable and significant correlation between demography
and low-frequency developments in inflation over the period 1955-2010. A larger share of dependents
(i.e. young and old) is associated with higher inflation, while a larger share of working age cohorts is
associated with lower inflation. Bobeica et al. (2017) have developed a co-integrated VAR to estimate the
long-run relationship between inflation and the growth of the working-age population (as a share of total
population) in the euro area as a whole, in the U.S. and Germany. The analysis highlights the existence
of a positive long-run relationship. This result has important implications for central banks since
demographic trends can shape the economic environment in which monetary policy operates. Yoon et al.
(2014) analyze the relationship between population dynamics and various macroeconomic variables,
including inflation. As for the latter, the empirical analysis suggests that the ongoing demographic
changes could have a significant deflationary impact in the years ahead, in particular in those economies
which are experiencing a rapid declining and a significant aging of the population.
3.2 Stylized facts on demographic trends
Over the last 45 years there has been considerable increase in dependency ratios – the amount of people
at non-working age (0 to 14 and above 65) compared to the number of those at working age (15 to 64)
– a key statistic for measuring the degree of aging of a society (Figure 4, left). Population growth has
also declined in most economies, although with varying patterns (Figure 4, right). Lower population
growth implies that the elderly cohorts increase in size relative to the younger ones. Declining fertility
rates, which have fallen sharply after the introduction of the contraceptive pill in developed countries
in the early sixties (Figure 5, left), and increased life expectancy have contributed to the aging of the
population. Within this generalized trend, Japan is an extreme case: population growth has been
slowing down since the mid-1970s and the dependency ratio has reached new historical maxima.
The discovery of the contraceptive pill has led to a strong demographic imbalance in some countries.
While in the U.S. the size of cohorts has remained stable over time, the effects of the introduction of
the pill on the population pyramid has been strong in countries such as Germany, where total fertility
fell from 2.5 in 1967 to 1.4 in 1970 (Gottfries and Teulings (2015) and Lu and Teulings (2016)).
The sharp and persistent decline in fertility rates can be seen as the end point of a global demographic
transition that started with the decline in child mortality which led to exceptionally large young age
cohorts and an unprecedented growth in population. The decline in fertility, in addition to reflecting the
introduction of the pill, could constitute a delayed response to the survival of many children, reinforced
by rising income, increased education of women and higher labor force participation by women (Bussolo
et al. (2015)).
Other factors equal, these demographic trends have led to an increased supply of savings, as workers
have to save more to finance their consumption during the retirement period (Lu and Teulings (2016)).
For a given demand for investment, this excess saving may have contributed to driving interest rates
ECB Working Paper 2088, July 2017 9Figure 4: Dependency ratios and population growth
Source: European Commission and World Bank Open Data.
Figure 5: Fertility and life expectancy
Source: World Bank Open Data.
ECB Working Paper 2088, July 2017 10down.
In several countries, the population size is expected to decline in the course of the coming four
decades (United Nations (2015)). Fertility in all European countries is now below the level required for
full replacement of the population in the long run (around 2.1 children per woman, on average); in the
majority of the countries, fertility has been below the replacement level for several decades. Fertility in
Europe as a whole is projected to increase from 1.6 children per women in 2010-2015 to 1.8 in 2045-2050,
but such an increase may not be sufficient to prevent a contraction of the population. Migration could
possibly offset these worrying trends to some extent.
As the figures above show, future age composition and growth of the population depend on fertility
and longevity. As fertility declines and life expectancy rises, the proportion of the elderly people
increases. This population ageing is occurring throughout the world; at the global level, the population
aged 60 or over is the most rapidly growing. Europe has the largest percentage of its population at ages
60 or older (24%). In the short- to medium-term, the projected increase of the older population is very
likely or even inevitable. These unprecedented developments in demographic trends raise the issue of
assessing their impact on growth and real interest rates. Section 4 will shed additional light on this.
4 Empirical analysis
4.1 Model specification
The empirical analysis is based on a dynamic panel vector autoregressive model with 11 endogenous
and 2 exogenous variables, containing a sample of 19 euro-area countries and spanning the period from
1990 to 2015. The model has the following form:
Yit = αi + A(L)Yi,t−1 + γ(L)Dt + it (1)
where i and t denote, respectively, the country and time dimensions, αi is a vector of country fixed
effects, A(L) are the coefficients of an autoregressive polynomial, Dt denotes the vector of exogenous
variables and it the error term.
The endogenous model variables are potential output growth, real GDP growth, total factor produc-
tivity (TFP) growth, investment growth, private consumption growth, GDP deflator inflation, invest-
ment deflator inflation, private consumption deflator inflation, changes in unemployment rates and real
short-term and long-term interest rates. The two exogenous variables are population growth and the
(change in the) total dependency ratio, defined as the share of the population under 15 and over 64 rela-
tive to the population aged 15-64. All the data, whose frequency is annual, are taken from the AMECO
database of the European Commission. The model equations have up to one lag in terms of autoregres-
sive terms of the left hand-side variables as well as the right hand-side variables. The model has been
constrained to some extent, by excluding statistically insignificant relationships resulting after a first,
ECB Working Paper 2088, July 2017 11unconstrained estimation of the model. Moreover, there are some time-contemporaneous relationships
included, for example with respect to the unemployment rate changes in the TFP equation, the real
long- and short-term interest rates in the TFP and unemployment rate equation, and also with respect
to the population growth and dependency ratio variable in (almost) all equations. We have tested for
the role and significance of the reverse relationships for all but the demographics-related variables, i.e.
for instance for whether a contemporaneous relationship from TFP back to unemployment was present
and could not find evidence for that; and neither for all other contemporaneous relationships that we
allowed except for the demographics variables which we treat as strictly exogenous by assumption. The
latter assumption is an important one, which our counterfactual assessment hinges upon.
The choice of focusing on the dependency ratio is motivated by the fact that, under certain con-
ditions, the change in the ratio is a summary statistic for the evolution of the composition of the
population (Carvalho et al. (2016)). Consider, for simplicity, workers (w) and retirees (r). Let ωt be
the probability of remaining in the labor force between time t − 1 and t, and let γt be the probability of
surviving in the same period if retired. The aggregate labor force (equivalent to total population under
our assumptions) evolves according to:
Ntw = (1 − ωt + nt )Nt−1
w w
+ ωt Nt−1 w
= (1 + nt )Nt−1 (2)
where nt is the growth of the labor force. The number of retirees evolves according to:
Ntr = (1 − ωt )Nt−1
w r
+ γt Nt−1 (3)
Re-arranging the two equations yields the evolution of the dependency ratio Ψt = Ntr /NTw :
1 − ωt γt
Ψt = + Ψt−1 (4)
1 + nt 1 + nt
which describes the evolution of the age composition of the population. An increase in life expectancy
(higher γt ), a decrease in fertility rates (lower nt ) raise the dependency ratio or a decrease in the
probability of remaining in the labor force.2 In this sense, the simulations in which we condition on the
evolution of the dependency ratio can be rationalized in terms of past developments in life expectancy
and fertility rates.
We have employed an LSDVC estimator (Kiviet (1995) and Bruno (2005)) to estimate the model,
to thereby account for the presence of the autoregressive lags in the equations which would—if not
reflected in the estimation method—have the potential to bias the estimates.3 All model variables
were normalized by their historical standard deviations prior to the estimation. The rationale for using
2 An increase in the retirement age that would offset the increase in life expectancy or the decrease in the fertility rate
can be simulated by increasing the probability of remaining in the labour force.
3 Standard errors (p-values, respectively) were obtained by means of a bootstrap procedure.
ECB Working Paper 2088, July 2017 12Table 1: Panel system estimates (selected equations)
Note: The model is estimated allowing for cross-section (country) fixed effects based on annual data spanning the 1990-2015
period. ** and * denote significance at least at the 5% and 10% levels, respectively.
the normalization is to better account for cross-country differences in sensitivities in a model in which
sensitivities are assumed to be homogeneous across countries.4
4.2 Estimation results
Table 1 shows the estimates of the parameters for selected equations. Table A1 in the Annex shows the
complete set of estimates. Potential output growth depends positively on TFP growth and negative on
the change in the dependency ratio. These results confirm that the aging of the population affects the
economy long-run potential output growth: a smaller share of the younger cohorts may imply lower
innovation and investment in R&D, which would reduce potential growth in the long-run. This result
is consistent with the empirical evidence and the theoretical model in Aksoy et al. (2016).
Real GDP, potential output, investment and consumption growth depend negatively on the change
in the dependency ratio. Real investment and consumption growth also depend positively on TFP
growth, consistently with standard growth models. Inflation, as measured by the change in the private
consumption and in the GDP deflators, is negatively affected by the change in the dependency ratio.
This finding is consistent with the evidence in Bobeica et al. (2017) who document a positive relationship
between inflation and the growth rate of the working-age population in the euro area.
The real short-term interest rate depends negatively on population growth and the change in the
dependency ratio, whereas the real long-term rate depends negatively only on population growth. These
results are in line with those by Aksoy et al. (2016), Carvalho et al. (2016) and Gagnon et al. (2016).5
4 The model in which the variables were not normalized prior to estimation turned out to result systematically inferior
in-sample predictive performance measures.
5 Our results are also conform with the predictions by the overlapping generations model developed by Eggertsson and
Mehrotra (2014) who illustrate, based on the assumptions they built into their model, that a slowdown in demand for
ECB Working Paper 2088, July 2017 13Figure 6: Historical counterfactual assumptions for dependency ratios (selected countries, in %)
Note: The chart shows the historical evolution of the dependency ratio over the 1995-2015 period along with the assumed
more favorable evolution over the period 2006-2015.
Finally, an increase of the dependency ratio indirectly reduces also TFP growth and long-term real
interest rates through the effect that the demographic variable exerts on potential output and short-term
real interest rates, respectively.
4.3 Historical counterfactual analysis: 2006-15
The historical counterfactual assessment is conducted by assuming that the dependency ratios did not
increase between 2006 and 2015: in constructing the counterfactual evolution of the ratios, we set to
zero the annual changes in the years in which they are positive and leave unchanged the observed
negative changes. Figure 6 shows the resulting counterfactual paths for the dependency ratios, along
with the observed ones for the largest euro-area countries. For almost all countries, dependency ratios
started trending upward around 2005.
Table 2 shows the counterfactual and the observed average growth rates and interest rate levels
loans of the young (middle-aged) population would let real interest rates drop as a result. Similar in spirit and therefore
also compatible with our findings is the model presented in Krugman (1998).
ECB Working Paper 2088, July 2017 14Table 2: Historical counterfactual under more favorable dependency ratios, 2006-15, euro area
Note: Euro area aggregates based on data and estimates of the 19 euro-area countries. Averages over the period 2006-15.
The nominal interest rate counterfactual paths are proxied by the sum of the real rates and the GDP deflator inflation
averages per annum.
for the period 2006-15. The table reports nominal GDP-weighted aggregates for the euro area. The
conditional forecasts are dynamic, meaning that the lags in the model are the previous period conditional
forecasts and not the observed realizations. Figure 7 shows the observed evolution along with the
counterfactual projections for the euro area aggregate.
In the counterfactual scenario, the real short-term interest rate in the euro area would have been
0.5pp higher on average than the actual value. Macroeconomic variables would have evolved more
favorably, with real GDP growth averaging 1.3%, 0.5pp above the realized value. Real investment
growth would have been 1pp above the actual per annum growth (-0.2%) and real consumption growth
by 0.6pp (1.1%, compared with 0.5%). The average unemployment rate would have equaled 8.5%,
against the actual 9.2%. The differences in the paths of the real long-term rates are small. The
estimates in Table 2 and Figure 8 confirm the non-negligible impact of the assumed more favorable
demographic evolution between 2006 and 2015.
The significance estimates related to the differences between the observed and the counterfactual
paths are presented in Table A2. The p-values were computed by positioning the observed variable
paths in the counterfactual-conditional density forecasts, to measure the significance of the deviation
between the observed and the counterfactual conditional mean on average along the projection horizon.
The way the counterfactual-conditional density forecasts were generated reflects both the residuals
and coefficient uncertainty.6 For the euro area, the nominal GDP-weighted aggregates of the variable
paths were first generated for all bootstrap replicates, to then compute the p-values. The estimates
suggest that for numerous variables the counterfactual paths is statistically different from the observed
trajectories at least at the 10% level. Against this threshold, the only exceptions are TFP growth and
real long-term rates, which at 13% and 15% respectively may still be deemed as border-line significant,
however. The relatively low p-values for the euro area are driven to a large extent by the low levels
(and high GDP weight) for France, Spain, and the Netherlands.
In addition to the historical counterfactual analysis based on the 2006-15 period, we have conducted
the same exercise for the preceding 10 year window, spanning the 1996-2005 period. During this period,
6 A nonparametric bootstrap on the residuals was combined with a parametric bootstrap from the estimated means
and the covariance matrix of the model coefficients to generate 5,000 forward paths for all model variables conditional on
the counterfactual assumptions for the demographic factors.
ECB Working Paper 2088, July 2017 15Figure 7: Historical counterfactual projections for euro area aggregates, 2006-15 Note: The charts depict the historical evolution of the variables over the 2005-2015 period along with the counterfactual projections conditional on a more favorable evolution of demographic factors over the 2006-15 period. ECB Working Paper 2088, July 2017 16
Figure 8: Forward-looking counterfactual projections for euro area aggregates, 2016-25

Note: For Scenario A, the assumptions from the 2015 EC Ageing Report were adopted (red dashed line). In Scenario B
(green dashed line) the dependency ratios move half way in between the EC projections and a flat path. Under Scenario C
(purple dotted line), the ratios are assumed to remain flat at their 2015 levels.

approximately half of the countries in the sample experienced an upward trend of their dependency
ratios, while for the other half the ratios were trending downward. We do not report the results of
this additional exercise; the counterfactual-observed gaps equaled about one third of the size of the
gaps based on the 2006-15 period, on average across countries. The reason why in this case the gaps
are visibly smaller is that dependency ratios did not trend upward that significantly yet during this
period. All in all, while dependency ratios started trending upward in a subset of countries already in
the second half of the 1990s, these trends intensified only afterwards, implying a more sizable drag on
macroeconomic developments in the last part of the sample.

4.4     Forward-looking counterfactual analysis: 2016-25

Three scenarios are considered for the evolution of the dependency ratios for the forward-looking coun-
terfactual assessment that we present now. Figure 8 shows the assumptions again for the subset of the
largest four euro area countries.

ECB Working Paper 2088, July 2017                                                                                   17
Table 3: Counterfactual scenario-conditional forecasts, euro area, 2016-25

Note: All estimates refer to euro area (nominal GDP-weighted) aggregates. Under Scenario A, the dependency ratio is
assumed in line with the European Commission Ageing Report; under Scenario B, it is assumed to evolve halfway between
the EC projections and constant levels at 2015 values; in Scenario C, the dependency ratio is constant at 2015 levels.
The real interest rates were included in the model and projected conditional on the scenarios as such. The figures for the
nominal interest rate counterfactual are proxied by the sum of the real rates and the GDP deflator inflation averages per
annum.

    Under Scenario A, which can be referred to as a “baseline” simulation, the ratios are aligned for
all the countries with the projections by the European Commission’s 2015 Ageing Report (European
Commission (2015)). The aging implied in this scenario is the result of slowing dynamics of fertility,
rising life expectancy and specific assumptions in terms of migration. The proportion of young people
(aged 0-14) is projected to remain relatively constant over the next decades in the euro area (around
15%), while those aged 15-64 are expected to constitute a substantially smaller share, declining from
66% to 57%. Those aged 65 and older are expected to constitute a much larger share (29% of the
population, from 19%). Under Scenario B, the dependency ratios are assumed to move half way in
between the EC projections and a flat path with respect to 2015, thereby implying, to some extent,
more favorable demographic developments, given that the EC paths imply a relatively steep upward
trend compared to historical trends for numerous countries. Scenario C entails the assumption that
dependency ratios remain flat at their 2015 values and therefore can be interpreted as an optimistic
upside scenario (in economic terms) when judged against the projections of the EC.

    The ratios are expected to trend up in the four largest economies: in Germany, the ratio would
increase by 9pp between 2016 and 2025, one of the most sizable increases among the euro area countries,
after Lithuania, Malta and Slovenia. Ireland, Italy and Spain would experience the lowest increase (4pp).

   Table 3 presents the counterfactual model estimates for the main euro area variables for the 2016-
2025 period. The estimates confirm the important role that the dependency ratio plays in shaping
macroeconomic outcomes. In Scenario A, average TFP, real GDP, real investment and consumption
growth would be lower than in Scenarios B and C; TFP would be almost flat, growing by just 0.1%
on average and real GDP growth by 0.6%. Compared with the more benign Scenario C, TFP and real
GDP growth would be lower by, respectively, 0.3pp and 0.7pp. The increase in the dependency ratio
would have a sizable impact on real investment, which would grow on average by 0.7% per annum in
Scenario A, compared with 1.9% in the more favorable scenario. The projections of real variables in
Scenario B would be in between those implied by Scenarios A and C.

ECB Working Paper 2088, July 2017                                                                                      18
Figure 9: Counterfactual scenario-conditional forecasts: euro area
Note: The charts show the actual data and the conditional projections in the three scenarios.
The conclusion we can draw from the forward-looking counterfactual assessment is that the evolution
of the dependency ratios can be expected to play a key role in shaping macroeconomic developments in
the future. In Scenario A the real short-term interest rate in the euro area would remain negative until
2019 and remain close to 0% over the 2020-25 period (Figure 9), not far from the average between 2007
and 2015. In the most favorable Scenario C, instead, the real short-term real rate would return to the
levels observed in the 2000-2006 period (1.3% at the end of the horizon). Under Scenario A potential
output and real GDP growth would decrease significantly along the simulation horizon, moving from
0.8 and 1.7% respectively in 2015, to 0.5% and 0.4% in 2025.
Figure 10 shows the conditional forecasts for short- and long-term real interest rates and real GDP
growth of the four largest euro area countries. The projections confirm the important role played by
the dependency ratios: to the extent that aging of the population continues, short and long-term real
interest rates would remain below the pre-crisis levels.
Tables A3 and A4 in the annex present the p-values corresponding to the differences of Scenarios B
and C, respectively, to Scenario A. Compared to the historical counterfactual significance estimates, the
p-values comparing the forward-looking Scenario C with Scenario A are comparable in terms of their
range with a view to the area aggregates, spanning from a sizable 2%-3% for potential output growth
and unemployment rates, to the less significant 11%-14% for real long-term rates, real investment growth
and TFP growth. The euro area aggregate p-values are driven quite a bit by the low p-values for France
and the Netherlands again and in this case to a lesser extent by Spain (which was the case regarding
the p-values related to the historical counterfactual projections).
We have carried out several robustness checks of the results presented in this Section. First, we have
extended the sample back to 1980. The results that we presented both in terms of model estimates and
historical and forward-looking counterfactuals change only marginally. Second, we have used nominal
short- and long-term interest rates instead of the real counterparts and the results in terms of projections
ECB Working Paper 2088, July 2017 19Figure 10: Counterfactual scenario-conditional forecasts: Selected countries Note: The charts show the realized (blue solid line) and projected short- and long-term real interest rates and real GDP growth in the three different scenarios (A: red dashed; B: green; C: violet dotted). ECB Working Paper 2088, July 2017 20
for the implied real and nominal rates remain very close to those presented in this Section. Third, we
have excluded population growth from the model to judge whether there is a potential conflict with the
dependency ratio. In this case, too, the projections were marginally affected. Fourth, in terms of the
estimation method, we have considered conventional GGM estimators as developed by Arellano and
Bond (1991) instead of the LSDVC estimator. Although the Arellano-Bond estimator is known for its
sub-optimal small-sample properties, our estimates and the resulting counterfactual projections do not
change much and all the conclusions hold up to the alternative estimation method.

5     Conclusions

Nominal and real interest rates have been decreasing since the mid-1980s and have reached historical
low levels in the aftermath of the global financial crisis. Understanding why interest rates have fallen is
essential for both the conduct of monetary policy and the assessment of the risks to financial stability.
The ability of central banks to preserve price stability and keep output at its potential in the future
will be conditioned by the level of the natural or equilibrium interest rate.

   This paper has focused on one specific factor that has been put forward within the debate on the
secular stagnation (Summers (2014)) as the source of the declining trend of interest rates: adverse
demographic developments. The worrisome expected evolution of the demographic structure in Europe
requires assessing the impact of demographic developments on real interest rates and potential output
growth.

   The empirical evidence presented in this paper suggests that over the next decade, adverse demo-
graphic developments in the euro area may continue exerting downward pressure on short- and long-term
nominal and real interest rates, potentially limiting the ability of monetary policy to adjust its stance
due to the presence of the lower bound to policy rates.

    The pace at which real interest rates increase from current historically low levels may be influenced
by structural, fiscal policies that encourage later retirement and promote innovation and investment
in R&D. Such policies are also necessary in order to limit the negative impact of ageing on long-term
growth prospects. Such policies may, however, take quite a long time to exert their impact as time
lags for policies to affect demographic structures are naturally relatively long, spanning up to several
decades.

ECB Working Paper 2088, July 2017                                                                        21
References Aksoy, Y., Basso, H., Smith, R., and Grasl, T. (2016). Demographic structure and macroeconomic trends. CEFifo Working Paper No. 5872. Arellano, M. and Bond, S. (1991). Some tests of specification for panel data: Monte Carlo evidence and an application to employment equations. Review of Economic Studies, 58(2):277–297. Backus, D., Cooley, T., and Henriksen, E. (2014). Demography and low-frequency capital flows. Journal of International Economics, 92(1):S94–S102. Bean, C., Broda, C., Kroszner, R., and Ito, T. (2015). Low for long? Causes and consequences of persistently low interest rates. The 17th Geneva Report on the World Economy (Geneva Reports on the World Economy). Bobeica, E., Lis, E., Nickel, C., and Sun, Y. (2017). Demographics and inflation. ECB Working Paper No. 2006. Borio, C. (2012). The financial cycle and macroeconomics: What have we learnt? BIS Working Paper No. 395. Borio, C. (2015). Revisiting three intellectual pillars of monetary policy received wisdom. Speech at Cato Institute. Borio, C. (2017). Secular stagnation or financial cycle drag? Keynote Speech at 33rd Economic Policy Conference, Washington DC. Borio, C., Kharroubi, E., Upper, C., and Zampolli, F. (2015). Labour reallocation and productivity dynamics: financial causes, real consequences. BIS Working Paper No. 534. Bruno, G. (2005). Approximating the bias of the lsdv estimator for dynamic unbalanced panel data sets. Economics Letters, 87(3):361–366. Bussolo, M., Koettl, J., and Sinnott, E. (2015). Golden aging: Prospects for healthy, active, and prosperous aging in Europe and Central Asia. World Bank Group. Carvalho, C., Ferrero, A., and Nechio, F. (2016). Demographics and real interest rates: Inspecting the mechanism. European Economic Review, 88:208–226. Christensen, J. and Rudebusch, G. (2017). A new normal for interest rates? Evidence from inflation- indexed debt. FED San Francisco Working Paper. Council of Economic Advisers (2015). Long-term interest rates: A survey. Council of Economic Advisers. Cúrdia, V., Ferrero, A., Ng, G., and Tambalotti, A. (2015). Has U.S. monetary policy tracked the efficient interest rate? Journal of Monetary Economics, 70(C):72–83. Eggertsson, G. and Mehrotra, N. (2014). A model of secular stagnation. NBER Working Paper No. 20547. European Commission (2015). The 2015 Ageing Report: Economic and budgetary projections for the 28 EU member states (2013-2060). European Economy Series 3/2015. ECB Working Paper 2088, July 2017 22
European System Risk Board (2016). Macroprudential policy issues arising from low interest rates and
  structural changes in the EU financial system. Technical report, European Systemic Risk Board.

Favero, C. and Galasso, V. (2016). Demographics and the secular stagnation hypothesis in Europe. In:
  After the crisis: Reform, recovery, and growth in Europe.

Favero, C., Gozluklu, A., and Yang, H. (2016). Demographics and the behavior of interest rates. IMF
  Economic Review, 64(4):732–776.

Ferrero, G. and Neri, S. (2017). Monetary policy in a low interest rate environment. Banca d’Italia
  Occasional Paper, forthcoming.

Gagnon, E., Johannsen, B., and Lopez-Salido, D. (2016). Understanding the new normal: The role of
 demogrpahics. FEDS Working Paper No. 2016-080.

Gerali, A. and Neri, S. (2017). Natural rates across the Atlantic. Banca d’Italia Working Paper,
 forthcoming.

Gordon, R. (2016). The rise and fall of American growth: The U.S. standard of living since the Civil
 War. Princeton University Press.

Gottfries, A. and Teulings, C. (2015). Can demography explain secular stagnation? VoxEU.org article.

Holston, K., Laubach, T., and Williams, J. (2017). Measuring the natural rate of interest: International
 trends and determinants. Journal of International Economics.

Ikeda, D. and Saito, M. (2014). The effects of demographic changes on the real interest rate in Japan.
  Japan and the World Economy, 32:37–48.

International Monetary Fund (2014). Perspectives on global real interest rates. World Economic
  Outlook, Ch. 3.

Jorda, O., Schularick, M., and Taylor, A. (2013). When credit bites back. Journal of Money, Credit
  and Banking, 45(2):3–28.

Juselius, M. and Takats, E. (2015). Can demography affect inflation and monetary policy? BIS Working
  Paper No. 485.

Kiley, M. and Roberts, J. (2017). Monetary policy in a low interest rate world. Brookings Papers on
  Economic Activity.

Kiviet, J. (1995). On bias, inconsistency, and efficiency of various estimators in dynamic panel data
  models. Journal of Econometrics, 68(1):53–78.

Krugman, P. (1998). It’s baaack: Japan’s slump and the return of the liquidity trap. Brookings Papers
  on Economic Activity, 29(2):137–206.

Lo, S. and Rogoff, K. (2015). Secular stagnation, debt overhang and other rationales for sluggish growth,
  six years on. BIS Working Paper No. 482.

Lu, J. and Teulings, C. (2016). Secular stagnation, bubbles, fiscal policy, and the introduction of the
  pill. CEPR Policy Insight No. 86.

ECB Working Paper 2088, July 2017                                                                      23
Mian, A., Sufi, A., and Verner, E. (2017). Household debt and business cycles worldwide. Quarterly
 Journal of Economics, forthcoming.

Praet, P. (2017). Is secular stagnation the new economic reality? Speech at policy panel entitled ”How
  to deal with potential secular stagnation?”, Banque de France.

Rachel, L. and Smith, T. (2015). Secular drivers of the global real interest rate. Bank of England Staff
  Working Paper No. 571.

Reinhart, C. and Reinhart, V. (2010). After the fall. NBER Working Paper No. 16334.

Summers, L. (2014). U.S. economic prospects: Secular stagnation, hysteresis, and the zero lower bound.
  Business Economics, 49(2):65–73.

United Nations (2015). World population prospects — Volume II: Demographic profiles, 2015 revision.
 United Nations.

Williams, J. (2016). Whither inflation targeting? Presentation to the HaYek Group, Reno, Nevada.

Yoon, J.-W., Kim, J., and Lee, J. (2014). Impact of demogrpahic changes on inflation and the macroe-
  conomy. IMF Working Paper No. 14/210.

ECB Working Paper 2088, July 2017                                                                     24
Table A1: Panel model estimates (1990-2015)

ECB Working Paper 2088, July 2017
                                    Note: The model has been estimated with cross-section (country) fixed effects on annual data spanning the 1990-2015 period. An LSDV estimation method has been
                                    employed for estimation. The model has been constrained to some extent, by excluding insignificant relationships resulting after a first, unconstrained estimation of the
                                    model. Intercept/fixed effects estimates are not presented here. See text for details.

25
Table A2: Significance estimates (p-values): counterfactual versus actual, 2006-2015 Note: Lower levels imply larger significance in the difference between the observed and the counterfactual average values along the 2006-2015 simulation period. Green, orange and light grey colors are a visual support to seeing p-values less than 1%, between 1%-5%, and between 5%-10%. Table A3: Significance estimates (p-values): counterfactual Scenario A versus Scenario B, 2016-2025 Note: Lower levels imply larger significance in the difference between the observed and the counterfactual average values. Green, orange and light grey colors are a visual support to seeing p-values less than 1%, between 1%-5%, and between 5%-10%. Table A4: Significance estimates (p-values): counterfactual Scenario A versus Scenario C, 2016-2025 Note: Lower levels imply larger significance in the difference between the observed and the counterfactual average values. Green, orange and light grey colors are a visual support to seeing p-values less than 1%, between 1%-5%, and between 5%-10%. ECB Working Paper 2088, July 2017 26
Acknowledgements
This work has benefited from useful discussions with Luca Metelli. The paper should not be reported as representing the views of the
Banca d'Italia or the European Central Bank (ECB). The views are those of the authors.

Giuseppe Ferrero
Banca d’Italia, Rome, Italy; email: giuseppe.ferrero@bancaditalia.it

Marco Gross
European Central Bank, Frankfurt am Main, Germany; email: marco.gross@ecb.europa.eu

Stefano Neri
Banca d’Italia, Rome, Italy; email: stefano.neri@bancaditalia.it

© European Central Bank, 2017
Postal address                   60640 Frankfurt am Main, Germany
Telephone                        +49 69 1344 0
Website                          www.ecb.europa.eu
All rights reserved. Any reproduction, publication and reprint in the form of a different publication, whether printed or produced
electronically, in whole or in part, is permitted only with the explicit written authorisation of the ECB or the authors.
This paper can be downloaded without charge from www.ecb.europa.eu, from the Social Science Research Network electronic library or
from RePEc: Research Papers in Economics. Information on all of the papers published in the ECB Working Paper Series can be found
on the ECB’s website.
ISSN                             1725-2806 (pdf)                       DOI                             10.2866/48753 (pdf)
ISBN                             978-92-899-2810-6 (pdf)               EU catalogue No                 QB-AR-17-100-EN-N (pdf)
You can also read


