WHIRLPOOL CORP /DE/ FORM 8-K
←
→
Page content transcription
If your browser does not render page correctly, please read the page content below
WHIRLPOOL CORP /DE/

                                 FORM          8-K
                                 (Current report filing)

Filed 05/04/17 for the Period Ending 05/04/17

  Address          WHIRLPOOL CNTR 2000 M 63
                   C/O CORPORATE SECRETARY
                   BENTON HARBOR, MI 49022-2692
Telephone          2699235000
        CIK        0000106640
    Symbol         WHR
 SIC Code          3630 - Household Appliances
   Industry        Appliances, Tools & Housewares
     Sector        Consumer Cyclicals
Fiscal Year        12/31

                                     http://www.edgar-online.com
                     © Copyright 2017, EDGAR Online, Inc. All Rights Reserved.
      Distribution and use of this document restricted under EDGAR Online, Inc. Terms of Use.
UNITED STATES
                                         SECURITIES AND EXCHANGE COMMISSION
                                                                            WASHINGTON, DC 20549

                                                                                    FORM 8-K
                                                                                 CURRENT REPORT

                                                              PURSUANT TO SECTION 13 OR 15(d) OF
                                                             THE SECURITIES EXCHANGE ACT OF 1934
                                                       Date of report (Date of earliest event reported) May 4, 2017

                                                       WHIRLPOOL CORPORATION
                                                                       (Exact name of registrant as Specified in Charter)

                                                    Delaware                                     1-3932                                38-1490038
                                   (State or Other Jurisdiction of Incorporation)      (Commission File Number)             (I.R.S. Employer Identification No.)

                                             2000 North M-63,
                                          Benton Harbor, Michigan                                                                      49022-2692
                                      (Address of principal executive offices)                                                          (Zip Code)

                                                               Registrant’s telephone number, including area code (269) 923-5000

Check the appropriate box below if the Form 8-K filing is intended to simultaneously satisfy the filing obligation of the registrant under any of the following provisions:

¨      Written communications pursuant to Rule 425 under the Securities Act (17 CFR 230.425)

¨      Soliciting material pursuant to rule 14a-12 under the Exchange Act (17 CFR 240.14a-12)

¨      Pre-commencement communications pursuant to Rule 14d-2(b) under the Exchange Act (17 CFR 240.14d-2(b))

¨      Pre-commencement communications pursuant to Rule 13e-4(c) under the Exchange Act (17 CFR 240.13e-4(c))

Indicate by check mark whether the registrant is an emerging growth company as defined in Rule 405 of the Securities Act of 1933 (§230.405 of this chapter) or Rule 12b-2 of the
Securities Exchange Act of 1934 (§240.12b-2 of this chapter).

Emerging growth company ¨

If an emerging growth company, indicate by check mark if the registrant has elected not to use the extended transition period for complying with any new or revised financial
accounting standards provided pursuant to Section 13(a) of the Exchange Act. ¨
Item 7.01. Regulation FD Disclosure.

A copy of material which will be used in investor presentations delivered by Whirlpool Corporation representatives from time to time beginning on May 4, 2017 is furnished as
Exhibit 99.1 to this Form 8-K. Exhibit 99.1 shall not be deemed “filed” for purposes of Section 18 of the Securities Exchange Act of 1934, as amended (the “Exchange Act”), or
otherwise subject to the liabilities under that Section and shall not be deemed to be incorporated by reference into any filing of the Company under the Securities Act of 1933, as
amended, or the Exchange Act.

Item 9.01. Financial Statements and Exhibits.

(d) Exhibits.

99.1     Investor Presentation Material
SIGNATURE

Pursuant to the requirements of the Securities Exchange Act of 1934, the registrant has duly caused this report to be signed on its behalf by the undersigned hereunto duly
authorized.

                                                                                WHIRLPOOL CORPORATION

                             Date: May 4, 2017                                  By:       /s/ BRIDGET K. QUINN
                                                                                Name: Bridget K. Quinn
                                                                                Title:   Corporate Secretary and Group Counsel
Investor Day – May 4, 2017 Whirlpool Corporation 2017 Investor Day New York Stock Exchange – May 4, 2017 EXHIBIT 99.1
Investor Day – May 4, 2017 Whirlpool Corporation CAUTIONARY STATEMENT 2 This pres entation contains forward-looking s tatements about Whirlpool Corporation and its cons olidated s ubs idiaries (“Whirlpool”) that s peak only as of this date. Whirlpool dis claims any obligation to update thes e s tatements . Forward-looking s tatements in this document may include, but are not limited to, s tatements regarding expected earnings per s hare, cas h flow, productivity and raw material prices . Many ris ks , contingencies and uncertainties could caus e actual res ults to differ materially from Whirlpool's forward-looking s tatements . Among thes e factors are: (1) intens e competition in the home appliance indus try reflecting the impact of both new and es tablis hed global competitors , including As ian and European manufacturers ; (2) Whirlpool's ability to maintain or increas e s ales to s ignificant trade cus tomers and the ability of thes e trade cus tomers to maintain or increas e market s hare; (3) Whirlpool's ability to maintain its reputation and brand image; (4) the ability of Whirlpool to achieve its bus ines s plans , productivity improvements , and cos t control objectives , and to leverage its global operating platform, and accelerate the rate of innovation; (5) Whirlpool's ability to obtain and protect intellectual property rights ; (6) acquis ition and inves tment-related ris ks , including ris ks as s ociated with our pas t acquis itions , and ris ks as s ociated with our increas ed pres ence in emerging markets ; (7) ris ks related to our international operations , including changes in foreign regulations , regulatory compliance and dis ruptions aris ing from political, legal and economic ins tability; (8) information technology s ys tem failures , data s ecurity breaches , network dis ruptions , and cybers ecurity attacks ; (9) product liability and product recall cos ts ; (10) the ability of s uppliers of critical parts , components and manufacturing equipment to deliver s ufficient quantities to Whirlpool in a timely and cos t-effective manner; (11) our ability to attract, develop and retain executives and other qualified employees ; (12) the impact of labor relations ; (13) fluctuations in the cos t of key materials (including s teel, res ins , copper and aluminum) and components and the ability of Whirlpool to offs et cos t increas es ; (14) Whirlpool’s ability to manage foreign
                                                                                                                                                                                                                                                                                                                                                                                                                                                                                                                                                                                                                                                                           currency fluctuations ; (15) inventory and other as s et ris k; (16) the uncertain global economy and changes in economic conditions which affect demand for our products ; (17) health care cos t trends , regulatory changes and variations between res ults and es timates that could increas e future funding obligations for pens ion and pos tretirement benefit plans ; (18) litigation, tax, and legal compliance ris k and cos ts , es pecially if materially different from the amount we expect to incur or have accrued for, and any dis ruptions caus ed by the s ame; (19) the effects and cos ts of governmental inves tigations or related actions by third parties ; and (20) changes in the legal and regulatory environment including environmental, health and s afety regulations . Additional information concerning thes e and other factors can be found in Whirlpool's filings with the Securities and Exchange Commis s ion, including the mos t recent annual report on Form 10-K, quarterly reports on Form 10-Q, and current reports on Form 8-K. Welcome, Introductions and Overview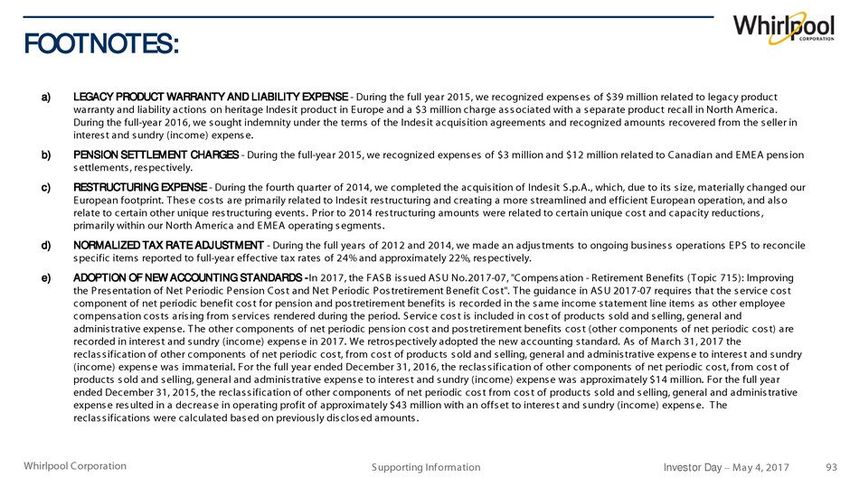
Investor Day – May 4, 2017 Whirlpool Corporation This pres entation includes certain non-GAAP financial meas ures , which we refer to as “ongoing bus ines s ” meas ures : Ongoing bus ines s operating profit (los s ), ongoing bus ines s operating margin, ongoing bus ines s earnings per diluted s hare, earnings before interes t and taxes (EBIT), ongoing bus ines s EBIT , ongoing bus ines s EBIT margin, EBIT margin, ongoing bus ines s s egment operating profit (los s ) and ongoing bus ines s s egment operating margin. Other non-GAAP financial meas ures included in this pres entation are free cas h flow, free cas h flow convers ion, free cas h flow as a percentage of net s ales , and net s ales (excluding currency) which is als o referred to as organic net s ales . P leas e refer to the s upporting information s ection of the pres entation for a reconciliation of thes e non- GAAP financial meas ures to the mos t directly comparable GAAP financial meas ures . 3 Welcome, Introductions and Overview USE OF NON-GAAP FINANCIAL MEASURES
Investor Day – May 4, 2017 Whirlpool Corporation OVERVIEW 4 Welcome, Introductions and Overview C. Conley 10:00 a.m. E.T. Commitment to Shareholder Value Creation J . Fettig 10:05 A Unique Global Strategic Pos ition to Create Value M. Bitzer 10:25 Compelling Regional Catalys ts to Grow Our Global Pos ition M. Bitzer 10:45 Our Approach to Value Creation J . Peters 11:15 Clos ing Remarks J . Fettig 11:35 Break 10 minutes Executive Q&A All 11:50 a.m. – 12:50 p.m. Break 10 minutes Lunch All 1:00 – 2:00 p.m. Welcome, Introductions and Overview
Investor Day – May 4, 2017 Whirlpool Corporation Welcome, Introductions and Overview J eff Fettig Chairman and Chief Executive Officer Marc Bitzer Pres ident and Chief Operating Officer J im Peters Executive Vice Pres ident and Chief Financial Officer 5 MANAGEMENT TEAM
Investor Day – May 4, 2017 Whirlpool Corporation 6 Dave Szczupak Sam Wu J oȃo Brega EVP and Pres ident, Whirlpool Latin America Es ther Berrozpe Galindo EVP and Pres ident, Whirlpool Europe, Middle Eas t & Africa J oe Liotine EVP and Pres ident, Whirlpool North America Welcome, Introductions and Overview Pres ident, Whirlpool As ia EVP, Global Product Organization MANAGEMENT TEAM
Investor Day – May 4, 2017 Whirlpool Corporation 2017 INVESTOR DAY – AGENDA 7 1. A Commitment to Shareholder Value Creation 2. A Unique Global Strategic Position to Create Value 3. Compelling Regional Catalysts to Grow Our Global Position 4. Our Approach to Shareholder Value Creation 5. Closing Remarks, Q&A A Commitment to S hareholder Value Creation
Investor Day – May 4, 2017 Whirlpool Corporation ACHIEVING THE VISION: THE BEST BRANDED CONSUMER PRODUCTS COMPANY 8 2010 – 2014 • Growth • Margin Expans ion • Cas h Generation 2015 – 2018 • 30% Larger Global P latform • Product & Brand Innovation • Bes t Cos t Structure Beyond 2018 • Unique Global Strategic Pos ition • Compelling Regional Catalys ts • Improved Cas h Convers ion A Commitment to S hareholder Value Creation
Investor Day – May 4, 2017 Whirlpool Corporation Positioned to Deliver Total Shareholder Return (TSR) in the Top Quartile of the S&P 500 9 A COMMITMENT TO SHAREHOLDER VALUE CREATION A Commitment to S hareholder Value Creation 3-5% Annual Organic Net Sales Growth 10%+ EBIT Margin (by 2020) 5-6% FCF as % of Net Sales (by 2018) A Unique Global Strategic Position Compelling Regional Catalysts • # 1 Globally and # 1 or # 2 in almos t all parts of the world • Bes t brand portfolio in indus try • Rich legacy of innovation with robus t new product pipeline • Relentles s focus on cos t takeout • North America: Strong value creation in a healthy marketplace • EMEA: Fully realizing benefits of Indes it acquis ition • Latin America: Fully leveraging optimized cos t s tructure • Asia: Well-pos itioned to benefit from India / China growth
Investor Day – May 4, 2017 Whirlpool Corporation LONG-TERM HISTORICAL VALUE CREATION 10 1990 10,000 1,000 100 10 2010 2005 2000 1995 1985 1980 1975 TSR index: 1968 = 100 1986 acquired 2014 acquired 2006 acquired 2016 1968 Average annual TSR 1997 acquired A Commitment to S hareholder Value Creation S&P 500: 9.9% WHR: 9.7%
Investor Day – May 4, 2017 Whirlpool Corporation A STRONG TRACK RECORD OF SHAREHOLDER RETURNS 11 10-Year 5-Year 1-Year 3rd Quartile Median Whirlpool 11% 1st Quartile 3rd Quartile Median 1st Quartile Whirlpool 34% Whirlpool 27% 3rd Quartile Median 1st Quartile Annualized TSR of S&P 500 A Commitment to S hareholder Value Creation
Investor Day – May 4, 2017 Whirlpool Corporation TSR IS DRIVEN BY MARGIN EXPANSION AND FCF YIELD 12 5y EPS growth, % ann. 5y ∆ EVA, % 5y TSR (avg. price), % ann. 5y ∆ ROIC, % 5y EBIT growth, % ann. 5y avg. EVA, % 5y iTSR, % ann. 5y avg. ROIC, % R2 = 0.31 5y TS R, % ann. 5y TS R, % ann. 5y TS R, % ann. 5y TS R, % 5y TS R, % ann. 5y TS R, % ann. 5y TS R, % ann. 5y TS R, % R2 = 0.49 R2 = 0.25 R2 = 0.29 R2 = 0.67 R2 = 0.80 Profit growth Return on capital Economic profit Value creation R2 = .24 R2 = .32 EBIT Growth & FCF Yield A Commitment to S hareholder Value Creation
Investor Day – May 4, 2017 Whirlpool Corporation WE HAVE DELIVERED STRUCTURAL MARGIN EXPANSION 13 7.3% 6.9%6.9%6.8% 5.3% 2.6% 4.5% 7.4 – 8.0% 2016 2010 2011 2012 2015 2014 2017F 2013 Ongoing EBIT Margin A Commitment to S hareholder Value Creation
Investor Day – May 4, 2017 Whirlpool Corporation FCF GROWTH MASKED BY NON-STRUCTURAL IMPACTS 14 $230 $690 $854 $620 $630 $1,000 Free Cash Flow Restructuring, Pension Funding, Legal Payments 2017F $1,280 2016 $911 2015 $956 2014 $1,235 2013 $940 2012 $928 2011 $674 -$55 FCF Convers ion -34% 41% 85% 94% 63% 58% ~85% A Commitment to S hareholder Value Creation
Investor Day – May 4, 2017 Whirlpool Corporation Delivering These Goals Will Drive Top-Quartile TSR and 2-3pts ROIC Improvement 15 OUR LONG-TERM VALUE CREATION FRAMEWORK A Commitment to S hareholder Value Creation Profitable Growth Margin Expansion Cash Conversion Innovation fueled growth at or above the market Drive cos t and mix to grow profitably As s et efficiency converts profitable growth to cas h 3-5% Annual Organic Net Sales Growth 10%+ EBIT Margin (by 2020) 5-6% FCF as % of Net Sales (by 2018)
Investor Day – May 4, 2017 Whirlpool Corporation 2017 INVESTOR DAY – AGENDA 16 1. A Commitment to Shareholder Value Creation 2. A Unique Global Strategic Position to Create Value 3. Compelling Regional Catalysts to Grow Our Global Position 4. Our Approach to Shareholder Value Creation 5. Closing Remarks, Q&A A Unique Global S trategic Pos ition to Create Value
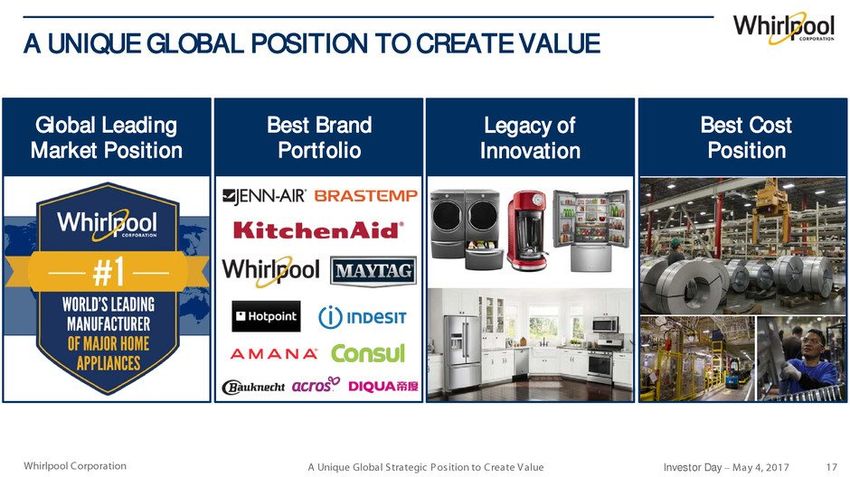
Investor Day – May 4, 2017 Whirlpool Corporation A UNIQUE GLOBAL POSITION TO CREATE VALUE 17 Global Leading Market Position Best Brand Portfolio Legacy of Innovation Best Cost Position A Unique Global S trategic Pos ition to Create Value
Investor Day – May 4, 2017 Whirlpool Corporation GLOBAL LEADING SHARE POSITION 18 U.S. Brazil U.K. Canada Mexico China W H R W H R W H R W H R # 2 # 3 # 4 # 2 # 3 # 4 # 2 # 3 # 1 # 2 # 4 $9.9B $1.9B $0.8B $0.9B $0.8B $0.5B WHR Revenue Market Share WHR Revenue Market Share W H R W H R # 2 # 3 # 4 # 2 # 3 # 4 # 3 # 4 # 4 # 3 # 2 # 3 # 4 W H R Italy $0.6B Russia $0.4B # 2 # 3 # 4 W H R France $0.6B W H R India $0.5B W H R # 2 # 4 # 1 2016 Actual A Unique Global S trategic Pos ition to Create Value # 1
Investor Day – May 4, 2017 Whirlpool Corporation Pre-2015 Slowdown, Emerging Markets Contributed an Additional ~$300M in Operating Profit 19 A BALANCE OF DEVELOPED AND EMERGING MARKETS 78% 81% 22% 19% Emerging Markets 2016 Sales Developed Markets 2016 Op. Profit 2013 Emerging Markets (Pro forma) 27% 40% A Unique Global S trategic Pos ition to Create Value
Investor Day – May 4, 2017 Whirlpool Corporation Brand Portfolio Targets Over 90% of Consumers, and Includes 7 with More Than $1B in Sales 20 BEST GLOBAL BRAND PORTFOLIO A Unique Global S trategic Pos ition to Create Value Premium (15%) % of Net Sales Mass (75%) Value (10%)
Investor Day – May 4, 2017 Whirlpool Corporation A LEGACY OF INNOVATION… 21 1911 1st Electric Wringer Washer 1910 1920 1930 1940 2010 2000 1990 1980 1950 1960 1970 1919 1st Stand Mixer 1949 1st Side-by-Side Refrigerator 1957 1st Bottom Mount Refrigerator 1967 1st Countertop Microwave 1961 1st Self-Ventilated Cooktop 1998 1st Energy Efficient Top-Load Washer 1999 1st Large Capacity Front-Load Washer 2008 1st Top-Load Pair with Steam Cycle 2006 1st FDBM with Ice and Water on Door 2006 1st French-Door Built-In Refrigerator A Unique Global Strategic Position to Create Value
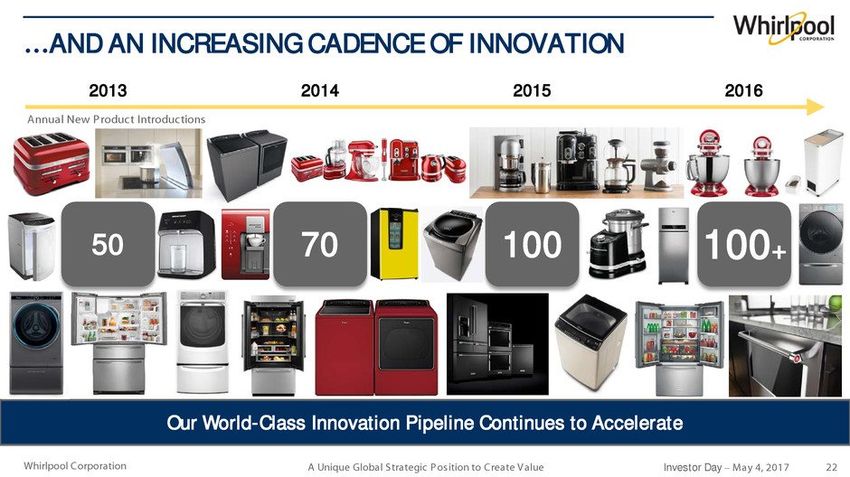
Investor Day – May 4, 2017 Whirlpool Corporation Our World-Class Innovation Pipeline Continues to Accelerate 22 …AND AN INCREASING CADENCE OF INNOVATION A Unique Global S trategic Pos ition to Create Value 2013 2016 2015 2014 Annual New Product Introductions 100+ 50 70 100
Investor Day – May 4, 2017 Whirlpool Corporation CONSISTENT INNOVATION FUNDING 23 CAPEX R&D 5.2% 2007 5.0% 2006 5.6% 2016 6.1% 2015 6.1% 2014 6.4% 2013 6.2% 2012 5.6% 2011 6.4% 2010 6.1% 2009 5.9% 2008 % of Net Sales A Unique Global S trategic Pos ition to Create Value
Investor Day – May 4, 2017 Whirlpool Corporation INNOVATION EXPRESSED IN LEADING GLOBAL DESIGN 24 A Unique Global S trategic Pos ition to Create Value INTRODUCING WHIRLPOOL GLOBAL DESIGN A new line of Whirlpool brand appliances offering an array of innovative features, designs and finishes to fit the style of your family, culture and home. Delivered through our global innovation and design programs.
Investor Day – May 4, 2017 Whirlpool Corporation INNOVATION IN CONNECTED APPLIANCES 25 Connected Appliances A Unique Global S trategic Pos ition to Create Value Winning Collaborations 2020F 2M 2017F 150K 2015 3K Unit Volume
Investor Day – May 4, 2017 Whirlpool Corporation DELIVERING BETTER CARE THROUGH SMART APPLIANCES 26 Touchscreen Learns & Adapts • Consistent Navigation Across Products • Automatic Updates and Upgrades • Proximity Sensor Remote Connectivity Smart App & Scan-to-Cook Voice Control with Smart Home Assistants • Interact with Appliances from Mobile Devices • Two Way Service Communication • Scan Barcodes for Cooking Instructions • “Tell Whirlpool” to Set Mode or Start Timers • “Ask Whirlpool” for Remaining Time, Current Temperature or Filter Status • Hands-free Interaction Removes Complexity A Unique Global Strategic Position to Create Value
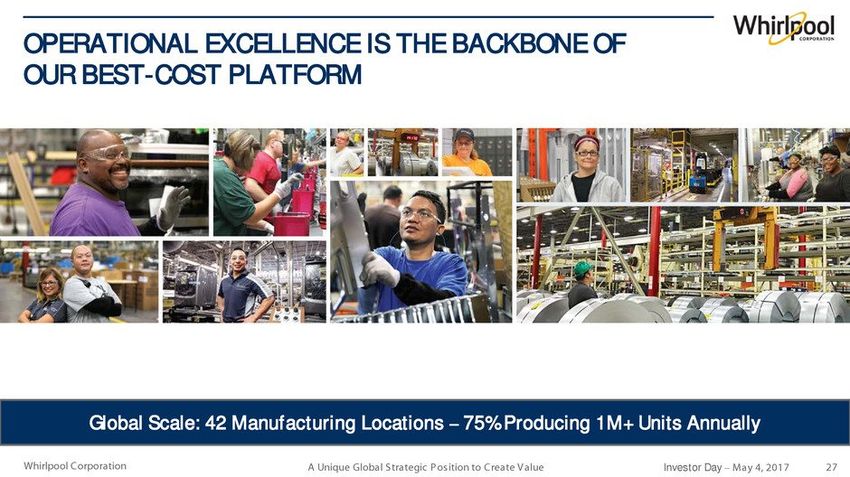
Investor Day – May 4, 2017 Whirlpool Corporation Global Scale: 42 Manufacturing Locations – 75% Producing 1M+ Units Annually 27 OPERATIONAL EXCELLENCE IS THE BACKBONE OF OUR BEST-COST PLATFORM A Unique Global S trategic Pos ition to Create Value
Investor Day – May 4, 2017 Whirlpool Corporation Well-Positioned to Manage Volatility in Currency and Raw Material Inflation 28 RELENTLESS FOCUS ON COST TAKEOUT -$75 $600 2013 2012 $200 2010 2011 $600 $650 2009 $475 2008 2007 $350 $675 2006 2017F $475 2016 $375 $450 2015 2014 $375 Raw Material Inflation Cost Productivity Restructuring Benefits • Fundamentally lower breakeven point • Generational res tructuring programs nearing completion • Strong track record of cos t productivity over time A Unique Global S trategic Pos ition to Create Value USD Millions
Investor Day – May 4, 2017 Whirlpool Corporation MANY COST OPTIMIZATION OPPORTUNITES REMAIN 29 COGS: $17B ~80% variable SG&A: $2B Key Drivers Advertis ing & Promotions (25%) Adminis tration (75%) Focus Areas • Long-term s upplier contracts and s elective hedging • Des ign to value optimization • Automation and world clas s manufacturing • Improved as s embly yields • Reducing s crap cons is tently • Predictive inventory management • Sys tem and des ign complexity reduction • Global product architecture cons olidation • Digital and mobile advertis ing • Organizational s treamlining Raw materials (60%) Manufacturing / Quality (25%) Logis tics (10%) Res earch & Development (5%) A Unique Global S trategic Pos ition to Create Value
Investor Day – May 4, 2017 Whirlpool Corporation 2017 INVESTOR DAY – AGENDA 30 1. A Commitment to Shareholder Value Creation 2. A Unique Global Strategic Position to Create Value 3. Compelling Regional Catalysts to Grow Our Global Position 4. Our Approach to Shareholder Value Creation 5. Closing Remarks, Q&A Compelling Regional Catalys ts to Grow Our Global Pos ition
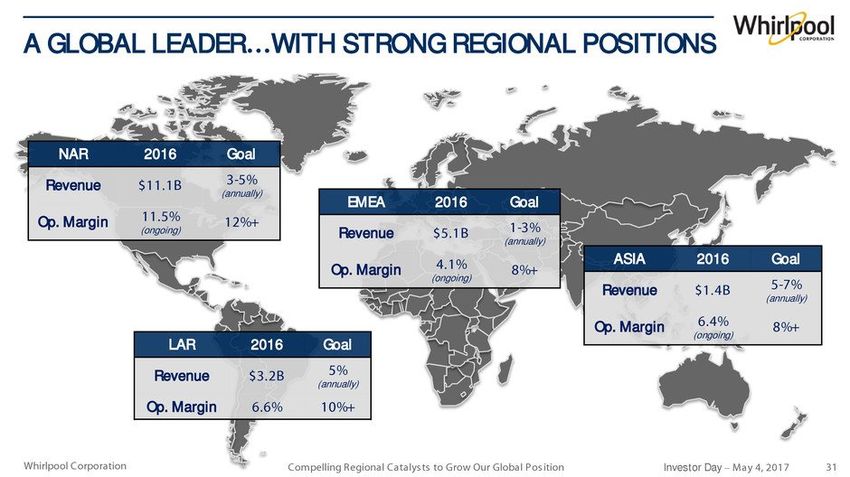
Investor Day – May 4, 2017 Whirlpool Corporation A GLOBAL LEADER…WITH STRONG REGIONAL POSITIONS 31 NAR 2016 Goal Revenue $11.1B 3-5% (annually) Op. Margin 11.5% (ongoing) 12%+ LAR 2016 Goal Revenue $3.2B 5% (annually) Op. Margin 6.6% 10%+ ASIA 2016 Goal Revenue $1.4B 5-7% (annually) Op. Margin 6.4% (ongoing) 8%+ EMEA 2016 Goal Revenue $5.1B 1-3% (annually) Op. Margin 4.1% (ongoing) 8%+ Compelling Regional Catalys ts to Grow Our Global Pos ition
Investor Day – May 4, 2017 Whirlpool Corporation NORTH AMERICA… STRONG VALUE CREATION IN A HEALTHY MARKETPLACE 32 Healthy marketplace with a lot of runway left Industry-leading brand portfolio and strong innovation pipeline Well-positioned to win in a changing retail environment At the forefront of redefining what “product” is NAR 2016 Goal Revenue $11.1B 3-5% (annually) Op. Margin 11.5% (ongoing) 12%+ Compelling Regional Catalys ts to Grow Our Global Pos ition
Investor Day – May 4, 2017 Whirlpool Corporation LONG-TERM U.S. DEMAND TRENDS REMAIN POSITIVE 33 50,000 54,000 0 2,000 46,000 42,000 38,000 34,000 2006 2004 2002 2018F 2016 2014 2012 2020F 2008 2010 +6.0% +9.4% +5.5% +5.6% +3% +3% +3% +4-6% Compelling Regional Catalys ts to Grow Our Global Pos ition Indus try Volume (Thous ands )
Investor Day – May 4, 2017 Whirlpool Corporation Signif icant Levels of Pent-Up Demand Due to Constrained Supply of Homes and Capital 34 U.S. HOUSING RECOVERY STRONG AND FAR FROM PEAK 200M 2016 2004 1992 1980 6,000 4,000 2,000 350M 300M 250M 8,000 Existing Home Sales U.S. Population 500 1,000 1,500 2,000 2,500 2016 2004 1992 1980 Housing Starts Structural Requirement Compelling Regional Catalys ts to Grow Our Global Pos ition
Investor Day – May 4, 2017 Whirlpool Corporation Delayed Under-35 Home Ownership Expected to Rebound in Coming Years 35 U.S. HOUSEHOLD FORMATION YET TO RECOVER 33% 36% 39% 42% 45% 2009 2015 2012 2006 2000 2003 1994 1997 Under 35 Home Ownership Rate Historical Avg 350M 300M 250M 100M 50M 2016 2004 1992 1980 U.S. Households U.S. Population Compelling Regional Catalys ts to Grow Our Global Pos ition
Investor Day – May 4, 2017 Whirlpool Corporation STRONG BRANDS AND CONNECTED INNOVATION 36 Brand Strength Product Innovation PREMIUM MASS VALUE LAUNDRY KITCHEN ADJACENT 80 100 110 165 300 Brands Target >90% of Consumers with ~40% Balance of Sale More Than 100 New Product Launches in 2016 Target Price Index Compelling Regional Catalys ts to Grow Our Global Pos ition
Investor Day – May 4, 2017 Whirlpool Corporation Our Branded Balance of Sale is Consistent Across Outlets 37 POSITIONED FOR A CHANGING RETAIL ENVIRONMENT… 100% 80% 60% 40% 20% All Other Independent Retailers 2016 2014 2012 2010 2008 2006 2004 2002 2000 Retail Outlet Share Compelling Regional Catalys ts to Grow Our Global Pos ition
Investor Day – May 4, 2017 Whirlpool Corporation Gained 2+ Points of Branded Share in 2016, Primarily Maytag and KitchenAid 38 …WITH OUR INDUSTRY-LEADING BRAND PORTFOLIO Quarterly Branded Share of U.S . Retail Q2 2016 Q1 2016 Q3 2016 Q4 2016 Q2 2015 Q1 2017 Q3 2015 Q4 2015 Compelling Regional Catalys ts to Grow Our Global Pos ition
Investor Day – May 4, 2017 Whirlpool Corporation Digitally Enabled Services Increasingly Enhance Appliance Experience 39 AT THE FOREFRONT OF REDEFINING WHAT “PRODUCT” IS Compelling Regional Catalys ts to Grow Our Global Pos ition Supply Replenishment Connected Kitchen Home Energy Management Post-Purchase Experience Areas of Focus Winning Collaborations
Investor Day – May 4, 2017 Whirlpool Corporation “CONNECTED KITCHEN” IS A SEAMLESS EXPERIENCE 40 Compelling Regional Catalys ts to Grow Our Global Pos ition
Investor Day – May 4, 2017 Whirlpool Corporation EUROPE, MIDDLE EAST AND AFRICA (EMEA)… MOVING TOWARDS FULLY REALIZING ACQUISITION BENEFITS 41 Indesit acquisition gives us a strong structural position In the final, but most complex and challenging phase of integration Long-term growth through best products and brand portfolio Tremendous growth opportunity in MEA, small appliances and new business model EMEA 2016 Goal Revenue $5.1B 1-3% (annually) Op. Margin 4.1% (ongoing) 8%+ Compelling Regional Catalys ts to Grow Our Global Pos ition
Investor Day – May 4, 2017 Whirlpool Corporation A WINNING COUNTRY PORTFOLIO 42 Germany Russia U.K. France Italy Spain Poland Turkey Country by Industry Size Whirlpool Corp Share Position Compelling Regional Catalys ts to Grow Our Global Pos ition
Investor Day – May 4, 2017 Whirlpool Corporation Laundry Kitchen Front-Load Laundry A COMPLETE “BEST OF BEST” PRODUCT PORTFOLIO 43 Top-Load Laundry Washer/Dryer Combo Built-In Cooking Freestanding Range Microwaves Refrigeration Small Domestic Appliances Compelling Regional Catalys ts to Grow Our Global Pos ition
Investor Day – May 4, 2017 Whirlpool Corporation Delivering on Commitments Despite ~20% Currency Devaluation 44 DELIVERING COST BENEFITS OF INDESIT ACQUISITION Restructuring Expenses Cumulative Acquisition Benefits 80 2017 15 5 11 0 2016 14 0 20 0 2015 15 0 30 0 2014 15 15 2019 45 2018 Current Expectations 2014 Investor Day Targets 2019 39 0 35 0 2018 36 5 35 0 2017 31 0 3 50 2016 25 5 25 0 2015 80 80 Millions of USD Compelling Regional Catalys ts to Grow Our Global Pos ition
Investor Day – May 4, 2017 Whirlpool Corporation Substantial Macro-Driven Revenue Decline in Indesit’s Two Largest Countries 45 CHANGES IN ENVIRONMENT MASKED SYNERGY BENEFITS All Other U.K. / Russia 2016 $5.1 2014 $6.4 Demand Impact • ~20% decline in Rus s ia (2015) • ~25% decline in U.K. pos t-Brexit (2016) Currency Impact • ~20% devaluation of Britis h Pound (2015, 2016) • ~40% devaluation of Rus s ian Ruble (2015, 2016) Revenue in USD Billions Currency Impact • ~20% devaluation of Euro (2015, 2016) Compelling Regional Catalys ts to Grow Our Global Pos ition
Investor Day – May 4, 2017 Whirlpool Corporation Phase 2 Phase 3 Phase 1 2017 IS THE MOST COMPLEX YEAR OF INTEGRATION 46 2015 2017 2018+ Purchasing Legal Entity Mergers / System Integration (SG&A) Brand / Product Integration Platform / Footprint Rationalization • Governance / management s ys tems • Simplified organization • SG&A reduction • Procurement s ynergies Focus Synergies $80 million $175 million $135 million • Footprint cons olidation plan • Product architecture cons olidation • 1s t level of s ys tem integration • Execute factory cons olidation • Complete product platform integration • Complete s ys tem integration 2016 Compelling Regional Catalys ts to Grow Our Global Pos ition
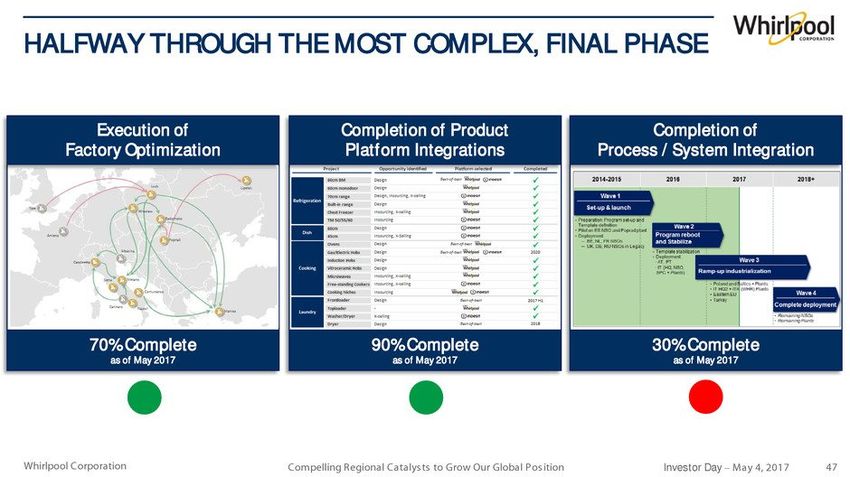
Investor Day – May 4, 2017 Whirlpool Corporation HALFWAY THROUGH THE MOST COMPLEX, FINAL PHASE 47 Execution of Factory Optimization Completion of Product Platform Integrations Completion of Process / System Integration 70% Complete as of May 2017 90% Complete as of May 2017 30% Complete as of May 2017 Compelling Regional Catalys ts to Grow Our Global Pos ition
Investor Day – May 4, 2017 Whirlpool Corporation PRODUCT AVAILABILITY IMPACTED OUR VOLUMES 48 80 120 160 200 Jun-16 Sep-16 Oct-16 Dec-16 Baseline Feb-17 Mar-17 Nov-16 Aug-16 Jul-16 Late Orders Jan-17 Units (Thous ands ) Headquarters System Integration Platform / Footprint Rationalization Begins Major Appliance Volume Change (Year over Year) +3.1% -6.7% -6.5% -4.9% -11.6% -7.4% -6.7% -12.8% -8.0% +2.6% Compelling Regional Catalys ts to Grow Our Global Pos ition
Investor Day – May 4, 2017 Whirlpool Corporation A SIMPLIFIED AND WINNING BRAND PORTFOLIO 49 Pre-Integration Focus (12 Brands) Post-Integration Focus (6 Brands) PREMIUM MASS VALUE Compelling Regional Catalys ts to Grow Our Global Pos ition
Investor Day – May 4, 2017 Whirlpool Corporation New U.K. Model …WITH MANY ADDITIONAL GROWTH OPPORTUNITIES 50 83% 67% 10% 24% 7% 9%MEA E. Europe W. Europe 2016 2013 % of Net Sales Units Geographic Expansion KitchenAid SDA - EMEA +20% CAGR 2017F 2015 2013 2011 2009 Direct delivery to f inal consumer Add-on services offered during delivery Service agreements and post-sales activity “No stock” model for trade Compelling Regional Catalys ts to Grow Our Global Pos ition
Investor Day – May 4, 2017 Whirlpool Corporation (ongoing) STRUCTURALLY POSITIONED FOR 8%+ LONG-TERM OPERATING MARGINS 51 0.5% 0.5% 1.5% 1.5% 2020F 8%+ Price / Mix Adjacent Business / MEA Growth Total Cost Takeout U.K. / Russia Recovery 2016 4.1% (Approximate impact) Compelling Regional Catalys ts to Grow Our Global Pos ition
Investor Day – May 4, 2017 Whirlpool Corporation LATIN AMERICA…FULLY LEVERAGING OPTIMIZED COST STRUCTURE AS THE MARKET BEGINS TO RECOVER 52 Long-term demand fundamentals are beginning to re-emerge Leading brands and product innovation New business models in Water and Direct-to-Consumer Growth potential beyond Brazil LAR 2016 Goal Revenue $3.2B 5% (annually) Op. Margin 6.6% 10%+ Compelling Regional Catalys ts to Grow Our Global Pos ition
Investor Day – May 4, 2017 Whirlpool Corporation Industry Demand Has Declined More Than 30% Since 2012 Peak 53 A HISTORIC DROP IN BRAZIL APPLIANCE DEMAND -31% 2015 2010 2005 2000 Industry at 2007-2008 levels Brazil T9 Indus try Volumes Compelling Regional Catalys ts to Grow Our Global Pos ition
Investor Day – May 4, 2017 Whirlpool Corporation A Three-Year Slowdown is on the Cusp of a Recovery 54 BEGINNING TO SEE SIGNS OF DEMAND REBOUNDING May-17 Sep-14 Jan-16 Sep-14 May-17 Jan-16 Brazil Inflation Brazil Cons umer Confidence Compelling Regional Catalys ts to Grow Our Global Pos ition
Investor Day – May 4, 2017 Whirlpool Corporation Through Strong Actions, Our Margins Have Rebounded Despite the Economic Downturn 55 OUR BUSINESS REMAINS STRUCTURALLY HEALTHY 1Q17 4Q16 8.3% 3Q16 5.8% 2Q16 6.1% 1Q16 6.1% 4Q15 6.8% 3Q15 4.4% 2Q15 4.2% 8.3% Latin America Operating Margin Compelling Regional Catalys ts to Grow Our Global Pos ition
Investor Day – May 4, 2017 Whirlpool Corporation Strength of the Top Two Most Preferred Appliance Brands in Brazil 56 OUR LEADING BRANDS ARE WELL-POSITIONED SUPER PREMIUM (~1%) PREMIUM (2%) MASS PREMIUM (15%) MASS (45%) VALUE (37%) Mos t preferred appliance brand in Brazil, recognized for iconic des ign Second mos t preferred appliance brand in Brazil, found in nearly 60 percent of Brazilian homes Most Preferred #1 in Brazilian Homes Compelling Regional Catalys ts to Grow Our Global Pos ition
Investor Day – May 4, 2017 Whirlpool Corporation NEW ADJACENT BUSINESS MODELS 57 Water Purif ier Subscription Model Subs criber Bas e (Thous ands ) 378 268 190169 197 137 90 2019F 2018F 2017F 2016 2015 2012 2008 55 32 14 6 2019F 2018F 2017F 2016 25 13 3 1 2019F 2018F 2017F 2016 Subs criber Bas e (Thous ands ) Caps ule Volume (Millions ) B.Blend Compelling Regional Catalys ts to Grow Our Global Pos ition
Investor Day – May 4, 2017 Whirlpool Corporation We Are Well-Prepared to Succeed as Consumer Preferences Shift 58 NEW BUSINESS MODELS IN DIRECT TO CONSUMER B2B Marketplace • Retail agency model Brand Store • Bras temp / Cons ul e-commerce s ite • 3rd larges t in Brazil • 77% net promoter s core Compra Certa • Member bas ed buying club 1.0 0.9 0.8 0.7 2016 0.6 0.8 2014 0.7 0.6 2012 0.5 0.4 2010 0.3 0.2 2008 0.1 2018F 2020F Hotels/B2B Door to Door Compra Certa Brand Stores Marketplace Units (Millions ) Compelling Regional Catalys ts to Grow Our Global Pos ition
Investor Day – May 4, 2017 Whirlpool Corporation STRONG GROWTH POTENTIAL BEYOND BRAZIL 59 Brazil LAR International Growth through: • Appliance penetration • J oint Ventures • Alliances • Strong organic growth Indus try s ize: 27M units
Investor Day – May 4, 2017 Whirlpool Corporation ASIA…WELL-POSITIONED FOR INDIA / CHINA GROWTH 60 Appliance demand in China has been suffering China growth opportunity from distribution expansion Robust long-term demand in India Our brand in India is well-positioned to benefit ASIA 2016 Goal Revenue $1.4B 5-7% (annually) Op. Margin 6.4% (ongoing) 8%+ Compelling Regional Catalys ts to Grow Our Global Pos ition
Investor Day – May 4, 2017 Whirlpool Corporation OUR ASIA REGION IS LARGELY CHINA AND INDIA 61 China ~$900M India ~$500M All other ~$50M Compelling Regional Catalys ts to Grow Our Global Pos ition
Investor Day – May 4, 2017 Whirlpool Corporation Well-Positioned to Capitalize on Future Growth 62 STRONG DEMOGRAPHIC GROWTH OPPORTUNITY CAGR through 2021 8% CAGR through 2021 12% 63.7 14.6 42% Industry T2 Volumes Appliance Penetration Demographics China India 19% (middle / upper clas s growth rate) Compelling Regional Catalys ts to Grow Our Global Pos ition
Investor Day – May 4, 2017 Whirlpool Corporation …Yet Chinese Appliance Industry is Three Times Larger Than U.S. 63 CHINA DEMAND DOWN MORE THAN 15% SINCE 2011… -3%-4%-4% -6% 7% -11% 5% 2016 2017F 2015 2014 2013 2012 2011 T2 Indus try Unit Demand Growth Compelling Regional Catalys ts to Grow Our Global Pos ition
Investor Day – May 4, 2017 Whirlpool Corporation Growth Through Distribution Expansion Remains Very Attractive 64 …BUT GROWTH OPPORTUNITIES IN CHINA ARE STRONG 2016 2014 ~30K ~3K 20% 15% 72% 70% 8% 15% 2014 2016 48% 63% 52% 37% Tier 2+ 2014 2016 Tier 1 Revenue by Brand Whirlpool Brand Growth Distribution Expansion Growth Outside Tier 1 Number of Outlets Revenue by City T iers Compelling Regional Catalys ts to Grow Our Global Pos ition
Investor Day – May 4, 2017 Whirlpool Corporation Whirlpool Brand is Well-Positioned for Growth 65 STRONG GROWTH OPPORTUNITIES IN INDIA 10% 21% 11%12% 2% -4% 2013 2014 2015 2016 2017F 2012 Robust Demand Trends 23% 15% 2016 Market Share 2016 Brand Preference Brand Preference Exceeds Share T2 Indus try Unit Demand Growth Compelling Regional Catalys ts to Grow Our Global Pos ition
Investor Day – May 4, 2017 Whirlpool Corporation 2017 INVESTOR DAY – AGENDA 66 1. A Commitment to Shareholder Value Creation 2. A Unique Global Strategic Position to Create Value 3. Compelling Regional Catalysts to Grow Our Global Position 4. Our Approach to Shareholder Value Creation 5. Closing Remarks, Q&A Our Approach to S hareholder Value Creation
Investor Day – May 4, 2017 Whirlpool Corporation Delivering These Goals Will Drive Top-Quartile TSR and 2-3pts ROIC Improvement 67 OUR LONG-TERM VALUE CREATION FRAMEWORK Profitable Growth Margin Expansion Cash Conversion Our Approach to S hareholder Value Creation Innovation fueled growth at or above the market Drive cos t and mix to grow profitably As s et efficiency converts profitable growth to cas h 3-5% Annual Organic Net Sales Growth 10%+ EBIT Margin (by 2020) 5-6% FCF as % of Net Sales (by 2018)
Investor Day – May 4, 2017 Whirlpool Corporation Multiple Margin Levers to Deliver 10%+ EBIT Margin 68 ONGOING EBIT MARGIN EXPANSION Impact Performance Drivers 2016 Ongoing Business EBIT Margin 7.3% Total Cos t Take Out (inclus ive of raw material inflation) 2 – 3 • Ongoing Cos t Productivity Volume Leverage 1 • Emerging Market Growth • U.S. Hous ehold Formation Price / Mix 0.5 – 1 • New Product Launches • Adjacent Bus ines s Growth Marketing, Technology and Product Inves tments (1) – (1.5) • Product and Brand Innovation • Brand Awarenes s 2020 EBIT Margin 10%+ Our Approach to S hareholder Value Creation (Approximate Impact)
Investor Day – May 4, 2017 Whirlpool Corporation Reduction of Non-structural Items FOCUS ON IMPROVING FCF CONVERSION 69 2018F ~90% 2017F ~85% 2016 58% FCF Conversion 3-5% Annual Organic Net Sales Growth 10%+ EBIT Margin (by 2020) Cash Earnings 3-4% Working Capital % of Net Sales +2-3pts Return on Invested Capital Asset Efficiency • Res tructuring • Pens ion contributions • Legacy product warranty expens es Key Drivers Our Approach to S hareholder Value Creation
Investor Day – May 4, 2017 Whirlpool Corporation Executive Compensation and Project Decisions are Focused on Delivering TSR 70 TSR DRIVERS BUILT INTO OUR MANAGEMENT SYSTEMS Regional & Executive Pay At Risk Decision Making Process EBIT FCF ROIC Key Drivers of Shareholder Return are Anchors of Compensation ROIC Payback Measures Attractiveness Measures Risk Our Approach to S hareholder Value Creation
Investor Day – May 4, 2017 Whirlpool Corporation FCF GROWTH MASKED BY NON-STRUCTURAL IMPACTS 71 $230 $690 $854 $620 $630 $1,000 Free Cash Flow Restructuring, Pension Funding, Legal Payments 2017F $1,280 2016 $911 2015 $956 2014 $1,235 2013 $940 2012 $928 2011 $674 -$55 FCF Convers ion -34% 41% 85% 94% 63% 58% ~85% Our Approach to S hareholder Value Creation
Investor Day – May 4, 2017 Whirlpool Corporation DISCIPLINED APPROACH TO CAPITAL ALLOCATION 72 Fund the Business Targeted Capital Structure Return Cash to Shareholders M&A 1 2 4 3 Our Approach to S hareholder Value Creation
Investor Day – May 4, 2017 Whirlpool Corporation Support Growth with Robust Innovation Pipeline and Operational Stability 73 FUNDING THE BUSINESS FOR GROWTH Fund the Business Liquidity • Innovation focus ed capex • R&D for innovation and cos t • Cas h on hand to meet operational needs • Corporate funding needs are USD denominated • Keep credit lines with divers e s et of banks Capex: 3.5% of s ales R&D: 3% of s ales $1B cas h on hand as of 3/31/2017 $3B in credit facilities acros s 23 banks Priorities Status 1 Our Approach to S hareholder Value Creation
Investor Day – May 4, 2017 Whirlpool Corporation Maintain Strategic Flexibility While Fulf illing Existing Commitments 74 TARGETED CAPITAL STRUCTURE Capital Structure Pension • Debt levels that target s trong credit rating • Roll-over when interes t rates favorable • Flexibility to purs ue s trategic options • Fully-fund on tax-efficient U.S . GAAP bas is • Minimal future funding needs Strong Inves tment Grade Rating ~80% funded as of 12/31/2016 2 Priorities Status Our Approach to S hareholder Value Creation
Investor Day – May 4, 2017 Whirlpool Corporation CONSISTENT DIVIDEND GROWTH 75 $4.30 $3.90 $3.45 $2.88 $2.38 $2.00$1.93 $1.72$1.72$1.72$1.72$1.72 2017F +14% CAGR 2016 2015 2014 2013 2012 2011 2010 2009 2008 2007 2006 • Dividend target is 25-30% of trailing twelve months of earnings • Cons is tent annual dividend payments s ince we were lis ted in 1955 3 Our Approach to S hareholder Value Creation
Investor Day – May 4, 2017 Whirlpool Corporation Repurchased $1.3B of Stock Since 2013 76 CONSISTENT SHARE REPURCHASE 77.2 79.779.6 80.8 2016 2015 2014 2013 • Repurchas es primarily targeted to offs et dilution at a minimum • Strong return (+76%) on completed s hare buyback authorizations • Repurchas ed $150M of s hares in Q1 2017 • $550M authorization remaining as of 3/31/2017 3 Diluted Average Weighted Shares (Millions ) $350 $25 $250 $525 Amount of Shares Repurchased (M USD) Our Approach to S hareholder Value Creation
Investor Day – May 4, 2017 Whirlpool Corporation DISCIPLINED APPROACH TO M&A 77 Standalone Attractivenes s 4 Time Horizon: Strategic Fit Strategic M&A: Value Creation Opportunity Bolt-on M&A: Capacity to Execute and Integrate EPS Accretive: 5 to 10 years 12 - 15% ROIC Long-term Payback 15 - 25% ROIC Short-term Payback Year 1, excluding charges Criteria Hurdles Our Approach to S hareholder Value Creation
Investor Day – May 4, 2017 Whirlpool Corporation 1986 2006 2014 2015 $150M $2.8B $2.3B Terms confidential Utilize Value-Creating M&A to Accelerate Our Strategy MAJOR ACQUISITION HISTORY 78 Premium brands , s mall domes tic appliances Mas s and premium brands , manufacturing s cale Value brands , manufacturing s cale, dis tribution s cale Product platforms and technology in commercial laundry 4 Price Rationale Value In progres s Our Approach to S hareholder Value Creation
Investor Day – May 4, 2017 Whirlpool Corporation 2017 INVESTOR DAY – AGENDA 79 1. A Commitment to Shareholder Value Creation 2. A Unique Global Strategic Position to Create Value 3. Compelling Regional Catalysts to Grow Our Global Position 4. Our Approach to Shareholder Value Creation 5. Closing Remarks, Q&A Clos ing Remarks , Q&A
Investor Day – May 4, 2017 Whirlpool Corporation Positioned to Deliver Total Shareholder Return (TSR) in the Top Quartile of the S&P 500 80 A COMMITMENT TO SHAREHOLDER VALUE CREATION 3-5% Annual Organic Net Sales Growth 10%+ EBIT Margin (by 2020) 5-6% FCF as % of Net Sales (by 2018) Clos ing Remarks , Q&A A Unique Global Strategic Position Compelling Regional Catalysts • # 1 Globally and # 1 or # 2 in almos t all parts of the world • Bes t brand portfolio in indus try • Rich legacy of innovation with robus t new product pipeline • Relentles s focus on cos t takeout • North America: Strong value creation in a healthy marketplace • EMEA: Fully realizing benefits of Indes it acquis ition • Latin America: Fully leveraging optimized cos t s tructure • Asia: Well-pos itioned to benefit from India / China growth
Investor Day – May 4, 2017 Whirlpool Corporation 81 Clos ing Remarks , Q&A
Investor Day – May 4, 2017 Whirlpool Corporation INDEX OF SUPPORTING INFORMATION 82 Slide # Slide Title & Description Source / Notes 9 A COMMITMENT TO SHAREHOLDER VALUE CREATION •GFK, AHAM, Traqline, Euromonitor, Internal res earch •EBIT margin, FCF as a percentage of net s ales and organic net s ales growth are non-GAAP meas ures . Reconciliation information is located in the s upporting information s ection of the pres entation. 10 LONG-TERM VALUE CREATION •Meas ured to 12/31/2016 •S&P Capital IQ, NYU, BCG ValueScience® Center, Bloomberg 11 A STRONG TRACK RECORD OF SHAREHOLDER RETURNS •S&P Capital IQ, BCG ValueScience® Center, Bloomberg 12 TSR IS DRIVEN BY MARGIN EXPANSION AND FCF YIELD •S&P Capital IQ, S&P Compus tat, Bloomberg, BCG ValueScience®, BCG analys is 13 WE HAVE DELIVERED STRUCTURAL MARGIN EXPANSION •Ongoing EBIT margin is a non-GAAP meas ure. Reconciliation information is located in the s upporting information s ection of the pres entation. 14 FCF GROWTH MASKED BY NON-STRUCTURAL IMPACTS •FCF and FCF convers ion are non-GAAP meas ures . Reconciliation information is located in the s upporting information s ection of the pres entation. 15 OUR LONG-TERM VALUE CREATION FRAMEWORK •EBIT margin, FCF as a percentage of net s ales and organic net s ales growth are non-GAAP meas ures . Reconciliation information is located in the s upporting information s ection of the pres entation. 17 A UNIQUE GLOBAL POSITION TO CREATE VALUE •GFK, AHAM, Traqline, Internal res earch •Whirlpool owners hip of the Hotpoint brand in the EMEA and As ia regions is not affiliated with the Hotpoint brand s old in the Americas . 18 GLOBAL LEADING SHARE POSITION •GFK, AHAM, Traqline, Euromonitor, Internal res earch 19 A BALANCE OF DEVELOPED AND EMERGING MARKETS •Bloomberg, Internal res earch •Emerging Markets include Latin America (excluding compres s ors bus ines s ), Rus s ia, As ia, and Mexico S upporting Information
Investor Day – May 4, 2017 Whirlpool Corporation INDEX OF SUPPORTING INFORMATION 83 Slide # Slide Title & Description Source / Notes 20 BEST GLOBAL BRAND PORTFOLIO •Whirlpool owners hip of the Hotpoint brand in the EMEA and As ia regions is not affiliated with the Hotpoint brand s old in the Americas . •Our leading portfolio of brands includes Whirlpool, Maytag, KitchenAid, Embraco, Hotpoint, Consul, and Indesit, each of which generates annual revenues in exces s of $1 billion. 31 A GLOBAL LEADER…WITH STRONG REGIONAL POSITIONS •Ongoing operating margin is a non-GAAP meas ure. Reconciliation information is located in the s upporting information s ection of the pres entation. 32 NORTH AMERICA…STRONG VALUE CREATION IN A HEALTHY MARKETPLACE •Ongoing operating margin is a non-GAAP meas ure. Reconciliation information is located in the s upporting information s ection of the pres entation. 33 LONG-TERM U.S. DEMAND TRENDS REMAIN POSITIVE •AHAM, Internal res earch 34 U.S. HOUSING RECOVERY STRONG AND FAR FROM PEAK •Trading Economics , U.S . Cens us Bureau, Internal res earch 35 U.S. HOUSEHOLD FORMATION YET TO RECOVER •Trading Economics , U.S . Cens us Bureau, Internal res earch 36 STRONG BRANDS AND CONNECTED INNOVATION •Traqline, Internal res earch 37 POSITIONED FOR A CHANGING RETAIL ENVIRONMENT…. •Traqline. Internal res earch •Retail outlet s hare includes T5 appliances , microwave hood combinations (MHCs ) and cooktops 38 …WITH OUR INDUSTRY-LEADING BRAND PORTFOLIO •Traqline, Internal res earch 41 EUROPE, MIDDLE EAST AND AFRICA (EMEA)…MOVING TOWARDS FULLY REALIZING ACQUISIT ION BENEFITS •Ongoing operating margin is a non-GAAP meas ure. Reconciliation information is located in the s upporting information s ection of the pres entation. S upporting Information
Investor Day – May 4, 2017 Whirlpool Corporation INDEX OF SUPPORTING INFORMATION: CONTINUED 84 Slide # Slide Title & Description Source / Notes 42 A WINNING COUNTRY PORTFOLIO… •GFK, Euromonitor, Internal res earch 49 A S IMPLIFIED AND WINNING BRAND PORTFOLIO •Whirlpool owners hip of the Hotpoint brand in the EMEA and As ia regions is not affiliated with the Hotpoint brand s old in the Americas . 50 WITH MANY ADDITIONAL GROWTH OPPORTUNITIES •2013 net s ales do not include Indes it 51 STRUCTURALLY POSITIONED FOR 8%+ LONG-TERM OPERATING MARGINS •Ongoing operating margin is a non-GAAP meas ure. Reconciliation information is located in the s upporting information s ection of the pres entation. 52 LATIN AMERICA…FULLY LEVERAGING OPTIMIZED COST STRUCTURE AS THE MARKET BEGINS TO RECOVER •Ongoing operating margin is a non-GAAP meas ure. Reconciliation information is located in the s upporting information s ection of the pres entation. 53 A HISTORIC DROP IN BRAZIL APPLIANCE DEMAND •GFK, Euromonitor, Internal res earch 54 BEGINNING TO SEE S IGNS OF DEMAND REBOUNDING •Trading Economics , Banco Central Do Bras il , Confederacao Nacional Da Indus tria 55 OUR BUSINESS REMAINS STRUCTURALLY HEALTHY •Operating margins include reclas s ifications as the res ult of the adoption of new accounting s tandards . See footnote “e” in the s upporting information s ection of the pres entation. 56 OUR LEADING BRANDS ARE WELL-POSITIONED •IPSOS, Brand Health, Kantar Worldpanel 59 STRONG GROWTH POTENTIAL BEYOND BRAZIL •GFK, Internal res earch 60 ASIA…WELL-POSITIONED FOR INDIA / CHINA GROWTH •Ongoing operating margin is a non-GAAP meas ure. Reconciliation information is located in the s upporting information s ection of the pres entation. 62 STRONG DEMOGRAPHIC GROWTH OPPORTUNITY •Oxford Economics , Euromonitor, China Market Monitor, GFK, Internal res earch •Middle / upper clas s includes hous eholds with an annual income >$10K USD 63 CHINA DEMAND DOWN OVER 15% SINCE 2011 •China Market Monitor, Internal res earch 64 …BUT GROWTH
                                                                                                                                                                                                                                                                                                                                                                                                                                                                                                                                                                                                                                                                                                                                                                                                                                                                                                                                                                                               OPPORTUNITIES IN CHINA ARE STRONG •China Market Monitor, Internal Res earch S upporting Information
Investor Day – May 4, 2017 Whirlpool Corporation INDEX OF SUPPORTING INFORMATION: CONTINUED 85 Slide # Slide Title & Description Source / Notes 65 STRONG GROWTH OPPORTUNITIES IN INDIA •GFK, Internal Res earch 67 OUR LONG-TERM VALUE CREATION FRAMEWORK •EBIT margin, organic net s ales and FCF are non-GAAP meas ures . Reconciliation information is located in the s upporting information s ection of the pres entation. 68 ONGOING EBIT MARGIN EXPANSION •Ongoing EBIT margin is a non-GAAP meas ure. Reconciliation information is located in the s upporting information s ection of the pres entation. 69 FOCUS ON IMPROVING FCF CONVERSION •FCF convers ion, EBIT margin, and organic net s ales growth are non-GAAP meas ures . Reconciliation information is located in the s upporting information s ection of the pres entation. 71 FCF GROWTH MASKED BY NON-STRUCTURAL IMPACTS •FCF and FCF convers ion are non-GAAP meas ures . Reconciliation information is located in the s upporting information s ection of the pres entation. 74 TARGETED CAPITAL STRUCTURE •Standard and Poor’s , Moody’s Inves tors Service, FitchRatings 76 CONSISTENT SHARE REPURCHASE •On April 23, 2008, our Board of Directors authorized a s hare repurchas e program of up to $500 million We res umed the s hare repurchas e program during 2013 and repurchas ed 2.5 million s hares at an aggregate purchas e price of $350 million through December 31, 2013 . At December 31, 2013 , there was no remaining authorization under this program. •On April 14, 2014, our Board of Directors authorized a s hare repurchas e program of up to $500 million . During the firs t quarter of 2016, we repurchas ed 1,507,100 s hares at an aggregate purchas e price of approximately $225 million under this program. As of March 31, 2016, there were no remaining funds authorized under this program •On April 18, 2016 , our Board of Directors authorized a new s hare repurchas e program of up to $1 billion . As of March 31, 2017, there were approximately $550 million in remaining funds authorized under this program. •Return on completed s hare buyback authorizations (2004, 2008, 2014) calculated us ing 4/28/2017 clos ing price of WHR. 78 MAJ OR ACQUISIT ION
HISTORY •Prices are inclus ive of acquired debt 80 A COMMITMENT TO SHAREHOLDER VALUE CREATION •GFK, AHAM, Traqline, Euromonitor, Internal res earch •EBIT margin, organic net s ales and FCF as a percentage of net s ales are non-GAAP meas ures . Reconciliation information is located in the s upporting information s ection of the pres entation. S upporting InformationInvestor Day – May 4, 2017 Whirlpool Corporation RECONCILIATION OF GAAP TO NON-GAAP FINANCIAL MEASURES: 86 We s upplement the reporting of our financial information determined under U.S . generally accepted accounting principles (GAAP) with certain non-GAAP financial meas ures , s ome of which we refer to as "ongoing bus ines s " meas ures , including ongoing bus ines s operating profit (los s ), ongoing bus ines s operating margin, earnings before interes t and taxes (EBIT), EBIT margin, ongoing bus ines s EBIT , ongoing bus ines s EBIT margin, ongoing bus ines s earnings , ongoing bus ines s earnings per diluted s hare, ongoing bus ines s s egment operating profit (los s ), ongoing bus ines s s egment operating margin, s ales excluding currency, ongoing net s ales , free cas h flow, free cas h flow convers ion and free cas h flow as a percentage of net s ales . Ongoing bus ines s meas ures exclude items that may not be indicative of, or are unrelated to, res ults from our ongoing bus ines s operations and provide a better bas eline for analyzing trends in our underlying bus ines s es . S ales excluding foreign currency, or organic net s ales , is calculated by trans lating the current period net s ales , in functional currency, to U.S . dollars us ing the prior-year period’s exchange rate compared to the prior-year period net s ales . Management believes that s ales excluding foreign currency provides s tockholders with a clearer bas is to as s es s our res ults over time, excluding the impact of exchange rate fluctuations . Management believes that free cas h flow provides inves tors and s tockholders with a relevant meas ure of liquidity and a us eful bas is for as s es s ing the company's ability to fund its activities and obligations . The Company provides free cas h flow related metrics , s uch as free cas h flow as a percentage of net s ales and free cas h flow convers ion, as long-term management goals , not an element of its annual financial guidance, and as s uch does not provide a reconciliation of free cas h flow to cas h provided by (us ed in) operating activities , the mos t directly comparable GAAP meas ure. Any s uch reconciliation would rely on market factors and certain other conditions and as s umptions that are outs ide of the company’s control. We believe that thes e non-GAAP meas ures provide meaningful information to as s is t inves
tors and s tockholders in unders tanding our financial res ults and as s es s ing our pros pects for future performance, and reflect an additional way of viewing as pects of our operations that, when viewed with our GAAP financial meas ures , provide a more complete unders tanding of our bus ines s . Becaus e non-GAAP financial meas ures are not s tandardized, it may not be pos s ible to compare thes e financial meas ures with other companies ’ non-GAAP financial meas ures having the s ame or s imilar names . Thes e ongoing bus ines s financial meas ures s hould not be cons idered in is olation or as a s ubs titute for reported operating profit (los s ), net earnings available to Whirlpool per diluted s hare, net earnings , net earnings available to Whirlpool, net s ales , reported operating profit (los s ) by s egment, and cas h provided by (us ed in) operating activities , the mos t directly comparable GAAP financial meas ures . GAAP net earnings available to Whirlpool per diluted s hare and ongoing bus ines s earnings per diluted s hare are pres ented net of tax, while individual adjus tments in each reconciliation are pres ented on a pre-tax bas is ; the income tax impact line item aggregates the tax impact for thes e adjus tments . The tax impact of individual line item adjus tments may not foot precis ely to the aggregate income tax impact amount, as each line item adjus tment may include non-taxable components . Prior-period comparis ons have been recas t to reflect the tax impact of adjus tments as a s ingle adjus tment. We s trongly encourage inves tors and s tockholders to review our financial s tatements and publicly-filed reports in their entirety and not to rely on any s ingle financial meas ure. S upporting InformationInvestor Day – May 4, 2017 Whirlpool Corporation ONGOING BUSINESS OPERATING PROFIT AND ONGOING BUSINESS EARNINGS BEFORE INTEREST AND TAXES: 87 The reconciliation provided below reconciles the non-GAAP financial meas ures ongoing bus ines s operating profit and ongoing bus ines s earnings before interes t and taxes with the mos t directly comparable GAAP financial meas ures , operating profit and net earnings available to Whirlpool for 2017 (forecas t) and the twelve months ended December 31, 2016, 2015, 2014, 2013, 2012, 2011 and 2010. Ongoing bus ines s operating margin is calculated by dividing ongoing bus ines s operating profit by ongoing bus ines s net s ales . Ongoing bus ines s EBIT margin is calculated by dividing ongoing bus ines s EBIT by ongoing bus ines s net s ales . Ongoing bus ines s net s ales excludes Brazilian (BEFIEX) tax credits from reported net s ales . Twelve Months Ended December 31, Operating Profit Earnings Before Interest & Taxes (1) 2017 F 2016 2017 F 2016 2015 2014 2013 2012 2011 2010 Reported GAAP Measure(e) $ 1,510 - 1,640 $ 1,368 $ 1,400 - 1,530 $ 1,275 $ 1,196 $ 1,046 $ 1,094 $ 757 $ 185 $ 811 Acquisition Related Transition Costs - 82 - 86 64 98 - - - - Antitrust and Dispute Resolutions - - - - 35 4 42 25 - - Benefit Plan Curtailment Gain - - - - (62) - - (49) (35) (62) Brazilian (BEFIEX) Tax Credits - - - - - (14) (109) (37) (266) (225) Brazilian Collection Dispute & Antirust Resolutions - - - - - - - - 528 146 Brazilian Government Settlement - - - - - - 28 - - - Contract and Patent Resolutions - - - - - - - 22 - - Gain on Sale of Brand - - - - - - - - - (10) Gain/Expenses Related to a Business Investment - - - - (46) - - - - - Inventory Purchase Price Allocation - - - - - 13 - - - - Investment and Intangible Impairment - - - - - - - 11 - - Investment Expenses - - - - - 87 21 - - - Legacy Product Warranty and Liability Expense(a) - 3 - (23) 42 - - - - - Pension Settlement Charges(b) - - - - 15 - - - - - Restructuring Expense(c) 200 173 200 173 201 136 196 237 136 74 Supplier Quality Issue - - - - - - - - (7) 75 Supplier Quality Recovery - - - - - - - - (61) - Ongoing Business Measure $ 1,710 - 1,840 $ 1,626 $ 1,600 - 1,730 $ 1,511 $ 1,445 $ 1,370 $ 1,272 $ 966 $ 480 $ 809 S upporting Information
Investor Day – May 4, 2017 Whirlpool Corporation CONTINUED: 88 (1) Earnings Before Interes t & Taxes (EBIT) is a non-GAAP meas ure. Whirlpool does not provide a forward-looking quantitative reconciliation of EBIT to the mos t directly comparable GAAP financial meas ure, net earnings available to Whirlpool, becaus e the net earnings available to noncontrolling interes ts item of s uch reconciliation -- which has his torically repres ented a relatively ins ignificant amount of Whirlpool's overall net earnings -- implicates Whirlpool's projections regarding the earnings of Whirlpool's non wholly-owned s ubs idiaries and joint ventures that cannot be quantified precis ely or without unreas onable efforts . Twelve Months Ended December 31, 2016 2015 2014 2013 2012 2011 2010 Net earnings available to Whirlpool $888 $783 $650 $827 $401 $390 $619 Net earnings available to noncontrolling interes ts 40 39 42 22 24 18 31 Income tax expens e (benefit) 186 209 189 68 133 (436) (64) Interes t expens e 161 165 165 177 199 213 225 Earnings Before Interes t & Taxes (1) $1,275 $1,196 $1,046 $1,094 $757 $185 $811 Earnings Before Interest & Taxes Reconciliation: Note: Numbers may not reconcile due to rounding S upporting Information
Investor Day – May 4, 2017 Whirlpool Corporation ONGOING BUSINESS EARNINGS PER DILUTED SHARE: 89 The reconciliation provided below reconciles the non-GAAP financial meas ure ongoing bus ines s earnings per diluted s hare, with the mos t directly comparable GAAP financial meas ure, net earnings per diluted s hare available to Whirlpool, for 2017 (forecas t) and the twelve months ended December 31, 2016 , 2015, 2014, 2013, 2012 and 2011. The earnings per diluted s hare GAAP meas ure and ongoing bus ines s meas ure are pres ented net of tax, while each adjus tment is pres ented on a pre-tax bas is . Twelve Months Ended December 31, Earnings per Diluted Share 2017 F 2016 2015 2014 2013 2012 2011 Reported GAAP Meas ure $12.65 – 13.40 $ 11.50 $ 9.83 $ 8.17 $ 10.24 $ 5.06 $ 4.99 Acquis ition Related Trans ition Cos ts - 1.11 0.80 1.23 - - - Antitrus t and Dis pute Res olutions - - 0.44 0.05 0.52 0.32 - Benefit Plan Curtailment Gain - - (0.78) - - (0.62) (0.45) Brazilian (BEFIEX) Tax Credits - - - (0.18) (1.35) (0.47) (3.41) Brazilian Collection Dis pute & Antirus t Res olutions - - - - - - 6.76 Brazilian Government Settlement - - - - 0.35 - - Contract and Patent Res olutions - - - - - 0.28 - Energy Tax Credit - - - - (1.56) - (4.68) Gain on Sale of Brand - - - - - - - Gain/Expens es Related to a Bus ines s Inves tment - - (0.58) - - - - Inventory Purchas e Price Allocation - - - 0.16 - - - Inves tment and Intangible Impairment - - - - - 0.14 - Inves tment Expens es - - - 1.09 0.26 - - Legacy Product Warranty and Liability Expens e(a) - (0.30) 0.53 - - - - Pens ion Settlement Charges (b) - - 0.19 - - - - Res tructuring Expens e(c) 2.62 2.24 2.52 1.71 2.43 2.99 1.74 Supplier Quality Is s ue - - - - - - (0.09) Supplier Quality Recovery - - - - - - (0.78) Normalized Tax Rate Adjus tment(d) - - - (0.06) - 0.08 - Income Tax Impact (0.58) (0.49) (0.57) (0.78) (0.87) (0.73) (2.03) Ongoing Bus ines s Meas ure $14.75 - 15.50 $ 14.06 $ 12.38 $ 11.39 $ 10.02 $ 7.05 $ 2.05 S upporting Information
You can also read