STAMP DUTY REFORM: BENEFITS AND CHALLENGES - July 2021 - NHFIC
←
→
Page content transcription
If your browser does not render page correctly, please read the page content below
STAMP DUTY REFORM:
BENEFITS AND CHALLENGES
July 2021
Executive summary
Property tax reform is gathering momentum. The NSW government recently published a progress paper
providing more detail about its reform intentions including the results of its public consultation process. The
next step for NSW is to assess feedback on the progress paper and provide an update later in the year. It now
joins the ACT as the only two jurisdictions in Australia intent on replacing transfer (stamp) duty with land tax.
Against this backdrop it is timely to take a step back and reassess the economic benefits and challenges of
transfer duty reform using the most recently available data 1. The report also discusses the equity distortions
created by transfer duty and why they are an important consideration.
This report highlights the distortions that transfer duty imposes on mobility and prices in the housing market.
It also discusses the challenges faced by jurisdictions wanting to phase it out in preference of a broad-based
land tax using a model that analyses the link between dwelling prices, the number of transfers and transfer
duty revenue.
Key findings
Mobility will increase if transfer duty is reduced or removed.
Transfer duty imposes a high cost on households that move residence. For example, a household that
bought the Sydney’s median priced house four times over the past 20 years would have paid more
than 10 times the amount of duty than a household making only one purchase at the start of this
period.
Australian jurisdictions are 40% more sensitive to duty than many European OECD countries and
would gain substantial benefits from the increase in mobility removal of duty would provide, including
more efficient use of housing stock and improved labour productivity.
Removing transfer duty in favour of a broad-based land tax will likely lift dwelling prices in the short-
term as the removal of transfer duty is capitalised into prices. However, if lenders fully capitalise the
cost of the replacement land tax into loan serviceability criteria, the price impact from removing duty
may be negligible. Data shows dwelling prices and the number of transfers both rose in the ACT
during the transition period.
States and territories with the highest effective rate of transfer duty have the most to gain from reform.
VIC has Australia’s largest effective rate of transfer duty. In contrast, the ACT has the lowest effective
rate of duty after nearly a decade of transitioning to a broad-based land tax. Consequently, the
economic loss from transfer duty in the ACT is the equal lowest of any jurisdiction with the NT.
Adjustments to transfer duty regimes by the states have not kept pace with rising house prices,
resulting in a revenue windfall that is difficult to replace. Surging house price growth without
adjusting the duty regime results in stronger revenue growth and a higher effective land tax than
necessary. In NSW, a 5% per annum average rise in dwelling prices over 20 years would generate 2.2
times the amount of duty revenue than if prices had risen by only 2% per annum.
Jurisdictions wanting to reform their property tax regime by replacing duty with a broad-based land tax face
several challenges.
The aim of transitioning from transfer duty to land tax is not to increase revenue per se, and this
paper demonstrates the transition can be achieved in a revenue neutral way.
1
The analysis in this paper is primarily focused on residential property.
2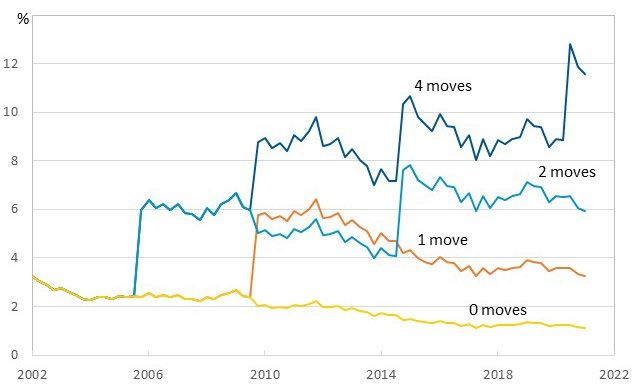
A short phase out period costs taxpayers less and provides more certainty about the revenue to be
replaced, while a long transition costs taxpayers more with less revenue certainty.
Home buyers purchasing property just before the reform commences may need to be compensated
and this could cause a large fall in revenue.
Broadening the tax base also means an additional tax burden falls on households who own their
home with no mortgage and investors, many of whom probably paid duty many years ago. A broad-
based land tax imposes an additional cost on households that on average would be around 75% of
current municipal rates. However, this will be offset by the likely positive short-term impact on prices
from removing duty.
Phasing in a broad-based land tax using just new transactions would take on average around 23 years
provided all new buyers decided to pay the tax in preference to transfer duty assuming 4.4% of
properties turnover each year.
A range of options are available to policy makers to help speed up any transition and to help address equity
issues raised as part of the reform.
A short phase out period can help by limiting the impact of house price growth on the cost of
transition. For example, a substitute revenue neutral broad-based land tax would need to be
0.02ppts higher in NSW (0.45%) under a 20-year transition, assuming 5% per annum price growth,
compared with a shorter 5-year transition (0.43%).
Crediting back those households who recently paid duty over at least a 5-year payback period will not
result in a cut to the substituted land tax revenue.
Asset rich and cash poor retirees could be allowed to defer some, or all their land tax liability until the
property is sold.
Retirees and low-income earners could also be paid a rebate on the land tax liability. A similar rebate
is already in place to support these cohorts meet municipal rates expenses.
A progressive replacement land tax could be designed with the distribution of duty in mind when
estimating it on the unimproved value of the land.
The cost to landlords of a new replacement land tax is unlikely to be passed on to tenants, but it may
be legislated to make this unlawful during a rental agreement. Property investors typically have a
relative short property ownership period compared to owner-occupiers and the additional turnover
generated by the removal of transfer duty may disrupt rental agreements and tenure for tenants if
some protection is not put in place.
Why we need to rethink transfer duty
This Section explains how transfer duty distorts the housing market and imposes a loss on the broader
economy. We also discuss the impost of transfer duty in Australia, make international comparisons and look at
the effect of transfer duty on housing demand.
Australia’s property taxes go back all the way to 11th-century England, where William the Conqueror used
records of land ownership to create his tax base. In the late 17th century, the UK had a window tax well before
it introduced an income tax. Eventually, increasing pressure to remove privileges of the aristocracy led to
property law reform, including the Property Act of 1845 and the Conveyancing Acts of 1881 and 1882. These
Victorian-era tax reforms were the seeds that grew into conveyancing as it exists in Australia.
Once records on conveyancing were established in Australia (1865), introducing a tax on these transactions as
a transfer duty was relatively easy.
3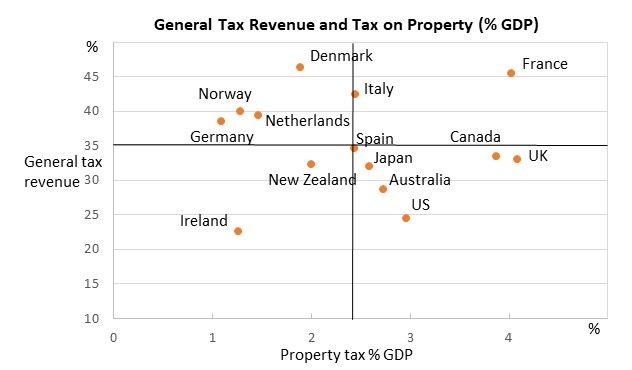
•      Transfer duty can capture a wide range of economic activity, including transactions in property, plant and
       equipment and insurance.

•      Government already had detailed information on the economic activity because documents with details of
       the asset and its value and entities involved in the transaction required a government stamp to formally
       approve the transaction.

•      Avoidance is difficult because unlike plant and equipment, land is immobile and cannot be moved or
       varied.

The shortcomings of conveyancing are also well understood.

•      Restricts mobility. It provides a heavy penalty on household mobility and restricts the ability of
       households to upsize, downsize and move. The restrictions it places on mobility also reduce labour
       productivity and add frictions to the labour market. This shortcoming of the tax burden is arguably
       intergenerational in that mobility is more frequent in those households aged in their 20s and 30s than
       those in older cohorts.

•      Discourages efficient use of housing stock. Around 11% of all private dwellings were unoccupied
       according to the 2016 Census, so replacing duty with a broad-based land tax could lower the cost of
       moving between properties and encourage these dwellings to be used. Replacing transfer duty with a
       broad-based land tax could also encourage land zoned for commercial use to be rezoned to residential
       where the land tax rate is higher on land for commercial use.

•      Large economic cost. It imposes an economic loss on the housing market that can be large enough to be a
       significant cost on the broader economy. Modelling undertaken by the Commonwealth Treasury found
       stamp duties come with some of the highest long-term costs for living standards. 2

•      Narrow base. Transfer duty on residential properties contributes around 13% of state and territory tax
       revenue but is paid by only 4% of households per year. These households are making relatively large
       contributions to state revenue, while long-term owner-occupier property owners enjoy the same
       government services but make relatively small contributions.

•      Volatile source of government revenue. Transfer duty is a relatively volatile source of tax revenue that
       can make managing government finance difficult. The property market goes through large cyclical swings
       in both dwelling prices and the number of transfers, and this introduces volatility into government
       revenue. It could be argued this makes the tax counter-cyclical and, useful in managing property cycles.
       However, experience shows that it hasn’t stopped financial stability concerns in the past and to this extent
       macro-prudential policy is a much more appropriate policy tool to manage the cycle.

In Australia, transfer duty on residential property is normally paid by the buyer. To highlight the high cost of
the tax, we estimate it and compare it to other transaction costs for purchasers of the median property in
Sydney.

Transfer duty is around $43,000 or 20% of the upfront cost of the median property purchase (Figure 1).

2
    https://treasury.gov.au/sites/default/files/2019-03/c2015-rethink-dp-TWP_combined-online.pdf

                                                                   4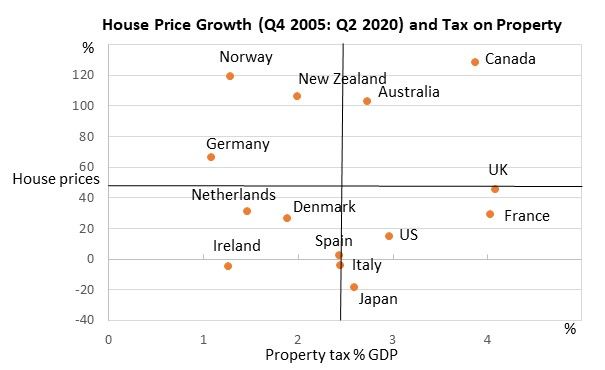
Figure 1: Typical upfront expenses in Sydney property purchase
 Expense Item                           Expense ($)                                                Percentage (%)
 Deposit                                152,630                                                    72
 Moving Costs                           2,025                                                      1
 Transfer Duty                          42,755                                                     20
 Mortgage Insurance                     12,170                                                     6
 Other                                  2,734                                                      1
 Total                                  212,314                                                    100
 Source: NHIFIC, ABS, Genworth, Commbank, Westpac Canstar and NAB, NSW State Government Revenue. The deposit assumed is 15%
 of the purchase price. Price used is the median Sydney house price in Q1 2021 ($1,050,000). The calculation is done for an upgrader
 and not a first home buyer.

But this relatively large cost of transfer duty in property transactions becomes even more of a drain on
household cashflow when a household moves several times. In Sydney, for example, if a household moved
four times between 2002 and 2020, the effective transfer duty rate increased from around 3% of the median
house price to 13%. The total amount of duty paid by this household would have been $121,500 (Figure 2).

In contrast, the same household remaining in their property bought in 2002 would have seen their effective
rate of duty decline to around 1% over the same 20-year period because of price appreciation, after paying an
amount of duty paid of $11,900 at the purchase – approximately 10 times less than the household that moved
four times, potentially to find work.

 Figure 2: Effective transfer duty rate: Sydney median established house price

 Source: NHFIC. ABS. The household purchases the median price at each move, so the increase in the median price over the past 20
 years lowers the effective rate of duty. For the purposes of this paper, the effective rate is the transfer duty liability divided by the
 house price.

The state and territory governments collect real estate transfer duty in Australia. They adopt a progressive
design with rates of duty increasing from around 3% to 6.5% with increasing property prices (Figure 3).

Appendix A details the transfer duty regime currently being used in each state and territory.

Each price bracket usually has a fixed amount payable and a variable amount that depends on the property
price. The two territories have relatively low tax rates for properties valued around $250,000. However, in the
NT it reaches 5% at $550,000. After recent changes, Victoria has Australia’s highest transfer duty rate. The NT
also has a relatively high rate for properties valued at $3,000,000 (5.8%), most of which are likely to be cattle
stations.

                                                                      5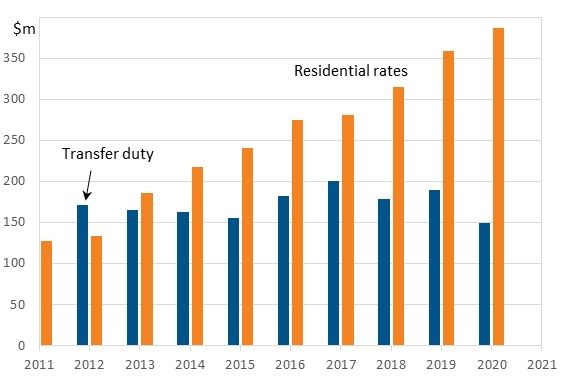
Figure 3: Effective transfer duty rates by house price*

 Source: NHIFIC. *For the purposes of this paper, the effective rate is the transfer duty liability divided by the house price.

The progressive design of transfer duty means that home buyers purchasing relatively expensive properties
pay more transfer duty than those purchasing relatively less expensive properties. However, the number of
transfers is congested around $600,000 in most jurisdictions, so property owners purchasing property at this
price point pay the bulk of transfer duty revenue (Figure 4).

 Figure 4: Distribution of transfer duty by dwelling price and jurisdiction (%)

 Source: Corelogic. Estimated for the 2016 to 2020 period. Transfer duty revenue paid at each price is calculated using the current
 transfer duty settings. The contribution to jurisdiction transfer duty is estimated by multiplying the duty payable at each price by the
 number of transfers in a $400,000 range around the price point. The duty payable on properties valued above $3,000,000 are
 estimated using a property value of $3,000,000 and the number of transfers on properties valued above $2,800,000. NHIFIC.

International comparisons
Flat rates are used in many countries, but a progressive threshold system is also common.

Most US states have transfer duty, but the rate is significantly less than in Australia or many European
countries (Figure 5). Some US Counties also impose transfer duty, but even with this additional amount, the
total effective rate is generally well below that of the Australian state and territories. The Australian rate of
duty is around the average of our sample of jurisdictions.

Another feature of the US system is that the tax liability can be negotiated between the buyer and vendor. In
some states the liability is with the vendor.

The Canadian provinces generally have lower rates of duty than Australia, but like Australia, duty is paid by the
buyer. In New Zealand, there is no transfer duty and at the other end of the spectrum the top end of the
London market pays 12%. The top end of the Andalucia (Southern Spain) market pays a relatively large
transfer duty (10%).

                                                                      6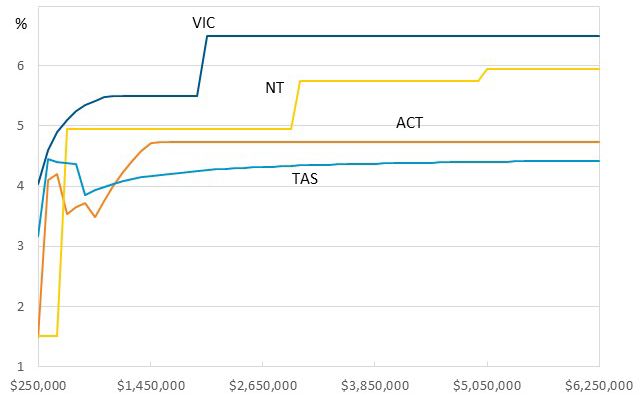
Figure 5: International transfer duty
Jurisdiction            Payee                Tax                                      Threshold                 Rate (%)
United States
California              Seller but can       Tax deductable from capital gain         Flat rate                 0.11
                        negotiate.           liability
New York State          Seller. If seller                                             < $US3,000,000            0.4
                        is     exempt,
                        then buyer.
                                                                                      >$US3,000,000             0.65
NYC                                                                                   $US500,000               1.425
Ohio                                         Local govt can add extra tax up to                                 0.1
                                             0.3%
Florida                                                                               Flat rate                 0.7
Chicago                  Sellers (71%        Local govt can add extra tax up to                                 0.1
                         and        Buyer    0.5%
                         (29%)
Texas                    Nil
Argentina                Seller      (only                                                                      1.5
                         sellers with no
                         income        tax
                         liability)
Canada                   Buyer
British Columbia                                                                      $C2,000,001              3.0

Ontario                                                                               $C55,000 - $C250,000      1.0
                                                                                      $C250001 - $C400,000      1.5
                                                                                      $C400,001 - $C2,000,000   2.0
                                                                                      >$C2,000,001              2.5

UK (London)                                                                           £0 - £125,000             Nil
                                                                                      £125,001 - £250,000       2.0
                                                                                      £250,001 - £925,000       5.0
                                                                                      £925,001 - £1,500,000     10.0
                                                                                      > £1,500,000              12.0
Hungary                  Buyer                                                        HUF1,000,000,000         Additional
                                                                                                                2.0
Sweden                                                                                                          1.0
Germany
Bavaria                  Buyer                                                        Flat rate                 3.5
Berlin                   Buyer                                                        Flat rate                 6.0
Saarland                 Buyer                                                        Flat rate                 6.5
Norway                   Buyer               National                                                           2.5
New Zealand              Nil
Spain                                        Properties sold for the first time are
                                             instead subject to 10% VAT across
                                             the country (except the Canaries
                                             with 4.5% IGIC), plus 0.4-0.75%
                                             stamp duty tax.
Madrid                   Buyer                                                        Flat rate                 6.0

Andalucía                Buyer                                                         €701,000                10.0
The Netherlands          Buyer                                                        Flat rate                 2.0
Source: NHFIC

                                                                  7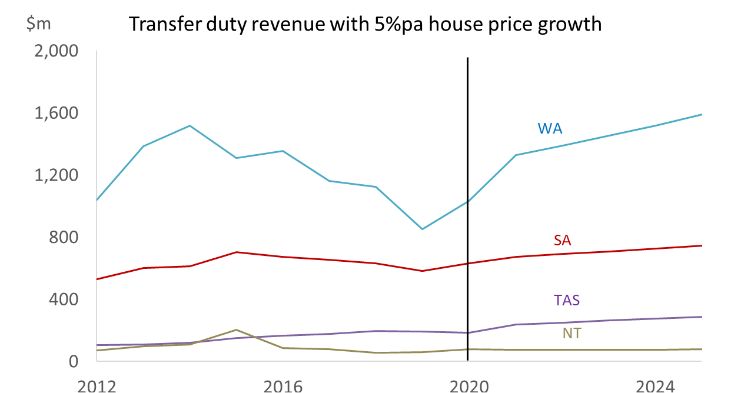
Transfer duty in theory
Two frameworks are available to analyse the impost of duty:

•     Partial equilibrium analysis – looks purely at the impact of transfer duty on the housing market. It doesn’t
      consider the impacts of duty on the broader economy, particularly wages growth, migration, employment,
      investment and consumer spending.

•     General equilibrium analysis – attempts to model these linkages and determine the impact of the tax on
      the broader economy.

The analysis in this paper adopts a partial equilibrium approach.

The burden of duty

At first glance, it is not obvious whether the buyer or seller take the burden of the tax.

If vendors reduce the supply of properties on the market in response to an increase in duty more than buyer
demand declines, then the burden of the tax falls on buyers. However, if buyer demand is more responsive
than vendor supply when duty is increased, then the burden of duty falls on vendors. Regardless of whether a
buyer or vendor has the burden, higher taxes increase the ‘tax wedge’ between buyers and sellers and reduce
the volume of transactions. Appendix D discusses in more detail the elasticity of supply.

In Australia, buyers pay the tax, but pay less for a property than they would if the tax were not in place.
However, this also means vendors have the burden of receiving a lower price for their property that they
would receive without the tax. In countries such as the US, the tax liability can be negotiated between the
buyer and the vendor and the burden is more evenly shared.

A transfer duty on the buyer of the property shifts the demand curve to the left and lowers the price received
by the vendor. It also reduces the number of transfers required to clear the market at that price (Figure 3).

In a study of the Australian housing market, Davidoff and Leigh (2013) 3 found the burden fell on the vendor
because duty lowered house prices and reduced turnover causing the demand curve to shift to the left. More
specifically, they found a 10% increase in transfer duty lowered house prices by 4-5%. They also found that
duty lowers turnover, with a 10% increase in transfer duty lowering the number of transfers by 3% in the first
year and a further 6% if sustained over a three-year period.

Davidoff and Leigh (2013) also analysed the impact of the duty on the housing market by looking at the impact
on prices and transfers near state borders. This allowed them to remove the impact of macro and regional
factors on prices and isolate the impact of duty on the housing market. They found the effect of transfer duty
on prices tends to be larger close to state boundaries, where there are different rates of duty. They also found
neighbouring jurisdictions with lower rates of duty create competition.

Theoretically, when a buyer pays transfer duty, this reduces demand at all prices and the demand curve shifts
to the left (Figure 6). For example, a buyer who was willing to pay $1,000,000 for a property before duty is
applied will only be willing to pay $1,000,000 less the liability of the duty once it is applied. These impacts
distort the housing market, reducing its efficiency. Economists call this inefficiency a deadweight loss and have
tried to estimate the size of the loss.

Figure 6 also shows the deadweight loss on the market equivalent to the following:

    ½ (Po-Pt)/(Qo-Qt)

Pt and Qt are the after-tax price and after-tax number of transfers, respectively.

3
 Davidoff, Ian and Leigh, Andrew, How Do Stamp Duties Affect the Housing Market? (September 2013). Economic Record, Vol. 89, Issue
286, pp. 396-410, 2013.

                                                                 8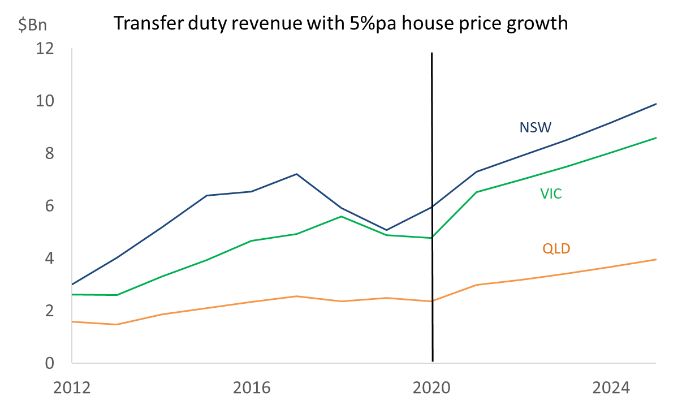
Expressed as the impact of the tax as a tax rate on the tax base, it is equivalent to:

    ½*ε*t

, where t is the tax rate and ε is a constant reflecting the elasticity of the tax base at the tax rate.

We can then estimate the deadweight loss of the tax on the economy. Appendix D provides more explanation
of the deadweight loss.

In a paper on the European housing markets, Van Ommeren and Van Leuvensteijn (2005) 4 estimated that ε is
approximately -8.0, or a 1% increase in transfer duty decreases mobility by 8%.

    Figure 6: Impact of an increase or new transfer duty
                             Price
                                                       Consumer surplus

                                                                                                Supply

                                                                      Tax revenue

                                P0
                                                                                    Dead weight loss
                                Pt

                                                                                            Demand

                                             Producer surplus
                                                                             Demand t

                                                                Qt   Q0                        Transfers

    Source: NHFIC

Using ABS data on established house and apartment prices and the number of transfers for the Australian
housing market for each type of dwelling for the past year by applying the current transfer duty regimes, we
estimate that ε is approximately -11.0 5. This suggests Australian jurisdictions are around 40% more sensitive (-
-11% vs. -8%) to duty as it is applied than many European countries and gain substantial benefits from the
increase in mobility removing transfer duty would provide.

Figure 7 shows the relationship between the number of transfers and transfer duty rates for the median
dwelling price for the states and territories.

4
 Van Ommeren, Jos and Michiel van Leuvensteijn (2005), “New Evidence of the Effect of Transaction Costs on Residential
Mobility”, Journal of Regional Science, 45(4):681-702.

5
  Estimated by regressing the log of the number of transfers/the dwelling stock and the effective tax rate, so the slope of the line of best
fit is comparable with the methodology used in Van Ommeren, Jos and Michiel van Leuvensteijn (2005).

                                                                      9
Figure 7: Transfers and the effective rate of duty at the median house price*
Source: NHFIC. * For the purposes of this paper, the effective rate is the transfer duty liability divided by the house price. Number of
transfers and median house price are for the Q1 2017 – Q4 2020 period. The median house price is calculated from the median
established house and median attached dwelling price weighted by the number of transfers for each dwelling type. There is no ACT
established house or attached dwelling price, or data on the number of transfers for the ACT.
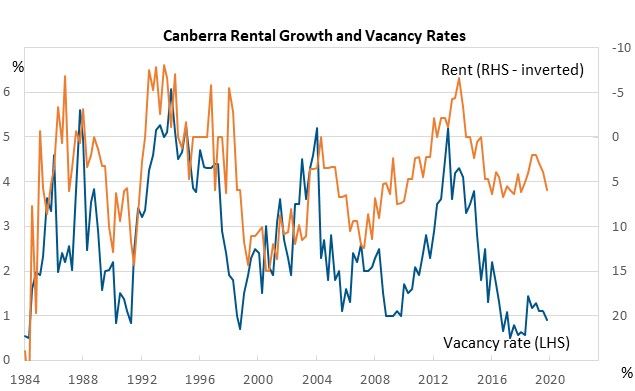
The ACT’s progress towards abolishing transfer duty means Canberra has the lowest effective rate of duty and
the highest number of transfers over the past year. VIC has Australia’s largest rate of transfer duty, but it also
has a larger number of transfers than SA and WA. NT’s lower than average transfer rate is likely due to the
small size of the market and a lack of liquidity.
Van Ewijk, C., & van Leuvensteijn, M (2010) 6 estimated that if transfer duty in the European OECD countries
and the UK was removed, GDP would increase by around 0.4% per annum, all else being equal.
In Australia, VIC has the most to gain from removing transfer duty, which costs the state economy 0.34% of
state final demand each year (Figure 8). At the other end of the spectrum, the cost of transfer duty to the NT
and Canberra economies is a relatively small (0.08% of final demand).
Figure 8: Estimated deadweight loss of transfer duty (Q1 2020 – Q1 2021)
Jurisdiction Impact of Transfer duty (%) Deadweight loss ($Abn) Deadweight loss (% SFD)
NSW -0.38 -1.60 -0.26
VIC -0.51 -1.64 -0.34
QLD -0.31 -0.50 -0.14
SA -0.41 -0.24 -0.20
WA -0.33 -0.25 -0.12
TAS -0.35 -0.06 -0.16
NT -0.42 -0.02 -0.07
Canberra -0.27 -0.04 -0.08
Source: NHFIC, ABS. SFD is state final demand. ACT state final demand is used as a proxy for Canberra state final demand.
In Australia, property tax (mainly transfer duty, land tax and municipal rates) is a little above the OECD
average, while total tax revenue is a little below average (Figure 9 - LHS).
If we assume that house price growth is positively correlated with the number of transfers, then it would
appear Australia relies more upon on transfer duty than land tax as a tax revenue source compared to the
other OECD countries.
The same assumptions would then imply Canada relies more on transfer duty than Norway, New Zealand, and
Australia, given it saw similar house price growth to these countries, but with larger property tax revenue.
6
van Ewijk, C., & van Leuvensteijn, M. (2010), “Reduce tax on residential mobility”, VOX : Research-based Policy Analysis and Commentary
from leading Economists.
10France and the UK saw much weaker house price growth, but they generated similar property tax revenue,
suggesting they rely more upon land tax and municipal rates than transfer duty.
Ireland has a relatively low tax base and relatively low property tax. By comparison, Denmark, Germany,
Norway and the Netherlands have a relatively high tax base, but relatively low tax on property. France has a
relatively large tax base and a relatively high tax on property.
Figure 9: Global property tax
Source: OECD. BIS House price growth is price appreciation Q4 2005 to Q2 2020. Property tax includes transfer duty on residential
property transactions, land tax and municipal rates.
The design of progressive tax regimes implies that if the fixed amount is not reduced and/ or the price
brackets are not increased in proportion with increases in house prices then the effective tax rate will
increase.
Figure 10 shows that when states and territories don’t adjust duty rates and thresholds enough to offset the
large dwelling price increases, the effective rate of duty increases over time.
Even in the ACT, where transfer duty is being phased out, the rise in the median house price in Canberra has
increased transfer duty and the effective rate of duty has fallen by only 0.4%pts since the start of its phase out
period in 2013. The largest increase in the effective transfer duty rate is in NT, where it has risen by 2.2%pts
since 2002. The smallest increase in the effective rate was in Brisbane where the increase in duty was more
closely matched with the increase in the median price compared with other cities.
The findings suggest that transfer duty revenue growth is difficult to contain unless policy makers proactively
adjust tax design, which is currently not the case in Australia.
11Figure 10: Effective tax rate and house price growth by capital city
City Effective tax rate (%) Transfer duty ($) Median house price Median house price
($) growth (%)
Sydney
Q1 2002 3.3 11,915 365,000
Q1 2021 4.1 42,755 1,050,000 188%
Melbourne
Q1 2002 4.2 10,120 241,000
Q1 2021 5.4 44,540 824,500 242%
Brisbane
Q1 2002 2.8 5,113 185,000
Q1 2021 3.3 20,025 600,000 224%
Adelaide
Q1 2002 3.3 5,470 166,000
Q1 2021 4.3 22,705 525,000 216%
Perth
Q1 2002 2.9 5,510 190,000
Q1 2021 3.6 19,570 538,000 183%
Hobart
Q1 2002 2.5 3,124 123,300
Q1 2021 3.7 22,498 600,000 387%
Darwin
Q1 2002 2.7 5,222 190,000
Q1 2021 5.0 26,483 535,000 182%
Canberra
Q1 2002 3.0 7,300 245,000
Q1 2013 3.6 18,325 505,000 106%
Q1 2021 3.2 26,625 825,000 237%
Source: ABS, NHFIC, State and territory government revenue departments.
Transfer duty and the demand to purchase property
Demand to buy established houses varies between state and territory capital city markets.
We have estimated the demand curve for purchasing a property in each capital city’s housing market using
quarterly data from the ABS on the median established house price and the number of transfers in each city.
Housing is both a physical and financial asset and for the purposes of this report we consider it to be a financial
rather than physical asset.
We then use the number of transfers rather than the stock of dwellings to measure demand and are implicitly
assuming the supply of properties is fixed or inelastic in the short run. Both Davidoff and Leigh (2013) 7 and
Saunders and Tulip (2019) 8 found supply to be relatively inelastic in their work on the Australian housing
market. Furthermore, across the Australian states and territories only 0.5% to 2.0% of the stock of dwellings
was transacted each quarter in our 2002 to 2020 sample period.
In most cases the demand curve slopes downward and left to right suggesting that higher dwelling prices
reduce affordability and slow demand, resulting in fewer transfers.
7
Davidoff, Ian and Leigh, Andrew, How Do Stamp Duties Affect the Housing Market? (September 2013). Economic Record, Vol. 89, Issue
286, pp. 396-410, 2013.
8
Saunders, Trent and Tulip, Peter, “A model of the Australian Housing Market, March 2019, Research Discussion Paper, Reserve Bank of
Australia.
12Prices are adjusted for both income and mortgage payments and the number of transfers is adjusted for the
size of the housing market. By dividing the median house price by net income (gross income – mortgage
payments) we are attempting to remove differences between jurisdictions from macroeconomic impacts. The
adjustment to the number of transfers is made so that the cities are more comparable.
ABS data on the number of residential transfers has been published since 2002 and this limits our analysis. We
consider two periods in jurisdictions where transfer duty has changed.
In NSW and WA, where the transfer duty regime has not changed since 2002, the demand curve for Sydney
and Perth slopes downwards from left to right, as theory predicts (Figure 11). The slope of the demand curve
in these cities also implies that the less affordable a property, the less turnover it attracts.
In VIC, the dutiable value and the fixed amount payable at each price threshold was lifted in 2008, so we
analysed the demand curve for Melbourne for the 5-year period between 2002 and 2007 and the 5-year
period from 2012 to 2017. The net result of imposing these changes increased the effective transfer duty rate
for the median house price from an average of 4.6% between 2002 and 2007 to 5.2% between 2012 and 2017.
In June 2006, QLD raised price thresholds, fixed amounts payable at each threshold, and rates. The largest
increases in duty were imposed on the most expensive dwellings and prices close to the median saw relatively
small increases in duty.
Figure 11: Demand curves by state for the purchase of established detached houses
Source: ABS, RBA, NHFIC. Net income is average weekly earnings less mortgage payments. Mortgage payments are calculated using
the RBA standard variable mortgage rate for owner-occupiers at the median price assuming 40% equity. The median house price is the
stratified median house price. Each data point represents a quarterly observation during the period. ABS data on transfers has only
been available since 2002.
13In Brisbane during the 2012 to 2017 period, and in Melbourne during both the 2002 to 2007 and 2012 to 2017
periods, the demand curve is hard to identify suggesting other factors are at play. 9
In Adelaide and Darwin, where the transfer duty regimes have remained unchanged, markets seem to behave
in line with the law of demand (Figure 12).
In 2012, the TAS government raised price thresholds, transfer duty rates and fixed amounts payable at price
thresholds, which appears to have shifted the demand curve to the left in line with microeconomic theory. The
net result of these changes has been to increase the effective transfer duty rate from 2.5% to 3.2%.
In the ACT, transfer duty has been slowly phased out since 2012, reducing both rates and the fixed amount at
price thresholds. The impact on the Canberra market from this reform has been to shift the demand curve to
the right, again in line with microeconomic theory.
Figure 12: Demand curves by state for the purchase of established detached houses
Source: ABS, RBA, NHFIC. Net income is average weekly earnings less mortgage payments. Mortgage payments are calculated using
the RBA standard variable mortgage rate for owner-occupiers at the median price assuming 40% equity. The median house price is the
stratified median house price.
9
In micro-economics this type behaviour is not consistent with the law of demand and is described as the demand of a Veblen good. A
Veblen good is a high-quality product or status symbol and includes goods such as luxury cars or fine jewellery. The abnormal demand for
Veblen goods is influenced by conspicuous consumption, where consumers prefer to own exclusive products that are different from the
commonly preferred ones. This behaviour leads to stronger demand for a product when its price increases.
14Options for moving to a broad-based land tax
This Section develops a model of transfer duty revenue and looks at different ways to transition towards a
simple flat rate broad-based land tax. The purpose of this modelling work is not to solve the implementation
problems facing policy makers, but to bring more transparency to the challenges they face. Many of the ideas
analysed in this Section are not new and have been previously proposed by leading tax experts.
The model
The model is based on the following assumptions:
In practice, it would be more appropriate to replace a progressive transfer duty regime with a
progressive land tax. However, assuming a flat rate allows us to keep the modelling simple, with the
aim of demonstrating the nuances of the transition.
We also assume the impact of the different reform designs on revenue is neutral. In practice, there
will likely be some mismatch of foregone transfer duty against land tax revenue gained.
Land values are assumed to be two-thirds of property prices, reflecting their long-run average. The
volatility of land tax revenue should generally be lower than transfer duty revenue because it is
broad-based and applied to the entire stock of dwellings. This will naturally be less volatile than
transfer duty, which is applied to a much smaller base. In addition, land valuations used for land tax
and municipal rates are averaged over a rolling 3 or 4-year period and this introduces less volatility
into land tax revenues.
We don’t include the ACT in the modelling because it is already on a set course to completely remove transfer
duty in favour of a broad-based land tax.
Transfer duty revenue is modelled using ABS data on median prices and transfers for both established houses
and attached dwellings (multi-density and apartments). It is not possible to obtain historical data on every
transaction, so we rely on quarterly ABS data on the median house and multi-density dwelling price data and
the aggregate number of transfers. ABS data on the number of dwellings for each state and territory is also
used, with land values assumed to be two-thirds 10 of the median prices for each dwelling type.
We also adopt a consistent approach in modelling transfer duty revenue for each jurisdiction. Adopting a
different methodology for each jurisdiction would unnecessarily complicate the modelling process and make
the results of the transition less comparable between jurisdictions.
Apart from dwelling prices, the number of transfers is also source of uncertainty for transfer duty revenue.
The number of transfers tend to fluctuate with the property cycle, with the number of transfers increasing
when price growth expectations are rising and easing when they are falling.
The model estimates a simple linear regression for each jurisdiction to determine the relationship between
house prices and the number of transfers. These estimates are used to project the number of transfers for
two dwelling price growth scenarios over the phase out period:
• 2% - consistent with soft market conditions
• 5% - consistent with a more robust market.
We then apply the effective rates of duty to median prices within each jurisdiction to project the transfer duty
contribution from both established houses and multi-density dwellings.
State governments also collect transfer duty on transactions of residential land, so we include estimates of
transfer duty revenue from these transactions.
10
Land value being two-thirds of property price is reflective of the long-run average
15The ABS lending commitments data provides the number of loan commitments for both owner-occupiers and
investors when purchasing land only in each jurisdiction. This approach won’t capture transactions made
without borrowing, but this is likely to be relatively small.
Appendix B details the model of transfer duty for each jurisdiction.
Phasing out approaches
We use our model to quantify transfer duty in both long (20 years) and short (5 years) phase out periods using
the two dwelling price scenarios and estimate the effective broad-based land tax substitute. A 20-year period
is what the ACT has used to phase out transfer duty - this process began in 2013. We also look at a 5-year
period as a practical shorter-term alternative.
Long phase out
Having a low effective rate of duty is a clear advantage because it creates a low starting point when
considering swapping transfer duty revenue for a broad-based land tax.
In the long phase out approach, we assume the current tax regime remains in place over the next 20 years in
each jurisdiction, with no changes to price thresholds and the same fixed amounts payable at each dwelling
price bracket and the same rates of duty.
In this scenario, average dwelling price growth of 2% per annum in NSW delivers a 0.15% per annum average
revenue decline over the phase out period from 2021 (Figure 13). If dwelling price growth accelerates to 5%
per annum, then revenue growth would rise to 7.5% per annum.
By comparison, the NT generates an average decline of 0.9% per annum in revenue growth from a 2% per
annum average increase in dwelling prices mainly because its effective transfer duty rate is low. However, if
dwelling prices increased by 5% per annum our model projects that revenue would increase by an average of
0.5% per annum.
In QLD, 2% per annum dwelling price growth delivers an average decline of 0.8% per annum, while 5% per
annum growth lifts average annual revenue growth to 8%.
16Figure 13: Projected transfer duty revenue (20-year phase out)
Source: NHFIC. 2021 revenue figures are based on regression estimates of growth from 2020 revenue. See appendix B for more details.
The relatively weak growth in transfer duty revenue due to 2% house price growth implies that when a broad-
based land tax is substituted the average effective land tax for all jurisdictions would be only 0.26% when
applied to all properties within each jurisdiction.
If we substitute transfer duty for a broad-based land tax while maintaining a revenue-neutral setting on all
properties within jurisdictions, the average tax rate would be 0.3% in NSW and 0.36% in VIC (Figure 14). In
NSW, this is slightly higher than the current average effective municipal rate and around the same as the
benchmark in VIC.
However, substituting the transfer duty revenue from an average 5% per annum increase in dwelling prices
over the 20-year period would lift the average land tax rate required to 0.45% in NSW. In VIC, it would rise to
0.49%. The average increase in land tax rates across the states is 0.07ppts in converting a transfer duty
revenue stream underpinned by dwelling price growth of 5% per annum against one underpinned by only 2%
per annum dwelling price growth.
In its proposed reform, NSW indicated that for owner-occupiers it would set the land tax at a fixed amount of
$400 plus 0.3% of the unimproved land value, which is consistent with our estimates. The government plans
to set the fixed amount of land tax for investors at $1500 and the rate at 1.1%. Existing stamp duty
concessions for first home buyers would be replaced with a grant of up to $25,000.
Figure 14: Effective substitute land tax rates (20-year phase out): 2%pa and 5%pa house price growth (%)
NSW VIC QLD SA WA TAS NT Ave
2% pa price growth 0.30 0.36 0.26 0.20 0.23 0.22 0.22 0.26
5% pa price growth 0.45 0.49 0.41 0.20 0.27 0.26 0.19 0.33
Ave effective municipal rates 0.25 0.37 0.52 0.59 0.56 0.59 0.42 0.47
Source: NHFIC, ABS Residential share of municipal rates is total municipal rates *residential land value/ (residential land value+ commercial
land value).
17A neat swap of duty for land tax probably won’t be reflected in the practicalities of implementation. For
example, it would be difficult to set the effective rate of land tax to match an equivalent transfer duty revenue
without knowing future dwelling and land price appreciation and the number of transfers.
Equally, a neat swap takes no account of the impact of introducing a new tax on properties that haven’t traded
for some time.
When transfer duty is removed, the price of properties transacted in the market should increase and deliver a
short-term wealth gain to all existing property owners as the reform is capitalised into prices. Importantly, this
is also the price setting process for those properties, whose value should increase by the duty they would
attract if sold.
In theory, if buyers are rational and have perfect information about the period they will live in the new
property, the replacement land tax will work in the opposite direction and lower the value of all properties by
the magnitude of the land tax liability, but only after the tax is fully discounted to the period the household
occupies the property. However, in practice, uncertainty around the discount rate and tenure means it will be
difficult for households to make perfectly rational calculations on future tax liabilities.
In other words, removing duty gives buyers additional purchasing power, which is likely to be capitalised into
prices. The simultaneous introduction of the land tax adds additional non-discretionary expenditure to the
cost of owning a home and will be treated by households, or lenders, like insurance or utility costs. In a
practical sense, the new land tax may reduce the ability of the household to service their mortgage, but it
would be small relative to larger household expenses such as mortgage costs.
In its recently release Progress Paper on transfer duty reform, the NSW government found that only 53% of
respondents to their Have Your Say survey said the proposed property tax changes would help them enter the
housing market. 11
Figure 15 illustrates the impact on the value of the median house price for Sydney, Melbourne, Brisbane, and
Perth where duty is removed and simultaneously swapped for land tax. We use two scenarios – one assuming
no price appreciation and the other with an underlying 5% per annum increase in prices while the reform is
occurring. We also assume land prices increase at the same rate.
In the unlikely scenario of no price appreciation over the longer-term, the boost to dwelling prices from
removing transfer duty is eroded by the replacement land tax over around 15 years in Sydney and Brisbane,
and over 18 years in Melbourne. In every other city, removing duty over the 20-year period increases net
value. As long as the reform is done against the background of even a modest 5% increase in dwelling prices,
then the net impact of reform is not large enough to offset the lift in prices generated by the reform.
11
NSW Government, “Property Tax Proposal, June 2021.
18Figure 15: Change in value: median house price from transfer duty removal - land substitution
Source: ABS. Median established dwelling prices are used in this calculation.
In Hobart, the substituted land tax nearly offsets the positive impact on prices from the removal of duty by
2040. By comparison, the low effective rate of duty in Darwin means the impact on property value from the
reform is even smaller.
Figure 16: Change in value: median house price from transfer duty removal - land substitution
Source: ABS. Median established dwelling prices are used in this calculation
19Short phase out
The advantage in a shorter phase in period is that house price growth is likely to be more contained, so the
amount of transfer duty swapped for land tax is a much smaller. In NSW, transfer duty is projected to be only
$9.9bn after 5 years, assuming 5%pa house price growth, compared with $29.1bn by the end of the 20-year
period assuming the same price growth (Figure 17). This means that when swapping these transfer revenue
streams for land tax, the average effective rate over the transition period is 0.43% vs 0.45%.
Figure 17: Projected transfer duty revenue: (5-year phase out)
Source: NHFIC
In QLD for a 5-year phase out period, the effective land tax rate would be 0.39%, assuming 5% dwelling price
growth (Figure 18). The same dwelling price growth would result in a 0.41% effective rate over a 20-year
phase out, assuming the impact of the reform is revenue neutral. In contrast, for other states, the effective
rate decreases towards the end of the 20-year phase out because transfers decline as price increases, while
there is still positive projected growth in dwelling stock/land values.
Figure 18: Effective substitute land tax rates (5-year phase out): 2%pa and 5%pa house price growth (%)
NSW VIC QLD SA WA TAS NT Ave
2% pa price growth 0.39 0.46 0.35 0.25 0.30 0.27 0.30 0.33
5% pa price growth 0.43 0.50 0.39 0.25 0.31 0.28 0.29 0.35
Ave effective municipal rates 0.25 0.37 0.52 0.59 0.56 0.59 0.42 0.47
Source: NHFIC
The longer the phase out, the greater the revenue that needs to be raised to achieve a revenue neutral
swap. Figure 19 compares the amount of duty to be swapped for a broad-based land tax in both the 5-year
and 20-year periods. This is represented in current dollars by discounting the transfer duty revenue using both
the 2% and 5% price growth projections.
In NSW, to achieve a revenue neutral swap between transfer duty and a broad-based land tax under a slow
house price growth scenario, $94bn of revenue needs to be raised if the reform is achieved over a 20-year
period, compared with just $32bn under a 5-year transition.
20Figure 19: Net present value of transfer duty revenue by jurisdiction ($bn)
2%pa price growth NSW VIC QLD SA WA TAS NT
5 years 32.0 28.3 12.8 3.0 5.8 1.0 0.3
20 years 93.8 87.6 36.2 8.6 16.8 3.1 0.9
5%pa price growth
5 years 37.3 32.8 15.0 3.1 6.4 1.2 0.3
20 years 187.2 156.1 77.3 11.2 25.7 4.7 1.0
Source: ABS, NHFIC, RBA. The discount rate applied is the Banks’ average standard variable mortgage rate.
Considerations for policymakers
State and territory governments contemplating reform to transfer duty can consider many different
implementation designs, with a variety of exclusion options. A report from the Productivity Commission
highlights some of the design issues and options for addressing welfare impacts. 12 This section describes the
implementation design being adopted in the ACT and the considerations that the NSW government has made
public. It then discusses some of the options available to address equity considerations.
ACT approach
The ACT government has been slowly reducing transfer duty and increasing land tax since 2012. The
government has been doing this by increasing price bracket thresholds, reducing the fixed amount payable at
each threshold, and lowering the rate of duty at each price bracket.
The reduction in transfer duty revenue that has come with the reform has been replaced with an increase
in land tax.
The government plans to have duty phased out by 2032.
Homeowners who bought their property under the prior transfer duty arrangements incur a land tax
liability reasonably consistent will the decline in transfer duty.
NSW approach
The NSW state government also plans to phase out transfer duty in favour of a land tax, with a Progress Paper
recently released indicating the proposed design and showing the result of its first round of public
consultation. 13 A second round of public consultation will be completed in July and an update will be released
later in the year. Some key features of the proposal that have been made public include:
Opt-in-opt-out arrangement. Buyers will have the option to pay the tax at the point of sale (transfer duty
effectively remains) or pay a much lower land tax annually for the full tenure of ownership. Once
properties are swapped for land tax then that land tax remains in place for all future owners.
The land tax will contain a fixed amount and an ad valorem rate. The fixed amount and the variable
amount of tax payable will both be indexed.
Price thresholds will be designed to limit the number of properties initially eligible to transition to a land
tax. The Progress Paper mentions over 80% of residential properties are eligible to opt-in from day one.
The top end of the market will initially remain under the current transfer duty arrangements.
12 Productivity Commission, March 2018, “https://www.pc.gov.au/news-media/news/better-functioning-towns-cities”.
13
NSW Government, June 2021, “NSW Property Tax Proposal”.
21 The NSW government advises that the transition is likely to reduce state revenue in the short-term, but
over the long-term it would be revenue neutral. The impact on revenue will depend upon the take up of
land tax for those properties.
First home buyers will receive a grant initially capped at $25,000 in place of current transfer duty
concessions, regardless of whether they opt in to pay the land tax or transfer duty.
The NSW approach also does not impose land tax on those households who have previously bought
property under transfer duty arrangements. This limits the land tax base to only those undertaking a new
property transaction. This means land tax would have a very small base that would increase slowly over
time. Data on long-term average turnover implies it would take on average around 23 years to turn over
the entire housing stock if all transactions were settled with a land tax (Figure 20).
Figure 20: Housing transfers
NSW VIC QLD SA WA TAS NT Average
Transfers per annum as a % of housing stock (%)*
4.8 4.8 5.2 3.9 4.0 4.7 3.6 4.4
Time to turnover entire stock (years)+
21 21 19 26 25 21 28 23
Source: NHFIC, ABS. * Transfers are the number of transfers of detached and attached dwellings per annum divided by the number of
dwellings in the housing stock averaged between 2011 and 2020. +Time to turn over the entire stock is 100/ turnover per annum (%).
Land tax distribution and equity
An important consideration in any transition design is taxpayer’s equity in the replacement land tax.
Removing transfer duty in favour of a broad-based land tax will affect buyers differently at different price
points. We use the transfer duty regime in QLD to illustrate the impact of the 20-year transition at different
price points (Figure 21). Policy makers could address the distributional effect of the reform by using a
progressive land tax rather than a flat rate.
We also estimate the period it will take for the boost to wealth from the removal of duty to be fully offset by
the new land tax assuming a flat land tax rate.
Figure 21: Impact of transfer duty to broad-based land tax swap in QLD by price
House price ∆ wealth from Annual ∆ wealth from Breakeven period Net ∆ in wealth
($A ‘000) removal of duty ($) land tax ($) (years) after 20 years
(1) (2) (3) (4)
2,000 95,525 -5,500 17 3,278,113
1,000 38,025 -2,800 14 1,615,709
750 26,800 -2,100 13 1,206,476
500 15,925 -1,400 11 799,102
250 7,175 -700 10 397,663
Source: QLD Treasury, NHFIC. Column 1 is transfer duty estimated using current regime. Column 2 is the annual land tax liability
estimated using the flat rates calculated assuming 5% price growth (0.41%) in Figure 15 and a land: property valuation ratio of 66%.
Column 3 is the breakeven period or Column 1/-1* column 2. Column 4 is the value of the property after 20 years assuming 5% price
growth – column 1 + 20 *column 2.
Understanding the broad property owner cohorts and how they are affected by moving to a broad-based land
tax is an important consideration in the design of the transition, given different property values take widely
differing times to reach the breakeven point.
In the current arrangements, the largest number of contributors to transfer duty revenue are those home
buyers purchasing properties valued between $400,000-$800,000. The NT has the largest percentage of
transfers in this price bracket, followed by the ACT and QLD. NSW has the largest percentage of transfers in
22properties purchased above $2,800,000 followed by VIC and WA. TAS has the largest percentage of transfers
less than $400,000, followed by SA. Appendix C shows the number of transfers and the transfer duty payable
in each jurisdiction.
Policy makers could make the distributional effect of the reform more equitable by using a progressive land
tax rather than a flat rate. A progressive replacement land tax could be designed with the distribution of
transfer duty in mind when estimating it on the unimproved value of the land. This would ensure the revenue
distribution of the land tax mirrors the progressiveness of the transfer duty it replaces. Appendix C illustrates
the distribution of an equivalent land tax dwelling where price growth averages 3.5%, the average of 2% and
5%.
The breakeven period when a household is indifferent between paying land tax and transfer duty is quite
high: 9.5 years in NSW where the property is valued at $200,000, increasing to 17.4 years for a $3,000,000
property (Figure 22).
In every jurisdiction apart from the ACT, the breakeven period is greater than the average holding period for
most price ranges, suggesting that a typical household would be better off paying land tax than transfer duty.
The ACT is the main exception, because its reform means land tax is relatively large when compared to transfer
duty. In SA, the breakeven period is relatively large compared to the other states.
Figure 22: Breakeven and holding period (years)
Price ($'000) 200 600 1,000 1,400 1,800 2,200 2,600 3,000 Average holding period*
NSW 9.5 13.0 14.1 15.4 16.3 16.8 17.2 17.4 12.4
VIC 10.6 15.5 16.5 16.5 16.5 16.8 17.2 17.5 12.5
QLD 10.4 12.8 14.6 16.8 18.0 18.7 19.2 19.6 11.3
SA 20.5 26.8 29.3 30.4 30.9 31.3 31.6 31.8 10.1
WA 12.2 18.2 20.6 21.8 22.5 23.0 23.3 23.5 11.0
TAS 15.9 20.1 21.5 22.3 22.7 22.9 23.1 23.2 10.9
ACT 1.2 3.7 5.2 6.2 6.3 6.3 6.3 6.3 10.9
NT 14.6 25.6 25.6 25.6 25.6 25.6 25.6 25.6 9.2
Source: NHIFIC, Corelogic. * indicates average holding period for a detached dwelling in the capital city of the jurisdiction. The land tax
is estimated using the flat rates calculated assuming 5% price growth under a 5-year transition and a land: property value ratio of 66%.
The experience in the ACT also highlights the difficulty policy makers have in maintaining a revenue neutral
transition over the longer term. In the ACT municipal rates were increasing by around 5.6% per annum in the
lead up to the reform according to ABS data. 14 However, during the first 7 years of the phase out the annual
growth rate of municipal rates averaged 14.6%.
Figure 23 shows the transition has created a positive impact on the ACT government’s revenue. Transfer duty
revenue has been relatively stable, despite policymakers’ best efforts to reign in the impact of house price
appreciation on revenue growth. However, revenue from residential rates has grown strongly as the transition
has continued.
14
ABS Cat 5506, Taxation Revenue, Australia
23Figure 23: ACT revenue from transfer duty and residential rates
Source: NHFIC. ABS, ACT territory government Budget Papers. The residential contribution to total duty and total municipal rates for
FY11 to FY15 is estimated using the ratio of residential to total duty and municipal rates between FY16 and FY20. A breakdown of rates
and transfer duty is not available in the budget papers from FY11 to FY15.
Completely phasing out transfer duty in favour of a broad-based land tax means imposing a land tax on
households who own their property outright after paying transfer duty many years ago. The tax also captures
households who are either repaying a mortgage that is not their first or, repaying their first mortgage for more
than 5 years.
Property owners with no mortgage are the largest cohort in every jurisdiction apart from QLD, WA and the NT
and are clearly the most difficult to include in a broad-based land tax because the tax will introduce a new cost
(Figure 24). In this context, the NT has the advantage of having only 16% of its properties owned outright with
no mortgage.
First home buyers who have been paying their mortgage for less than 5 years own around 6% of all properties
across Australia, but in WA they are a relatively larger cohort (9%).
Investors already pay land tax and as part of the duty or land tax swap their contribution to land tax revenue
would increase further, given they own around one third of the dwelling stock.
In the NT, investors in this market own a relatively high proportion of the housing stock (49%) compared to the
other states, so their contribution to land tax revenue would be even higher. Investors also own a relatively
high proportion of the QLD housing stock.
The investor cohort is likely to be mainly Australian citizens. In the eastern state capital cities, overseas
investors will probably be a significant part of this cohort.
24Figure 24: Property owner cohorts by jurisdiction (% of all dwellings)
Property owner type NSW VIC QLD SA WA TAS NT
Owned outright 33 33 29 33 29 37 16
Owned with mortgage* 29 29 27 31 31 29 24
First home buyer+ 4 7 7 5 9 5 6
Investors 32 30 35 29 28 27 49
Other 2 2 2 3 3 2 5
Source: NHFIC, ABS. * indicates either first mortgage held for more than 5 years or not first mortgage. + indicates bought no longer than 5
years ago. The number of first home buyers over the past 5 years is estimated using the number of first home buyer loan commitments.
Understanding the broad property owner cohorts and how they are affected by moving to a broad-based
land tax is an important consideration in the design of the transition.
Credit recent buyers under the old regime
A short phase out design may include a provision where recent home buyers who paid duty under the current
scheme are credited back duty paid as they move onto a land tax.
In considering this scenario, we have analysed two options:
Total amount of duty paid over the past 5 years is credited back to the buyer in 1 year.
Total amount paid over the past 5 years is credited back evenly over 5 years.
We assume 5% dwelling price growth for each state and territory in each credit and use revenue collected in
each jurisdiction over the past 5 years. Crediting all of the revenue back in 1 year means a large fall in revenue
even with a background of solid house price growth (Figure 25). On the other hand, if the duty is credited back
to buyers over a 5-year period then revenue remains positive in each year. In this scenario, revenue received
steps up sharply after all the previously paid transfer duty is credited back.
25You can also read