Green Tax Reform in Australia in the Presence of Improved Environment-Induced Productivity Gain: Does It Offer Sustainable Recovery from a ...
←
→
Page content transcription
If your browser does not render page correctly, please read the page content below
sustainability

Article
Green Tax Reform in Australia in the Presence of
Improved Environment-Induced Productivity Gain:
Does It Offer Sustainable Recovery from a
Post-COVID-19 Recession?
Maruf Rahman Maxim *               and Kerstin K. Zander
 Northern Institute, Charles Darwin University, Casuarina, NT 0810, Australia; kerstin.zander@cdu.edu.au
 * Correspondence: marufrahman.maxim@cdu.edu.au

 Received: 6 July 2020; Accepted: 10 August 2020; Published: 12 August 2020

 Abstract: Disasters and pandemics such as COVID-19 will change the world in many ways and the
 road to redemption from the ongoing economic distress may require a novel approach. This paper
 proposes a path towards economic recovery that keeps sustainability at the forefront. A computable
 general equilibrium model is used to simulate different green tax reform (GTR) policies for triple
 dividend (TD), consisting of lower emissions, higher GDP and higher employment. The GTR design
 consists of an energy tax coupled with one of three tax revenue recycle methods: (i) reduction
 of payroll tax, (ii) reduction of goods and services tax (GST) and (iii) a mixed-recycling approach.
 The paper also presents the impact of higher productivity on the tax reform simulations, which is
 a possible positive externality of lower emissions. The study is based on the Australian economy
 and the salient findings are twofold: (i) productivity gain in the GTR context improves the GDP
 and employment outcomes in all three different simulation scenarios and (ii) GST reduction has the
 highest TD potential, followed by reduction of payroll tax.

 Keywords: green tax reform; CGE modelling; triple dividend; energy tax; positive externality

 JEL Classification: H23; C68; O44; Q48; D62

1. Introduction
     The use of environmental taxation as a policy instrument to address the negative externalities
of economic activities (e.g., pollution) has been growing over the last several decades [1]. One of
the key elements of evaluating the performance of such policies, however, is analysing the costs and
benefits of the tax-based approach. An extensive literature has stemmed from the double dividend
hypothesis [2] that environmental taxation coupled with tax revenue recycling can generate additional
economic benefits. When the tax revenue is recycled by reducing other distortionary taxes, such as
various consumption or labour taxes, it is referred to as green tax reform (GTR) or environmental
tax reform. Here, distortionary taxes refer to taxes based on factors of production such as income,
labour, capital etc. Tax on such factors essentially manifests itself as a punishment and therefore
discourages capital formation, income generation, productivity and labour. The core premise of the
double dividend hypothesis is that such distortionary taxes are harmful to the economy and taxes
should be on behaviour that should be discouraged, such as pollution. Tax revenue recycling, on the
other hand, refers to the concept of revenue neutrality of environmental tax. This can be achieved
through paying back the additional revenue generated from these pollution taxes to the households
through a lump sum payment or use the additional revenue to keep the budget unchanged by partially
replacing the tax revenues coming from distortionary taxes.

Sustainability 2020, 12, 6514; doi:10.3390/su12166514                      www.mdpi.com/journal/sustainability
Sustainability 2020, 12, 6514                                                                       2 of 17

      The efficacy of GTR in yielding double dividend is a well-researched topic, and it is generally
accepted that a sensibly designed GTR policy can attain double dividend in the form of lower emissions
of greenhouse gasses (GHGs) (primary dividend) with an additional economic benefit that comes from
the reduction of distortionary taxes (secondary dividend) [3,4]. However, the impact of the improved
environment that comes as a primary dividend of GTR on the additional economic dividend is largely
absent in the existing literature. It is worth investigating the interaction between lower emissions and
productivity to understand how this may influence the performance of GTR. This is critical because
one of the key challenges of widespread acceptance of GTR by policymakers has been the negative
outlook that the general public has on the introduction of new taxes [5]. A better and more holistic
understanding of how GTR can favourably affect the economy while at the same time reduce emissions
can make it more acceptable to the general public.
      The COVID-19 pandemic caused global economic distress in 2020 [6]. The underlying consequence
is a sharp decline in employment and overall consumption [7]. The current pandemic has also
highlighted the negative consequences of economic activities on the environment. The improvement in
the quality of environment and the reduction of pollution that has happened in such a short time due
to a reduction in human mobility and overall economic production is significant [8]. Such a realisation
has led to a push for more sustainable development, and post-COVID-19 fiscal recovery packages are
expected to have an emphasis on clean energy and reduction of GHGs [9].
      This paper offers a sustainable approach to economic growth, measuring the performance of GTR
in a triple dividend (TD) context in Australia. TD is defined as an outcome of GTR that exhibits a
cleaner environment (primary dividend), higher consumption (secondary dividend) and improved
private welfare in the form of higher employment (tertiary dividend) [10]. In the following sections,
this paper often refers to the primary dividend as the environmental dividend and the secondary and
tertiary dividends as the economic dividends.
      In terms of per capita energy consumption, Australia ranks seventh [11], and higher dependency
on fossil fuels is the fundamental reason that Australia is one of the highest in per capita CO2 emissions
among the Organization for Economic Co-operation and Development (OECD) countries [12]. Australia
is also the only developed country to rescind carbon tax due to the lack of bipartisan support for
the policy [13]. According to Copland [14], formulation of climate policies in Australia must include
antipolitical sentiments and should be a bottom up approach. These factors make Australia very
suitable for our study, which tries to discover additional economic benefits of a carbon pricing
mechanism under GTR that can offer greater public and political acceptance.
      Lower GHG emissions can reduce the adverse effects that it imposes on the wheat industry [15],
the wine industry [16], broadacre crops [17] and livestock systems [18]. A globally orchestrated reduction
of GHGs can also improve the frequency and severity of natural disasters such as droughts [19],
bushfires [20] and floods [21]. We hypothesise that the reduction of such undesirable effects can lead
to greater productivity in agriculture and livestock industries, boosting the TD outcomes of GTR
(see Figure 1). We use a computable general equilibrium (CGE) approach to simulate the increase in
productivity that comes from GTR and measure its impact on GDP (consumption, secondary dividend)
and employment (private welfare, tertiary dividend).
      The literature on GTR-driven TD is relatively scant compared to the vast literature available on
the double dividend hypothesis. Maxim [22] presents a metaregression analysis based on simulation
studies concerning GTR, showing high TD potential under specific GTR designs. In our paper,
we design simulations based on these findings to test the performance of GTR in Australia. This makes
the paper unique and novel as (i) there is no other simulation study on GTR-driven TD in Australia
and (ii) we include productivity gain that comes from improved environment in our simulation design
to make the whole scenario more realistic, which is also absent in the existing literature. Our findings
can aid policymakers in designing optimal GTR policy instruments that can generate TD. The study is
very timely and relevant due to the economic crisis caused by the 2020 COVID-19 pandemic. Therefore,
Sustainability 2020, 12, 6514 3 of 17
the findings of this study can offer greater insight to policymakers in improving the ternary problem of
Sustainability 2020, 12, x FOR PEER REVIEW 3 of 18
GHGs emissions, recession and higher unemployment.
Figure 1. Green tax reform (GTR) driven productivity gain and its impact on triple dividend (TD).
Figure 1. Green tax reform (GTR) driven productivity gain and its impact on triple dividend (TD).
The paper is organised as follows: Section 2 provides a review of the literature concerning TD
and The
GTRliterature
simulation onstudies
GTR-driven TD is relatively
in Australia; Section 3 scant compared
provides to the
an overall vast literature
summary available
of the model, on
details
the double
of the dividend
database and hypothesis.
the simulation Maxim [22] presents
designs; Section 4adescribes
metaregression analysis based
the simulation resultson andsimulation
Section 5
studies concerning GTR, showing high TD
presents the concluding remarks and policy implications. potential under specific GTR designs. In our paper, we
design simulations based on these findings to test the performance of GTR in Australia. This makes
the paper unique
2. Previous Studiesand novel as (i) there is no other simulation study on GTR-driven TD in Australia
and (ii) we include productivity gain that comes from improved environment in our simulation
There is currently no simulation study that holistically covers the TD potential in Australia,
design to make the whole scenario more realistic, which is also absent in the existing literature. Our
and the literature on simulation studies concerning environmental taxation predominantly investigates
findings can aid policymakers in designing optimal GTR policy instruments that can generate TD.
the environmental dividend and its impact on the whole economy. The earliest studies that simulated
The study is very timely and relevant due to the economic crisis caused by the 2020 COVID-19
the effect of carbon pricing without any tax revenue recycling policy reported how the environmental
pandemic. Therefore, the findings of this study can offer greater insight to policymakers in improving
benefits can come at the cost of lower trade, GDP and employment [23,24]. Further developments
the ternary problem of GHGs emissions, recession and higher unemployment.
in CGE methods led to dynamic studies investigating the effectiveness of carbon pricing through an
The paper is organised as follows: Section 2 provides a review of the literature concerning TD
emissions-trading system, and these reported more promising results see [25,26]. The latest studies
and GTR simulation studies in Australia; Section 3 provides an overall summary of the model, details
include Meng, Siriwardana [27], in which the authors found environmental benefits of carbon pricing
of the database and the simulation designs; Section 4 describes the simulation results and Section 5
but with a subtle negative impact on employment and GDP. The effect of carbon tax ranges from a
presents the concluding remarks and policy implications.
reduction in the output of the brown coal sector [28], a general shrinkage of the tourism industry [29],
a rise in electricity prices [30] and a mild to noticeable contraction of the economy [29,31]. The impact
2. Previous Studies
of an emissions trading system is examined by Tran, Siriwardana [32], where the authors report strong
There is
emissions currentlypotential
reduction no simulation studyreduction
but a 0.3% that holistically coversThe
in real GDP. thework
TD potential
of Nongin[33]Australia,
presentsand the
the literature on simulation studies concerning environmental taxation predominantly
economic impact of the current government’s policy of allocating 2.55 billion AUD for the Emissions investigates
the environmental
Reduction Fund and dividend
how it and its impact
results on the whole
in a reduction economy.
of real GDP by The0.3%
earliest studiesStrong
to 0.4%. that simulated
evidence
the effect of carbon pricing without any tax revenue recycling policy reported
for double dividend entailed by carbon taxing in Australia is reported by Fraser and Waschik [34], how the environmental
benefits
but there canis come at thesimulation
no existing cost of lower trade,
study thatGDP and employment
examines [23,24]. Further developments in
the TD potential.
CGE methods
However,led the to
TDdynamic
of GTR has studies investigating
been investigated the effectiveness
through of carbon studies
numerous simulation pricingin through an
other parts
emissions-trading system, and these reported more promising results see [25,26].
of the world. The metaregression analysis of Maxim [22] presents a synthesis of all simulation studies The latest studies
include Meng,the
that measure Siriwardana [27], in
effects of GTR onwhich the authors
CO2 emissions, found environmental
employment and GDP. The benefits of carbon pricing
metaregression shows
but withTD
strong a subtle negative
potential, impact oninemployment
predominantly and GDP.
European countries. The effect of
Nonetheless, carbon tax ranges
non-European from
countries a
also
reduction in the output of the brown coal
exhibit TD potential when GTR is kept revenue neutral. sector [28], a general shrinkage of the tourism industry [29],
a rise The
in electricity
link betweenprices [30] and carbon
pollution, a mild to noticeable
emissions, contraction
labour and land of productivity
the economyin[29,31].
the GTR Thecontext
impactis
of
examined in a handful of studies. The nexus between reduced pollution and a rise in overall report
an emissions trading system is examined by Tran, Siriwardana [32], where the authors labour
strong
supplyemissions
is presented reduction
by Williamspotential
III [35].butThea work
0.3% of
reduction in real
Jackson [36] GDP. Thehow
demonstrates workGTR ofcan
Nong [33]
expedite
presents the economic
the innovation of new impact of the
technology andcurrent government’s
cost savings, policy increasing
subsequently of allocating 2.55 billionReduction
productivity. AUD for
the Emissions Reduction Fund and how it results in a reduction of real
of CO2 emissions can also improve labour productivity [37]. The work of Pradhan and Ghosh GDP by 0.3% to 0.4%. Strong
[38]
evidence for double dividend entailed by carbon taxing in Australia is reported by Fraser and
Waschik [34], but there is no existing simulation study that examines the TD potential.
However, the TD of GTR has been investigated through numerous simulation studies in other
parts of the world. The metaregression analysis of Maxim [22] presents a synthesis of all simulation
studies that measure the effects of GTR on CO2 emissions, employment and GDP. The metaregression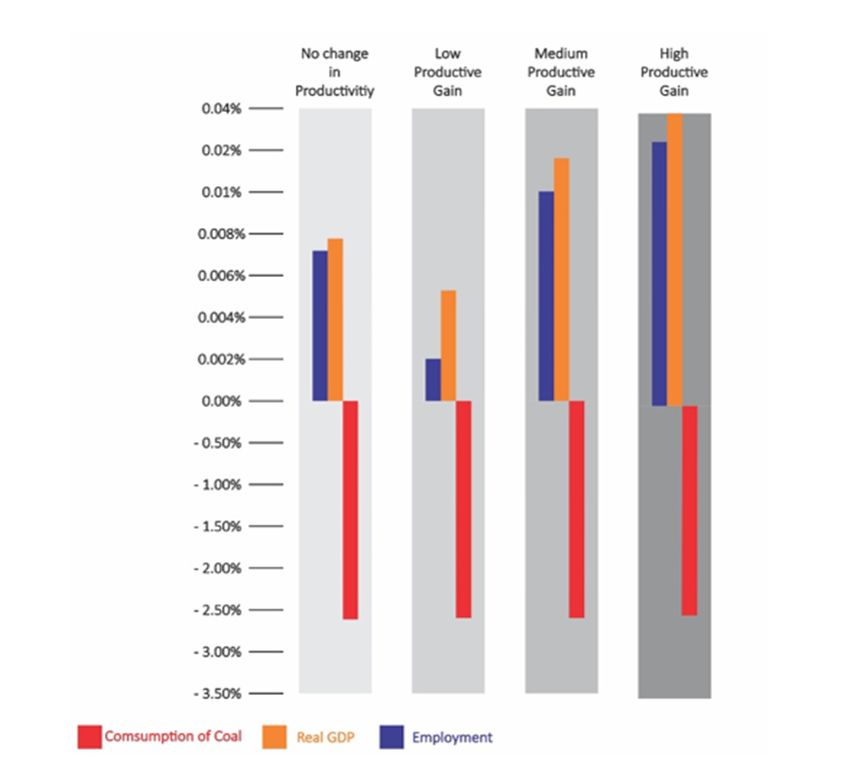
Sustainability 2020, 12, 6514                                                                             4 of 17

underscores the adverse consequences on agriculture productivity and how implementation of climate
policy to reduce CO2 emissions can minimise that.
     The existing literature postulates that there are a myriad of ways that emissions reduction can lead
to productivity gain. The literature also contains numerous evidences of GTR-induced TD. However,
the gaps that exist include (i) simulation studies that investigate the use of GTR to produce TD in
Australia and (ii) use of productivity gain as a positive externality of the primary dividend of GTR and
how this can reinforce the secondary and tertiary dividends in a simulation context. Our paper aims to
address these gaps and provide a better insight that we believe can provide an environmentally and
economically sustainable solution to the post-COVID-19 recession in Australia.

3. Data and Methods

3.1. ORANI-G Model
      The CGE model we use in this study is based on the ORANI-G single-country, multisector
comparative static model [39]. ORANI-G has been used extensively in many policy-related decisions
made in Australia and several other countries [40–43]. The ORANI model was originally developed for
the Australian economy, and ORANI-G is a generic version of this model that embodies all neoclassical
assumptions such as cost minimisation, utility maximisation and constant return to scale.
      The database used in the model is based on the Australian 2012–2013 input–output (I/O) tables [44]
compiled by the Centre of Policy Studies, Australia. The original database has 37 industries and 37
different commodities. One of the key changes we made to the database is that we disaggregated the
mining industry into two separate industries: mining_coal and mining_other. In the original database,
the mining industry is an aggregation of (i) black coal, (ii) brown coal, (iii) oil, (iv) LNG, (v) gas, (vi) iron
ore, (vii) bauxite, (viii) nonferrous metal, (ix) other mining and (x) mining service. We disaggregated
black and brown coal from mining and added them to the new industry, mining_coal. The remaining
subsectors of the mining industry are found under mining_other. This segregation was influenced by
the work of Hardisty, Clark [45], who identified that a noticeable reduction in emissions in Australia is
possible just by reducing dependency on coal for energy generation. Therefore, in our study, we add a
tax on coal in the form of an energy tax to incorporate this insight.
      The core model consists of one government, one investor and one household. Figure A1 in
Appendix A illustrates the composition of the database. The behavioural parameters of the agents,
such as Armington elasticity, labour elasticity, export demand elasticity etc. are taken from the ORANI-G
model [46].
      Matrices in the first two rows (V1BAS–V6BAS) demonstrate the flow of commodities from
domestic and imported sources to users. It can be translated as a flow of commodity c from domestic
or imported sources to a given industry i for production, capital formation, household consumption,
export, government consumption and inventories. These direct flows (domestic goods) are measured
in basic prices, which are net of the margin cost and sales taxes. For imported goods, basic prices are
net of margin costs and sales taxes but also include tariffs.
      Matrices in the third row present the flow of domestically produced commodities that are used in
margin services, namely wholesale and retail trade, utilities (electric, gas and water), financial services
(banking, insurance etc.), transport and hotels.
      The fourth row represents the tax paid by a user (V1TAX–V5TAX) for the usage of commodity c.
V6TAX is excluded because no tax needs to be paid for inventories.
      The sixth, seventh and eighth rows present the primary factor inputs, namely labour, fixed capital
and agricultural land, which are used by industries to produce the commodities. In our model, labour
is categorised into 97 different occupations. V1CAP and V1LND show the rental value of fixed capital
and agricultural land.
      Rows nine and ten exhibit the other costs and production tax, respectively. Other costs include
various production costs, the cost of holding inventories and liquidity cost.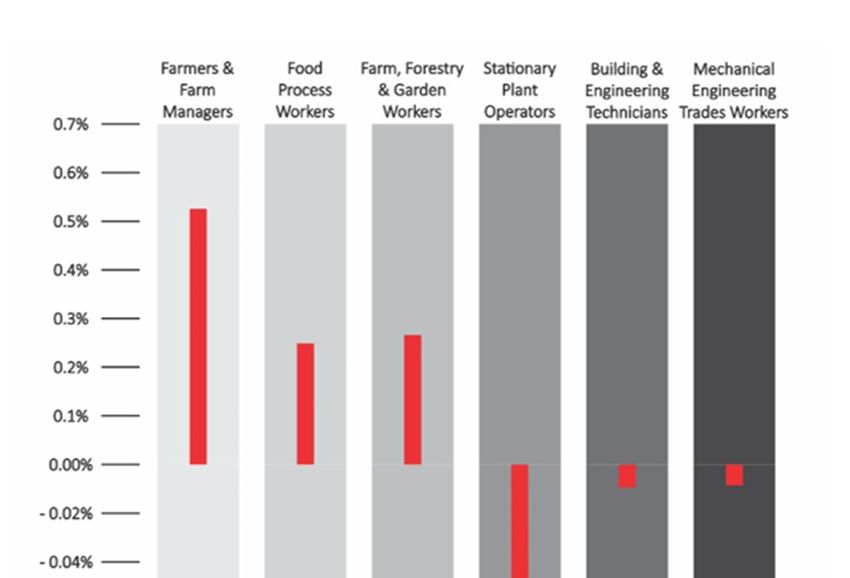
Sustainability 2020, 12, 6514                                                                        5 of 17

     The remaining two satellite matrices present (i) the multiproduction matrix (MAKE), which
presents the basic value of commodity c produced by industry i, and (ii) the tariff matrix, which shows
the total tariff paid on imported commodity c. Table A1 in Appendix A provides a summary of the I/O
database used in our model. Non-negativity except taxes and inventories, zero pure profit and market
clearing are the three most fundamental characteristics of the database.
     We implement the productivity gain by controlling the technological change variable. In our
model, a1tot denotes the input-augmenting technical change variable, which is a vector variable with
one value for each industry. The relevant equation used in the model is:

                                x1_s(c, i) − [a1_s(c, i) + a1tot(i)] = x1tot(i)                         (1)

where x1_s(c, i) is the intermediate use of imported or domestic composite, a1_s(c, i) is the technological
change of intermediate composite (imported or domestic) and x1tot(i) is the activity level or value
added. All these variables are percentage change variables. If the activity level remains constant and we
shock a1tot(i) by 5%, keeping x1_s(c, i) endogenous and a1_s(c, i) exogenous, then it would mean that
x1_s(c, i) would also need to go up by 5% to keep the equation balanced. Therefore, a positive change
in a1tot implies technical regression, whereas a negative change suggests a technical advancement.
We use this to calibrate the change of productivity in our model.
       We followed the work of De Mooij and Bovenberg [47], who used a 10% energy tax on energy
products in a GTR context, and found it optimal for the employment dividend. We followed their
approach and used an energy tax of 10% in all our simulations. In the original model, interim tax rate
on any industry is represented by the variable t, which is an endogenous variable and could, therefore,
not be shocked directly. We added an exogenous shifter f tax_si(c) with the equation of t. The shifter
 f tax_si(c) denotes uniform percentage changes in the power of tax by commodity and added shocks to
energy commodities by controlling the shifter.
       Lastly, in all our GTR simulations, we ensured tax revenue neutrality, meaning that all additional
tax revenue generated from the energy tax was recycled back into the economy through a reduction of
distortionary taxes. This revenue neutrality was ensured through a trial-and-error method. We carefully
calibrated the economic shocks to coordinate a tax reform where the amount of added tax revenue and
the reduction in tax revenue caused by a decline in different tax is kept equal.

3.2. Simulation Scenarios
       As mentioned in the previous section, the guidelines for our GTR simulation scenarios are derived
from the work on TD by Maxim [22]. The three major findings from that metaregression study that we
test in our simulations in an Australian context are (i) a reduction of payroll taxes having the highest
TD potential; (ii) a reduction of other taxes, such as food tax, having a noticeable TD potential and
(iii) a mixed tax revenue recycling approach using a reduction of multiple distortionary taxes being TD
inducive. All these tax revenue recycling schemes are simulated coupled with the energy tax.
       For each simulation scenario, we tested three possible productivity gain outcomes: low (0.25%),
medium (0.5%) and high (1%). For a more realistic outcome, the productivity gain was limited to the
agricultural industry, consisting of wheat, barley, rice, oats, other grain legumes, sugarcane, cotton,
fruits and vegetables. Since productivity gain is treated as a positive externality of the primary dividend
of GTR, we excluded it from the formation of GTR policy mix. We formed the basic details of the
revenue-neutral GTR, such as the energy tax rate, revenue recycle scheme and reduction rate, in the
absence of any productivity impact. Instead, we showed how this revenue-neutral GTR policy will
perform when different levels of productivity gains are entailed by the reduction of emissions caused
by the GTR.
       The primary dividend of GTR, which is reduction of CO2 emissions, has already been reported
time and again in the literature see [1,3,4,23,24]. The nexus between any kind of taxation on the
use of fossil fuel, leading to a lower consumption of that and, therefore, lower emissions, is quite
Sustainability 2020, 12, 6514                                                                           6 of 17

straightforward and undisputed. The impact of such tax on the economy, however, has been the
centre of enquiry. In our study, we took the primary dividend of GTR as a stylised fact and only
reported the reduction of the energy product (brown and black coal) instead of incorporating any
carbon counting. Our focus of measurement has been the secondary and tertiary dividends in the
presence of productivity gain, and this has been reported as percentage differences from the baseline
scenario. The baseline scenario measures all the factors in the absence of the GTR policies, and any
difference between the baseline scenario and our simulation scenarios describes the changes driven by
the GTR.
      Simulation 1: In our first simulation, we tested the effect of payroll tax reduction as a form of a tax
revenue recycling method in the GTR context. Reduction of payroll tax or any form of labour tax as
a tax revenue recycling scheme has been strongly associated with a rise in employment in the short
term when used in a GTR scenario see [48]. The underlying reason for this nexus is the substitution
between capital and labour. If some degree of substitution is possible between capital and labour,
a lower payroll tax makes it cheaper for the producers to substitute capital for labour. Maxim (2020)
reports that payroll tax reduction not only has the employment dividend but also has the highest TD
potential. From the producers’ perspective, a reduction of payroll taxes effectively means a reduction
in the wage bill that producers need to pay [49]. In our modified version of the ORANI-G model,
no form of labour tax is integrated, and therefore, we used a reduction of real wage as a proxy for
a reduction of payroll tax in the first simulation. Revenue neutrality is confirmed by balancing the
reduction in the total labour wage bill with the increased tax revenue driven from the energy tax.
      Simulation 2: In the second simulation, we incorporated a reduction in goods and sales tax (GST)
as the tax revenue recycling method. The effectiveness of food tax reduction was reported in both
TD [22] and double dividend [3] situations. The idea was first implemented in a CGE model under the
GTR context by Van Heerden, Gerlagh [42], who demonstrated how a reduction in food tax can yield
TD in the form of lower emissions, lower poverty and higher GDP. The underlying rationale behind a
food tax reduction and economic dividends lies in the influence it has on households. A reduction of the
tax on food, which is a necessary consumption, leads to lower household expenditure. This effectively
translates to an increase in real wage from the household’s perspective. Higher real wage can lead to
higher aggregate demand [50] and can, therefore, influence both GDP and employment. Since our
study is based on the Australian economy, we incorporate this method by reducing GST on some
relatively essential consumptions of the household. As there is no GST on food in Australia, we lowered
the GST on (i) clothing and footwear, (ii) textiles, (iii) drinks and smokes, (iv) construction, (v) transport,
(vi) rubber and plastic products and (vii) chemicals.
      Simulation 3: In our last simulation, we used a mixture of the revenue recycling methods
of simulations two and three in a revenue-neutral GTR context to test the TD potential of a
mixed-recycling approach.

3.3. Model Closures
      All three simulations were constructed based on constricted short-term assumptions, keeping
capital stock fixed. In addition, in all the simulations, we applied a 10% tax on brown and black coal.
Lastly, we applied the three scenarios of low, medium and high productivity gains to our simulations.
      In the first simulation, we applied a uniform 0.185% payroll tax reduction across all industries and
all occupation groups. The GST reduction on seven different commodities in our second simulation is
outlined in Table 1.
      In our third simulation, we used a mixture of both payroll tax and GST reductions. The payroll
tax was reduced by a uniform 0.02% across all industries. The GST reductions are outlined in Table 2.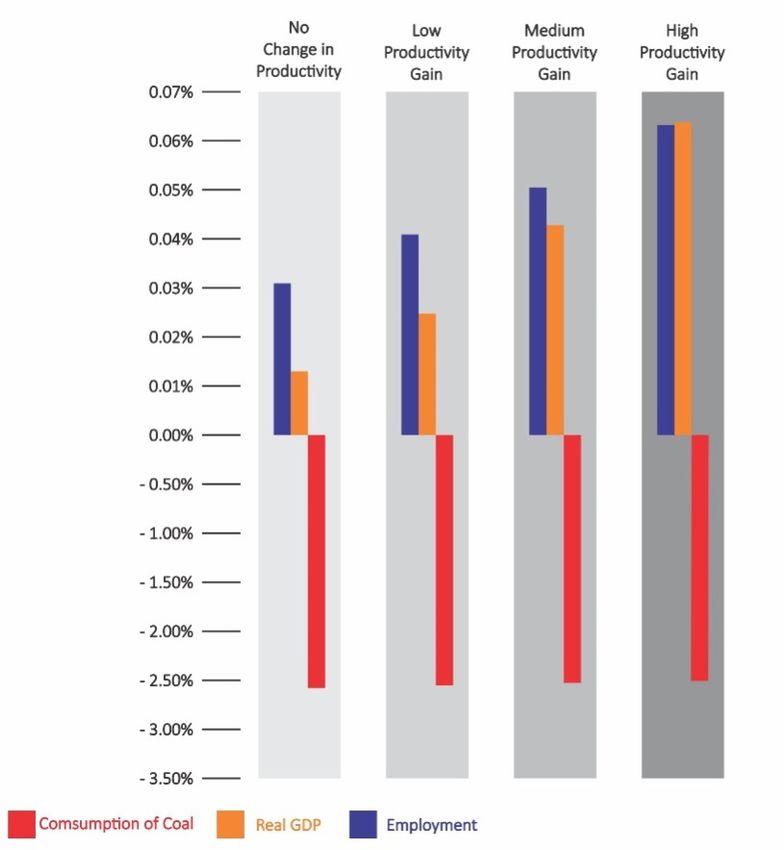
Sustainability 2020, 12, 6514                                                                               7 of 17

                                  Table 1. Goods and sales tax (GST) reduction rates.

                                   Commodity                        GST Reduction (%)
                             Clothing and footwear                          5.0
                                    Textiles                                5.0
                              Drinks and smokes                             1.0
                                 Construction                               3.0
                                   Transport                                5.0
                                   Chemicals                                3.0
                           Rubber and plastic products                      4.0

                       Table 2. GST reduction rates in a mixed tax revenue recycling approach.

                                   Commodity                        GST Reduction (%)
                             Clothing and footwear                          1.00
                                    Textiles                                1.00
                              Drinks and smokes                             0.50
                                 Construction                               1.00
                                   Transport                                1.00
                                   Chemicals                                0.50
                           Rubber and plastic products                      1.00

4. Results and Discussion
     A standalone policy of energy tax without any revenue recycling is understandably detrimental
to the overall economy. Without any presumption of productivity gain, we find that energy tax causes
employment to decline by 0.083% and real GDP to go down by 0.05%, coupled with a 2.6236% decline
in the use of brown and black coal. These numbers are useful for understanding and evaluating
the impact of GTR under all our simulation contexts. Table 3 and Figure 2 present the results of a
standalone energy tax in three different scenarios of productivity gain.

      Table 3. The effects of energy tax on employment, real GDP and coal consumption under different
      productivity gain scenarios.

                        Policy Scenario                   Employment        Real GDP      Consumption of Coal
     10% energy tax with low (0.25%) productivity gain      −0.0744%         −0.0357%            −2.6202%
   10% energy tax with medium (0.5%) productivity gain      −0.0658%         −0.0224%            −2.6169%
      10% energy tax with high (1%) productivity gain       −0.0488%         0.0041%             −2.6103%

     Our results suggest that even in the absence of any tax revenue recycling, it is possible to
partially recover the economic losses of energy tax under the high productivity gain scenario.
Nonetheless, TD is unattainable without any form of tax revenue recycling. The results also show a
negative relationship between environmental dividends and economic dividends, exhibiting higher
environmental benefits coupled with higher economic costs and vice versa, conforming with the
findings of Anger, Böhringer [51]. The positive relationship between productivity and GDP that we
observe in our results is very sensible. Such an economic growth induced by higher productivity
can subsequently create job opportunities and, therefore, lead to higher employment. This positive
relationship between productivity and employment in our results is in line with the results of
Mahmood [52] in an Australian context.
Sustainability 2020, 12, 6514 8 of 17
Sustainability 2020, 12, x FOR PEER REVIEW 8 of 18
Figure 2. The effects
Figure of energy
2. The effects tax on consumption
of energy of coal, real
tax on consumption ofGDP
coal,and
real employment under different
GDP and employment under different
productivity gain scenarios
productivity gainin the absence
scenarios of absence
in the any tax revenue
of any taxrecycle scheme.
revenue recycle scheme.
SimulationOur The results
1: results of our
suggest first
that simulation
even exhibit TD
in the absence of potential when GTR
any tax revenue is orchestrated
recycling, it is possible to
with 10% partially
energy taxrecover
and 0.185% reduction in payroll tax. We observe a high environmental
the economic losses of energy tax under the high productivity dividend
gain scenario.
coupled with reasonably
Nonetheless, TDweak economic without
is unattainable dividends.
any Our
formresults are in line
of tax revenue with those
recycling. Theofresults
existing
also show a
literature negative
on metaregression studies concerning double dividend or TD, supporting the effectiveness
relationship between environmental dividends and economic dividends, exhibiting higher
of labour environmental
tax reduction asbenefits
a revenue recycling
coupled withmethod
higherofeconomic
GTR [1,3,4,22]. The vice
costs and results are presented
versa, conforming in with the
Table 4 and Figureof
findings 3. Anger, Böhringer [51]. The positive relationship between productivity and GDP that we
observe in our results is very sensible. Such an economic growth induced by higher productivity can
Table 4. The effects of GTR on employment, GDP and coal consumption with payroll tax reduction as
subsequently create job opportunities and, therefore, lead to higher employment. This positive
the tax revenue recycling method.
relationship between productivity and employment in our results is in line with the results of
Mahmood [52] Policyin an Australian context. Employment
Scenario Real GDP Consumption of Coal
10% energySimulation
tax with 0.185%1:reduction
The results of taxes
in payroll our first simulation
0.0341% exhibit TD
0.0157% potential when GTR is orchestrated
−2.5346%
[no change in productivity]
with 10% energy tax and 0.185% reduction in payroll tax. We observe a high environmental dividend
10% energy tax with 0.185% reduction in payroll taxes
coupled [low withproductivity
reasonably 0.0427% 0.0290% −2.5312%
gain] weak economic dividends. Our results are in line with those of existing
10%literature on 0.185%
energy tax with metaregression studies
reduction in payroll taxesconcerning double dividend or TD, supporting the effectiveness
0.0513% 0.0423% −2.5279%
[medium productivity gain]
of labour tax reduction as a revenue recycling method of GTR [1,3,4,22]. The results are presented in
10% energy tax with 0.185% reduction in payroll taxes
Table 4 and Figure 3.
[high productivity gain]
0.0684% 0.0690% −2.5214%10% energy tax with 0.185% reduction in payroll
0.0427% 0.0290% −2.5312%
taxes [low productivity gain]
10% energy tax with 0.185% reduction in payroll
0.0513% 0.0423% −2.5279%
taxes [medium productivity gain]
10% energy tax with 0.185% reduction in payroll
Sustainability 2020, 12, 6514 0.0684% 0.0690% −2.5214%
9 of 17
taxes [high productivity gain]
Figure
Figure 3. 3.The
Theeffects
effectsofof GTR
GTR onon consumption
consumption ofof coal,
coal, real
real GDP
GDP and
and employment
employment with
with payroll
payroll taxtax
reduction
reductionas as
thethe
taxtax
revenue recycling
revenue method.
recycling method.
Table
Table5 and Figure
5 and Figure4 show
4 show thethe
top
topsixsix
most-affected
most-affectedoccupations
occupations under
under this GTR
this GTRdesign
design inin
thethe
absence of any productivity change. This allowed us to pinpoint the direct impact of the energy
absence of any productivity change. This allowed us to pinpoint the direct impact of the energy tax tax and
reduction of payroll
and reduction tax on occupations
of payroll in the short
tax on occupations term.
in the Theterm.
short results
Theare perfectly
results are sensible—we observe
perfectly sensible—we
that occupations in capital-intensive industries are adversely affected due to the energy
observe that occupations in capital-intensive industries are adversely affected due to the energy tax, but that
tax,
labour-intensive industriesindustries
but that labour-intensive gain moregainemployment due to labour
more employment due tobecoming cheaper, cheaper,
labour becoming thanks tothanks
the
reduction of labouroftax.
to the reduction labour tax.
Simulation 2: We find very strong evidence for TD when tax revenue is recycled through a
Table 5. The most affected occupations when tax revenue was recycled through a reduction of
reduction of GST. In particular, the secondary and tertiary dividends of GTR are much stronger under
payroll tax.
this simulation design. Reduction of GST has not been experimented extensively in CGE simulations
on the Australian economy. The effectiveness of GST reduction
Occupation in creating economic dividends is
Employment
augmented even further in the presence of different
Farmers and farm managers productivity gain scenarios. Our results comply
0.5636
with the findings of Sajeewani, Siriwardana
Food process workers[53], who reported a positive
0.264 relationship between GST
reduction and growthFarm,offorestry
real and
GDPgarden workers
in Australia. Our study 0.2803
extends this idea, showing the
Stationary plant operators −0.5219
Building and engineering technicians −0.0962
Mechanical engineering trades workers −0.0864
Simulation 2: We find very strong evidence for TD when tax revenue is recycled through a
reduction of GST. In particular, the secondary and tertiary dividends of GTR are much stronger under
this simulation design. Reduction of GST has not been experimented extensively in CGE simulations
on the Australian economy. The effectiveness of GST reduction in creating economic dividends is
augmented even further in the presence of different productivity gain scenarios. Our results comply
with the findings of Sajeewani, Siriwardana [53], who reported a positive relationship between GST
reduction and growth of real GDP in Australia. Our study extends this idea, showing the effectiveness
of GST reduction not only in augmenting real GDP but also as having strong potential for generating
TD. The results are presented in Table 6 and Figure 5.Farm, forestry and garden workers 0.2803
Stationary plant operators −0.5219
Building and engineering technicians −0.0962
Mechanical engineering trades workers −0.0864
Sustainability 2020, 12, 6514 10 of 17
Figure 4. The most affected occupations when tax revenue is recycled through payroll tax reduction.
Table 6. The
Figure effects
4. The mostofaffected
GTR onoccupations
employment, GDPtax
when and coal consumption
revenue is recycled with GSTpayroll
through reduction
tax as the tax
reduction.
revenue recycling method.
Policy Scenario Employment Real GDP Consumption of Coal
10% energy tax with various reductions in GST
0.2157% 0.1075% −2.3711%
[no change in productivity]
10% energy tax with various reductions in GST
0.2244% 0.1209% −2.3678%
[low productivity gain]
10% energy tax with various reductions in GST
0.2330% 0.1343% −2.3645%
[medium productivity gain]
10% energy tax with various reductions in GST
0.2502% 0.1611% −2.3581%
[high productivity gain]
Simulation 3: In our third simulation, we use the mixed tax revenue recycling approach with
0.02% payroll tax reduction and the various GST reductions outlined in Table 2 to recycle the tax
revenue raised from energy tax. We do not find any TD potential for this revenue-neutral GTR
approach. However, weak TD possibilities are observed when measured under various productivity
gain scenarios (see Table 7 and Figure 6). Just like all the previous simulation scenarios, we found that
productivity gain was positively correlated with the secondary and tertiary dividends, but there was a
negative relationship with the environmental dividend.10% energy tax with various reductions in GST
0.2244% 0.1209% −2.3678%
[low productivity gain]
10% energy tax with various reductions in GST
0.2330% 0.1343% −2.3645%
[medium productivity gain]
10% energy tax with various reductions in GST
Sustainability 2020, 12, 6514 0.2502% 0.1611% −2.3581% 11 of 17
[high productivity gain]
Sustainability 2020, 12, x FOR PEER REVIEW 12 of 18
Table 7. The effects of GTR on employment, GDP and coal consumption with a mixed tax revenue
recycling approach.
Real Consumption of
Policy Scenario Employment
GDP Coal
10% energy tax with 0.02% reduction in payroll
taxes and various reductions in GST [no change −0.0066% −0.0079% −2.5593%
in productivity]
10% energy tax with 0.02% reduction in payroll
taxes and various reductions in GST [low 0.0020% 0.0055% −2.5559%
productivity gain]
10% energy tax with 0.02% reduction in payroll
taxes and various reductions in GST [medium 0.0106% 0.0188% −2.5526%
productivity gain]
10% energy tax with 0.02% reduction in payroll
taxes and various reductions in GST [high 0.0276% 0.0454% −2.5461%
productivity gain]
Figure 5. The effects of GTR on coal consumption, real GDP and employment with GST reduction as
Figure 5. The effects of GTR on coal consumption, real GDP and employment with GST reduction as
the tax revenue recycling method.
the tax revenue recycling method.
Figure 6. The effects of GTR on consumption of coal, real GDP and employment with mixed tax
Figure 6. The effects of GTR on consumption of coal, real GDP and employment with mixed tax
reduction as the tax revenue recycling method.
reduction as the tax revenue recycling method.
5. Concluding Remarks and Policy Implications
Our study concludes that a sustainable recovery from the post-COVID-19 recession is possible
if GTR is employed, even in the absence of any underlying productivity gain for two revenue
recycling approaches, payroll tax reduction and GST reduction. We are not suggesting that this is the
fastest way to recovery but addressing one of the common misconceptions that any form of
environmental taxation yields environmental benefits at the cost of short-term economic contraction.
Rather, we suggest that carefully designed GTR approaches can yield TD outcomes, leading to a moreSustainability 2020, 12, 6514 12 of 17
Table 7. The effects of GTR on employment, GDP and coal consumption with a mixed tax revenue
recycling approach.
Policy Scenario Employment Real GDP Consumption of Coal
10% energy tax with 0.02% reduction in payroll taxes and
−0.0066% −0.0079% −2.5593%
various reductions in GST [no change in productivity]
10% energy tax with 0.02% reduction in payroll taxes and
0.0020% 0.0055% −2.5559%
various reductions in GST [low productivity gain]
10% energy tax with 0.02% reduction in payroll taxes and
0.0106% 0.0188% −2.5526%
various reductions in GST [medium productivity gain]
10% energy tax with 0.02% reduction in payroll taxes and
0.0276% 0.0454% −2.5461%
various reductions in GST [high productivity gain]
5. Concluding Remarks and Policy Implications
Our study concludes that a sustainable recovery from the post-COVID-19 recession is possible if
GTR is employed, even in the absence of any underlying productivity gain for two revenue recycling
approaches, payroll tax reduction and GST reduction. We are not suggesting that this is the fastest way
to recovery but addressing one of the common misconceptions that any form of environmental taxation
yields environmental benefits at the cost of short-term economic contraction. Rather, we suggest that
carefully designed GTR approaches can yield TD outcomes, leading to a more sustainable development.
Our study is the first of its kind to examine the effect of productivity gain that can arise as a positive
externality of GTR and we conclude that any underlying productivity gain can positively influence the
economic dividends in all three simulation approaches. We have found evidence for strong TD under
GST reduction and relatively weak TD for payroll tax reduction, and in both cases, TD gets amplified
in the presence of productivity gain. However, when the two approaches are combined, the GTR
design fails to attain TD, implying a possible interaction between GST and payroll tax. This should
be investigated further in future studies. More exploration is also required to quantify the possible
productivity gains coming from GTR and emissions reduction. This can be in the form of improved
land productivity, technological innovations due to the stringency of environmental taxation and an
overall enhanced labour productivity caused by improved environment.
One of the limitations of our study is that we used a static CGE model and therefore unable
to quantify the intertemporal effects of GTR. Future researchers should conduct a dynamic study to
pinpoint the effects of GTR on TD in the presence of productivity gain in both short and long terms.
The other limitation of the study is that we excluded the quantification of emissions reduction and
hypothesized it to be a stylised fact. Future studies should include the calculation of emissions reduction
to see how our proposed GTR policies can reduce emissions in different industries. A multiregional
study can also be conducted to measure the effects of GTR policies in different states and regions.
Despite GST being an effective tool for the government to meet budgetary shortcomings [54],
we argue that GST reduction under GTR can be a very effective tool for a sustainable growth plan. GST
has been associated with inflation in Australian capital cities [55], and proposing any form of additional
taxation to curb emissions can be detrimental to households’ welfare, so any political backlash is
understandable. Moreover, the regressive nature of carbon pricing in Australia has been reported in
numerous studies [56,57], showing that environmental tax imposes more burden on lower-income
groups. We propose that a reduction of GST on certain necessary goods and services can alleviate the
burden on lower-income groups and address the income distribution problem of any direct or indirect
carbon pricing attempt, hence making it politically more acceptable.
In this study, to keep the scenarios practical, we did not apply a drastic change to any existing tax
or propose an exorbitant amount of new tax. However, to attain greater TD outcomes more stringent
polices can be used that implement the frameworks we propose in this study. This could also lead to
a more lasting solution to the emissions problem through technological innovations, consequently
paving the way to easier access to alternative energies [58].Sustainability 2020, 12, 6514 13 of 17
We hypothesise that the post-COVID-19 era will induce a paradigm change and that there will
be political motivation to make sustainable development a higher priority. Our study suggests that
the actual economic benefits of GTR are understated when measured in the absence of the positive
externality that manifests as improved environment-induced productivity gain. Therefore, future
policy decisions concerning GTR should consider this factor to assess the feasibility of such policies.
Author Contributions: M.R.M. designed the research and the simulations, collected the database, made necessary
improvements in the model and the database and wrote the original draft. K.K.Z. advised on the analysis and
interpretation of data and made comprehensive edits and critical revision of the manuscript. All authors have
read and agreed to the published version of the manuscript.
Funding: This paper was conducted as part of a PhD project financially supported by Charles Darwin University
in Darwin, Australia.
Sustainability 2020, 12, x FOR PEER REVIEW 14 of 17
Conflicts of Interest: The authors declare no conflict of interest.
Appendix A
Appendix A
Figure A1. ORANI-G absorption matrix ([46], p. 9).
Figure A1. ORANI-G absorption matrix [46, p. 09].
Table A1. Contents of the input–output data files [46, p. 70].
Code Name Dimension
1. SetsSustainability 2020, 12, 6514 14 of 17
Table A1. Contents of the input–output data files ([46], p. 70).
Code Name Dimension
1. Sets
COM Set COM commodities 38 Commodities
IND Set IND industries 38 Industries
SRC Set SRC sources 2 Sources
MAR Set MAR margin commodities 5 Margins
OCC Set OCC occupations 97 Occupations
2. Coefficients in the core database
V1BAS Intermediate basic COM*SRC*IND
V2BAS Investment basic COM*SRC*IND
V3BAS Household basic COM*SRC
V4BAS Exports basic COM
V5BAS Government basic COM*SRC
V6BAS Inventories basic COM*SRC
V1MAR Intermediate margins COM*SRC*IND*MAR
V2MAR Investment margin COM*SRC*IND*MAR
V3MAR Household margin COM*SRC*MAR
V4MAR Export margins COM*MAR
V5MAR Government margins COM*SRC*MAR
V1TAX Intermediate tax COM*SRC*IND
V2TAX Investment tax COM*SRC*IND
V3TAX Household tax COM*SRC
V4TAX Export tax COM
V5TAX Government tax COM*SRC
V1CAP Capital Rentals IND
V1LAB Labour IND*OCC
V1LND Land Rentals IND
V1PTX Production tax IND
V1OCT Other costs IND
MAKE Multiproduct matrix COM*IND
VOTAR Tariff revenue COM
References
1. Maxim, M.R.; Zander, K. Can a Green Tax Reform Entail Employment Double Dividend in European and
non-European Countries? A Survey of the Empirical Evidence. Int. J. Energy Econ. Policy 2019, 9, 218–228.
[CrossRef]
2. Tullock, G. Excess benefit. Water Resour. Res. 1967, 3, 643–644. [CrossRef]
3. Maxim, M.R.; Zander, K.K.; Patuelli, R. Green Tax Reform and Employment Double Dividend in European
and Non-European Countries: A Meta-Regression Assessment. Int. J. Energy Econ. Policy 2019, 9, 342–355.
[CrossRef]
4. Patuelli, R.; Nijkamp, P.; Pels, E. Environmental tax reform and the double dividend: A meta-analytical
performance assessment. Ecol. Econ. 2005, 55, 564–583. [CrossRef]
5. Dresner, S.; Dunne, L.; Clinch, P.; Beuermann, C. Social and political responses to ecological tax reform in
Europe: An introduction to the special issue. Energy Policy 2006, 34, 895–904. [CrossRef]
6. Nicola, M.; Alsafi, Z.; Sohrabi, C.; Kerwan, A.; Al-Jabir, A.; Iosifidis, C.; Agha, M.; Agha, R. The socio-economic
implications of the coronavirus and COVID-19 pandemic: A review. Int. J. Surg. 2020. [CrossRef]
7. Baker, S.R.; Farrokhnia, R.A.; Meyer, S.; Pagel, M.; Yannelis, C. How Does Household Spending Respond to
an Epidemic? Consumption during the 2020 COVID-19 Pandemic; 0898–2937; National Bureau of Economic
Research: Cambridge, MA, USA, 2020.
8. Muhammad, S.; Long, X.; Salman, M. COVID-19 pandemic and environmental pollution: A blessing in
disguise? Sci. Total Environ. 2020, 728, 138820. [CrossRef]
9. Hepburn, C.; O’Callaghan, B.; Stern, N.; Stiglitz, J.; Zenghelis, D. Will COVID-19 fiscal recovery packages
accelerate or retard progress on climate change? Oxf. Rev. Econ. Policy 2020, 36, 1–48. [CrossRef]Sustainability 2020, 12, 6514 15 of 17
10. Bovenberg, A.L.; van der Ploeg, F. Optimal taxation, public goods and environmental policy with involuntary
unemployment. J. Public Econ. 1996, 62, 59–83. [CrossRef]
11. The World Bank. Energy Use Per Capita—Country Rankings. Available online: https://www.theglobaleconomy.
com/rankings/energy_use_per_capita/ (accessed on 23 April 2020).
12. Shahbaz, M.; Bhattacharya, M.; Ahmed, K. CO2 emissions in Australia: Economic and non-economic drivers
in the long-run. Appl. Econ. 2017, 49, 1273–1286. [CrossRef]
13. Taylor, R.; Hoyle, R. Australia Becomes First Developed Nation to Repeal Carbon Tax. 2014. Available online:
http://www.wsj.com/articles/australia-repeals-carbon-tax-1405560964 (accessed on 20 April 2020).
14. Copland, S. Anti-politics and Global Climate Inaction: The Case of the Australian Carbon Tax. Crit. Sociol.
2020, 46, 623–641. [CrossRef]
15. Howden, M.; Jones, R.N. Risk assessment of climate change impacts on Australia’s wheat industry. In Proceedings
of the 4th International Crop Science Congress, Brisbane, Australia, 26 September–1 October 2004.
16. Webb, L.; Whetton, P.; Barlow, E. Climate change and winegrape quality in Australia. Clim. Res. 2008, 36,
99–111. [CrossRef]
17. Anwar, M.R.; Li Liu, D.; Farquharson, R.; Macadam, I.; Abadi, A.; Finlayson, J.; Wang, B.; Ramilan, T. Climate
change impacts on phenology and yields of five broadacre crops at four climatologically distinct locations in
Australia. Agric. Syst. 2015, 132, 133–144. [CrossRef]
18. Howden, S.; Crimp, S.; Stokes, C. Climate change and Australian livestock systems: Impacts, research and
policy issues. Aust. J. Exp. Agric. 2008, 48, 780–788. [CrossRef]
19. Nicholls, N. The changing nature of Australian droughts. Clim. Chang. 2004, 63, 323–336. [CrossRef]
20. Lucas, C.; Hennessy, K.; Mills, G.; Bathols, J. Bushfire Weather in Southeast. Australia: Recent Trends and Projected
Climate Change Impacts; Bushfire Cooperative Research Centre, Australian Bureau of Meteorology and CSIRO
Marine and Atmospheric Research: Melbourne, Australia, 2007.
21. Whetton, P.; Fowler, A.; Haylock, M.; Pittock, A. Implications of climate change due to the enhanced
greenhouse effect on floods and droughts in Australia. Clim. Chang. 1993, 25, 289–317. [CrossRef]
22. Maxim, M.R. Environmental fiscal reform and the possibility of triple dividend in European and non-European
countries: Evidence from a meta-regression analysis. Environ. Econ. Policy Stud. 2020, 1–24. [CrossRef]
23. McDougall, R. Short-Run Effects of a Carbon Tax; Centre of Policy Studies (CoPS): Melbourne, UK, 1993.
24. McDougall, R.A. Energy Taxes and Greenhouse Gas. Emissions in Australia; Centre of Policy Studies: Melbourne,
Australia, 1993.
25. Adams, P.D. Insurance against catastrophic climate change: How much will an emissions trading scheme
cost Australia? Aust. Econ. Rev. 2007, 40, 432–452. [CrossRef]
26. Treasury, A. Strong Growth, Low Pollution: Modelling a Carbon Price; Australian Government: Canberra,
Australian, 2011.
27. Meng, S.; Siriwardana, M.; McNeill, J. The Environmental and Economic Impact of the Carbon Tax in
Australia. Environ. Resour. Econ. 2013, 54, 313–332. [CrossRef]
28. Meng, X. Will Australian Carbon Tax Affect the Resources Boom? Results from a CGE Model. Nat. Resour. Res.
2012, 21, 495–507. [CrossRef]
29. Dwyer, L.; Forsyth, P.; Spurr, R. Wither Australian tourism? Implications of the carbon tax. J. Hosp. Tour. Manag.
2012, 19, 15–30. [CrossRef]
30. Meng, S. How may a carbon tax transform Australian electricity industry? A CGE analysis. Appl. Econ. 2014,
46, 796–812. [CrossRef]
31. Siriwardana, M.; Meng, S.; McNeill, J. A CGE assessment of the Australian carbon tax policy. Int. J. Glob.
Energy Issues 2013, 36, 242–261. [CrossRef]
32. Tran, T.M.; Siriwardana, M.; Meng, S.; Nong, D. Impact of an emissions trading scheme on Australian
households: A computable general equilibrium analysis. J. Clean. Prod. 2019, 221, 439–456. [CrossRef]
33. Nong, D. A general equilibrium impact study of the Emissions Reduction Fund in Australia by using a
national environmental and economic model. J. Clean. Prod. 2019, 216, 422–434. [CrossRef]
34. Fraser, I.; Waschik, R. The Double Dividend hypothesis in a CGE model: Specific factors and the carbon base.
Energy Econ. 2013, 39, 283–295. [CrossRef]
35. Williams, R.C., III. Environmental tax interactions when pollution affects health or productivity. J. Environ.
Econ. Manag. 2002, 44, 261–270. [CrossRef]Sustainability 2020, 12, 6514 16 of 17
36. Jackson, T. The employment and productivity effects of environmental taxation: Additional dividends or
added distractions? J. Environ. Plan. Manag. 2000, 43, 389–406. [CrossRef]
37. Lamperti, F.; Dosi, G.; Napoletano, M.; Roventini, A.; Sapio, A. Climate change and green transitions in an
agent-based integrated assessment model. Technol. Forecast. Soc. Chang. 2020, 153, 119806. [CrossRef]
38. Pradhan, B.K.; Ghosh, J. Climate policy vs. agricultural productivity shocks in a dynamic computable general
equilibrium (CGE) modeling framework: The case of a developing economy. Econ. Model. 2019, 77, 55–69.
[CrossRef]
39. Horridge, M.; Parmenter, B.R.; Pearson, K.R. ORANI-G: A General Equilibrium Model. of the Australian Economy;
Centre of Policy Studies: Melbourne, Australia, 2000.
40. Kilimani, N.; Heerden, J.V.; Bohlmann, H. Water taxation and the double dividend hypothesis.
Water Resour. Econ. 2015, 10, 68–91. [CrossRef]
41. Pui, K.L.; Othman, J. Economics and environmental implications of fuel efficiency improvement in Malaysia:
A computable general equilibrium approach. J. Clean. Prod. 2017, 156, 459–469. [CrossRef]
42. Van Heerden, J.; Gerlagh, R.; Blignaut, J.; Horridge, M.; Hess, S.; Mabugu, R.; Mabugu, M. Searching for
Triple Dividends in South Africa: Fighting CO2 pollution and poverty while promoting growth. Energy J.
2006, 27, 113–141. [CrossRef]
43. Yusuf, A.A. The Distributional Impact of Environmental Policy: The Case of Carbon Tax and Energy Pricing Reform
in Indonesia; Research Report; Environment and Economy Program for Southeast Asia: Singapore, 2008.
44. ABS. Australian National Accounts: Input-Output Tables, 2012-13. Available online: https://www.abs.
gov.au/AUSSTATS/abs@.nsf/Lookup/5209.0.55.001Main+Features12012-13?OpenDocument (accessed on
15 February 2020).
45. Hardisty, P.E.; Clark, T.S.; Hynes, R.G. Life cycle greenhouse gas emissions from electricity generation:
A comparative analysis of Australian energy sources. Energies 2012, 5, 872–897. [CrossRef]
46. Horridge, M. ORANI-G: A Generic Single-Country Computable General Equilibrium Model; Centre of Policy
Studies: Melbourne, Australia, 2003; pp. 9–70.
47. De Mooij, R.A.; Bovenberg, A.L. Environmental taxes, international capital mobility and inefficient tax
systems: Tax burden vs. tax shifting. Int. Tax Public Financ. 1998, 5, 7–39. [CrossRef]
48. Bosquet, B. Environmental tax reform: Does it work? A survey of the empirical evidence. Ecol. Econ. 2000,
34, 19–32. [CrossRef]
49. Pisauro, G. The effect of taxes on labour in efficiency wage models. J. Public Econ. 1991, 46, 329–345.
[CrossRef]
50. Bhaduri, A.; Marglin, S. Unemployment and the real wage: The economic basis for contesting political
ideologies. Camb. J. Econ. 1990, 14, 375–393. [CrossRef]
51. Anger, N.; Böhringer, C.; Löschel, A. Paying the piper and calling the tune?: A meta-regression analysis of
the double-dividend hypothesis. Ecol. Econ. 2010, 69, 1495–1502. [CrossRef]
52. Mahmood, M. Labour productivity and employment in Australian manufacturing SMEs. Int. Entrep.
Manag. J. 2008, 4, 51–62. [CrossRef]
53. Sajeewani, D.; Siriwardana, M.; Mcneill, J. Household distributional and revenue recycling effects of the
carbon price in Australia. Clim. Chang. Econ. 2015, 6, 1550012. [CrossRef]
54. Bolton, T.; Dollery, B. An empirical note on the comparative macroeconomic effects of the GST in Australia,
Canada and New Zealand. Econ. Pap. A J. Appl. Econ. Policy 2005, 24, 50–60. [CrossRef]
55. Valadkhani, A.; Layton, A.P. Quantifying the effect of the GST on inflation in Australia’s capital cities:
An intervention analysis. Aust. Econ. Rev. 2004, 37, 125–138. [CrossRef]
56. Rahman, M.M. The proposed carbon tax in Australia: Impacts on income distribution, employment and
competitiveness. In Proceedings of the International Conference on Income Distribution Theory and Policy,
Wuhan, China, 15–16 October 2011; pp. 2–13.You can also read