Electron ion coincidence measurements of molecular dynamics with intense X ray pulses - PUBDB
←
→
Page content transcription
If your browser does not render page correctly, please read the page content below
www.nature.com/scientificreports
OPEN Electron‑ion coincidence
measurements of molecular
dynamics with intense X‑ray pulses
Xiang Li1,2,9*, Ludger Inhester3,4,9, Timur Osipov1, Rebecca Boll5, Ryan Coffee1,6,
James Cryan1,6, Ave Gatton1, Tais Gorkhover4,6,8, Gregor Hartman7, Markus Ilchen5,7,
André Knie7, Ming‑Fu Lin1, Michael P. Minitti1, Clemens Weninger1, Thomas J. A. Wolf6,
Sang‑Kil Son3,4, Robin Santra3,4,8, Daniel Rolles2, Artem Rudenko2 & Peter Walter1*
Molecules can sequentially absorb multiple photons when irradiated by an intense X-ray pulse from
a free-electron laser. If the time delay between two photoabsorption events can be determined, this
enables pump-probe experiments with a single X-ray pulse, where the absorption of the first photon
induces electronic and nuclear dynamics that are probed by the absorption of the second photon.
Here we show a realization of such a single-pulse X-ray pump-probe scheme on N2 molecules, using
the X-ray induced dissociation process as an internal clock that is read out via coincident detection
of photoelectrons and fragment ions. By coincidence analysis of the kinetic energies of the ionic
fragments and photoelectrons, the transition from a bound molecular dication to two isolated atomic
ions is observed through the energy shift of the inner-shell electrons. Via ab-initio simulations, we
are able to map characteristic features in the kinetic energy release and photoelectron spectrum to
specific delay times between photoabsorptions. In contrast to previous studies where nuclear motions
were typically revealed by measuring ion kinetics, our work shows that inner-shell photoelectron
energies can also be sensitive probes of nuclear dynamics, which adds one more dimension to the
study of light-matter interactions with X-ray pulses.
Electron-ion coincidence measurements, which can provide kinematically complete information associated
with each single light-matter interaction event, are a powerful method for studying the response of atoms and
molecules to table-top laser pulses and synchrotron radiation1–4. They are expected to open up a variety of
new possibilities for imaging molecular dynamics at X-ray free-electron lasers (XFELs), in particular, enabling
channel-selective and molecular-frame measurements5. However, this method has been implemented in only
a few experiments at free-electron laser (FEL) facilities to date6–9, largely hindered by its requirement of low
interaction rates (less than one interaction event per laser shot). With several high-repetition rate X-ray free-
electron lasers now coming into operation, electron-ion coincidence measurements are becoming a more feasible
approach10 that can take full advantage of the envisioned MHz repetition rates in order to significantly increase
the information content of the experiments.
In this work, we demonstrate how an electron-ion coincidence measurement combined with a sequential
absorption of two X-ray photons from the XFEL pulse and a state-of-the-art theoretical modeling can provide
a detailed time-resolved picture of X-ray induced fragmentation of molecules. We observe a shift in the core
binding energy of the dissociating N2+2 molecular ion, which can be linked to the internuclear separation of the
two resulting ionic fragments by measuring their kinetic energies and performing ab initio calculations. Together
emonstration10 of photoelectron diffractive imaging of molecular dissociation performed using
with a recent d
similar experimental approach but focusing on the changes in photoelectron angular distributions instead of
1
Linac Coherent Light Source, SLAC National Accelerator Laboratory, Menlo Park, CA 94025, USA. 2J.R. Macdonald
Laboratory, Department of Physics, Kansas State University, Manhattan, KAN 66506, USA. 3Center for
Free‑Electron Laser Science, DESY, Notkestrasse 85, 22607 Hamburg, Germany. 4The Hamburg Centre for Ultrafast
Imaging, Luruper Chaussee 149, 22761 Hamburg, Germany. 5European XFEL, Holzkoppel 4, 22869 Schenefeld,
Germany. 6Stanford PULSE Institute, SLAC National Accelerator Laboratory, Menlo Park, CA 94025, USA. 7Institut
für Physik und CINSaT, Universität Kassel, Heinrich‑Plett‑Strasse 40, 34132 Kassel, Germany. 8Department of
Physics, Universität Hamburg, Jungiusstrasse 9, 20355 Hamburg, Germany. 9These authors contributed equally:
Xiang Li and Ludger Inhester. *email: xiangli@slac.stanford.edu; pwalter@slac.stanford.edu
Scientific Reports | (2021) 11:505 | https://doi.org/10.1038/s41598-020-79818-6 1
Vol.:(0123456789)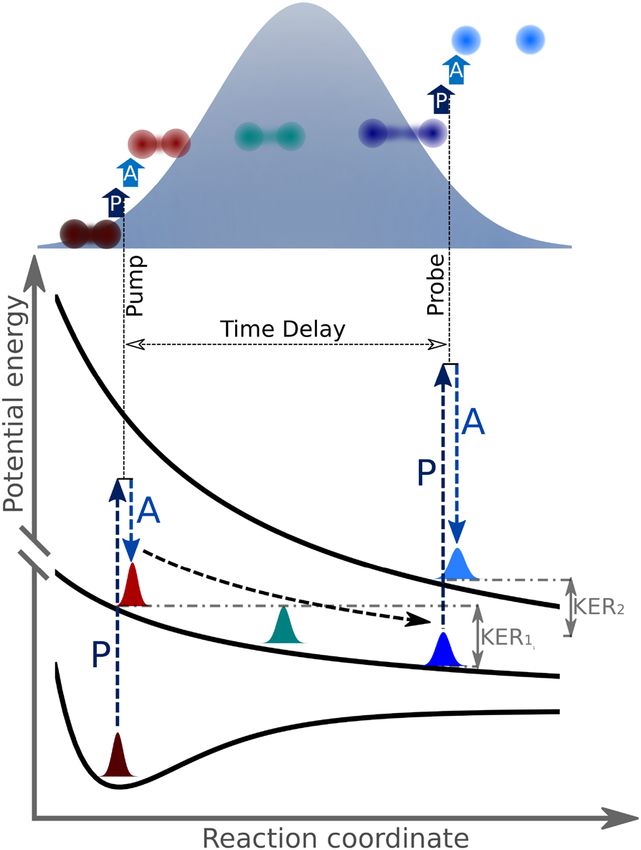
www.nature.com/scientificreports/
Figure 1. Schematic of the single-pulse pump-probe scheme: Absorption of a first photon early in the FEL
pulse leads to the emission of a photoelectron (P) and Auger electron (A) and prepares the molecule in a bound
or dissociative dicationic state. In the latter case, the second photoabsorption probes the ensuing dynamics
on the dicationic potential energy surface at a variable time delay, encoding the information on the dicationic
electronic states in the photoelectron energy, while the information about the time delay is contained in the
kinetic energy of the ionic fragments. The final kinetic energy release is the sum of KER1 and KER2.
energies, these results demonstrate the general feasibility of coincidence spectroscopy at XFELs and its promising
broad perspectives for AMO physics and ultrafast photochemistry.
As shown schematically in Fig. 1, the dynamics in the N 2 molecule are first induced and then probed by two
sequential photoabsorption events within a single FEL pulse. Although conceptually similar to typical pump-
probe schemes that employ two separate pulses to pump and probe the dynamics, respectively, this circumvents
the need to produce two independently controllable X-ray pulses. The figure also shows a sketch of the specific
pump and probe processes in the present experiment: a diatomic molecule is core-ionized with the first photoab-
sorption, which acts as the pump step. After the first photoionization, Auger decay further ionizes the molecule
into a dicationic state, which can be bound or d issociative11–14. The state of the created molecular ion is then
probed by the core-shell absorption of a second X-ray photon. The photoelectron emitted during this second
step contains dynamical information about the system prepared by the first step right at the instance of the
second photoionization. After the probe step and the ensuing Auger decay, a multiply charged repulsive state is
populated, and the molecular ion dissociates into a pair of atomic ions. If the pump step populates a dissociative
state and there is a small time delay between pump and probe photoabsorptions, the probe pulse ionizes the
dissociating molecular dication during the early stage of its dissociation process when the bond length is short.
Because of the large Coulomb repulsion in the multiply charged molecular ion, this short bond length results
in a large kinetic energy release (KER) of the final fragments. Conversely, a large time delay between the pump
and probe steps will lead to a significantly smaller Coulomb repulsion if the molecular fragments are further
apart when their charge is increased to the final charge state in the second photoionization event. This intuitive
relation between the observed KER and the molecular bond length, which provides the conceptual basis for the
so-called Coulomb explosion imaging approach15, has been recently exploited to image the temporal evolution
of molecular orbitals by measuring correlated energies of ions and Auger electrons from HCl dissociation in a
synchrotron experiment16, to time the sequential absorption of several X-ray photons by N 2 molecules17, and
to sort the photoelectron diffraction images in the above-mentioned EuXFEL e xperiment10. In our experiment,
the single-pulse pump-probe scheme enabled by the coincidence detection of ions and photoelectrons, along
with a quantitative simulation of the relation between the internuclear separation and the observed KER, allows
us to probe the evolving core binding energy of the dissociating molecular ion.
Our results obtained with the 120 Hz X-ray pulses at the Atomic, Molecular and Optical (AMO) i nstrument18
of the Linac Coherent Light Source (LCLS) show the great potential of studying light-matter interactions by
combining electron-ion coincidence measurement with future MHz XFEL facilities such as the LCLS II where
Scientific Reports | (2021) 11:505 | https://doi.org/10.1038/s41598-020-79818-6 2
Vol:.(1234567890)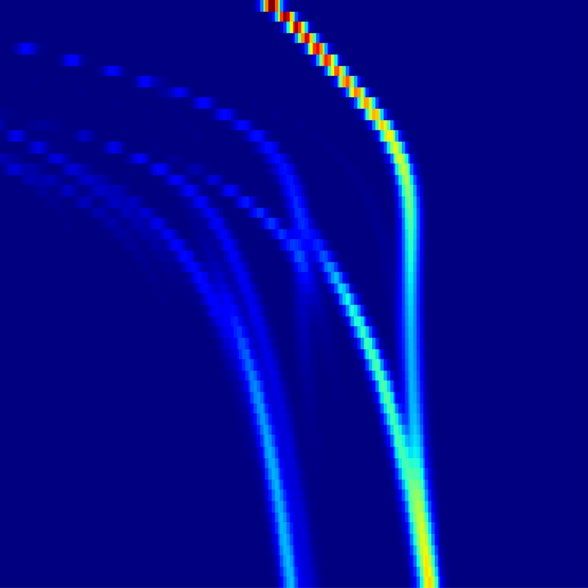
www.nature.com/scientificreports/
Figure 2. KER for the five strongest ion-ion coincidence channels observed in the interaction of 503-eV, 100-fs
(nominal value estimated from the length of electron bunch used for X-ray generation), 10-μJ XFEL pulse with
N 2 molecules. The insets show the corresponding ion time-of-flight spectrum (top) and the photoion-photoion
coincidence (PIPICO) map (bottom).
a new permanent end-station will be designated for such type of coincidence experiments. Furthermore, the
single-pulse pump-probe scheme can be a relatively simpler alternative to the more complicated two-pulse
X-ray-pump X-ray-probe c onfiguration19,20, which requires additional machine s etup21. In contrast to previous
studies in which nuclear motions were revealed by fragment ion k inetics19,20,22 or Auger e lectrons16,23, the current
work demonstrates that core-shell photoelectron energies are also sensitive probes of nuclear dynamics. When
combining coincidence detection with the recently available attosecond XFEL p ulses24, core electrons together
with the coincident ions will also be an ideal probe for studying electronic d ynamics25, as well as their coupling
with nuclear degrees of freedom.
Results
Inner-shell ionization of N 2 molecules has been studied extensively17,26–36, and many of these studies have made
use of various electron-ion coincidence methods, such that the single-photon ionization process is well charac-
terized. However, when subjected to the more intense X-ray pulses from an XFEL, each N 2 molecule can absorb
more than one photon, resulting in higher charged ions than those observed in synchrotron experiments and
more complicated Auger decay pathways17,26,33,34. In the present experiment performed at a rather modest pulse
energy of ∼10 µJ, five ion–ion coincidence channels can be identified, as shown by Fig 2: [N+, N+], [N2+, N+],
[N2+, N2+], [N3+, N+] and [N3+, N2+]. The former two have also been reported and identified in the synchrotron
studies, and their KER spectra are very similar to those observed with synchrotron r adiation28, suggesting that
these pathways mainly stem from single-photon ionization. The other three channels with higher total charge
are thus predominantly the product of sequential multi-photon ionization, and their KERs have contributions
at significantly higher energy, as expected from the higher Coulomb repulsion in these ionic final states. With
our experimental settings, sequential two-photon and single-photon ionizations dominate over higher-order
ionizations.
The photoelectron spectra detected in coincidence with three of these fragment channels are plotted in Fig. 3
along with the integrated photoelectron spectrum without any coincidence conditions. The spectra have distinct
features, reflecting the physical processes of how the corresponding ionic final states are reached. [N+, N+] is
mainly produced via single-photon absorption, where one electron is ejected by inner-shell ionization and the
other by Auger decay. The resulting photoelectron spectrum is dominated by a strong peak at approximately 93
eV, which corresponds to the difference of the photon energy (503 eV) and the N(1s) binding energy in N 2 (∼
410 eV). The broader feature on the left of the major peak, in the range of 60 to 80 eV, is attributed to photo-
electrons generated in combination with shake-up processes, where the photoionization step causes additional
excitations in the molecule.
For [N2+, N+], apart from the electron (∼93 eV) ejected by core-shell photoionization, two additional elec-
trons can be ejected either through a double Auger process or Auger decay in combination with one more valence
ionization. Both the Auger electrons and the photoelectron from valence ionization have kinetic energies much
higher than the energy range shown in Fig. 3. The broad features on the left of the major peak, between 60 and
80 eV, are again attributed to shake-up processes in combination with the first core ionization or to core-shell
ionization after valence ionization. In addition, [N2+, N+] can be created by shake-off processes, where two
electrons are emitted by the initial photoionization step. Such processes also contribute to the broad feature on
the left of the major peak at 93 eV31.
Scientific Reports | (2021) 11:505 | https://doi.org/10.1038/s41598-020-79818-6 3
Vol.:(0123456789)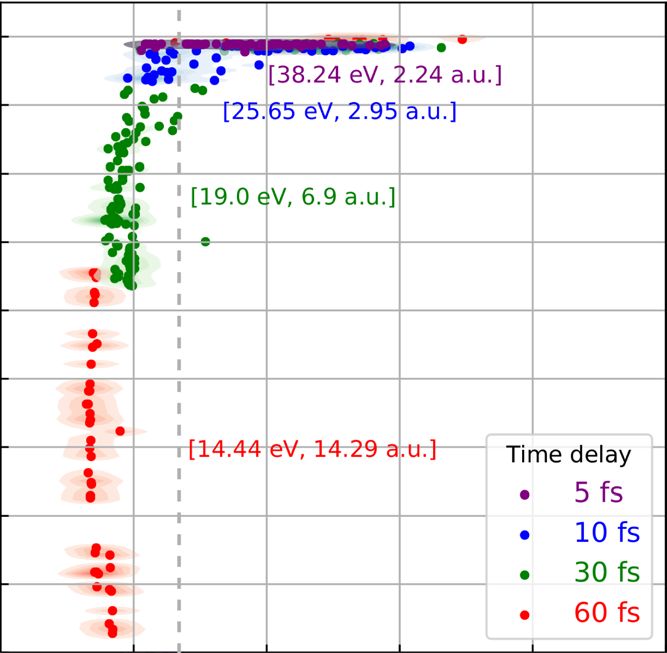
www.nature.com/scientificreports/
Figure 3. Ion-ion-coincidence-channel-resolved photoelectron kinetic energy spectra. The spectra before
inversion (i.e. radial distributions, converted to energy units, of the two-dimensional projections of the
momentum distributions) are shown in the inset. Vertical dashed lines mark the calculated photoelectron line
positions for various molecular and atomic states of N 2 (adapted from Ref.26). The vertical line labeled N+
corresponds to the transition [ 3 P (2p−1) → 4P (1s−12p−1)].
For the [N3+, N+] fragmentation channel, additional peaks at kinetic energies smaller than 93 eV can clearly
be identified. They are attributed to second core-shell photoionizations of the products created by the first pho-
toabsorption step. If the second photoabsorption happens after the Auger decay, ionization of the resulting N2+ 2
ions contributes to the peak around 64 eV, which will be discussed in details below in connection with the KER
of the ion pairs. If the second photoabsorption occurs before the core hole is filled, a double-core-hole state is
created, as observed in previous FEL e xperiments26,34,37,38. If the double core holes are located on a single N atom
[single-site double-core-hole state (ssDCH)], the kinetic energy of the second photoelectron is about 11 e V26.
If the double core holes are distributed on two separate N atoms [two-site double-core-hole state (tsDCH)], the
second photoelectron contributes to the peak near 79 eV kinetic energy. Given the relatively long pulse duration
(100 fs) in the current experiment, the contribution of double-core-hole states is expected to be relatively low.
However, as we will show in the photoelectron spectra in coincidence with [N3+, N+], the contribution from
double-core-hole events can be enhanced when selecting only the coincidences with high-KER ion pairs since
those are produced predominantly when the two photoabsorption events occurred within a short time interval
from each other.
For the more likely scenario where the second photoabsorption occurs after the Auger decay, a manifold of
dicationic N2+2 states can be occupied, some of which are quasi-bound and others are strongly d issociative11–14.
Depending on when the second photoabsorption occurs relative to the first, it probes different stages in the evolu-
tion of those dissociating N2+2 molecular ions, and the corresponding photoelectrons ejected in the second step
can have kinetic energies ranging from 53 eV to 80 eV, while the ion KER also varies considerably.
If the second photoabsorption occurs early, the N2+ 2 ion is ionized at a short bond length, resulting in high-
KER [N3+, N+] ion pairs. In contrast, if there is a longer delay between the first and second photoabsorption
steps, those molecules in a dissociative N2+2 state have evolved to a much larger internuclear distance, resulting
in a considerably lower KER. Because of the statistical nature of the two photoabsorption events, the time delay
between them can range from zero to the full length of the pulse. Note that the signals from quasi-bound states
overlap with those from dissociating N2+ 2 ions probed by the second photoaborption only at small time delays
and not at larger delays, which makes it possible to discuss the state evolution during dissociation. Figure 4a
shows the experimental KER distribution for [N3+, N+] ion pairs, with the low-KER region (KER below 27.4
eV) marked in red, and the high-KER region (KER above 27.4 eV) marked in blue. The cyan data points show
the calculated KER of the [N3+, N+] fragmentation channel assuming a Gaussian temporal pulse shape [60 fs
full width at half maximum (FWHM)]. It shows a bimodal structure, with the overall spread in KER in reason-
able agreement with the experimental distribution. To further elucidate the structure in the calculated KER
distribution, Fig. 4b displays the calculated [N3+, N+] KER plotted for discrete time delays t between the two
photoabsorption steps along with the N2+ 2 KER at the time of the second photoabsorption. At a time delay of
t = 5 fs, the KER is distributed between 20 eV and 60 eV, and the internuclear separation ranges from 2 a.u.
to 2.5 a.u. In other words, at this time delay, N2+
2 ions have either remained bound or are at the very early stage
of their dissociation. For larger time delays, the bound N2+ 2 ion distributions continue to be present in the high-
KER and short-bond-length region, whereas the distributions of dissociating N2+ 2 ions are moving to regions of
larger internuclear separation (above 2.5 a.u.) and consequently lower KER. The average KER and internuclear
separation for each time delay are indicated by the values in square brackets. For time delays larger than 5 fs,
data points with bond lengths shorter than 2.5 a.u. are excluded from the calculation of the average values in
order to only take into account the dissociating N2+ 2 ions.
Scientific Reports | (2021) 11:505 | https://doi.org/10.1038/s41598-020-79818-6 4
Vol:.(1234567890)www.nature.com/scientificreports/
Figure 4. (a) Kinetic energy distribution of the [N3+, N+] coincidence channel. The experimental kinetic
energy distribution is divided into 2 regions: a low-KER region (0–27.4 eV, red), and a high-KER region (27.4–
100 eV, blue). The calculated KER distribution for an XFEL pulse with Gaussian temporal shape [60 fs pulse
duration (FWHM)] is shown by the cyan symbols. (b) Calculated KER of the [N3+, N+] channel for discrete
time delays t between the two photoabsorption steps along with the N+-N+ internuclear distance at the time
of the second photoabsorption. The values in square brackets are the average KER and internuclear distance for
each time delay (see text). The vertical gray dashed line is the 27.4-eV boundary between the “low-KER” and
“high-KER” regions chosen in panel (a).
Figure 4b directly illustrates that a low KER can be associated with large internuclear distances and corre-
sponding long delay times. According to Fig. 4, [N3+, N+] ion pairs with a KER in the blue high-KER region are
thus produced from photoionization of N2+ 2 ions which are either in a bound state or just started to dissociate,
with bond lengths distributed mainly in the range from 2 a.u. to 2.5 a.u. For those dissociating ions, the time
delay between the first and second photoionizations is mostly smaller than 30 fs. [N3+, N+] ion pairs with a KER
falling into the red low-KER region are produced from photoionization of dissociating N2+ 2 ions at time delays
larger than or equal to 30 fs when the bond lengths are mostly larger than 2.5 a.u.
The photoelectron spectra detected in coincidence with ion pairs in the low- and high-KER regions respec-
tively are displayed in Fig. 5. As expected, the photoelectron peak from the first photoabsorption appears at 93
eV in both spectra. The peaks at lower kinetic energies, which are attributed to the second photoionization, have
different features for the low- and high-KER cases. The peak at 79 eV is enhanced when selecting the high-KER
region, which can be contributed by either ionization of N+ (2s−1 → 1s−12s−1, not shown in the figure) or the
second photoelectron in tsDCH production. Since the high-KER ion pairs are produced when the internuclear
distance is close to the N 2 equlibrium bond length, this enhanced peak cannot stem from the ionization of N+
ions. Instead, this enhanced peak must be attributed to the second photoelectron being emitted in the production
of a tsDCH state, which requires short time delays between the two photoabsorptions.
There is a second clear photoelectron peak at approximately 64 eV, whose peak position shows an energy shift
depending on the selected ion KER. The maximum of the peak shifts from 63.2 eV to 65.6 eV as the ion KER is
reduced. This shift can be attributed to a “dynamic photoelectron line shift”, i.e., a change of core binding energy
with bond length. Since the low-KER ion pairs are obtained from ionization of dissociating N+-N+ pairs at larger
Scientific Reports | (2021) 11:505 | https://doi.org/10.1038/s41598-020-79818-6 5
Vol.:(0123456789)www.nature.com/scientificreports/
Figure 5. Experimental kinetic energy spectra of photoelectrons detected in coincidence with [N3+, N+] ion
pairs falling into the low-KER and high-KER regions as defined in Fig. 4. The spectra before inversion are shown
in the inset. Vertical dashed lines mark the calculated photoelectron line positions for various molecular and
atomic states of N 2 (adapted from Ref.26).
internuclear distance, corresponding to large “pump-probe” time delays, the corresponding higher photoelectron
energy indicates that N2+ 2 core binding energy becomes smaller as its internuclear distance increases. This lower
core electron binding energy is a result of the reduced Coulomb interaction when the neighboring N+ atom is at
larger internuclear distances. In addition, there is a peak near 71 eV, which is present in the low-KER spectrum,
but absent in the high-KER one. This peak is from the ionization of N 2+ 2 at very large delays when the bond
length is so large that the N2+2 molecular ion can be approximately regarded as two isolated N atomic ions.
+
N2 produced from the first photoionization of N 2 and the subsequent Auger decay, can populate a multitude
2+
of different states as identified in39. Photoelectrons ejected from N2+
2 ions at any of these states can contribute to
the peaks within the range of 53 to 80 eV in Fig. 5. Together with the broad distribution of intermediate bond
lengths, a complete assignment of photoelectron lines is thus impossible. To further investigate the shift of N2+ 2
core electron binding energy at different time delays and internuclear separations, we pick out the 11 g dicationic
39
state, which is one of the dominant Auger channels accounting for ∼ 17% of the total Auger yield following
the first core ionization. For this state, the calculated photoelectron spectra at different internuclear distances
are plotted in Fig. 6b. At equilibrium bond lengths around 2 a.u., there is a single photoelectron line, the energy
of which moves to higher values with larger internuclear separations. Above 2.5 a.u., satellite photoelectron
lines start to emerge in the lower-energy region due to shake-up processes which, in addition to the ejection of
a core-electron, leave the molecular ion in an excited electronic configuration. A more detailed analysis of such
shake-up features can be found in Ref.40. The photoelectron energy increases with bond length for all of the pho-
toelectron lines, as expected from the reduced Coulomb interaction between the core electron in one N+ ion and
the neighboring N+ ion. Note that the 11 g state considered here asymptotically corresponds to a dissociation
into N+ ions in the 3 P configuration. Beyond an internuclear separation of 6 a.u., the photoelectron spectrum
shows two distinct photoelectron lines. When the two N+ ions are so far apart that they can be regarded as two
isolated atomic ions, these two photoelectron lines can be associated with the core ionization transition of atomic
N+ into two different spin configurations ( 3 P → 4 P and 3 P → 2P). This can be seen in Fig. 7 which shows the
calculated core binding energies for a larger range of internuclear distances, with the two dominant absorption
lines in Fig. 6 plotted as dashed lines. To follow the change of binding energies at larger internuclear distances,
we have fitted Coulomb curves for the large-distance behavior of the involved potential energy surfaces. The
solid lines show the resulting core level binding energies. The arrows indicate the asymptotic values at infinite
separation, which can be associated with core level ionization transitions 3 P → 2 P and 3 P → 4 P in atomic N+.
In order to associate the calculated spectra with the measured ones, the same spectra as in Fig. 5 are shown
in Fig. 6a, zoomed into the energy range from 53 to 73 eV. In the following discussion, the 11 g dicationic state
can be seen as a model for the “dynamic photoelectron line shift,” since we expect that photoelectron lines shift
similarly for most of the populated dicationic states. As illustrated by the vertical gray dashed lines marking the
positions of the peaks A and B, photoelectrons ejected from N2+ 2 (1 g ) at small bond lengths can be associated
1
with peak A located at lower photoelectron energy, whereas those ejected from N2+ 2 (1 g ) at larger bond lengths
1
can be associated with peak B located at higher photoelectron energy. The gray line originating from the peak
A crosses the photoelectron line at the bond length 2.2 a.u. The blue rectangle, which is horizontally centered at
peak A and has the experimental energy bin size of 2.5 eV as its width, covers the bond length range from 2 a.u.
to 2.6 a.u. This bond length range agrees reasonably well with the previously determined 2–2.5 a.u. range, which
we found to produce high-KER [N3+, N+] ion pairs. The gray line from peak B crosses the photoelectron line at
bond lengths of 3 a.u. and 5.2 a.u. The red rectangle, which is horizontally centered at peak B, covers the bond
length range from 2.6 a.u. to 6.3 a.u. This range is consistent with the previous discussion that low-KER [N3+,
Scientific Reports | (2021) 11:505 | https://doi.org/10.1038/s41598-020-79818-6 6
Vol:.(1234567890)www.nature.com/scientificreports/
Figure 6. Dynamic photoelectron line shift. (a) Experimental photoelectron kinetic energy spectra from Fig. 5,
but zoomed into the energy range from 53 eV to 73 eV, corresponding to electrons emitted from N2+ 2 in the
second photoabsorption step. (b) Calculated photoelectron kinetic energy spectra of N2+ 2 (1 g ) as a function of
1
internuclear distance. The color encodes the relative probability for a N2+
2 photoelectron to have certain energies
for a given internuclear distances. The vertical gray dashed lines mark the peak positions (A, B and C) observed
in the experimental spectra. The horizontal lines indicate the internuclear distances at which the vertical dashed
lines cross the calculated photoelectron lines. The vertical dashed lines at peak C also crosses the calculated
photoelectron line, but only at the internuclear distance larger than the range shown in the figure. The calculated
photoelectron energy at larger internuclear distances are shown in Fig. 7. The blue and red dashed rectangles
mark the regions centered at photoelectron energies of peaks A and B, respectively, with a width corresponding
to the experimental energy bin size of 2.5 eV.
Figure 7. Calculated photoelectron kinetic energy spectra of N2+ 2 (1 g ) as a function of internuclear distance.
1
The two dominant absorption lines in Fig. 6 are plotted as dashed lines. The solid curves show the photoelectron
kinetic energy at large internuclear distance, which is obtained by fitting Coulomb curves for the large-distance
behavior of the involved potential energy surfaces.
Scientific Reports | (2021) 11:505 | https://doi.org/10.1038/s41598-020-79818-6 7
Vol.:(0123456789)www.nature.com/scientificreports/
N+] ion pairs are produced from N2+ 2 at time delays larger or equal to 30 fs and bond lengths larger than 2.5 a.u.
The vertical line at peak C also crosses the calculated photoelectron line, but only at a bond length beyond the
range shown in Fig. 6. According to Fig. 7, this vertical line crosses the calculated line at a bond length and can
be assigned to ionization of isolated N+ ions [ 4 P (1s−12p−1)].
Discussion
Our experimental and theoretical results reveal the transition from a molecular ion to two isolated atomic ions
from the perspective of core electrons. Complementing previous studies where nuclear motions were revealed by
measuring ion kinetics or Auger electrons, our experiment demonstrates that the energies of the photoelectrons
ejected from the inner shell are also sensitive probes of nuclear dynamics. These results extend the concept of a
“molecular frame” measurement, which normally refers to the orientation of one or more molecular axis3,4,10,41,42,
to the molecular geometry in a more general sense, which is exemplified here by measuring the core-shell pho-
toelectron energy as a function of evolving bond length.
The single-pulse X-ray pump-probe scheme demonstrated in the current work can be a simple alternative to
the technically more challenging two-pulse X-ray pump-probe scheme. As illustrated by Fig. 1, it can be used
whenever the intermediate state is dissociative and the time delay is thus reflected in the KER of the final ionic
fragments, which is often the case for molecules after core ionization. The single-pulse scheme is not limited to
two-photon absorption, and can be generalized to the study of other processes involving more than two photons.
In that case, the pump photon is still the one that initiates the dissociation, and the probe photon is the one that
leads to the time-dependent signals such as photons, photoelectrons or Auger electrons.
In our experimental study, the KER is only divided into two regions, in order to obtain statistically more
significant results from the electron-ion coincidence analysis. More KER regions and hence more refined time
delays can be chosen for future studies at high-repetition rate XFEL facilities such as the LCLS II and European
XFEL. This will allow a more detailed experimental mapping of core electron energy levels, as the one shown
by the theory plot Fig. 6b. In the theoretical calculations presented here, only the dicationic state 11 g , which
accounts for 17% of the population, was picked out to study the dependence of the core binding energy on
bond length. Other less populated dicationic states contribute to the photoelectrons in Fig. 5 as well and cannot
be disentangled in the current experiment. Given that the dissociative dicationic states show similar trends of
core binding energy dependence especially at larger bond lengths, general insight shared by these states can be
obtained by the comparison between Fig. 6a,b. A full disentanglement of these dicationic states requires future
experiments, where Auger electrons are detected in coincidence with photoelectrons and ions.
Methods
Experiment and data analysis. X-ray pulses with a nominal pulse duration of 100 fs and a photon energy
of 503 eV were focused by a pair of Kirkpatrick-Baez mirrors into the center of the LAMP43 instrument (base
pressure below 10−10 mbar), where they crossed a pulsed supersonic molecular beam of nitrogen gas. To achieve
an interaction rate of less than one ionization event per XFEL pulse, which is necessary to maintain an acceptable
level of false coincidences, the X-ray pulse energy was attenuated to ∼ 10 µJ at the interaction point.
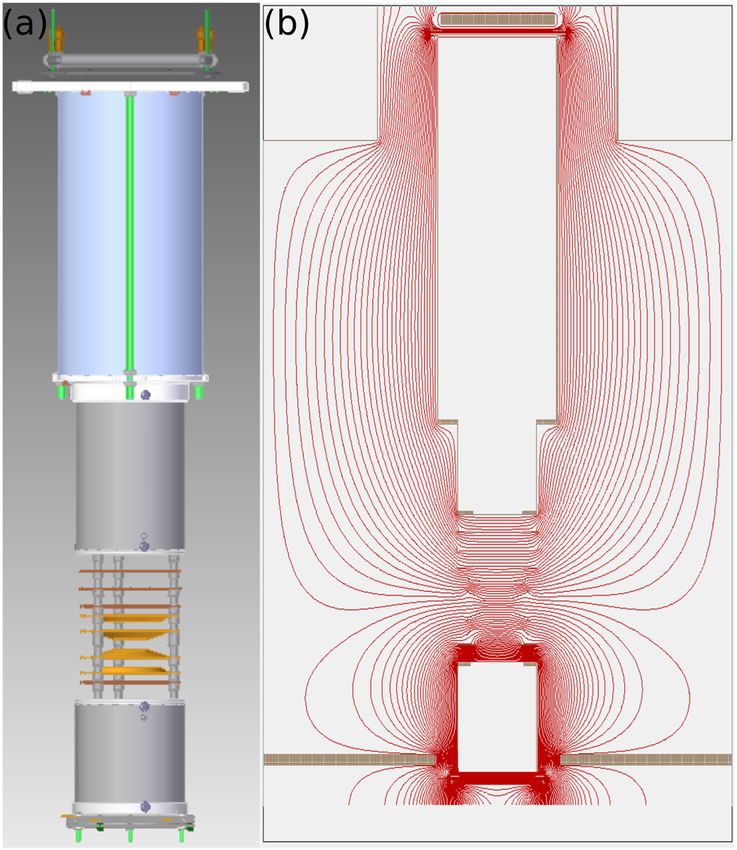
The ions and electrons generated during the interaction between X-rays and N 2 molecules were guided onto
time and position-sensitive microchannel plate (MCP) detectors by the electric field of a double-sided electron-
ion momentum imaging spectrometer43, allowing 3-D momentum reconstruction of all interaction products
on an event-by-event basis. A CAD rendering and the electric field equipotential lines of the spectrometer are
shown in Fig. 8. The ion arm of the spectrometer consisted of an 8 cm long acceleration region and a 42 cm
drift region. The electron arm consisted of a 5 cm long acceleration region and a 10 cm drift region. By applying
appropriate voltages to the spectrometer electrodes, homogeneous or Velocity-Map-Imaging (VMI) electric fields
can be generated for either of the two arms. In the current experiment, the ion arm acceleration region had an
almost homogeneous field of approximately 310 V/cm, which results in a 4 π solid-angle detection efficiency
for N+ ions with kinetic energies up to 33 eV. The ion detector (with a diameter of 120 mm) is composed of
an MCP assembly and a delay-line anode (RoentDek DLD120). The analog detector signals are amplified and
digitized. The resulting waveforms are processed using a software constant fraction discriminator. This data is
then used to reconstruct the time of flight and hit position on the detector for each particle. From those, the
momentum and kinetic energy of each ion are calculated using an empirical formula obtained from SIMION
simulations44. The ion kinetic energy is calibrated by matching the [N+, N+] kinetic energy distribution with
the one reported in Ref.28.
The electron arm of the spectrometer was operated with an inhomogeneous VMI field, capable of detecting
electrons with kinetic energies up to 120 eV over 4π solid angle. The electron detector (with a diameter of 80
mm) includes an MCP assembly, a phosphor plate, and a high-speed CCD camera (Adimec Opal-1000). For each
FEL shot, the camera image is saved together with the ion data for that shot. In the subsequent data analysis, the
detector position of each detected electron is found from the camera image by a peak-finding algorithm. The
shot-by-shot data is sorted according to the ion(s) recorded in that shot, and corresponding single-shot electron
images are integrated to produce a detector image of all electrons detected in coincidence with a certain ion
or ion pair. To remove background electrons produced by stray X-rays hitting the spectrometer electrodes, a
detector image recorded with the molecular beam turned off, was subtracted from the electron images recorded
with the molecular beam on. Note that the electron images recorded with a VMI are a two-dimensional projec-
tion of the 3D momentum distributions. The 3D momentum distribution is reconstructed from the VMI image
with the “Polar Onion Peeling” inversion algorithm45,46. The electron kinetic energy is calibrated by matching
the photoelectron peaks with those measured in a previous LCLS experiment26. To show the reliability of the
reconstruction and the statistics of the experimental data, the photoelectron energy spectra calculated from the
Scientific Reports | (2021) 11:505 | https://doi.org/10.1038/s41598-020-79818-6 8
Vol:.(1234567890)www.nature.com/scientificreports/
Figure 8. (a) 3D CAD rendering of the double-sided electron-ion momentum imaging spectrometer. (b)
SIMION-simulated equipotential lines of the electric field used in the experiment.
reconstructed momentum distributions are shown together with the radial distributions of the VMI image with
the radial axis converted to units of kinetic energy. The photoelectrons of interest fall into the kinetic energy
range from 50 eV to 100 eV.
The X-ray intensity is about 8.5 × 10¹⁴ W/cm 2 . With the nitrogen photoaborption cross section around 0.4
Mbarn at 503 eV, the probability for single-photon absorption and direct two-photon absorption (estimated
according to47) is 0.26 and 9.5 × 10⁻⁶ , respectively. The production of [N3+, N+] is mainly achieved by eject-
ing two 1s electrons followed by Auger decays. The two ejections can be achieved by a sequential two-photon
absorption, a combination of single-photon absorption and direct two-photon absorption, or two direct two-
photon absorptions, with the corresponding probabilities of the three cases estimated to be 7 × 10⁻², 2.5 × 10⁻⁶
and 9 × 10⁻¹¹, respectively. Therefore, to produce [N3+, N+] ion pair, sequential two-photon absorption is the
dominant process, because it is at least four orders of magnitude more likely to occur than the ones involving
direct two-photon absorption.
Theoretical modelling. Modelling the dissociation dynamics of N2 upon consecutive core ionizations is
challenging due to the many highly excited states that can be populated via Auger decay. To simulate the KER of
the fragments, we have therefore chosen an on-the-fly Monte-Carlo approach and conducted molecular dynam-
ics simulations in combination with the XMOLECULE electronic structure toolkit48,49. The calculated trajecto-
ries started at equilibrium bond length at rest are propagated on the respective potential energy surface. Within a
kinetic Monte-Carlo scheme, electronic transitions take place stochastically, according to transition probabilities
calculated on the fly. The electronic transition rates for Auger decay are calculated as described in Ref.49 on the
basis of first-order perturbation theory and employing atomic continuum wave functions.
In contrast to the modelling of X-ray induced ionization and fragmentation dynamics conducted in Ref.50,
here we have used finite-difference gradients for the forces on the atomic nuclei with configuration interaction
(CI) calculations based on Hartree-Fock orbitals employing a 6-31G basis s et51. The employed configurational
space includes all spin- and symmetry-adapted configurations distributing valence electrons within the valence-
orbital space (2σg 2σu 3σg πu πg 3σu ), and we restrict the calculation to the 100 lowest electronic states per irre-
ducible representations, taking into account only singlet or doublet states. The calculations are conducted in C2v
symmetry and, for core hole states, we employ orbitals obtained in an SCF calculation with localized core holes.
The rate for a specific CI state is obtained by only taking into account the dominant configuration of the CI
expansion. When we conduct an ioniziation step to another electronic configuration, we randomly pick a new CI
state from the manifold of ionized CI states with probabilities chosen according to the population of the CI state
in the respective configuration. During the propagation of the molecular geometry, we monitor the character
of the electronic state by calculating wave-function overlaps and hop to another CI state at so called “trivial”
crossings of the potential energy c urves52.
We have performed simulations for fixed delay times (5, 10, 15, 20, 25, 30, and 60 fs) between two pho-
toionizations. The KER histogram for a finite pulse duration is then obtained by integrating over delay times as
Scientific Reports | (2021) 11:505 | https://doi.org/10.1038/s41598-020-79818-6 9
Vol.:(0123456789)www.nature.com/scientificreports/
described in the following. The probability to observe a specific KER due to sequential two-photon ionization
during an X-ray pulse is given by
∞
dP (2) (�t)
P(EKER ) = d�t P(EKER |�t), (1)
0 d�t
where P(EKER |�t) is the conditional probability distribution for the KER given a particular time t between
the two photoabsorptions and dP (2) (�t)/d�t is the probability of having a delay time t . We have performed
simulations of the fragmentation with fixed delay times between the ionization steps. These simulations reveal
the probability distribution of kinetic energies √for a fixed delay time P(EKER |�t). Employing a Gaussian tempo-
ral pulse shape with a photon flux f (t) = F/( 2π τ ) exp(−t 2 /(2τ 2 )), with a fluence F, a width of τ (standard
deviation), and assuming a constant cross section σ , the timing probability dP (2) (�t)/d�t can be calculated as
∞ ∞
dP (2) (�t)
=σ 2 e−σ F dt1 dt2 f (t1 )f (t2 )
d�t −∞ t1 +�t
(2)
F 2 σ 2 e−σ F −�t 2 /(4τ 2 )
= √ e .
2 πτ
To obtain KERs for a Gaussian pulse, we have interpolated the calculated kinetic energy distributions
P(EKER |�t) along t and numerically evaluated the integral in Eq. (1) using the analytical formula in Eq. (2).
A parameter relevant for this evaluation is the X-ray pulse duration. It should be stressed that the 100 fs value
quoted in the experiment description above is the “nominal” value for the pulse duration, estimated from the
length of the electron bunch used for X-ray generation. Previous studies [(e.g., Ref.53)] at the Linac Coheret
Light Source revealed that the real measured pulse duration of the X-ray pulse was shorter, typically on a level
of about 2/3 of this nominal value. We have chosen the 60-fs pulse duration for the simulation, which is close to
the expected experimental value and was found to reproduce the experimental kinetic energy release reasonably
well, as shown in Fig. 4a.
To calculate photoelectron spectra as a function of internuclear distance, we follow the procedure described
in Ref.40. In particular, we employ CI expansions for initial dicationic and final tricationic, core-ionized states
and calculate the ionization cross sections into all tricationic channels employing an atomic continuum wave
function. For the calculation of photoelectron spectra, we employ the same configurational space as specified
above in combination with a larger basis set [6-311G(d,p)]54.
Data availability
The data that support the findings of this study are available from the corresponding authors upon reasonable
request.
Received: 3 September 2020; Accepted: 10 December 2020
References
1. Dörner, R. et al. Cold target recoil ion momentum spectroscopy: A ‘momentum microscope’ to view atomic collision dynamics.
Phys. Rep. 330, 95–192 (2000).
2. Ullrich, J. et al. Recoil-ion and electron momentum spectroscopy: Reaction-microscopes. Rep. Prog. Phys. 66, 1463–1545 (2003).
3. Jahnke, T. et al. Multicoincidence studies of photo and Auger electrons from fixed-in-space molecules using the COLTRIMS
technique. J. Electron Spectrosc. Relat. Phenom. 141, 229–238 (2004).
4. Meckel, M. et al. Laser-induced electron tunneling and diffraction. Science 320, 1478–1482 (2008).
5. Ullrich, J., Rudenko, A. & Moshammer, R. Free-electron lasers: New avenues in molecular physics and photochemistry. Annu.
Rev. Phys. Chem. 63, 635–660 (2012).
6. Kurka, M. et al. Two-photon double ionization of Ne by free-electron laser radiation: A kinematically complete experiment. J.
Phys. B At. Mol. Opt. Phys. 42, 141002 (2009).
7. Rudenko, A. et al. Exploring few-photon, few-electron reactions at FLASH: From ion yield and momentum measurements to
time-resolved and kinematically complete experiments. J. Phys. B At. Mol. Opt. Phys. 43, 194004 (2010).
8. Augustin, S. et al. Signatures of autoionization in the angular electron distribution in two-photon double ionization of Ar. Phys.
Rev. A 98, 033408 (2018).
9. Liu, Y. Two-color pump-probe experiments on O 2 and N 2 at the free-electron laser in Hamburg. Ph.D. thesis, The Ruperto-Carola-
University of Heidelberg (2019).
10. Kastirke, G. et al. Photoelectron diffraction imaging of a molecular breakup using an X-ray free-electron laser. Phys. Rev. X 10,
021052 (2020).
11. Glownia, J. M. et al. Time-resolved pump-probe experiments at the LCLS. Opt. Express 18, 17620–17630 (2010).
12. Fung, R. et al. Dynamics from noisy data with extreme timing uncertainty. Nature 532, 471–475 (2016).
13. Hanna, A. M., Vendrell, O., Ourmazd, A. & Santra, R. Laser control over the ultrafast coulomb explosion of N2+ 2 after Auger decay:
A quantum-dynamics investigation. Phys. Rev. A 95, 043419 (2017).
14. Hanna, A. M., Vendrell, O. & Santra, R. Time-resolved X-ray/optical pump-probe simulations on N 2 molecules. Struct. Dyn. 6,
024101 (2019).
15. Vager, Z., Naaman, R. & Kanter, E. P. Coulomb explosion imaging of small molecules. Science 244, 426–431 (1989).
16. Sann, H. et al. Imaging the temporal evolution of molecular orbitals during ultrafast dissociation. Phys. Rev. Lett. 117, 243002
(2016).
17. Fang, L. et al. Multiphoton ionization as a clock to reveal molecular dynamics with intense short X-ray free electron laser pulses.
Phys. Rev. Lett. 109, 263001 (2012).
18. Ferguson, K. R. et al. The atomic, molecular and optical science instrument at the Linac coherent light source. J. Synchrotron Radiat.
22, 492–497 (2015).
Scientific Reports | (2021) 11:505 | https://doi.org/10.1038/s41598-020-79818-6 10
Vol:.(1234567890)www.nature.com/scientificreports/
19. Picón, A. et al. Hetero-site-specific X-ray pump-probe spectroscopy for femtosecond intramolecular dynamics. Nat. Commun. 7,
11652 (2016).
20. Lehmann, C. S. et al. Ultrafast X-ray-induced nuclear dynamics in diatomic molecules using femtosecond X-ray-pump-X-ray-
probe spectroscopy. Phys. Rev. A 94, 013426 (2016).
21. Lutman, A. A. et al. Experimental demonstration of femtosecond two-color X-ray free-electron lasers. Phys. Rev. Lett. 110,
134801 (2013).
22. Erk, B. et al. Ultrafast charge rearrangement and nuclear dynamics upon inner-shell multiple ionization of small polyatomic
molecules. Phys. Rev. Lett. 110, 053003 (2013).
23. McFarland, B. K. et al. Ultrafast X-ray Auger probing of photoexcited molecular dynamics. Nat. Commun. 5, 4235 (2014).
24. Duris, J. et al. Tunable isolated attosecond X-ray pulses with gigawatt peak power from a free-electron laser. Nat. Photon. 14,
30–36 (2020).
25. Inhester, L., Greenman, L., Rudenko, A., Rolles, D. & Santra, R. Detecting coherent core-hole wave-packet dynamics in N2 by
time- and angle-resolved inner-shell photoelectron spectroscopy. J. Chem. Phys. 151, 054107 (2019).
26. Fang, L. et al. Double core-hole production in N 2 : Beating the Auger clock. Phys. Rev. Lett. 105, 083005 (2010).
27. Eberhardt, W., Plummer, E. W., Lyo, I. W., Carr, R. & Ford, W. K. Auger-electron ion coincidence studies of soft-X-ray-induced
fragmentation of N 2 . Phys. Rev. Lett. 58, 207–210 (1987).
28. Weber, T. et al. K-shell photoionization of CO and N 2 : Is there a link between the photoelectron angular distribution and the
molecular decay dynamics?. J. Phys. B At. Mol. Opt. Phys. 34, 3669–3678 (2001).
29. Rolles, D. et al. Isotope-induced partial localization of core electrons in the homonuclear molecule N 2 . Nature 437, 711–715 (2005).
30. Schöffler, M. S. et al. Ultrafast probing of core hole localization in N 2 . Science 320, 920–923 (2008).
31. Kaneyasu, T. et al. Auger decays of 1s shake-up and shake-off states in N 2 molecules. J. Phys. B At. Mol. Opt. Phys. 41, 135101
(2008).
32. Semenov, S. K. et al. Auger decay of 1 σg and 1 σu hole states of the N 2 molecule: Disentangling decay routes from coincidence
measurements. Phys. Rev. A 81, 043426 (2010).
33. Hoener, M. et al. Ultraintense X-ray induced ionization, dissociation, and frustrated absorption in molecular nitrogen. Phys. Rev.
Lett. 104, 253002 (2010).
34. Cryan, J. P. et al. Auger electron angular distribution of double core-hole states in the molecular reference frame. Phys. Rev. Lett.
105, 083004 (2010).
35. Cryan, J. P. et al. Molecular frame Auger electron energy spectrum from N 2 . J. Phys. B At. Mol. Opt. Phys. 45, 055601 (2012).
36. Iwayama, H., Kaneyasu, T., Hikosaka, Y. & Shigemasa, E. Stability and dissociation dynamics of N++ 2 ions following core ionization
studied by an Auger-electron-photoion coincidence method. J. Chem. Phys. 145, 034305 (2016).
37. Young, L. et al. Femtosecond electronic response of atoms to ultra-intense X-rays. Nature 466, 56–61 (2010).
38. Berrah, N. et al. Double-core-hole spectroscopy for chemical analysis with an intense X-ray femtosecond laser. Proc. Nat. Acad.
Sci. 108, 16912–16915 (2011).
39. Ågren, H. On the interpretation of molecular valence Auger spectra. J. Chem. Phys. 75, 1267–1283 (1981).
40. Inhester, L., Li, Z., Zhu, X., Medvedev, N. & Wolf, T. J. Spectroscopic signature of chemical bond dissociation revealed by calculated
core-electron spectra. J. Phys. Chem. Lett. 10, 6536–6544 (2019).
41. Holmegaard, L. et al. Photoelectron angular distributions from strong-field ionization of oriented molecules. Nat. Phys. 6,
428–432 (2010).
42. Boll, R. et al. Femtosecond photoelectron diffraction on laser-aligned molecules: Towards time-resolved imaging of molecular
structure. Phys. Rev. A 88, 061402(R) (2013).
43. Osipov, T. et al. The lamp instrument at the Linac coherent light source free-electron laser. Rev. Sci. Instrum. 89, 035112 (2018).
44. Li, X. Subsection 4.5.2, Inhomogeneous field geometry. Ph.D. thesis, Kansas State University (2019).
45. Zhao, K., Colvin, T., Hill, W. T. & Zhang, G. Deconvolving two-dimensional images of three-dimensional momentum trajectories.
Rev. Sci. Instrum. 73, 3044–3050 (2002).
46. Roberts, G. M., Nixon, J. L., Lecointre, J., Wrede, E. & Verlet, J. R. R. Toward real-time charged-particle image reconstruction using
polar onion-peeling. Rev. Sci. Instrum. 80, 053104 (2009).
47. Doumy, G. et al. Nonlinear atomic response to intense ultrashort X rays. Phys. Rev. Lett. 106, 083002 (2011).
48. Hao, Y., Inhester, L., Hanasaki, K., Son, S.-K. & Santra, R. Efficient electronic structure calculation for molecular ionization dynam-
ics at high X-ray intensity. Struct. Dyn. 2, 041707 (2015).
49. Inhester, L., Hanasaki, K., Hao, Y., Son, S.-K. & Santra, R. X-ray multiphoton ionization dynamics of a water molecule irradiated
by an X-ray free-electron laser pulse. Phys. Rev. A 94, 023422 (2016).
50. Rudenko, A. et al. Femtosecond response of polyatomic molecules to ultra-intense hard X-rays. Nature 546, 129–132 (2017).
51. Hehre, W. J., Ditchfield, R. & Pople, J. A. Self-consistent molecular orbital methods. XII. further extensions of gaussian-type basis
sets for use in molecular orbital studies of organic molecules. J. Chem. Phys. 56, 2257–2261 (1972).
52. Fernandez-Alberti, S., Roitberg, A. E., Nelson, T. & Tretiak, S. Identification of unavoided crossings in nonadiabatic photoexcited
dynamics involving multiple electronic states in polyatomic conjugated molecules. J. Chem. Phys. 137, 014512 (2012).
53. Düsterer, S. et al. Femtosecond X-ray pulse length characterization at the Linac coherent light source free-electron laser. New J.
Phys. 13, 093024 (2011).
54. Krishnan, R., Binkley, J. S., Seeger, R. & Pople, J. A. Self-consistent molecular orbital methods. XX. A basis set for correlated wave
functions. J. Chem. Phys. 72, 650–654 (1980).
Acknowledgements
This work is supported by the US Department of Energy, Office of Science, Basic Energy Sciences, Chemical
Sciences, Geosciences, and Biosciences Division, who supported the Kansas group under contract no. DE-FG02-
86ER13491. X.L., L.I. and R.S. were partially supported by award no. DE-SC0019451 from the same agency. The
authors acknowledge the invaluable support of the technical and scientific staff of the LCLS at SLAC National
Accelerator Laboratory and are grateful for their hospitality during the beamtime. Use of the Linac Coherent
Light Source (LCLS), SLAC National Accelerator Laboratory, is supported by the US Department of Energy,
Office of Science, Office of Basic Energy Sciences under contract no. DE-AC02-76SF00515. T.G. acknowledges
the Panofsky Fellowship awarded by SLAC National Accelerator Laboratory. M.I. acknowledges the Peter-Ewald
Fellowship from the Volkswagen foundation. G.H. and A.K. acknowledge support from the BMBF (05K16RKA).
Author contributions
D.R., A.R. and P.W. conceived and planned the experiment. The experimental setup was designed by T.O. and
P.W. and prepared by X.L., T.O., R.C., J.C., T.G., M.F.L., T.J.A.W. and P.W. X.L., T.O., R.B., R.C., J.C., A.G., T.G.,
G.H., M.I., A.K., M.F.L., M.M., C.W., T.J.A.W., D.R., A.R. and P.W. carried out the measurements. X.L. analyzed
and interpreted the experimental data with guidance from D.R and A.R. and input from R.B., J.C., G.H., C.W.
Scientific Reports | (2021) 11:505 | https://doi.org/10.1038/s41598-020-79818-6 11
Vol.:(0123456789)www.nature.com/scientificreports/
and P.W. L.I. performed the calculation with input from S.-K. S. and R.S. X.L., L.I, D.R., A.R. and P.W. drafted
the manuscript. All authors discussed the results and contributed to the final manuscript.
Competing interests
The authors declare no competing interests.
Additional information
Correspondence and requests for materials should be addressed to X.L. or P.W.
Reprints and permissions information is available at www.nature.com/reprints.
Publisher’s note Springer Nature remains neutral with regard to jurisdictional claims in published maps and
institutional affiliations.
Open Access This article is licensed under a Creative Commons Attribution 4.0 International
License, which permits use, sharing, adaptation, distribution and reproduction in any medium or
format, as long as you give appropriate credit to the original author(s) and the source, provide a link to the
Creative Commons licence, and indicate if changes were made. The images or other third party material in this
article are included in the article’s Creative Commons licence, unless indicated otherwise in a credit line to the
material. If material is not included in the article’s Creative Commons licence and your intended use is not
permitted by statutory regulation or exceeds the permitted use, you will need to obtain permission directly from
the copyright holder. To view a copy of this licence, visit http://creativecommons.org/licenses/by/4.0/.
© The Author(s) 2021
Scientific Reports | (2021) 11:505 | https://doi.org/10.1038/s41598-020-79818-6 12
Vol:.(1234567890)You can also read


