Target Explanation Document:
Onboard Hydrogen Storage for
 Light-Duty Fuel Cell Vehicles

           2017
←
→
Page content transcription
If your browser does not render page correctly, please read the page content below
Target Explanation Document:
Onboard Hydrogen Storage for
Light-Duty Fuel Cell Vehicles
2017
This target explanation document is a document of the U.S. DRIVE Partnership. U.S. DRIVE (Driving
Research and Innovation for Vehicle efficiency and Energy sustainability) is a voluntary, non-binding, and
non-legal partnership among the U.S. Department of Energy; USCAR, representing FCA US LLC, Ford
Motor Company, and General Motors; five energy companies – BP America, Chevron Corporation, Phillips
66 Company, ExxonMobil Corporation, and Shell Oil Products US; two utilities – Southern California
Edison and DTE Energy; and the Electric Power Research Institute (EPRI).

The Hydrogen Storage Tech Team is one of 13 U.S. DRIVE technical teams that work to accelerate the
development of pre-competitive and innovative technologies to enable a full range of efficient and clean
advanced light-duty vehicles, as well as related energy infrastructure.

For more information about U.S. DRIVE, please see the U.S. DRIVE Partnership Plan,
www.vehicles.energy.gov/about/partnerships/usdrive.html or www.uscar.org
Table of Contents

1.0 Background.………………………………………………………………………………………………….….                 1

2.0 Target Table………………………………………………………………………………………………….….                3

3.0 Summary of New / Revised Targets….....……………………...………………………………….….   5

4.0 Assumptions..………………………….…………………………………………………………………….….               7

5.0 Detailed Breakdown of Targets..…………………………………………………………………….….        9
1.0 Background:
Hydrogen (H2) storage is a key enabling technology for the advancement of hydrogen vehicles in the
automotive industry. Storing enough hydrogen (4-10 kg) onboard a light-duty vehicle to achieve a 300
to 500 mile driving range is a significant challenge. On a weight basis, hydrogen has nearly three times
the energy content of gasoline when comparing lower heating values (33 kWh/kg for H2 compared to
12 kWh/kg for gasoline). However, on a volume basis, the situation is reversed (approximately 1.3
kWh/L for 700 bar H2 at 15°C compared to 8.8 kWh/L for gasoline). In addition to energy density,
hydrogen storage systems face challenges related to cost, durability/operability, charge/discharge
rates, fuel quality, efficiency, and safety, which may limit widespread commercialization of hydrogen
vehicles.

Hydrogen storage activities within the U.S. DRIVE Partnership, 1 in conjunction with the DOE’s Fuel Cell
Technologies Office (FCTO) in the Office of Energy Efficiency and Renewable Energy, 2 are focused on
applied research and development (R&D) of technologies that can achieve a 300 to 500 mile driving
range for the full span of light-duty vehicles, while meeting packaging, cost, safety, and performance
requirements. Such technologies, incorporated within a fuel cell vehicle, would be competitive with
incumbent vehicle technologies as illustrated in Figure 1.

                            3,000,000
                                                                                      EPA Label Range

                            2,500,000

                            2,000,000
    2015 Light-duty Sales

                            1,500,000

                            1,000,000

                             500,000

                                      0
                                            250   300   350   400    450    500   550         600       650

                       Source: Polk Data, 2015
                                                                Range (Miles)

Figure 1: Distribution of 2015 Light-duty Vehicle Sales in the U.S. Market by Driving Range (EPA Label
Range) 3

From conventional vehicle data, the driving range of 300 miles has been identified as the minimum
entry point for the market. In comparison, hydrogen vehicles in DOE’s Controlled Hydrogen Fleet and
Infrastructure Demonstration and Validation Project had an Environmental Protection Agency (EPA)
adjusted driving range from 100 miles (Generation 1 observed minimum) to 250 miles (Generation 2

1
      http://www.uscar.org/guest/partnership/1/us-drive
2
      http://energy.gov/eere/fuelcells/fuel-cell-technologies-office
3
      Courtesy of Marc Melaina / Eleftheria Kontou (NREL) and David Greene (ANL)

                                                                                  1
observed maximum). 4 Since this demonstration fleet, there have been examples of fuel cell vehicles
that have approached or exceeded the minimum driving range target of 300 miles, even though
significant effort regarding cost and packaging is still required to achieve commercial viability across
various vehicle classes. Thus, it is clear that hydrogen storage systems must be improved in order to
provide the customer with the expected driving range across all vehicle platforms.
To address all of these various challenges, hydrogen storage system performance targets for light-duty
vehicles were developed through the U.S. DRIVE as shown below in Table 1. The targets apply to
system-level properties and are customer and application driven. It is intended that U.S. DRIVE will
review and update the hydrogen storage system targets approximately every 5 years to assess
technology improvements and to ensure continued alignment with market driven requirements.
Additional information on the U.S. DRIVE Partnership can be found in the Hydrogen Storage Technical
Team Roadmap. 5 In addition, further information on FCTO’s Hydrogen Storage Program can be found in
the Multi-Year Research, Development, and Demonstration Plan. 6
The original targets were set in 2003 based on attempting to be competitive with conventional gasoline
fuel systems and revised in 2009 to enable greater than 300-mile range within the allocated package
space and weight for hydrogen storage systems in representative fuel cell vehicles. Although hydrogen
storage systems have shown continuous improvement since 2003 and many targets have been met in
isolation, further advancements are still needed to meet all of the performance targets simultaneously.
The automotive original equipment manufacturers (OEMs) have introduced many fuel cell electric
vehicles (FCEVs) to a wide range of prospective customers since the original targets were formulated.
Valuable information has been and continues to be gathered with regard to vehicle performance and
customer requirements and expectations. From the experience gained with FCEV fleets and continued
hydrogen storage system development, the targets have been further refined to align with these
current advancements and implementation. Almost all FCEVs demonstrated to date have employed
some degree of hybridization. Speculation on the effects of heavily hybridized vehicles (e.g. plug-ins,
range extended etc.) was minimized in the development of these targets. If included in the future for
consideration in the target calculation assessments, significant hybridization can both positively and
negatively impact the suggested hydrogen storage system requirements and performance. For
example, a 50-mile all electric range extended vehicle would reduce the hydrogen storage system
range requirement by approximately 10 percent and potentially relax start-up time and system
response, however it would also compete for packaging volume, weight, and cost.
This document presents the Onboard Hydrogen Storage for Light-Duty Fuel Cell Vehicles Technical
Targets, describes the relevant changes since the last major target revision was completed in 2009, and
describes in length the details behind each target.
4
National Renewable Energy Laboratory, “Innovation for Our Energy Future,” http://www.nrel.gov/hydrogen/docs/cdp/cdp_2.ppt.
5
http://www1.eere.energy.gov/vehiclesandfuels/pdfs/program/hstt_roadmap_june2013.pdf
6
http://energy.gov/sites/prod/files/2015/05/f22/fcto_myrdd_storage.pdf
22.0 Target Table:
Table 1. Technical System Targets: Onboard Hydrogen Storage for Light-Duty Fuel Cell Vehicles a
(updated May 2017)
Storage Parameter Units 2020 2025 Ultimate
System Gravimetric Capacity: kWh/kg 1.5 1.8 2.2
Usable, specific-energy from H2 (net useful (kg H2/kg system) (0.045) (0.055) (0.065)
b
energy/max system mass)
System Volumetric Capacity: kWh/L 1.0 1.3 1.7
Usable energy density from H2 (net useful (kg H2/L system) (0.030) (0.040) (0.050)
b
energy/max system volume)
Storage System Cost : $/kWh net 10 9 8
($/kg H2) 333 300 266
c
• Fuel cost $/gge at pump 4 4 4
Durability/Operability:
d
• Operating ambient temperature °C -40/60 (sun) -40/60 (sun) -40/60 (sun)
• Min/max delivery temperature °C -40/85 -40/85 -40/85
• Operational cycle life (1/4 tank to full) Cycles 1500 1500 1500
• Min delivery pressure from storage system bar (abs) 5 5 5
• Max delivery pressure from storage system bar (abs) 12 12 12
e
• Onboard Efficiency % 90 90 90
f
• “Well” to Powerplant Efficiency % 60 60 60
Charging / Discharging Rates:
g
• System fill time min 3-5 3-5 3-5
• Minimum full flow rate (e.g., 1.6 g/s target for
(g/s)/kW 0.02 0.02 0.02
80kW rated fuel cell power)
• Average flow rate (g/s)/kW 0.004 0.004 0.004
• Start time to full flow (20°C) s 5 5 5
• Start time to full flow (-20°C) s 15 15 15
• Transient response at operating temperature s 0.75 0.75 0.75
10%–90% and 90%–0% (based on full flow rate)
h
Fuel Quality (H2 from storage) : % H2 Meet or exceed SAE J2719
i
Dormancy:
• Dormancy time target (minimum until first Days 7 10 14
release from initial 95% usable capacity)
• Boil-off loss target (max reduction from initial % 10 10 10
95% usable capacity after 30 days)
Environmental Health & Safety:
j
• Permeation & leakage - • Meet or exceed SAE J2579 for system safety
• Toxicity - • Meet or exceed applicable standards
• Safety - • Conduct and evaluate failure analysis
Useful constants: 0.2778 kWh/MJ; Lower heating value for H2 is 33.3 kWh/kg H2; 1 kg H2 ≈ 1 gal gasoline equivalent (gge) on
energy basis
3Footnotes to Target Table:
a
For a normalized comparison of system performance to the targets, a usable H2 storage capacity of 5.6 kg H2
should be used at the lower heating value of hydrogen (33.3 kWh/kg H2). Targets are for a complete system,
including tank, material, valves, regulators, piping, mounting brackets, insulation, added cooling capacity, and all
other balance-of-plant components. All capacities are defined as usable capacities that could be delivered to the
fuel cell system. All targets must be met at the end of service life.
b
Capacities are defined as the usable quantity of hydrogen deliverable to the fuel cell system divided by the total
mass/volume of the complete storage system, including all stored hydrogen, media, reactants (e.g., water for
hydrolysis-based systems), and system components. Capacities must be met at end of service life. Tank designs
that are conformable and have the ability to be efficiently package onboard vehicles may be beneficial even if
they do not meet the full volumetric capacity targets.
c
Hydrogen threshold fuel cost is calculated to be competitive with a gasoline hybrid vehicle, and thus is
independent of pathway. It is defined as the untaxed cost of hydrogen produced, delivered, and dispensed to
the vehicle [http://hydrogen.energy.gov/pdfs/11007_h2_threshold_costs.pdf]. For material-based storage
technologies, the impact of the technology on the hydrogen threshold fuel cost (e.g., off-board cooling, off-
board regeneration of chemical hydrogen storage materials, etc.) must be taken into account.
d
Stated ambient temperature plus full solar load (i.e., full exposure to direct sunlight). No allowable performance
degradation from -20 °C to 40 °C. Allowable degradation outside these limits is to be determined.
e
Onboard efficiency is the energy efficiency for delivering hydrogen from the storage system to the fuel cell
powerplant, i.e., accounting for any energy required operating pumps, blowers, compressors, heating, etc.
required for hydrogen release.
f
Well-to-powerplant efficiency includes onboard efficiency plus off-board efficiency, i.e., accounting for the
energy efficiency of hydrogen production, delivery, liquefaction, compression, dispensing, regeneration of
chemical hydrogen storage materials, etc. as appropriate. H2A and HDSAM analyses should be used for
projecting off-board efficiencies. Efficiencies less than the target may be acceptable if evidence can be given that
well-to-powerplant carbon intensity (including delivery and dispensing of H2) can achieve less than 5 kg CO2e/kg
H2. Argonne National Laboratory’s GREET model (https://greet.es.anl.gov/) should be used to calculate the
carbon intensity of well-to-powerplant energy use.
g
When applicable, the fill time should comply with SAE J2601, the Fueling Protocol for Light-Duty Gaseous
Hydrogen Surface Vehicles.
h
Hydrogen storage systems must be able to deliver hydrogen that meets acceptable hydrogen quality standards
for fuel cell vehicles (see SAE J2719 and ISO/PDTS 14687-2). Note that some storage technologies may produce
contaminants for which effects are unknown and not addressed by the published standards; these will be
addressed by system engineering design on a case-by-case basis as more information becomes available.
i
Dormancy targets assume vehicle is parked in 35°C ambient temperature and dormancy performance is
maintained over the 15 year life of the vehicle.
j
Total hydrogen lost into the environment as H2; relates to hydrogen accumulation in enclosed spaces. Storage
systems must comply with applicable standards for vehicular fuel systems including but not limited to SAE J2579
and the United Nations Global Technical Regulation No. 13 (hydrogen and fuel cell vehicles). This includes any
coating or enclosure that incorporates the envelope of the storage system.
43.0 Summary of New / Revised Targets:
Since the last major target revision in 2009, significant progress has been made on the development and
implementation of FCEVs thus necessitating the need to add and revise several targets. Tables 2 and 3
below provide a summary of the various targets that have been revised and added since the last major
target update in 2009.
Note that in 2009, the targets were developed for 2015 and “Ultimate Full Fleet” targets were added to
capture virtually all light-duty vehicle platforms (“significant market penetration”). The original 2015
targets were developed based on an assumption that the DOE funding for hydrogen storage research
and development would remain fairly constant. Since 2009, funding for the DOE Hydrogen Storage
Program has been at reduced levels as shown by the DOE Hydrogen and Fuel Cells Program Record
#16010 (https://www.hydrogen.energy.gov/pdfs/16010_historical_fuel_cell_h2_budgets.pdf), thus
impacting the ability to meet the 2015 targets and shifting these targets to 2025, which were added to
Table 1.
Table 2. Revised Technical System Targets: Onboard Hydrogen Storage for Light-Duty Fuel Cell Vehicles
2020 2020 2025 Ultimate Ultimate
Storage Parameter Units Notes
(previous) (new) (new) (previous) (new)
System Gravimetric Capacity: kWh/kg 1.8 1.5 1.8 2.5 2.2 Previous 2020
Usable, specific-energy from H2 (net (kg H2/kg system) (0.055) (0.045) (0.055) (0.075) (0.065) target shifted to
useful energy/max system mass)
b 2025 target
System Volumetric Capacity: kWh/L 1.3 1.0 1.3 2.3 1.7 Previous 2020
Usable energy density from H2 (net (kg H2/L system) (0.040) (0.030) (0.040) (0.070) (0.050) target shifted to
useful energy/max system volume)
b 2025 target
Storage System Cost : $/kWh net TBD 10 9 TBD 8 Cost target
provided in
($/kg H2) TBD 333 300 TBD 266 2009 was TBD
Both 2020 and
Ultimate targets
c
• Fuel cost $/gge at pump 2-4 4 4 2-4 4 were revised to
be consistent
with HPTT goal
Durability/Operability: 2020
unchanged; only
• Min delivery pressure from storage bar (abs) 5 3 5
Ultimate target
system was revised
Charging / Discharging Rates: Both 2020 and
Ultimate targets
• System fill time min 3.3 3-5 3-5 2.5 3-5
were revised
5Table 3. New Technical System Targets: Onboard Hydrogen Storage for Light-Duty Fuel Cell Vehicles
2020 2025 Ultimate
Storage Parameter Units Notes
(new) (new) (new)
Charging / Discharging Rates: New Target to Differentiate
between Average flow rate &
• Average flow rate (g/s)/kW 0.004 0.004 0.004 Minimum full flow rate
Dormancy:
• Dormancy time target (minimum until first Days 7 10 14
New Targets to Address Dormancy
release from initial 95% usable capacity)
% 10 10 10 (challenge for system operating at
• Boil-off loss target (max reduction from less than ambient temperate)
initial 95% usable capacity after 30 days)
In addition to the changes noted above, the target for release of hydrogen was removed for clarity as this
system metric is now more specifically covered by the targets for dormancy as well as permeation and
leakage. Also, targets relating to internal combustion engine were removed. At one time, hydrogen
powered internal combustion engines (ICE) were seen as a logical evolution step to fuel cell vehicles
powered by hydrogen. Focus has shifted entirely to FCEVs and thus there is no longer a need to include
specific targets as related to ICEs. As a result all hydrogen storage system targets related to ICEs have
been removed.
Further explanation of the new and modified targets are included in Section 5.0 which provides a detailed
breakdown of the individual targets.
64.0 Assumptions:
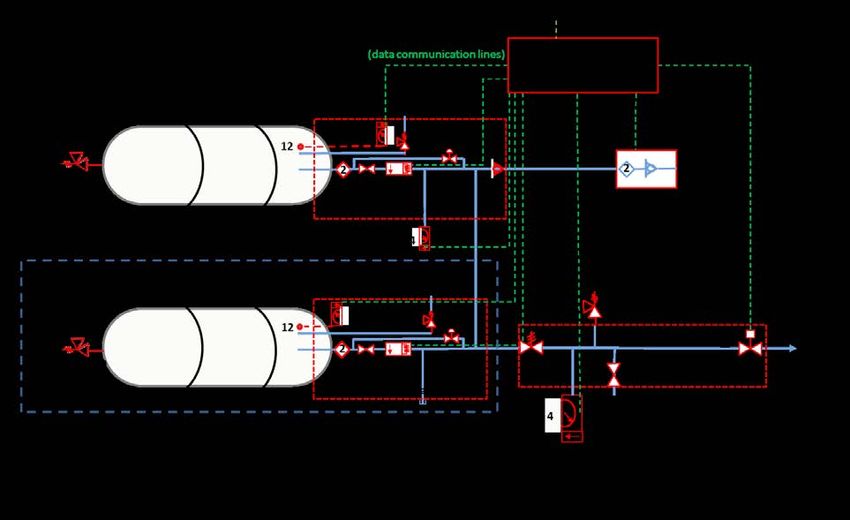
1. All targets must be met simultaneously on a total system level. The performance targets apply
to a complete storage system, including the tank, storage media, safety system, valves,
regulators, piping, mounting brackets, insulation, added cooling capacity, and any other
necessary balance-of-plant components (see Figure 1 below for example system diagrams
showing single-tank and dual-tank configurations with necessary balance-of-plant components).
2. Targets are based on what is required to meet the application requirements and customer
expectations; not on what the state-of-the-art technology can achieve.
3. The targets should enable greater than 300-mile range across the majority of the current light-
duty vehicle fleet (i.e. many makes and models).
4. The targets are based on providing a sufficient amount of net available hydrogen onboard the
vehicle to satisfy driving range.
5. These targets must be maintained until the end of the vehicle’s service life.
6. Depending on progress in other areas related to FCEV development, these targets may have to
be altered and will be periodically revisited approximately every 5 years.
7. A wide variety of vehicle types from small subcompact cars to light-duty trucks were considered
in the target calculations; the fuel storage requirement varied between approximately 4 to 10 kg
of hydrogen, based on the corresponding vehicle type (class) and expected driving range.
8. The targets include the "Ultimate Full Fleet” targets. The “Ultimate Full Fleet” targets are meant
to capture virtually all light-duty vehicle platforms (“significant market penetration”). The
“Ultimate Full Fleet” target is intended to facilitate the introduction of hydrogen-fueled
propulsion systems across the majority of vehicle classes and models.
9. Some volumetric allowance can be adopted in the targets for conformable (geometrically
speaking) storage systems. The volumetric and gravimetric targets (revised approach in 2009)
utilized the packaging and design space allotted for compressed hydrogen storage in the actual
fuel cell demonstration fleet vehicles. That is, the majority of vehicles in the fleet have
demonstrated the OEMs’ abilities to design and modify vehicle architecture around the
hydrogen systems. Two examples of such modifications include the redesign of floor pan to
accommodate larger hydrogen storage systems and the alteration in vehicle architecture to
accommodate fuel cell/electronic systems components. Varying degrees of increased mass and
volume acceptance (due to the fuel cell and H2 storage systems) have been demonstrated in
these vehicles. Experience has shown that it is generally easier to accommodate extra weight
compared to extra volume (i.e., accommodating additional packaging volume is more
challenging). Importantly, all vehicle modifications must be performed without making
compromises to customer expectations for cargo/passenger space, performance, or safety.
7Figure 1a: Example 700 bar Hydrogen Storage System Diagram Showing a Single-Tank Configuration7
Figure 1b: Example 700 bar Hydrogen Storage System Diagram Showing a Dual-Tank Configuration
7
G. Ordaz, C. Houchins, and T. Hua, “Onboard Type IV Compressed Hydrogen Storage System – Cost and Performance Status 2015,” DOE
Hydrogen and Fuel Cells Program Record #15013, Nov. 25, 2015.
https://www.hydrogen.energy.gov/pdfs/15013_onboard_storage_performance_cost.pdf
85.0 Detailed Breakdown of the Individual Targets:
The following section provides the detailed background and explanation for each target in Table 1. For a
normalized comparison to these targets, a usable hydrogen storage capacity of 5.6 kg hydrogen should
be used at lower heating value of hydrogen (33.3 kWh/kg hydrogen). In addition, the targets are for a
complete system, including tank, material, valves, regulators, piping, mounting brackets, insulation,
added cooling capacity, and all other balance-of-plant components. All capacities are defined as usable
capacities that could be delivered to the fuel cell system and all targets must be met at the end of
service life. While certain targets are expressed in terms of kWh/kg, kWh/L and $/kWh, it should be
acknowledged that the hydrogen system is not exactly scalable by the useable capacity since the
balance-of-plant components will be fixed regardless of the capacity. Based on this understanding that
hydrogen systems have a scalable and fixed element, a target comparison based on the absolute weight,
volume, and cost can also be performed to allow for the practical application of onboard efficiency
advancements and acceptable limits for actual storage systems.
Storage Parameter Units 2020 2025 Ultimate
System Gravimetric Capacity: kWh/kg 1.5 1.8 2.2
Usable, specific-energy from H2 (net useful (kg H2/kg (0.045) (0.055) (0.065)
energy/max system mass) system)
System Gravimetric Capacity:
This is a measure of the specific energy from the system standpoint of net useful energy per total
onboard storage system mass, not just the storage medium. The term specific energy is used
interchangeably with the term gravimetric capacity. “Net useful energy” excludes unusable energy (i.e.
hydrogen left in a tank below minimum fuel cell system pressure, flow, and temperature requirements)
and energy used to extract the hydrogen from the storage medium (e.g. fuel used to heat a hydride or
material to initiate or sustain hydrogen release). The system gravimetric capacity refers to end of life net
available capacity. The storage system is all encompassing meaning it includes everything necessary for
the storage system. This includes, but is not limited to: interfaces with the refueling infrastructure,
safety features, storage vessel, storage media, insulation or shielding, temperature/humidity
management equipment, regulators, electronic controllers, sensors, all onboard conditioning equipment
necessary to store the hydrogen (compressors, pumps, filters, etc.), and the mounting hardware and
delivery piping. The target is in units of net useful energy in kWh per maximum system mass in kg.
“Maximum system mass” implies that all of the equipment enumerated above plus the maximum
charge of hydrogen are included in the calculation. Reactive systems may increase in mass as they
discharge hydrogen; in such systems the post hydrogen discharged mass must be used.
Table 4: Second Generation
9Range of Values
FCEV Data Units 2017 Commerical
Lower "Gen 2"* Upper "Gen 2"*
Example8
Fuel Economy mi/kg H2 43 58 66
Range mi 196 254 312
H2 Capacity kg H2 4.6 4.4 4.7
Gravimetric Capacity wt% H2 2.5 4.4 4.4
Volumetric Capacity kg H2/L 0.018 0.025 0.025
Storage System Mass kg 182 100 108
Storage System Volume L 253 175 185
*Old 2009 data based on DOE's National Hydrogen Learning Demonstration
Vehicle
Data from the DOE “National Hydrogen Learning Demonstration” Project
To determine the capacity targets developed back in 2009, data from operational fuel cell fleet vehicles
associated with the DOE “National Hydrogen Learning Demonstration” were used, including small,
compact, mid-size and crossover light-duty vehicles. The vehicles had a varied degree of hybridization.
As shown in Table 4, these vehicles were unable to achieve the expected driving range, which in North
American is 300 miles (at a minimum) up to nearly 500 miles for the light-duty vehicle market. Based on
the allocated weight for hydrogen storage systems, the targets were determined by calculating the
increased capacity required to allow these fuel cell vehicles to meet the desired driving range within the
current vehicle using the fixed allocation for system weight. From these initial fleet examples, recent
fuel cell vehicles have demonstrated improvements in fuel economy (e.g. Toyota Mirai 8) with the
capability of achieving over a 300 mile range. Therefore, the upper range vehicle example in Table 4 can
be replaced with these recent vehicle data (e.g. 66 miles/gge) along with the respective hydrogen
storage allocations (e.g. 4.7 kg useable capacity, 108 kg). The target values were modified based on
these recent fuel cell vehicles. The 2020 gravimetric targets aligned directly with these current storage
system examples capable of achieving the minimum of 300 miles. The 2025 target was based on
achieving a 400 mile driving range using the current fuel cell electric vehicle example in the Table 4 for
the upper values, which results in a hydrogen capacity of 6.1 kg to 9.3 kg. Using this capacity and the
weight allocation (108 kg to 182 kg), the resulting average gravimetric capacity target is 5.5 wt%. The
same approach was used for the ultimate target based on a 500 mile driving range resulting in a target
value of 6.5 wt%.
Storage Parameter Units 2020 2025 Ultimate
System Volumetric Capacity: kWh/L 1.0 1.3 1.7
Usable energy density from H2 (net useful (kg H2/L system) (0.030) (0.040) (0.050)
energy/max system volume)
System Volumetric Capacity:
This is a measure of energy density from a system standpoint of net useful energy per onboard storage
system volume, rather than from a storage media standpoint. The term energy density is used
interchangeably with the term volumetric capacity. As noted above, the onboard hydrogen storage
system includes every component required to safely accept hydrogen from the delivery infrastructure,
store it onboard, and release conditioned hydrogen to the fuel cell system. Also, as before, any unusable
8
Estimates based on data from http://www.fueleconomy.gov/feg/fcv_sbs.shtml and other available information
10fuel must be taken into account and storage system volumetric capacity refers to end of life net
available capacity. Today’s gasoline tanks are considered conformable. For conformable tank concepts,
the required volumetric energy density may be reduced because space not allocated for fuel storage
may be used without a penalty. The system volumetric capacity refers to end of life net available
capacity. The volume should be considered as the external water displacement volume of the entire
system. The targets are in units of net usable energy in kWh per system volume in liters.
As discussed for gravimetric capacity, data from operational fuel cell fleet vehicles associated with the
DOE “National Hydrogen Learning Demonstration” was used to determine the volumetric capacity
targets developed back in 2009. In the same manner, the targets were determined by calculating the
increased capacity required to allow these fuel cell vehicles to meet the desired driving range within the
current vehicle using the fixed allocation for system volume. As recognized in the gravimetric target
explanation, the fuel economy of recent fuel cell vehicles (e.g. Toyota Mirai) have improved since the
demonstration vehicles noted in Table 4 with the capability of achieving just over 300 miles driving. This
improvement allows for the upper range vehicle in Table 4 to be replaced with these recent vehicle data
(e.g. 66 miles/gge) along with the respective hydrogen storage allocations (e.g. 4.7 kg useable capacity).
The target values were modified based on these recent fuel cell vehicles. The 2020 gravimetric targets
aligned directly with these current storage system examples capable of achieving the minimum of 300
miles with a 15% correction factor. The correction factor adjustment is motivated by two key points.
First, as the volumes quoted in Table 4 refer to exact or water volumes, they represent the minimum
volume required by the storage vessel. The practical enclosure volume available onboard the vehicle is
typically less. In fact, the examples in the fleet fuel cell vehicles had notable intrusion into the customer
or cargo space. The correction factor to estimate the packaging inefficiency may vary significantly based
on the type of vehicle platform and design requirements of each OEM. Second, vehicles in the DOE
demonstration dataset along with recent vehicles are SUV-type or large sedan vehicles. Packaging of
hydrogen storage systems in these larger vehicles will generally be easier than in smaller ones. Taking
these two points into account, a target value slightly higher than the represented volumes was adopted
based on these correction factors. Similar to the gravimetric target explanation, the 2025 target was
based on achieving a 400 mile driving range requiring between 6.1 kg to 9.3 kg useable hydrogen based
on the fuel cell electric vehicle examples in the Table 4 with the replacement of the recent fuel vehicle
attributes for the upper values. Using this capacity and the volume allocation (185 L to 253 L) along with
the correction factor, the resulting average volumetric target is 0.040 kg/L. The same approach was used
for the ultimate target based on a 500 mile driving range resulting in a target value of 0.050 kg/L.
Storage Parameter Units 2020 2025 Ultimate
Storage System Cost : $/kWh net 10 9 8
($/kg H2) 333 300 266
• Fuel cost $/gge at pump 4 4 4
Storage System Cost:
This is the cost of the entire hydrogen storage system including the initial charge hydrogen. As noted
above, the onboard hydrogen storage system includes every component required to safely accept
hydrogen from the delivery infrastructure, store it onboard, and release conditioned hydrogen to the
fuel cell system.
U.S. DRIVE performed extensive modeling to evaluate the targets for advanced vehicle technologies,
11including FCEVs. The purpose of the analysis was to provide guidance for the U.S. DRIVE targets, such
that vehicles using the advanced technologies being developed through the U.S. DRIVE partnership
would be comparable on a cost (initial + operational) and performance basis to incumbent technology
by 2020. The effort considered three levels of technology advancement, 10%, 50% and 90% confidence
levels with 10% being the most aggressive within the 2020 timeframe based on a high volume
assumption of 500,000 units produced per year. The levelized cost of driving for the analysis was
developed based on midsize vehicle using 2011 Annual Energy Outlook (AEO11) High Oil Scenario for
gasoline in 2020 ($5.05/gallon of gasoline), 14,000 miles per year, 3-year payback period, and 7%
discount rate. Figure 2 provides the levelized cost results at the 50% confidence level for the FCEV
compared to an advanced spark ignition (Adv SI) and hybrid electric (SI HEV) vehicle. From this analysis,
the fuel cell vehicle at the 2020 baseline would require cost reductions to be competitive on a levelized
cost of driving.
The U.S. DRIVE analysis for the 2020 FC HEV baseline assumed a hydrogen fuel cost of $3.50 per gallon
gasoline equivalent (1 kg H2 is approximately 1gge); fuel cell system costs of $46/kW; and onboard
hydrogen storage system costs of $15/kWh ($500/kg H2). After adjusting the FC HEV assumptions to the
Department of Energy’s 2020 fuel cell system target of $40/kW, a hydrogen storage system cost target
of $10/kWh would enable an FCEV to approach the levelized cost of the SI HEV at the 50% confidence
level and Adv SI at the 90% confidence level. For a competitive levelized cost to a Adv SI, the fuel cell
system would need to achieve their ultimate target of $30/kW and the onboard hydrogen storage
system would require a cost target of $8/kWh, which is also shown in Figure 2 as a comparison to the
baseline gasoline vehicle levelized cost.
Therefore onboard hydrogen storage cost targets of $10/kWh as an intermediate target in 2020,
$9/kWh in 2025, and $8/kWh as a long-term ultimate target are appropriate.
U.S. DRIVE levelized cost of driving analysis for 2020 midsize vehicle
0.80
Levelized Cost of Driving (NPV 2010 $/mi)
0.70 Fuel Cost (NPV)
0.60 Drive, Wheels, Tires, etc.
0.50 Transmission
0.40 Motor
0.30 Energy Storage
0.20
Fuel Tank
0.10
Fuel Cell
0.00
Emission Control
Adv SI SI HEV FC HEV FC HEV FC HEV
BASELINE 2020 ULTIMATE ICE
TARGETS TARGETS Glider
Figure 2: Levelized Cost of Driving Analysis for a FC HEV with baseline, 2020 targets, and Ultimate
Target Assumptions in Comparison to Adv SI and SI HEV to establish the Onboard Hydrogen Storage
System Cost Targets
• Fuel cost: This target includes costs for producing, compressing, liquefying, transporting and
12distributing, dispensing, chemical recovery, etc., as applicable for the fuel. 9 For material-based
storage, if the fuel / storage system utilized, requires additional processing such as off-board
cooling or off-board regenerated of spent fuel (e.g., chemical hydrogen storage material), then
those extra costs (e.g., regeneration) must be included within the fuel cost. The storage system
cost also includes the first charge of fuel as mentioned above. The unit of $/gallon gasoline
equivalent (gge) is approximately equivalent to $/kg of hydrogen.
Storage Parameter Units 2020 2025 Ultimate
Durability/Operability:
• Operating ambient temperature °C -40/60 (sun) -40/60 (sun) -40/60 (sun)
• Min/max delivery temperature °C -40/85 -40/85 -40/85
• Operational cycle life (1/4 tank to full) Cycles 1500 1500 1500
• Min delivery pressure from storage system bar (abs) 5 5 5
• Max delivery pressure from storage system bar (abs) 12 12 12
• Onboard Efficiency % 90 90 90
• “Well” to Powerplant Efficiency % 60 60 60
Durability / Operability:
• Operating ambient temperature: The storage system must dependably store and deliver
hydrogen to the fuel cell system at all expected ambient conditions. The temperature units are
degrees Celsius (°C). The notation (sun) indicates that the upper temperature is a hot soak
condition in full direct sun, including radiant heat from the pavement. Note that storage
operating temperatures in excess of 60°C can be achieved with solar loading. Thus the hydrogen
storage system design should include a shield from this radiant heat or be designed to
accommodate temperatures greater than 60°C. Also note that there is no allowable
performance degradation between –20°C and 40°C. Allowable degradation outside these limits
is to be determined.
• Min/max delivery temperature: This target refers to the inlet temperature of hydrogen to the
fuel cell system. Fuel cells currently operate at approximately 80°C. Any hydrogen entering
above the fuel cell operating temperature would add to the already significant water
management and heat rejection requirements of the fuel cell system. Thus, an upper limit on
temperature is desirable. The value of 85°C is selected based on today’s proton exchange
membrane (PEM) fuel cell technology. As the fleet size is increased, it will also become
increasingly important that the storage system comply more closely with the fuel cell preferred
operating range. The lower limits reflect both wider acceptance of fuel cells in varying climates
and fuel cell improvements for lower temperature operation. The temperature units are
degrees Celsius (°C).
• Operational cycle life: This target refers to the minimum cycle life for the performance of the
storage material/media. The number of operational cycles is calculated as the design lifetime
mileage of the vehicle divided by the effective range of the vehicle. Customers expect the fuel
system to last the life of the vehicle and typically 150,000 miles represents the minimum
lifetime. Assuming a 300-mile range, this amounts to 500 full fill cycles as a minimum. However,
many customers fill at partial capacity rather than at empty and extend the vehicle mileage
beyond the minimum lifetime, requiring more fill cycles. The Sierra Research Report No.
9
https://energy.gov/sites/prod/files/2015/08/f25/fcto_myrdd_delivery.pdf
13SR2004-09-04 for the California Air Resource Board (2004) on vehicle lifetime mileage indicated
all scrapped vehicles had mileage below 350,000 miles (6-sigma value was 366,000 miles). Using
this maximum lifetime mileage and the partial cycle definition from a quarter full to full tank,
the effective range is reduced to 225 miles resulting in the 1,500 cycle life target. This target is
not equivalent to the durability test cycles, which require significantly more cycles to ensure
safe performance. The safety critical components (i.e. cylinder, relief valves, etc.) involved in
managing pressure and temperature conditions need additional durability cycle life as specified
in the applicable codes and standards (i.e. SAE J2579 and the United Nations Global Technical
Regulation ECE/TRANS/180/Add.13).
• Minimum delivery pressure from storage system: This target acknowledges that the onboard
hydrogen storage system is responsible for delivering hydrogen in a condition that the fuel cell
system can use. Since there can be no flow without a pressure differential, a minimum supply
pressure is required just to move the hydrogen from the bulk storage to the fuel cell system. If
the hydrogen were merely available at the entrance to a fuel cell system (i.e., less than 5 bar),
then any pumps necessary to push or draw that fuel through the stack would be considered part
of the fuel storage system. The pressure units are in gauge bar (bar).
The Ultimate Target for the minimum delivery pressure from the storage system was updated
from 3 bar to 5 bar. It should be recognized the delivery pressure is at the interface between the
hydrogen storage system and the fuel cell system rather than directly to the fuel cell stack. The
delivery pressure to the fuel cell system requires higher pressure than the operating conditions of
the stack for pressure drop and passive recirculation within the fuel cell system balance of plant.
In some fuel cell system designs, the desire is to increase this minimum delivery pressure even
greater than 5 bar in order to further optimize the performance. Therefore, the Ultimate Target
was updated to 5 bar to acknowledge the current direction for fuel cell system requirements and
provide a consistent minimum delivery pressure throughout the target table.
• Maximum delivery pressure from storage system: This target is for the pressure delivered from
the onboard hydrogen storage system to the fuel cell system. This target ensures that the
onboard hydrogen storage system regulates the pressure before fuel is supplied to the fuel cell
system.
• Onboard Efficiency: Hydrogen storage systems must be energy efficient. To ensure this, a target
has been set for the efficiency of the storage system onboard the light-duty vehicle. It is defined
as the ratio of the total amount of energy delivered to the fuel cell system (lower heating value)
compared to the total energy contained in the tank (based on the tank rating). For onboard
reversible storage systems, the target is greater than 90% energy efficiency for the energy
delivered to the fuel cell system from the onboard storage system. For example, if a storage
tank is rated as holding 5.6 kg usable hydrogen, the total amount of energy in the rated tank
would be 5.6 kg multiplied by (33.3 kWh/kg) or approximately 186.5 kWh. For the target to be
achieved, at least 90% of 186.5 kWh or 168 kWh needs to be delivered to the fuel cell system.
• “Well” to Powerplant Efficiency: Well-to-powerplant efficiency includes onboard efficiency plus
off-board efficiency, i.e., accounting for the energy efficiency of hydrogen production, delivery,
liquefaction, compression, dispensing, regeneration of chemical hydrogen storage materials,
etc. as appropriate. The energy content of the hydrogen delivered to the automotive
powerplant should be greater than 60% of the total energy input to the process. H2A and
14HDSAM analyses should be used for projecting off-board efficiencies.
Efficiencies less than the target may be acceptable if evidence can be given that the carbon
intensity (including delivery and dispensing of hydrogen) can achieve less than 5 kg CO2e/kg H2
(i.e., conceivable that a system is inefficient, but still allows for reduced greenhouse gas
emissions). Argonne National Laboratory’s GREET model (https://greet.es.anl.gov/) should be
used to calculate the carbon intensity of energy use for hydrogen delivery and dispensing (from
20 bar, and ambient temperature of produced hydrogen). Default 2025 energy shares and
efficiency values in GREET, when applicable, should be used for calculating carbon intensity.
To liquefy and dispense hydrogen, about 11-15 kWh of electricity are needed for liquefaction
and pumping (depending on the scale and technology of liquefaction). Using the current (2015)
carbon intensity of the U.S. electricity grid mix of about 550 g CO2e/kWh, the carbon intensity of
delivering and dispensing liquid hydrogen is 6-8 kg CO2/kg H2. This is true whether liquid
pumping was used for 350 bar cryo-compressed dispensing, or in conjunction with a heat
exchanger for 700 bar gaseous dispensing. The corresponding electricity consumption for tube-
trailer delivery and 700 bar gaseous dispensing is in the range of 3-5 kWh/ kg H2, which results in
2-3 kg CO2/kg H2 with the current U.S. electricity grid mix. Depending on the truck
transportation and distribution (T&D) distance, and the truck payload of hydrogen, the GHG
emissions associated with trucking hydrogen results in additional 1 kg CO2/kg H2 for each 100
miles T&D of 500 kg payload of hydrogen.
Storage Parameter Units 2020 2025 Ultimate
Charging / Discharging Rates:
• System fill time Min 3-5 3-5 3-5
• Minimum full flow rate (e.g., 1.6 g/s target for
(g/s)/kW 0.02 0.02 0.02
80kW rated fuel cell power)
• Average flow rate (g/s)/kW 0.004 0.004 0.004
• Start time to full flow (20°C) S 5 5 5
• Start time to full flow (-20°C) S 15 15 15
• Transient response at operating temperature S 0.75 0.75 0.75
10%–90% and 90%–0% (based on full flow rate)
Charging / Discharging Rates:
• System fill time: Consumers expect to refuel a vehicle quickly and conveniently, especially on
extended trips. The filling target is designed to parallel current customer experience. Currently,
gasoline vehicles are filled in approximately 3 to 5 minutes, with small vehicles taking less time
than large ones. Based on the expected efficiency of FCEVs, approximately 4 to 10 kg of
hydrogen will be needed for light-duty vehicles. This target will achieve near parity with current
gasoline filling times. For a comprehensive comparison of fill time, the storage system should
comply with the performance in SAE J2601, the Fueling Protocol for Light-Duty Gaseous
Hydrogen Surface Vehicles (http://standards.sae.org/j2601_201003/). The units are minutes.
Note: the fill time involves not only delivery of the hydrogen to the storage system, but also any
potential heat/mass transfer and/or kinetic factors associated with a particular storage system
design. Thus all factors must be considered especially when scaling small prototype systems to
determine fill time.
• Minimum full flow rate: This target is a measure of the maximum flow rate of hydrogen
15required by the fuel cell system to achieve the desired vehicle performance. It is based on an
average midsize light duty fuel cell vehicle, which typically has a power plant of about 80 kW and
maximum fuel flow from the EPA US06 aggressive drive cycle. This is not a continuous flow
target since the vehicle would not accelerate through an entire tank of fuel although it might be
called upon to tow a large, heavy trailer up an 18-mile grade, such as is found on Interstate 5
near Baker, California. However, because fuel cell efficiency is poorest at full load, while ICEs are
at or near their highest efficiency at full load, FCEVs may require higher full flow rates than this
minimum to be competitive with ICEs. Finally, this target is intended to indicate the potential for
scalability for the hydrogen storage technology and thus the target is in units of mass/time
normalized to fuel cell system rated power.
• Average flow rate: While the minimum full flow rate noted above defines the requirements for
the storage system to supply hydrogen to the fuel cell system at peak load, it is also understood
that an FCEV will not be operated at peak load through an entire tank of fuel. As described for
the minimum full flow, an average midsize light duty fuel cell vehicle with a typically power plant
of about 80 kW rated power was assumed for this target. This target is based on the average
flow rate of hydrogen required by the fuel cell system for the EPA US06 aggressive drive cycle
although it is still not expected that the flow demand will be continuous at this average flow rate
value. For potential for scalability for the hydrogen storage technology, the target is in units of
mass/time normalized to fuel cell system rated power.
• Start time to full-flow (20°C): The vehicle may be able to start based on hydrogen in the lines,
but to maintain adequate function without the need for a second energy storage medium (e.g.
batteries), full flow must be available almost instantly. Customers are currently accustomed to
sub-second start times and full power available on demand, any time after the key is released.
The target cold start-up time to achieve 50% rated power for the complete fuel cell system at
20°C ambient temperature is 5 seconds. The storage system targets for start time to full-flow
are set to meet the overall fuel cell system needs. In addition, the storage system must provide
some flow to the fuel cell system within 25% of the time target for full-flow. The units for this
target are seconds after start.
Note: this doesn’t mean that the entire storage system must start in 5 seconds; only that it is
capable of delivering fuel at maximum flow if requested. A moderate pressure buffer could
serve to lengthen the true start up time. In that case, the mass and volume of the buffer would
then need to be included within the system mass and volume.
• Start time to full-flow (-20°C): See Start time at 20°C for background explanation. The longer
times reflect current customer expectation that in cold weather starting is more difficult. It is
important to note that batteries are at their worst power capabilities at very low temperature. If
a battery assist were contemplated, the battery system would likely have to be sized based on
this starting condition, and thus would be rather large. This is why it has been desirable to avoid
batteries for cold start if possible, unless sizing issues can be resolved. The target cold start-up
time to achieve 50% rated power for the complete fuel cell system at -20°C is 15 seconds.
Consistent with the above target, some flow will be required to the fuel cell system within 25%
of the full-flow target time. Given the possibility that some hydrogen may be used to assist with
cold start of the fuel cell system, the storage system is set to achieve full-flow within 50% of the
start time for the fuel cell system. Units are in seconds.
• Transient response 10%-90% and 90%-0% based on full flow rate: Transient response is one of
16the greatest challenges a vehicle powertrain faces. The storage system must provide fuel to
meet the needs of the fuel cell system to deliver adequate power and a suitable driving
experience. Therefore, the transient response must meet the fuel cell system requirement of
0.75 second (2010 and 2015 targets). The transient response is not necessarily symmetric. The
10 to 90% transient target is to meet the demand of the fuel cell during acceleration. The 90 to
0% transient reflects that the vehicle may need to stop using hydrogen almost instantly (e.g.
safety shut-off) and the fuel supply must stop quickly enough to avoid over-pressuring any part
of the system. This parameter impacts performance, fuel cell durability, and vehicle control. The
units are seconds to change between 10% flow and 90% flow, or 90% flow and no flow.
Storage Parameter Units 2020 2025 Ultimate
Fuel Quality (H2 from storage): % H2 Meet or exceed SAE J2719
• Fuel Quality: Hydrogen must be relatively pure going to the fuel cell system or else vehicle
efficiency and performance will be degraded. The fuel quality from the hydrogen storage system
must maintain or exceed the levels specified in SAE J2719
(http://standards.sae.org/j2719_201511/). The levels of constituents in SAE J2719 were
determined by experimental testing representative fuel cells with impurities. As indicated in SAE
J2719, even inert impurities can degrade performance by progressively diluting the hydrogen in
the fuel cell system, resulting in a higher necessitating of venting from the fuel cell anode. Other
impurities react directly with the fuel cell catalyst resulting in immediate or long-term damage.
The SAE J2719 fuel quality standard is the same requirement for the hydrogen delivered from
the fueling station into the storage system. In other words, the hydrogen output from the
storage system should not add significant contaminants beyond the fuel cell quality targets in
SAE J2719 and ISO specification ISO/PDTS 14687-2. It is also assumed that impurities from the
hydrogen source do not degrade storage system performance.
Storage Parameter Units 2020 2025 Ultimate
Dormancy:
• Dormancy time target (minimum until first Days 7 10 14
release from initial 95% usable capacity)
• Boil-off loss target (max reduction from % 10 10 10
initial 95% usable capacity after 30 days)
Dormancy:
• Dormancy time target: This target protects against loss of driving range after extended periods
of vehicle at rest (e.g., parking during a vacation). The dormancy period is especially relevant for
hydrogen systems that operate at low temperatures. As the temperature in the tank increases,
the pressure increases to the point that it needs to be released due to exceeding the maximum
pressure rating of the tank. The period of time prior to this release (or boil-off point) is defined
as the dormancy time. Fuel cell vehicles purchased by typical consumers expect to have the
same amount of fuel in their tank after extended parking, similar to gasoline vehicles today. For
2020, the dormancy time target of 7 days from initial 95% usable capacity was selected based on
a typical period of time that a vehicle would be parked at the airport for a vacation. The 95%
usable capacity qualifier was based on the consideration that the vehicle is unlikely to be parked
immediately after a fueling event. The dormancy time target was extended for 14 days at the
same peak capacity to accommodate a two week vacation that a vehicle would be parked. The
17evaluation of the dormancy time should be conducted at the high ambient soak temperature
which is assumed to be 35ºC for this target assessment. It should be noted that this is not the
maximum ambient temperature although diurnal cycles reduce the average exposure
temperature over a period of days. For most low temperature storage systems, the peak
capacity condition will be the worst case for dormancy although lower states of charges should
also be considered. The units for this target are in days.
• Boil-off loss target: This target is based on the desire to have minimal perceptible loss of driving
range after the dormancy time is exceeded. As stated above, hydrogen systems with low storage
temperatures experience heat loss that increases pressure and eventually requires hydrogen
release or boil-off to avoid exceeding the maximum rated tank pressure. If the hydrogen
released is not vented to the atmosphere, but used for other purposes (e.g., converted via a
catalytic reactor or other uses) instead, then this additional balance of plant must be included as
part of the storage system. The target is indicated as a 10% maximum capacity loss from the
initial state of the tank over a 30 day period of time. It is assumed that this capacity loss would
not be notable to the average consumer and the 30 days assumes a maximum time a vehicle
would be at rest in normal operation. This target protects all storage system capacities equally
and at all state of charge conditions. As specified for dormancy, the initial capacity condition is
95% of the rated usable capacity and the ambient soak temperature should be 35º C for this
target assessment. For most low temperature storage systems, the peak capacity condition will
be the worst case for boil-off loss although lower states of charges should be considered.
Storage Parameter Units 2020 2025 Ultimate
Environmental Health & Safety:
• Permeation & leakage - • Meet or exceed SAE J2579 for system safety
• Toxicity - • Meet or exceed applicable standards
• Safety - • Conduct and evaluate failure analysis
Environmental, Health & Safety:
• Permeation & leakage: These targets are of great importance because they deal with protecting
the health and well-being of individuals in contact with the storage system. The permeation and
leak target are defined in SAE J2579 for the entire storage system, rather than per component or
storage material. A system integrator or OEM could cascade the system leakage targets to
various elements with the system as necessary. Permeation and leakage are differentiated from
hydrogen release and boil-off loss in that hydrogen leakage leaves the storage system in an
unintended manner while boil-off should be controlled and transformed into another species
(e.g. water, via catalytic oxidation in a vent line). Permeation and leakage thus pertains to the
possibility of generating a combustible hydrogen-air mixture outside the storage tank.
• Toxicity: Toxicity covers the possibility of consumer exposure to the storage material in normal,
or abnormal conditions, plus worker exposure during manufacture and assembly. These types of
toxicity criteria are generally regulated by applicable government standards. Materials with a
known hazardous risk potential shall be avoided. For example, the EPA’s Toxic Substances
Control Act Chemical Substance Inventory (TSCA Inventory) and U.S. Department of Labor
Occupational Safety and Health Administration (OHSHA) can be used as references.
• Safety: Safety covers all the typical safety statutes including certification and operation of
18vehicles, manufacture, transport, dispensing of fuel, and end of life issues. In each of these
categories, compliance with federal standards and potentially state and local standards will be
required. The onboard storage systems must comply with applicable standards for vehicular fuel
systems including but not limited to SAE J2579 and the United Nations Global Technical
Regulation No.13 (Hydrogen and fuel cell vehicles). These standards include the minimum level
of testing to determine the robustness of these hydrogen storage systems including
hydraulic/pneumatic durability, burst, pressure cycle life, bonfire, chemical resistance, drop,
penetration, environmental, and vehicle crash impact testing. The hydrogen storage system
design must account for the requirements in these standards along with the applicable
international standards in the nations that the vehicle will be deployed. For certain countries,
the storage system and high pressure components require certification by a specified regulatory
organization prior to on-road usage. SAE J2578, J2600, J2601, J2719, and J2799
(http://standards.sae.org/) provide the necessary references for vehicle and fueling interface
standards. CSA and ISO also provide standards for safety guidance along with component
certification standards. For storage system technologies (e.g. material-based) not specifically
addressed in these standards, the intent of these safety requirements still must be applied to
the design with appropriate engineering rationale and documentation until the incorporation
into the standards. Beyond regulated standards, hydrogen storage system developers should
utilize automotive failure analysis tools such as Failure Mode and Effects Analysis (per SAE
J1739) to identify and evaluate unique potential safety failure modes associated with their
system. For example, metal hydrides are known to expand with absorption and can add strains
to the storage tank, which should be included in the durability and safety testing as a potential
failure mode in addition to the industry codes and standards.
19You can also read