A distance-to-target weighting method for Europe 2020
←
→
Page content transcription
If your browser does not render page correctly, please read the page content below
Int J Life Cycle Assess
DOI 10.1007/s11367-016-1079-8

    POLICIES AND SUPPORT IN RELATION TO LCA

A distance-to-target weighting method for Europe 2020
Valentina Castellani 1 & Lorenzo Benini 1 & Serenella Sala 1 & Rana Pant 1

Received: 11 August 2015 / Accepted: 24 February 2016
# The Author(s) 2016. This article is published with open access at Springerlink.com

Abstract                                                                   Results and discussion The three reference sets (NRs2010,
Purpose Distance-to-target (DTT) methods are weighting                     TRs2020A, and TRs2020B) show, in some impact categories,
methods aimed at assessing the distance of an existing situa-              a relatively small difference. WFs referred to set A and set B
tion from a desired state (the target). Weighting factors in DTT           result to be quite similar, with the only exception of water
methods could be based on calculation which is performed on                depletion impact category, for which a very relevant change
normalization factors (NFs) developed for life cycle assess-               is foreseen when considering the effect of the non-binding
ment (LCA). At present, some DTT weighting sets have been                  target of limiting the abstraction of water resource to 20 %
developed. However, there is no DTT weighting set assessing                of the available renewable water resources. This is mainly due
the distance of EU domestic impacts from the desired state set             to the higher difficulty in deriving quantitative targets from
by EU binding or non-binding policy targets (e.g., those relat-            non-binding strategies and policies rather than from binding
ed to the “Climate and Energy Package” and the “Roadmap to                 ones.
a Resource Efficient Europe”).                                             Conclusions The resulting weighting sets present strengths
Methods In the present work, a methodology to derive target                and limitations. The translation of policy targets into
references from policy-based targets in 2020 (TRs2020), both               quantitative modifications to the baseline inventories ap-
binding (A) and non-binding (B), is presented. Resulting tar-              peared to be not a straightforward task, due to several
get factors and DTT weighting factors are then compared to                 reasons discussed in the paper (e.g., not all the policy
the current normalisation factors (based on 2010 normaliza-                targets are expressed in quantitative terms or can be trans-
tion references). The resulting weighting factor (WF) sets are             lated into quantitative reductions and modifications of the
presented and discussed in light of their use for decision sup-            elementary flows in the existing baseline inventories).
port in policy and business contexts. We applied the WF sets               Aiming at improving the effectiveness in supporting pol-
to characterization results to an example (the EU energy mix               icies, further development of the methodology may be the
process) aiming at illustrating key differences and effects on             integration with other DTT approaches such those based
the results.                                                               on carrying capacity, developed to integrate Earth’s carry-
                                                                           ing capacity concept and planetary boundaries.
Responsible editor: Jeroen Guinée
Electronic supplementary material The online version of this article       Keywords Distance to target . EU domestic impacts . EU
(doi:10.1007/s11367-016-1079-8) contains supplementary material,           policy targets . Normalization . Product environmental
which is available to authorized users.
                                                                           footprint (PEF) . Weighting
* Serenella Sala
  Serenella.sala@jrc.ec.europa.eu
                                                                           1 Introduction

1
     European Commission, Joint Research Centre, Institute for
                                                                           In the context of life cycle assessment (LCA), according
     Environment and Sustainability, Sustainability Assessment Unit, Via   to ISO 14044 (ISO 2006), normalization and weighting
     Enrico Fermi 2749; T.P. 270, 21027 Ispra, VA, Italy                   are optional steps of life cycle impact assessment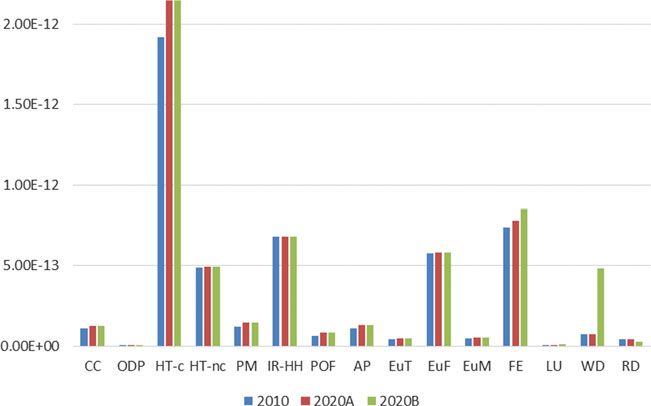
Int J Life Cycle Assess

(LCIA). Those steps allow the practitioner expressing re-                  Some examples of existing DTT weighting methods are as
sults after characterization using a common reference im-               follows:
pact and then aggregating the results into a single score,
giving different weight to impacts. This supports the com-              –   Eco-scarcity v. 2013 (Frischknecht and Büsser
parison between alternatives using reference numerical                      Knöpfel 2013): eco-factors, expressed as eco-points
scores (Bengtsson and Steen 2000; Huppes et al. 2012).                      (EP = UBP) per unit of pollutant emission or resource
In the context of LCA in support to policy, normalization                   extraction, are the key parameter used by the method.
(i.e., the use of reference numerical scores) can help the                  With this method, eco-factors are determined based
following: (i) to identify the most relevant impact catego-                 on the current emission situation and the political
ries in a given region or for a given product, i.e., to define              targets set by Switzerland or by international policy
Product Category Rules (PCRs) (as in the case of Product                    and supported by Switzerland. The method was first
Environmental Footprint (PEF) of products (EC 2013),                        published in 1990.
and (ii) to address eco-innovation policies and strategies              –   EDIP 1997 (Wenzel et al. 1997; Hauschild and Wenzel
toward the most effective solutions for decoupling.                         1998): weighting is based on a DTT approach using po-
    The normalization references express the total impact of a              litical reduction targets (only binding targets) for environ-
reference region for a certain impact category (e.g., climate               mental impacts and working environment impacts and
change, eutrophication, etc.) in a reference year. Weighting re-            supply horizon for resources. The weighted environmen-
flects a process of giving different relative importance to impacts         tal impact potential (WEP) is expressed in the unit “target
based upon a set of criteria (Finnveden et al. 2009).                       person-equivalent,” i.e., as parts of that person-equivalent
    According to ISO standards, weighting shall not be applied in           which corresponds to the chosen target impact in the
the context of comparative assertions, especially because any               weighting.
weighting implies the use of value judgements and comes with            –   Lin et al. (2005) and Wang et al. (2011): weighting factors
the risk of increased in transparency. However, in practice, any            based on environmental policy target for China.
time, there is a decision made, e.g. selecting between different        –   Tuomisto et al. (2012): set of weighting factors in which
products, a type of weighting is applied, be it explicit or implicit,       the weighting factor for each impact category is generated
be it conscious or involuntarily. When LCA is used in support of            by calculating the ratio between the current position and
policies, weighting can help to summarize the results in a re-              the estimated safe boundary foreseen by Rockström et al.
duced number of impact categories or even a single score                    (2009).
(Galatola and Pant 2014). Therefore, the development of a               –   Bjørn and Hauschild (2015) propose to integrate
weighting set that is transparently presented and whose limita-             carrying capacity in the normalization step of LCA
tions are highlighted and discussed can help not only to lead to            through a new normalization reference applicable to
better decisions but also to make the decision process more                 impact scores at midpoint level. The normalization
transparent.                                                                reference is expressed as the carrying capacity di-
    In LCA literature (Finnveden et al. 2002; Pennington et al.             vided by the population in the reference region and
2004; Huppes and van Oers 2011), three major groups of                      thus described the annual personal share of environ-
weighting methods could be identified: (i) monetization, which              mental impact space available according to the car-
have a monetary measure involved in evaluation (Pizzol et al.               rying capacity.
2015); (ii) panel-based (a group of methods where the relative
importance of damages, impact categories, or interventions is              Several examples exist about the calculation of normal-
derived from a group of people through surveys). This could             ization factors at the national scale, such as Dahlbo et al.
be value based (Powell et al. 1997; Myllyviita et al. 2012, 2014)       (2013) for Finland, Guinée et al. (2002) for the
or preference based (Soares et al. 2006; Frischknecht et al. 2008       Netherlands, Strauss et al. (2006) for South Africa (about
and Heijungs 2008); and (iii) distance to target (where charac-         mined abiotic resources), and Bare et al. (2006) for the
terization results are related to target levels, either policy based    USA. Wegener-Sleeswijk et al. (2008) developed normal-
or based on carrying capacity).                                         ization factors taking as reference the situation in EU and
    Weighting factors in distance-to-target (DTT) weighting             the whole world in 2000. However, there is no DTT
methods could be based on calculations that are performed on            weighting set assessing the distance of EU domestic im-
normalization factors. The weighting factor is defined for each         pacts from the desired state set by EU binding and non-
environmental impact category as the ratio between the actual           binding targets for 2020 (e.g., the Climate and Energy
impact and the target impact. The target impacts can be the             Package, EC 2009, the Roadmap to a Resource Efficient
expected level of impact foreseen by policy targets or physical         Europe, EC 2011, etc.).
thresholds not to be trespassed as in the case of planetary                In the context of the current development of the
boundaries.                                                             Product Environmental Footprint (PEF), several
Int J Life Cycle Assess
weighting methods are under evaluation and DTT is one normalization references (Ni) is substituted with a set
of the options considered. The present study is about the of target-based normalization references (Ti) producing
development of a DTT method for EU, based on recently the respective normalized (and weighted) impacts (NIi
released normalization factors (NFs) for 2010 for PEF and TIi). In the present study, the target-based normali-
(Benini et al. 2014a; Sala et al. 2015). zation reference for each impact category is derived
The aims of the study are: from EU policy targets for 2020. Therefore, normaliza-
tion reference values are the NFs for the current envi-
– To develop DTT weighting factors (WFsA and WFsB) for ronmental scenario (reflecting the status quo in 2010)
the EU based on binding and non-binding policy targets. and target reference values are derived from the appli-
– To compare different sets of weighting factors discussing cation of policy targets for 2020.
the implications and the effects on final results.
X
j¼m
Ii ¼ e j ⋅c f i j ð2Þ
The paper is organized as follows: after an introduction
j¼1
about normalization and DTT weighting methods, the meth-
X j¼m
odological steps undertaken to develop NFs and WFs apply- e j ⋅cf i j
j¼1
ing EU binding and non-binding targets for 2020 are present- NIi ¼ ð3Þ
ed. In the following sections, the resulting TFs2020A and Ni
TFs2020B sets are illustrated and compared to NFs2010, X j¼m X j¼m
j¼1
e j ⋅c f i j e j ⋅c f i j N i
j¼1
and finally, results of normalization and weighting factors as W NIi ¼ ⋅ wi ¼ ⋅ ð4Þ
distance to the targets are discussed in light of their use in Ni Ni Ti
policy context and for products. X j¼m
j¼1
e j ⋅c f i j
W NIi ¼ TIi ¼ ð5Þ
Ti
2 Methodology where
Ii Impact of the ith impact category for a given product
The present paper illustrates the methodology applied to de- or service
velop the 2020 target references—applying Europe 2020 pol- ej ith elementary flow associated with a given product or
icy targets—and to derive relative DTT weighting factors. service
In DTT weighting methods, the weight assigned to each cfij Characterization factor of the jth elementary flow for
impact category is the ratio between the normalization refer- the ith impact category
ence value (or NF) and the target value (Eq. (1)) (Finnveden Ni Normalization reference for the ith impact category
et al. 2002; Pennington et al. 2004; Seppälä and Hämäläinen Ti Target value for the ith impact category
2001) NIi Normalized impact of the ith impact category
Ni WNIi Weighted and normalized impact of the ith impact
wi ¼ ð1Þ category for a given product or service
Ti
TIi Target-based normalized impact of the ith impact
where category for a given product or service
wi Weight of the ith impact category
In the present paper, we apply Eq. (1) to derive DTT
Ni Normalization reference for the ith impact category
weighting sets.
Ti Target reference for the ith impact category
The target references are derived from the application
Some DTT methods magnify the distance to the selected of binding and non-binding targets to the existing inven-
target putting a power factor into the formula (e.g., tory at 2010. It results in two sets of target-based normal-
Frischknecht and Büsser Knöpfel 2013). The underlying con- ization references (or target references, T in Eq. (1)),
cept of the method is the same as in Eq. (1), i.e., giving more which reflect the expected state for 2020: TRs2020A (tar-
weight to those impacts which are the farthest from the target, get values for each impact category derived from imple-
but the results can be spread on a wider range of values. mentation of binding targets) and TRs2020B (target
As reported in the equations below (Eq. (2) to (5)), values for each impact category derived from implemen-
the application of a DTT weighting method to any LCA tation of from both binding and non-binding targets).
study changes the reference to which the impacts The method is specific for the International Life Cycle
resulting from the LCIA phase are assessed against. Data System (ILCD-specific); i.e., the weights calculated
As a result, when applying DTT methods, the set of in the present study and presented in Table 1 should beInt J Life Cycle Assess
Table 1 Normalization
references for year 2010 NRs2010 TRs2020A TRs2020B WFsA WFsB
(NRs2010) and target references
for year 2020 (TRs2020A Climate change midpoint 4.60E+12 3.95E+12 3.95E+12 1.16 1.16
applying binding targets and Ozone depletion midpoint 1.08E+07 1.04E+07 1.04E+07 1.05 1.05
TRs2020B applying binding and Human toxicity midpoint, cancer effects 1.88E+04 1.68E+04 1.68E+04 1.12 1.12
non-binding targets) and related
weighting factors (WFsA and Human toxicity midpoint, non-cancer effects 2.69E+05 2.65E+05 2.65E+05 1.01 1.01
WFsB) Particulate matter/respiratory inorganics 1.93E+09 1.59E+09 1.59E+09 1.21 1.21
midpoint
Ionizing radiation midpoint, human health 5.64E+11 5.64E+11 5.64E+11 1.00 1.00
Photochemical ozone formation midpoint, 1.58E+10 1.24E+10 1.24E+10 1.28 1.28
human health
Acidification midpoint 2.36E+10 2.00E+10 2.00E+10 1.18 1.18
Eutrophication terrestrial midpoint 8.76E+10 7.69E+10 7.69E+10 1.14 1.14
Eutrophication freshwater midpoint 7.41E+08 7.35E+08 7.35E+08 1.01 1.01
Eutrophication marine midpoint 8.44E+09 7.45E+09 7.45E+09 1.13 1.13
Ecotoxicity freshwater midpoint 3.78E+13 3.78E+13 3.45E+13 1.00 1.10
Land use midpoint 4.46E+12 4.24E+12 3.86E+12 1.05 1.15
Resource depletion water, midpoint 4.06E+10 4.06E+10 6.36E+09 1.00 6.38
Resource depletion, mineral, fossils, and 5.03E+07 5.03E+07 7.79E+07 1.00 0.65
renewable, midpoint
All the sets have been calculated applying ILCD 1.06 as LCIA method
consistently used with the characterization factors used in policy targets for 2020. The methodological steps are as
the calculation of the normalization references. follows:
The normalization references (NRs2010) used in this
paper are those recommended by the European 1. Identification of binding and non-binding EU targets for
Commission-Joint Research Centre (EC-JRC) for the 2020.
PEF (Benini et al. 2014a; Sala et al. 2015). The PEF 2. Development of the target-based 2020 inventory. This is
NFs are based on an extensive inventory of emissions done through the application of the policy targets to the
into air, water, and soil as well as resources extracted in reference inventory (2010), so to simulate the reduction in
EU which has been developed by EC-JRC (Sala et al. emissions or resource extraction expected to occur in
2014), with the aim of calculating life-cycle-based indi- 2020 (e.g., reduction by 20 % of GHG emissions in
cators for resource efficiency (EC-JRC 2012a and 2020 with reference to 1990). Those flows which are
2012b; Benini et al. 2014b). The inventory, covering not targeted by any policy measure, binding or not bind-
years from 1990 to 2010, is primarily based on exten- ing, are not modified. This step leads to two new inven-
sive data collection at EU level, from different sources, tories for 2020: inventory A, in which only binding targets
as well as on extrapolation strategies and gap filling are applied, and inventory B, on which both binding and
techniques for the calculation of missing flows. The non-binding targets are applied. From inventory A and
PEF NFs take as reference the situation in EU-27 in inventory B, applying ILCD mid-point characterization
2010 by accounting for the impacts occurring within factors (EC-JRC 2011), two sets of target references are
the domestic boundaries of EU and without including derived: TRs2020A and TRs2020B. Target factors
impacts associated with trade. (TFs2020A and TFs2020B) are the inverse of normaliza-
In the present paper, the methodology to derive target tion references.
references from policy-based target in 2020 (TRs2020), 3. Calculation of two sets of WFs, WFsA and WFsB, respec-
both binding and non-binding, is presented. Resulting tar- tively (according to Eq. (1)).
get factors (TFs2020 A and B) are then compared to the
current normalisation factors (NFs2010) (based on 2010
normalization reference set). 2.1 Binding and non-binding EU targets for 2020
The methodology implemented for calculating
TFs2020 and related weighting factors (WFs) applies a The review of binding and non-binding targets has been
DTT method based on binding and non-binding EU made starting from EU policies as reported in Table S1.Int J Life Cycle Assess
Binding targets are targets set by Directive or 3 Results and discussion
Regulations that imply an obligation for member states
to reach the target before the foreseen deadline. Non- The TRs2020A and TRs2020B are the results of step 2 of the
binding targets are defined, for the purpose of the pres- methodology presented above, where each of the elementary
ent study, as targets that are proposed in EU flows is reduced from its baseline year (2010, 2005, or 1990),
Communications not (yet) adopted, EU Strategies, depending on the baseline year of the policy setting the target.
supporting studies, etc., stating a future objective with- The two target factor sets are TFs2020A (only binding targets
out posing a compulsory obligation to reach it before a in 2020) and TFs2020B (binding and non-binding targets in
fixed deadline or sanctions to be applied if the target is 2020). From these ones, the related WFs, WFsA and WFsB,
not reached. were then calculated according to Eq. (1). Results are present-
The TFs2020 presented in Sect. 3 is the result of step ed in Table 1.
2 (above), where each of the elementary flows is re- The three reference sets (NRs2010, TRs2020A, and
duced from its baseline year (2010, 2005, or 1990), TRs2020B) show, in some impact categories, a relatively
depending on the policy setting the target. Some targets small difference. This could mean either that
related to the endpoint level are listed in Table S1 but
could not be implemented in the calculation of the two – In some cases, the existing targets have only a limited
updated NF set, because it was not possible to re-scale effect on the inventory, resulting in slight modification
them at the midpoint or the inventory level (as ex- of the normalization set and the related weighting.
plained in Sect. 4). The two target sets TFs2020A and – As explained more deeply in Sect. 4, the translation of
TFs2020B are based on the following: binding and non-binding targets into modifications of the
LCI flows is quite difficult because some of the targets set
– TRs 2020 A: only binding targets in 2020 thresholds non-comparable with the structure of the in-
– TRs 2020 B: binding and non-binding targets in 2020 ventory; therefore, the modifications do not take into ac-
count the whole range of possible improvements for ex-
The methodological choices adopted are as follows: pected status quo.
– As discussed in the Sect. 2, the equation applied for the
– Re-scaling of the target to 2020 through linear in- calculation (Eq. (1)) does not magnify the distance between
terpolation when the policy target refers to a period the current situation and the target, i.e., implicitly leads to a
in time beyond 2020 (e.g., some targets at 2030 smaller range of results compared to DTT methods which
have been used to linearly derive non-binding tar- are not based on linear distance from the targets.
gets for 2020).
– When a target is set for the year 2020 and refers to In addition, it has to be noted that several binding targets
a baseline other than2010, the target-based factor in refer to baseline year 2005. Hence, they have already affected
2020 has been calculated consistently with the relat- the inventory 2010. Therefore, in some impact categories,
ed inventory year (e.g., GHGs’ reductions at 2020 there is only a small difference between NRs2010 and
should be assessed compared to 1990; therefore, the TRs2020 (A and B).
−20 % has been applied to 1990 figures). WFs referred to set A and set B result to be quite similar,
– Application at the level of elementary flows and with differences between the two ranging from 1 % to about
proportional burden sharing. This implies that the 30 %. The only exception is water depletion, for which a very
reduction may simultaneously affect different impact relevant change is foreseen when considering the effect of the
categories (e.g., a reduction of NOx will imply re- non-binding target of limiting the abstraction of water re-
duction of NFs for acidification, photochemical source to 20 % of the available renewable water resources
ozone formation, etc.). In case that the target is and resources. The quite limited difference between the two
set at the mid-point level and not at the flow level, sets is mainly due to the higher difficulty in deriving quanti-
the reduction burden is proportionally shared among tative targets from non-binding strategies and policies rather
all those substances contributing to the impact cat- than from binding ones. A future improvement of the meth-
egory, unless other policies have already imposed odology could aim at developing a way to translate also policy
higher reduction targets on a specific substance. In strategies into modifications of the underlying inventory
that case, the highest target is adopted. flows.
Some of the results may be affected by the assumptions made
Further details about the binding and non-binding targets in the implementation of the methodology and by the constraints
considered and the methodological assumptions made for posed by the original structure of the inventory. In the following
each impact category are presented in SI (S1 and S2). paragraphs, the possible effects of these issues are discussed.Int J Life Cycle Assess
Regarding water depletion, it has to be considered that, in at the midpoint level. Table S2.4 (Electronic Supplementary
the current inventory, abstraction includes all kinds of with- Material) presents the WFsB, either for each type of resources
drawals (e.g., including cooling) but those for hydroelectricity and for the overall category, deriving from the comparison of the
generation. The average estimated ratio between consumption mass amount in the inventories 2005, 2010, and 2020. When
and abstraction is around 45 %, according to Vandecasteele et considering only the mass amount, the 2020 non-binding target
al. (2014). Therefore, if we had interpreted the target in a less results in a foreseen reduction of an additional 22 % of the 2010
stringent way by applying the threshold of 20 % withdrawals inventory.
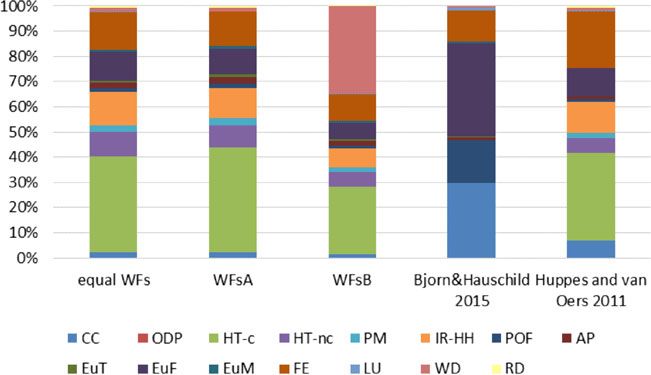
to the available renewable resources only to consumptive uses In Fig. 1, the results of the characterization of the EU energy
(i.e., not accounting for water released to the water body after mix process (source: Ecoinvent database v. 2.2) are normalized
its use), the resulting NF2020B would have been 1.41E+ using the three sets (NFs2010, TFs2020A, and TF2020B), to
10 m3, with a resulting WF2020B of 2.88. show an example of application to process-based LCA results.
It is also worthy to mention that the TRs2020B for the impact Normalization by TFs2020 A and B shows relevant differences
category Resource depletion, resulting from the application of from 2010 in human toxicity-cancer, freshwater ecotoxicty, and
binding and non-binding targets, is higher than the one deriving water depletion impact categories.
from the application of only binding targets. This is explained by In Table 2, the WFs are compared to other weighting sets
the fact that the non-binding target about resource consumption proposed in the literature, referred to either policy-based and
reduction refers to the baseline year 2005, whereas the carrying capacity targets (i.e., referred to physical thresholds
TR2020A refers to the inventory 2010. Since a significant re- as carrying capacity and planetary boundaries):
duction had already occurred from 2005 to 2010 at the domestic
scale, the application of the target to 2005 inventory data does – WFs proposed by Hauschild and Potting (2003) and in-
not lead to a reduction in the NF. cluded in the EDIP 2003 LCIA method
Moreover, the result of WFs for resources impact category – WFs by Tuomisto et al. (2012), based on the planetary
may be highly influenced by the relative importance given to boundary approach
some elementary flows (e.g., some metals) to which a very high – WFs as the ratio between ILCD NRs2010 and NRs based
CF is assigned. Thus, even a small mass reduction of these flows on carrying capacity thresholds by Bjorn and Hauschild
leads to a significant reduction of the overall impact due to (2015)
resource depletion (see Mancini et al. 2015). To quantify this – WFs resulting from a previous work by Huppes and van
effect, we decided to compare the WFs for resource depletion Oers (2011) for EC-JRC: weighted average of three
presented in Table S1 with the WFs that would be obtained if weighting sets at midpoint (EPA Science Advisory
they were referred only to the effect of mass reduction at the Board, BEES Stakeholder Panel, and NOGEPA, based
inventory level instead of being referred to the impact variation on an interactive panel weighting exercise)
Fig. 1 Example of normalization applying the three sets of NFs. The NFs toxicity-non-cancer, PM particulate matter, IR-HH ionizing radiation,
are applied to the characterization results (method: ILCD midpoint) of the POF photochemical ozone formation, AP acidification potential, EuT
process “1 kWh Electricity, medium voltage, production RER, at eutrophication, terrestrial, EuF eutrophication, freshwater, EuM
grid/RER U” from Ecoinvent v. 2.2 database. CC climate change, ODP eutrophication, marine, FE freshwater ecotoxicity, LU land use, WD
ozone depletion potential, HT-c human toxicity-cancer, HT-nc human water depletion, RD resources depletionInt J Life Cycle Assess
Table 2 Comparison of the relative importance (in %) of impact categories in the weighting factors resulting from the study, and in other sets of
weighting factors proposed in the literature
WFsA (%) WFsB (%) EDIP 2003 (%) Tuomisto et al. Bjorn and Hauschild Huppes and van
(2012) (%) (2015) (%) Oers (2011) (%)
Climate change 7.1 5.4 1.5 10.4 36.1 23.2
Ozone depletion 6.4 4.8 86.8 8.1 0.7 3.6
Human toxicity_cancer 6.9 5.2 1.7 n.a. n.a. 6.5
Human toxicity_non-cancer 6.2 4.7 1.7 n.a. n.a. 4.1
Particulate matter 7.4 5.6 n.a. n.a. n.a. 6.6
Ionizing radiation HH 6.1 4.6 n.a. n.a. n.a. 6.5
Photochemical ozone formation 7.8 5.9 1.7 n.a. 34.2 5.4
Acidification 7.2 5.5 1.8 8.4 1.4 4.2
Eutrophication terrestrial 7.0 5.3 1.7 27.6 0.8 n.a.
Eutrophication freshwater 6.2 4.7 1.4 6.5 8.5 7.0
Eutrophication marine 6.9 5.2 1.9 27.6 1.4 n.a.
Land use 6.1 5.1 n.a. 6.2 13.3 10.2
Ecotoxicity freshwater 6.4 5.3 n.a. n.a. 2.2 10.9
Resource depletion water 6.1 29.6 n.a. 5.2 1.4 5.1
Resource depletion 6.1 3.0 n.a. n.a. n.a. 6.9
In bold the impact categories having the highest weight in each weighting set
Some of the methods considered do not include all the – Policy targets act in many cases on few flows which are
impact categories of ILCD; for these impact categories, significantly contributing to many categories of impact
we decided to assign a WF equal to zero. Excluding these (i.e., the impact categories are highly correlated; there-
impact categories, the higher variability among the four fore, they vary in a similar way) as it is the case for
sets considered is shown in ozone depletion (where EDIP combustion-related emissions.
2003 has a factor of 63 compared to values around 1 of – Environmental policy targets are based on an evaluation of
the others) and water resource depletion (6.38 in WFsB the current situation (e.g., emission inventories in a given
compared, e.g., to 1 in WFsA and 0.65 in Tuomisto et al. year) and take into account aspects like technical feasibil-
2012). ity, political acceptance and economic costs, proportional-
In general, weighting methods based on carrying ca- ity, etc., whereas methods based on carrying capacity often
pacity show higher variability of weights among impact imply more stringent targets for some impact categories,
categories, whereas weighting methods based on policy sometimes set on longer time horizons than 2020 or 2030.
targets are much more balanced. This could have different
explanations: All of these characteristics might partially explain the re-
sults to different extent depending on the specificity of each
– The changes introduced by the policy targets have limited impact category. It is also worthy to consider that in methods
influence on the overall values of the indicators. based on carrying capacity, not all the impact categories are
– The indicators have a limited capability of capturing the covered and that policy-based methods include more impact
reduction in impacts induced by policies because they are categories. Therefore, the comparison between the weights
biased toward some few elementary flows that dominate associated to each impact category across weighting methods
the entire impact category. In this case, if the policy tar- has to be interpreted with caution.
gets address a different flow, the influence of the change Figure 2 presents the results obtained applying WFsA,
will not modify significantly the final WF value. For in- WFsB, an equal weight (1) for all the impact categories, and
stance, toxicity-related impact categories in ILCD are other weighting sets proposed in the literature, again using the
dominated by heavy metals, whereas most of the policy EU energy mix dataset as an example. The WFs are applied to
targets, derived from the results of impact assessment the characterization results (method: ILCD midpoint 1.06) of
studies, focus on pesticides and biocidal substances. the process “1 kWh Electricity, medium voltage, production
– The inventory in 2010 is underestimating the values asso- RER, at grid/RER U” from Ecoinvent v. 2.2 database, normal-
ciated to the pollutants or resources targeted by policies. ized using NFs 2010.Int J Life Cycle Assess
Fig. 2 Example of results obtained applying different weighting sets change, ODP ozone depletion potential, HT-c human toxicity-cancer, HT-
(equal WFs means that WFs are equal to 1 for all the impact categories nc human toxicity-non-cancer, PM particulate matter, IR-HH ionizing
and is taken as baseline reference). The WFs are applied to the radiation, POF photochemical ozone formation, AP acidification
characterization results (method: ILCD midpoint) of the process potential, EuT eutrophication, terrestrial, EuF eutrophication,
“1 kWh Electricity, medium voltage, production RER, at grid/RER U” freshwater, EuM eutrophication, marine, FE freshwater ecotoxicity, LU
from Ecoinvent v. 2.2 database, normalized using NFs 2010. CC climate land use, WD water depletion, RD resources depletion
Results for the other four weighting sets considered are impact categories considered in the LCIA phase. Moreover, it
quite consistent: even if there are some differences in the rel- is not easy to identify non-binding targets—especially if they
ative importance of the impact categories, the most important are not set within a policy document—so at the moment, the
ones (human toxicity—cancer effects, freshwater ecotoxicity, number of non-binding targets applied is quite limited.
and freshwater eutrophication) are the same among the four Not all the policy targets are expressed in quantitative terms
sets, with the only exception of water depletion, contributing or can be translated into quantitative reductions/modifications
the most in WFsB. Results obtained applying the method by of the elementary flows in the existing baseline inventories. In
Bjorn and Hauschild (2015) are quite different from the some cases, the target is posed to a year different from 2020,
others. The final single score is dominated by freshwater eu- so the target for 2020 needs to be re-scaled through linear
trophication, climate change, and photochemical ozone for- interpolation (e.g., when the policy target refers to a period
mation. However, when interpreting the results, it has to be in time beyond 2020).
considered that this method does not provide WFs for some of In addition, the underlying methodology used to devel-
the ILCD impact categories, including toxicity-related ones. op the inventory 2010, which was used as a basis for the
These results, if compared to the result of normalization, calculation, can pose some limitations to the present ex-
presented in Fig. 1, suggest that the normalization step may ercise, where the NFs and WFs are supposed to be applied
play a more relevant role than the weighting step, influencing to the results of process-based LCAs, based on inventories
more the single aggregated score of the process under inves- developed in a different way. Firstly, no delayed emis-
tigation. This is confirmed also when only the impact catego- sions are taken into account in the inventory 2010.
ries for which a WF is available in all the sets discussed and Therefore, even if we respect the target in terms of actual
compared before are considered (Figs. S3 and S4, Electronic emissions in the target year, in 2020, we may have the
Supplementary Material). occurrence of emission due to delayed emission generated
by end-of-life processes or the release of stored emissions
(e.g., in wood-based products), the release of POPs, etc.
4 Conclusions In the same way, neither long-term emissions are includ-
ed, i.e., not taken into account in 2020.
The resulting sets present strengths and limitations. The trans- Secondly, even if some of the targets identified are differ-
lation of policy targets into quantitative modifications to the entiated among EU countries (e.g., GHG reduction targets
baseline inventories (2010, 2005, 1990), in order to derive TFs according to burden sharing approach), no spatialization was
for 2020, appeared to be not a straightforward task, due to performed when applying these targets to 2010 (or
several reasons discussed below. 1990/2005) inventory. Therefore, the effect of spatial differ-
Indeed, the review of policy documents helped to identify a entiation is not taken into account in the WFs (which are the
wide range of targets but still not covers completely all the same for all the EU).Int J Life Cycle Assess
Thirdly, some of the targets refer to issues that are currently The proposed non-binding target set for water is based on
not covered by LCIA methods, i.e., not included in the base- an assumption of a carrying capacity of water systems, where
line inventory. An example is the target for indoor air quality the use of water below 20 % of renewable water resources is
posed by EC 2004. The regulation posed non-binding ceilings considered as a sustainability threshold not to be trespassed.
to ambient concentration of arsenic, cadmium, nickel, and However, the definition of quantitative targets based on plan-
benzo(a)pyrene by 2013. At present, indoor emissions and etary boundaries can be particularly critical when dealing with
concentrations are not covered by any of the existing LCIA some impact categories, especially in case of potential irre-
methods, even if there are some proposals of methods to ac- versibility of the damage, as it is for toxicity-related impact
count for it (e.g., Hellweg et al. 2009). The same applies to categories. In this case, a precautionary approach may suggest
biotic resources, noise, and erosion, which are not covered by to define a target such as zero potentially affected fraction
the ILCD methods used for this study (EC-JRC 2011). (PAF) to protect ecosystems and human health, which can
Moreover, the use of the normalization step in LCA as an pose strong challenges when need to be put into practice.
approach through which to compare different impacts might Therefore, further research and discussion are needed on this
reveal some limitations as well, as discussed by Heijungs et al. topic with the aim of improving the environmental relevance
(2007). For instance, the wrong quantification of the NFs, either of targets and related normalization and WFs to be applied in
as underestimation or overestimation, might result in a mislead- LCA practice.
ing comparison among impact categories and further wrong
prioritization. Also, policy targets NFs can be affected by the Acknowledgments The work on weighting methods was partly finan-
cially supported by the Directorate General Environment (DG ENV) of
same limitation in case that they are calculated as relative reduc-
the European Commission in the context of the Administrative
tion from the NFs observed in 2010. Factors such as the robust- Arrangement “Technical support for Environmental Footprinting, mate-
ness of the underlying methodologies and datasets should hence rial efficiency in product policy and the European Platform on LCA” (No.
be included in the process of prioritization among impact cate- 07.0307/ENV/2013/SI2.668694/A1).
gories. In addition to that, the perspective adopted in the assess-
ment of the normalization values (i.e., domestic vs. apparent
consumption) might change substantially the results. This is
Open Access This article is distributed under the terms of the Creative
important especially for targets on resources that focus on con- C o m m o n s At t ri b u ti o n 4. 0 In t er n at io n a l License (http://
sumption (including embodied). Imports of metals in Europe, creativecommons.org/licenses/by/4.0/), which permits unrestricted use,
when expressed in mass, are eight times higher than domestic distribution, and reproduction in any medium, provided you give
appropriate credit to the original author(s) and the source, provide a link
extraction (gold and copper are the main contributors to the total
to the Creative Commons license, and indicate if changes were made.
import) whereas import of energy carriers is twofold the extrac-
tion in EU. Other targets are on territorial scale, focusing on
domestic emission reduction, and might be less affected by the
References
inclusion of trade in the assessment.
Finally, it is worthy to mention that some DTT weighting
Bare J, Gloria TH, Norris G (2006) Development of the method and U.S.
methods such as Ecoindicator 95 (Goedkoop 1995) use dam- normalization database for life cycle impact assessment and sustain-
age WFs for DTT weights, i.e., calculate the weights as ability metrics. Environ Sci Technol 40(16):5108–5115
Wi = wi ∗ Ni / Ti. On the contrary, the proposed method as- Bengtsson M, Steen B (2000) Weighting in LCA—approaches and ap-
plications. Environ Prog 19(2):101–109
sumes that the target-based normalization references are de-
Benini L, Mancini L, Sala S, Schau EM, Manfredi S, Pant R (2014a)
termined at the same damage level; i.e., it is equally important Normalisation method and data for Environmental Footprints. Del.2
to achieve the target values within each impact category in of the AA with DG ENV: № 070307/2012/ENV.C.1/635340
2020. The authors are aware that policies related to different Benini L, Sala S, Manfredi S, Góralczyk M (2014b) Overall environmen-
impacts are defined taking into consideration each single issue tal impact (resource) indicators. Del. 3 of the AA with DGENV
Scientific support for screening and development of potential re-
and not an overall picture of their potential effects; however, source efficiency and product-group indicators as well as targets
giving normative weights to the different DTTs is considered for the reduction of the overall environmental impact of EU
out of the scope of the present exercise. consumption
Further development of the methodology, aimed at improv- Bjørn A, Hauschild MZ (2015) Introducing carrying capacity-based nor-
malisation in LCA: framework and development of references at
ing the effectiveness in supporting policies, can be the integra- midpoint level. Int J Life Cycle Assess 20(7):1005–1018
tion with other DTT approaches, which may refer not only to Dahlbo, H., Koskela, S., Pihkola, H., Nors, M., Federley, M., & Seppälä,
policy-based targets (like in the present study) but also to those J. (2013) Comparison of different normalised LCIA results and their
based on the carrying capacity concept. As discussed before, feasibility in communication. The International Journal of Life
Cycle Assessment, 18(4), 850–860
some examples of DTT method referred to distance from plan- European Commission (EC) (2004) Directive 2004/107/EC of 15
etary boundaries (Tuomisto et al. 2012) have already been December 2004 relating to arsenic, cadmium, mercury, nickel and
proposed. polycyclic aromatic hydrocarbons in ambient airInt J Life Cycle Assess
European Commission (EC) (2009) Decision 406/2009/EC on the effort Heijungs R (2008) The weighting step in life cycle impact assessment.
of Member States to reduce their greenhouse gas emissions to meet Three explorations at the midpoint and endpoint level. Weighting
the Community’s greenhouse gas emission reduction commitments with damage costs. CML, Leiden University, Netherlands
up to 2020 Heijungs R, Guinée J, Kleijn R, Rovers V (2007) Bias in normalization:
EC (2011) Roadmap to a Resource Efficient Europe. COM(2011) 571 causes, consequences, detection and remedies. Int J Life Cycle
final Assess 12(4):211–216
EC (2013) Commission Recommendation of 9 April 2013 on the use of Hellweg S, Demou E, Bruzzi R, Meijer A, Rosenbaum RK, Huijbregts
common methods to measure and communicate the life cycle envi- MA, McKone TE (2009) Integrating human indoor air pollutant
ronmental performance of products and organisations. ANNEX II : exposure within life cycle impact assessment. Environ Sci Technol
product environmental footprint (PEF) guide. European 43(6):1670–1679
Commission Huppes G, van Oers L (2011) Background review of existing weighting
European Commission - Joint Research Centre (EC-JRC) (2011) approaches in life cycle impact assessment (LCIA). JRC Scientific
International Reference Life Cycle Data System (ILCD) and Technical Reports, Luxembourg: Publications Office of the
Handbook—recommendations for life cycle assessment in the European Union, ISBN 978-92-79-21751-7, ISSN 1831–9424.
European context—based on existing environmental impact assess- http://bookshop.europa.eu/is-bin/INTERSHOP.enfinity/WFS/EU-
ment models and factors. ISBN 978-92-79-17451-3, doi: 10.278/ Bo o k s h o p- Si t e / e n _ G B/ - / E U R /Vi e w Pu b l i c a t i o n- St a r t ?
33030. EC-JRC. Publications Office of the European Union, PublicationKey=LBNA24997
Luxembourg Huppes G, van Oers L, Pretato U, Pennington DW (2012)
EC - JRC (2012a) Life cycle indicators framework: development of life Weighting environmental effects: analytic survey with opera-
cycle based macro-level monitoring indicators for resources, prod- tional evaluation methods and a meta-method. Int J Life
ucts and waste for the EU-27. European Commission, Joint Cycle Assess 17(7):876–891
Research Centre, Institute for Environment and Sustainability ISO (2006) ISO 14040 Environmental management—life cycle assess-
EC - JRC (2012b) Life cycle indicators for resources: development of life ment— principles and framework. Geneva, Switzerland
cycle based macro-level monitoring indicators for resources, prod- Lin M, Zhang S, Chen Y (2005) Distance-to-target weighting in life cycle
ucts and waste for the EU-27. European Commission, Joint impact assessment based on Chinese Environmental Policy for the
Research Centre, Institute for Environment and Sustainability period 1995–2005. Int J Life Cycle Assess 10(6):393–398
European Council (EUCO) (2014) Conclusions of the European Council Mancini L, Benini L, Sala S (2015) Resource footprint of Europe: com-
on 24 October 2014, EUCO 169/14 plementarity of material flow analysis and life cycle assessment for
Finnveden G, Hofstetter P, Bare J, Basson L, Ciroth A, Mettier T, Seppälä policy support. Environ Sci Policy 54:367–376
J, Johansson J, Norris G, Volkwein S (2002) Normalisation, group- Myllyviita T, Holma A, Antikainen R, Lähtinen K, Leskinen P (2012)
ing, and weighting in life cycle impact assessment. In: Udo de Haes Assessing environmental impacts of biomass production chains—
HA et al. (ed) Life cycle impact assessment: striving towards best application of life cycle assessment (LCA) and multi-criteria deci-
practice. Society of Environmental Toxicology and Chemistry sion analysis (MCDA). J Clean Prod 29:238–245
(SETAC), Pensacola Myllyviita T, Leskinen P, Seppälä J (2014) Impact of normalisation, elic-
Finnveden G, Hauschild MZ, Ekvall T, Guinee J, Heijungs R, Hellweg S, itation technique and background information on panel weighting
Koheler A, Pennington D, Suh S (2009) Recent developments in life results in life cycle assessment. Int J Life Cycle Assess 19(2):377–
cycle assessment. J Environ Manag 91:1–21 386
Frischknecht R, Büsser Knöpfel S (2013) Swiss Eco-Factors 2013 ac- Pennington DW, Potting J, Finnveden G, Lindeijer E, Jolliet O, Rydberg
cording to the Ecological Scarcity Method. Methodological funda- T, Rebitzer G (2004) Life cycle assessment part 2: current impact
mentals and their application in Switzerland. Environmental studies assessment practice. Environ Int 30:721–39
no. 1330. Federal Office for the Environment, Bern, 254 pp Pizzol M, Weidema B, Brandão M, Osset P (2015) Monetary valuation in
Frischknecht R, Steiner R, Jungbluth N (2008) Ökobilanzen: Methode life cycle assessment: a review. J Clean Prod 86:170–179
der ökologischen Knappheit – Ökofaktoren 2006. Methode für die Powell JC, Pearce DW, Craighill AL (1997) Approaches to valuation in
Wirkungsabschätzung in Ökobilanzen. Öbu SR 28/2008. Öbu, LCA impact assessment. Int J Life Cycle Assess 2(3):163–169
Zürich, Switserland http://www.oebu.ch/oebu/downloads/ Rockström J, Steffen W, Noone K, Persson A, Chapin FS, Lambin E,
oekofaktoren_sr28.pdf Lenton TM, Scheffer M, Folke C, Schellnhuber HJ, Nykvist B, de
Galatola M, Pant R (2014) Reply to the editorial “Product environmental Wit CA, Hughes T, van der Leeuw S, Rodhe H, Sorlin S, Snyder PK,
footprint-breakthrough or breakdown for policy implementation of Costanza R, Svedin U, Falkenmark M, Karlberg L, Corell RW,
life cycle assessment?” written by Prof. Finkbeiner (Int J Life Cycle Fabry VJ, Hansen J, Walker B, Liverman D, Richardson K,
Assess 19(2):266–271). Int J Life Cycle Assess 19(6):1356–1360 Crutzen P, Foley J (2009) Planetary boundaries: exploring the safe
Goedkoop M (1995) The Eco-Indicator 95. RIVM Report 9523. operating space for humanity. Ecol Soc 14(2):32
Bilthofen, 1995 Sala S, Benini L, Mancini L, Ponsioen T, Laurent A, van Zelm R, Stam G,
Guinée JB, Gorrée M, Heijungs R, Huppes G, Kleijn R, de Koning A, van Goralczyk M, Pant R (2014) Methodology for building LCA-
Oers L, Wegener Sleeswijk A, Suh S, Udo de Haes HA, de Bruijn H, compliant national inventories of emissions and resource extraction.
van Duin R, Huijbregts MAJ (2002) Handbook on life cycle assess- Background methodology for supporting calculation of product en-
ment. Operational guide to the ISO standards. I: LCA in perspective. vironmental footprint normalisation factors and resource efficiency
IIa: guide. IIb: operational annex. III: scientific background. Kluwer indicators for EU. JRC science and policy report
Academic Publishers, Dordrecht, 692 pp ISBN 1-4020-0228-9, Sala S, Benini L, Mancini L, Pant R (2015) Integrated assessment of
cml.leiden.edu/research/industrialecology/researchprojects/fin- environmental impact of Europe in 2010: data sources and extrapo-
ished/new-dutch-lca-guide.html lation strategies for calculating normalisation factors. Int J Life
Hauschild M, Potting J (2003) Spatial differentiation in life cycle impact Cycle Assess 20(11):1568–1585
assessment—the EDIP2003 methodology. Institute for Product Seppälä J, Hämäläinen RP (2001) On the meaning of the distance-to-
Development Technical University of Denmark target weighting method and normalisation in life cycle impact as-
Hauschild M, Wenzel H (1998) Environmental assessment of products. sessment. Int J Life Cycle Assess 6(4):211–218
Vol. 2 Scientific background. Chapman & Hall, United Kingdom/ Soares SR, Toffoletto L, Deschênes L (2006) Development of weighting
Kluwer Academic Publishers, Hingham, MA, USA. pp 565 factors in the context of LCIA. J Clean Prod 14(6):649–660Int J Life Cycle Assess
Strauss K, Brent A, Hietkamp S (2006) Characterisation and normalisation Wang H, Hou P, Zhang H, Weng D (2011) A novel weighting method in
factors for life cycle impact assessment mined abiotic resources cate- LCIA and its application in Chinese policy context. In: Towards life
gories in South Africa: the manufacturing of catalytic converter ex- cycle sustainability management. Springer Netherlands, pp 65–72
haust systems as a case study. Int J Life Cycle Assess 11(3):162–171 Wegener-Sleeswijk A, Van Oers LFCM, Guinée JB, Struijs J, Huijbregts
Tuomisto HL, Hodge ID, Riordan P, Macdonald DW (2012) Exploring a MAJ (2008) Normalisation in product life cycle assessment: an
safe operating approach to weighting in life cycle impact assess- LCA of the global and European economic systems in the year
ment—a case study of organic, conventional and integrated farming 2000. Sci Total Environ 390:227–40
systems. J Clean Prod 37:147–153 Wenzel H, Hauschild MZ, Alting L (1997) Environmental assess-
Vandecasteele I, Bianchi A, Batista e Silva F, Lavalle C, Batelaan O ment of products. Vol.1. 544 pp. Chapman & Hall, United
(2014) Mapping current and future European public water with- Kingdom, Kluwer Academic Publishers, Hingham, MA. USA.
drawals and consumption. Hydrol Earth Syst Sci 18:407–416 ISBN 0412808005You can also read