2021 ANNUAL INVESTMENT PLAN Ohio Public Employees Retirement System - Defined Benefit Fund | Health Care 115 Trust Fund - OPERS
←
→
Page content transcription
If your browser does not render page correctly, please read the page content below
2021
Ohio Public Employees Retirement System

ANNUAL INVESTMENT PLAN
Defined Benefit Fund | Health Care 115 Trust Fund

Ohio Public Employees Retirement System
277 East Town Street,
Columbus, Ohio 43215
1.800.222.7377 | www.opers.org

TABLE OF CONTENTS

Table of Contents
 Chief Investment Officer’s Letter……………………………………………………………………...1
 Executive Summary…………………………………………………………………………………….2
 Defined Benefit Fund....………………………………………………………………………………. 5
 Health Care Fund……………………………………………………………………………………….8

ASSET CLASS STRATEGIES………..……………………………………………………………….11
 Tactical Outlook……………………………………………………………………………………….11
 Performance Expectations – Excess Return Targets……………………………………………..16
 Public Equity…………………………………………………………………………………………...16
 Fixed Income…………………………………………………………………………………………..16
 Alternatives…………………………………………………………………………………………….17
 Risk Parity……………………………………………………………………………………………...18

POLICIES, COMMITTEES AND RESOURCES…………………………………………………….19
 OPERS Retirement Board Policies Governing Investment Activities…………………………...19
 Staff Committee Structure……………………………………………………………………………20
 Staffing…………………………………………………………………………………………………21
 Organizational Structure ………………………..…………………………………………………...24
CHIEF INVESTMENT OFFICER’S LETTER

                               Chief Investment Officer’s Letter
Members of the Ohio Public Employees Retirement System’s Retirement Board:

In collaboration with the Investments Division and OPERS consultants, I am pleased to
present the 2021 Annual Investment Plan (AIP). The AIP lays out the performance goals
for the Investment Division and provides a framework for OPERS to achieve its long-term goal of
secure retirement benefits for our members. In addition to performance targets, the AIP
illustrates how OPERS seeks to achieve those goals along with the constraints, risks, and
resources the Investments Division must work with to achieve the long-term return target.

In last year’s AIP, I wrote that the Investment Staff was prepared to meet the investment
challenges in 2020. While, I could never have predicted COVID-19, this past year proved how
well prepared our Staff was to handle these challenges. From navigating the volatility in the
markets, to the seamless transition to work-from-home, the Investments Division was able take on
each of these assignments without compromising the quality of our output. In particular, Staff
successfully implemented internal and operational initiatives while continuing to generate excess
returns for both the Defined Benefit and Health Care Funds throughout the year.

The past year was the most volatile year for U.S. equities since 2009, prompting the
Federal Reserve to cut interest rates from 1.5% to 0%, and pressuring Congress to pass
two of the largest stimulus packages in U.S. history: the $2 trillion CARES Act passed in
March, and the $900 billion pandemic relief bill passed in December. The combined
effect has benefited the markets, pushing the S&P 500 to an all-time high of 3,756 on
December 31, 2020 after dipping to 2,237 earlier in the year. After all this turmoil in 2020,
Staff produced a 12.02% return for the Defined Benefit Fund, exceeding the 7.2% target
return. The results were similar for the Health Care Fund which returned 10.96%,
exceeding its target return of 6.0%. As of December 31, 2020, net assets of the Defined
Benefit Fund and the Health Care Fund were $98.4 billion and                   $13.4 billion,
respectively, exceeding the asset growth targets for both funds. The combined assets of
the two OPERS funds achieved an all-time high market value of $111.8 billion.

Staff would like to acknowledge the assistance and advice of OPERS Investment Advisors.
While consultants to OPERS Retirement Board and Staff are strictly advisory, their
knowledge, experience, and insights are valued and appreciated. Staff would also like to
acknowledge the critically important work of many others at OPERS who make
the Investments Division’s work possible. While a complete list is impossible, the
invaluable assistance of Investment Accounting and Operations, Compliance, Legal Services,
Information Technology, Executive Services, Audit, Human Resources, and Enterprise Risk
are greatly appreciated.

Finally, I would like to thank the OPERS Retirement Board members for their confidence in
Staff, for the resources they make available to us, and for their continued judicious oversight
of the Investments Division for our members.

January 19, 2021
OPERS 2021 INVESTMENT PLAN                                                              Page 1
EXECUTIVE SUMMARY
Executive Summary
The following Summary outlines the strategies, asset allocation, and the asset class strategies
for OPERS Defined Benefit and Health Care Funds. This Summary also includes initiatives and
resources as well as performance and risk expectations.
Fund Strategies
The Defined Benefit Fund (“DB Fund”) is working towards the recently approved dynamic asset
allocation at the January 2021 meeting. Staff expects the transition to complete and reach the
new allocation targets by the end of Q1 2021. The Health Care Fund (“HC Fund”) will continue
transitioning toward its strategic asset allocations as part of the Asset-Liability Study approved by
the OPERS Retirement Board at the October 2020 meeting for the Health Care Fund.
The following table outlines the projected base case returns with ranges for both the Defined
Benefit and Health Care Funds. The base case 2021 Fund return expectations are slightly lower
than 2020 for both the Defined Benefit and Health Care Funds due to lower expected returns for
Fixed Income and Alternatives Asset Class.
Base Case Return Active Tracking Information
Return* Range Return Error Ratio
Defined Benefit Fund
2021 6.40 -7.35 to 20.15 0.36 0.90 0.40
2020 6.58 -7.17 to 20.33 0.38 0.95 0.40
2019 7.22 -6.53 to 20.97 0.42 1.05 0.40
Health Care Fund
2021 5.38 -7.12 to 17.88 0.26 0.66 0.40
2020 5.64 -6.86 to 18.14 0.26 0.66 0.40
2019 6.44 -6.06 to 18.94 0.31 0.78 0.40
*Source: 2021 NEPC Capital Market Expectations applied to OPERS Strategic Asset Allocation targets
The active returns shown above incorporate an information ratio of 0.40. This ratio measures
the active return per unit of tracking error (active risk), which is a risk-adjusted return metric.
3 year Alpha 1 year Alpha
Defined Benefit Fund Target Target
2021 0.22 0.36
2020 0.23 0.38
2019 0.42
Health Care Fund
2021 0.16 0.26
2020 0.17 0.26
2019 0.31
OPERS 2021 INVESTMENT PLAN Page 2EXECUTIVE SUMMARY
Asset Allocation and Asset Class Strategies
NEPC, OPERS Retirement Board retained Investment Advisor, has recommended dynamic
asset allocation changes for the DB Fund in 2021 with Staff support. No changes are planned
for the HC Fund asset allocation. Staff will continue its focus on reviewing the existing
line-up of managers, strategies, and portfolios in the context of internal versus external
management with an emphasis on management fees, staffing and system resources needed
to bring additional assets in-house.
The Public Equity allocation in the Defined Benefit and Health Care Funds targets the market-
based global weighting between U.S. Equity and Non-U.S. Equity in the MSCI All Country World
Index-Investable Market Index (“MSCI ACWI-IMI”). The current asset allocation targets for U.S.
Equity and Non-U.S. Equity are static in both the DB and HC Funds. (Refer to pages 5 and 8 for
target allocations for the DB and HC Funds). Currently, Staff manages the U.S. Equity sub-asset
class by utilizing a factor framework to improve the capital allocation and derive efficiency.
With regard to the Fixed Income allocation, Staff is reviewing the current mix of external
managers within the Emerging Markets Debt and High Yield sub-asset classes to achieve
lower fees and more consistent performance. The High Yield sub-asset class is increasingly
being managed internally with 50% of the assets now managed in-house. This provides
improved liquidity, better risk-adjusted returns and lower fees.
Within the Alternatives asset class, Staff is managing the liquidation of the Hedge Fund portfolio.
The Private Equity commitment pace will continue to be elevated to achieve the target allocation
of 12%, set by the 2019 Asset-Liability study. Staff will focus on small to middle market Private
Equity strategies in developed markets and will continue to build out a diversified co-investment
program within the DB Fund. In the Private Real Estate sub-asset class, Staff will continue the
strategy of seeking attractive core and non-core investments.
Staff will continue to monitor the progress and report to the OPERS Retirement Board through
the quarterly AIP update report, along with the Board Consultant’s performance report.
Initiatives
Each year the Investments Division undertakes significant initiatives to enhance the capabilities
and performance of the Funds. The completed 2020 strategic initiatives, the continuation of
2020 initiatives, and the new 2021 strategic initiatives are highlighted below.
2020 Completed Initiatives
• Health Care Fund Asset-Liability Study and implementation
• Internal Risk Parity portfolio implementation as part of the Opportunistic Fund allocation
• Implementation of an internal U.S. Equity large cap ESG mandate
2021 Initiatives
• Defined Contribution Plan program review (Continued from 2020)
• Explore diversifying and risk mitigation strategies
• Study of the current Commodity and Non-U.S. Equity sub-asset class benchmarks
• Investment systems review and optimization
• Staff Investment Committee structure review
OPERS 2021 INVESTMENT PLAN Page 3EXECUTIVE SUMMARY Resources The Investments Division Staff is comprised of 64 budgeted positions with six positions currently vacant. The Investments Division submitted an estimated compensation and operating budget of $17.6 million for 2021. The budget includes the Finance Division’s estimate of the 2021 incentive compensation payout, based on the prior year’s budget. The budget incorporates the Investments Division’s effort to maintain internal investment management, where appropriate, due to its material cost savings. Staff estimates the total cost to manage the OPERS asset base at 39.8 basis points or $442.0 million. This is a reduction of over $100 million in fees, primarily due to the elimination of the Hedge Fund sub-asset class, reduction in the assets externally managed within the public markets, and lower management fees negotiated by Staff. The cost assumes a long-term growth trend in the fund’s asset base, whereas an unanticipated bear market would reduce the cost. OPERS 2021 INVESTMENT PLAN Page 4
FUND STRATEGIES

                                    Defined Benefit Fund
Expected Asset Growth – Defined Benefit Fund

The table below summarizes Staff’s estimate (base case) of market values and ranges for the
Defined Benefit Fund at December 31, 2021. Pessimistic and optimistic cases are also provided
for comparison purposes.

                                                        Defined Benefit Fund
                                                     2021 Expected Asset Growth
                                          Estimated Market Values, Returns and Cash Flows
                                          Pessimistic           Base           Optimistic
                                             Case               Case              Case
12/31/20 Market Value ($ billions)             $97.54            $97.54             $97.54
Expected Total Return                         -7.35%             6.40%             20.15%
Expected Investment Gain ($ billions)          -$7.17             $6.24             $19.65
Expected Cash Flow ($ billions)                -$3.60            -$3.60             -$3.60
12/31/21 Market Value ($ billions)             $86.77           $100.18            $113.60
The anticipated market value of $97.54 billion for December 31, 2020 is unaudited.

Asset Allocation – Defined Benefit Fund

The 2021 target asset allocation and ranges for the Defined Benefit Fund reflect an estimate by
Staff of the expected progress to be made toward the strategic asset allocation targets. Also
included are asset allocations for a comparable peer group as of June 2020.

                                        12/31/2020 12/31/2021                 Peer
                   Asset Class            Target     Target        Range      Group
         Public Equity                    42.9%      46.9%      27% to 67%   42.09%
            U.S. Equity                   21.4%      23.9%      19% to 29%   23.82%
            Non-U.S. Equity               21.5%      23.0%      18% to 28%   18.27%
         Fixed Income                     26.0%      25.0%      16% to 30%   24.47%
            Core Fixed                    11.0%      11.0%       7% to 13%   16.89%
            Floating Rate Debt             0.0%       0.0%       0% to 2%     0.00%
            Securitized Debt               1.0%       1.0%       0% to 2%     0.89%
            TIPS                           2.0%       3.0%       0% to 5%     2.55%
            High Yield                     2.0%       2.0%       1% to 3%     2.64%
            Emerging Markets Debt          6.0%       5.0%       3% to 9%     1.50%
            U.S. Treasury                  4.0%       3.0%       0% to 5%     0.00%
         Alternatives                     26.1%      23.1%      16% to 30%   26.11%
            Private Equity                12.0%      12.0%       5% to 15%   10.61%
            Real Estate                   10.0%      10.0%       5% to 15%    8.92%
            Hedge Funds                    3.0%       0.0%       0% to 2%     4.70%
            Opportunistic                  0.1%       0.1%       0% to 4%     1.02%
            Commodities                    1.0%       1.0%       0% to 2%     0.86%
         Risk Parity                       5.0%       5.0%        2% to 8%    0.00%
         Other                                                                7.33%
         Defined Benefit Fund            100.0%     100.0%                   100.00%
*The asset allocations are derived from the organizations in the Peer Group Comparison section
on page 23.

OPERS 2021 INVESTMENT PLAN                                                                   Page 5
FUND STRATEGIES
Schedule of Expected Performance and Volatility
Active Return Active Return Target Tracking
Average Performance Performance Tracking Error Target
Allocation Objectives Contribution Error Range Information
(%) (bps) (bps) (bps) (bps) Ratio
U.S. Equity 23.9% 12 3 30 0-100 0.40
Non-U.S. Equity 23.0% 60 14 150 0-300 0.40
Fixed Income 25.0% 17 4 50 0-200 0.34
Alternatives 23.1% 66 15 500 250-750 0.13
Risk Parity 5.0% 0 0 100 0-200 NA
Defined Benefit Fund 100.0% NA 36 90 0-300 0.40
The above table shows an anticipated active management contribution of 36 basis points to the
Defined Benefit Fund’s return for 2021. The estimated tracking error of 90 basis points indicates
a 68% probability that the active return will be in a range of -54 basis points to +126 basis points.
This interval is calculated by subtracting the tracking error from, and adding the tracking error to,
the expected active return.
Return and Risk – Defined Benefit Fund
The performance objectives for the Defined Benefit Fund are to: (1) exceed the return of the Policy
benchmark within an appropriately constrained risk framework, net of investment expenses: and
(2) exceed the actuarial interest rate over a reasonably longer time horizon. The Policy
benchmark combines designated market indices for asset classes, weighted by asset allocation
targets.
The return estimates in the following table were derived from the asset class return expectations
developed by the OPERS Retirement Board’s retained Investment Advisor, NEPC. The single-
point estimate return of 6.40% is comprised of an expected return of 6.04% from the policy mix
and an additional contribution of 0.36% from active management, net of fees.
In the following table, Staff divides return and risk into two components.
Policy: The return and risk derived from the policy asset allocation and the intermediate term
return and risk forecast of the underlying asset classes.
Active: The return and risk associated with deviations from benchmark allocations at either the
asset class level or portfolio level. It reflects the potential impact to relative performance
from deviating from the asset class policy allocation targets, from asset class benchmark
mismatches and from individual portfolio active risk.
OPERS 2021 INVESTMENT PLAN Page 6FUND STRATEGIES
The Policy Return and Active Return are calculated as weighted average of expected returns and
expected alphas of each sub-asset class.
2021 Policy Return Assumptions
Asset Classes Pessimistic Base Optimistic
Public Equity -11.67% 6.85% 25.37%
U.S. Equity -11.05% 6.10% 23.25%
Non-U.S. Equity -14.52% 7.20% 28.92%
Fixed Income -3.94% 2.25% 8.44%
Core Fixed -4.82% 1.24% 7.30%
Emerging Markets Debt -7.64% 4.76% 17.16%
Securitized Debt -8.90% 3.60% 16.10%
High Yield -8.90% 3.60% 16.10%
TIPS -5.70% 0.80% 7.30%
U.S. Treasury -4.90% 0.60% 6.10%
Alternatives -9.37% 7.58% 24.53%
Private Equity -14.61% 9.97% 34.55%
Real Estate -10.16% 4.74% 19.64%
Opportunistic -10.70% 5.80% 22.30%
Commodities -18.40% 0.60% 19.60%
Risk Parity -6.56% 5.44% 17.44%
Policy Return -7.78% 6.04% 19.86%
2021 Total Return Assumptions
Sources of Return Pessimistic Base Optimistic
Policy -7.78% 6.04% 19.86%
Active -0.54% 0.36% 1.26%
Total Return -7.35% 6.40% 20.15%
2021 Total Risk and Active Risk Assumptions
Sources of Variability Information Sharpe
Risk Risk Ratio Ratio*
Policy 13.82% 0.39
Active 0.90% 0.40
Total Risk 13.75% 0.42
*The Sharpe Ratio reflects 0.6% (10 year Cash Return) as the risk free rate.
OPERS 2021 INVESTMENT PLAN Page 7FUND STRATEGIES
Health Care Fund
Expected Asset Growth – Health Care Fund
The table below summarizes Staff’s estimate (base case) of market values and ranges for the
Health Care Fund at December 31, 2021. Pessimistic and optimistic cases are also provided for
comparison purposes.
Health Care Fund
2021 Expected Asset Growth
Estimated Market Values, Returns and Cash Flows
Pessimistic Base Optimistic
Case Case Case
12/31/20 Market Value ($ billions) $13.30 $13.30 $13.30
Expected Total Return -7.12% 5.38% 17.88%
Expected Investment Gain ($ billions) -$0.95 $0.72 $2.38
Expected Cash Flow ($ billions) -$1.08 -$1.08 -$1.08
12/31/21 Market Value ($ billions) $11.27 $12.93 $14.59
The anticipated market value of $13.3 billion for December 31, 2020 is unaudited.
Asset Allocation – Health Care Fund
The 2021 target asset allocation and ranges for the Health Care Fund reflect an estimate by Staff
of the expected progress to be made toward the strategic asset allocation targets, which are
shown below. There is no peer universe of public pension plans with separate health care funds.
12/31/2020 12/31/2021
Asset Class Target Target Range
Public Equity 46.9% 52.9% 33% to 73%
U.S. Equity 23.4% 27.9% 23% to 33%
Non-U.S. Equity 23.5% 25.0% 20% to 30%
Fixed Income 37.0% 34.0% 24% to 44%
Core Fixed 18.0% 17.0% 12% to 22%
Floating Rate Debt 0.0% 0.0% 0% to 1%
Securitized Debt 1.0% 2.0% 0% to 4%
TIPS 6.0% 7.0% 5% to 9%
High Yield 2.0% 4.0% 3% to 5%
Emerging Markets Debt 6.0% 2.0% 0% to 4%
U.S. Treasury 4.0% 2.0% 0% to 4%
Alternatives 11.1% 11.1% 8% to 14%
REITs 6.0% 7.0% 5% to 9%
Hedge Funds 3.0% 0.0% 0% to 2%
Opportunistic 0.1% 0.1% 0% to 5%
Commodities 2.0% 4.0% 2% to 6%
Risk Parity 5.0% 2.0% 1% to 4%
Health Care Fund 100.0% 100.0%
OPERS 2021 INVESTMENT PLAN Page 8FUND STRATEGIES
Schedule of Expected Performance and Volatility
Active Return Active Return Target Tracking
Average Performance Performance Tracking Error Target
Allocation Objectives Contribution Error Range Information
(%) (bps) (bps) (bps) (bps) Ratio
U.S. Equity 27.9% 12 3 30 0-100 0.40
Non-U.S. Equity 25.0% 60 15 150 0-300 0.40
Fixed Income 34.0% 18 6 50 0-200 0.36
Alternatives 11.1% 10 1 300 200-400 0.03
Risk Parity 2.0% 0 0 100 0-200 NA
Health Care Fund 100.0% NA 26 66 0-300 0.40
The above table shows an anticipated active management contribution of 26 basis points to the
Health Care Fund’s return for 2021. The estimated tracking error of 66 basis points indicates a
68% probability that the active return will be in a range of -40 basis points to +92 basis points.
This interval is calculated by subtracting the tracking error from, and adding the tracking error to,
the expected active return.
Return and Risk – Health Care Fund
The performance objective for the Health Care Fund is to exceed the return of the Policy
benchmark within an appropriately constrained risk framework, net of investment expenses. The
Policy benchmark combines designated market indices for asset classes, weighted by asset
allocation targets.
The return estimates in the following table below were derived from the asset class return
expectations developed by the OPERS Retirement Board’s retained Investment Advisor, NEPC.
The single-point estimate return of 5.38% is comprised of an expected return of 5.12% from the
policy mix and an additional contribution of 0.26% from active management, net of fees.
In the following table, Staff divides return and risk into two components.
Policy: The return and risk derived from the policy asset allocation and the intermediate term
return and risk forecast of the underlying asset classes.
Active: The return and risk associated with deviations from benchmark allocations at either the
asset class level or portfolio level. It reflects the potential impact to relative performance
from deviating from the asset class policy allocation targets, from asset class benchmark
mismatches and from individual portfolio active risk.
OPERS 2021 INVESTMENT PLAN Page 9FUND STRATEGIES
The Policy Return and Active Return are calculated as the weighted average of expected returns
or expected alphas of each sub-asset class.
2021 Policy Return Assumptions
Asset Classes Pessimistic Base Optimistic
Public Equity -11.59% 6.82% 25.23%
U.S. Equity -11.05% 6.10% 23.25%
Non-U.S. Equity -14.52% 7.20% 28.92%
Fixed Income -3.92% 1.87% 7.66%
Core Fixed -4.82% 1.24% 7.30%
Emerging Markets Debt -7.64% 4.76% 17.16%
Securitized Debt -8.90% 3.60% 16.10%
High Yield -8.90% 3.60% 16.10%
TIPS -5.70% 0.80% 7.30%
U.S. Treasury -4.90% 0.60% 6.10%
Alternatives -9.85% 4.86% 19.57%
REITs -14.30% 5.70% 25.70%
Opportunistic -10.70% 5.80% 22.30%
Commodities -18.40% 0.60% 19.60%
Risk Parity -6.56% 5.44% 17.44%
Policy Return -6.90% 5.12% 17.14%
2021 Total Return Assumptions
Sources of Return Pessimistic Base Optimistic
Policy -6.90% 5.12% 17.14%
Active -0.40% 0.26% 0.92%
Total Return -7.12% 5.38% 17.88%
2021 Total Risk and Risk Attribution Assumptions
Sources of Variability Information Sharpe
Risk Risk Ratio Ratio*
Policy 12.02% 0.38
Active 0.66% 0.40
Total Risk 12.50% 0.38
*The Sharpe Ratio reflects 0.6% (10 year Cash Return) as the risk free rate.
OPERS 2021 INVESTMENT PLAN Page 10ASSET CLASS STRATEGIES
ASSET CLASS STRATEGIES
Tactical Outlook
The following tactical outlook provides a background and context for the asset class strategies for
the Defined Benefit and Health Care Funds.
The following are overviews of the two components of the tactical outlook: the capital markets
observations and the asset class outlook. The Investment Advisors (NEPC and AHIC), retained
by the OPERS Retirement Board, provided these outlooks for 2021.
Capital Markets Observations
• Key Market Themes
o Virus and economic paths are aligned
▪ The pandemic has limited global economic activity.
▪ Virus trajectory is the dominant force driving market and economic
outcomes.
• Plausible paths range from a rapid economic recovery, K-shaped
recovery, or depression.
▪ Business disruption from the pandemic is widespread.
• Social-distancing guidelines, travel restrictions, and a higher cost
of living have disproportionately impacted major metro areas and
small businesses continue to struggle as stimulus money has
been exhausted.
o Permanent interventions
▪ Globally, significant monetary and fiscal stimulus has been aimed at
lessening the economic impact of COVID-19.
▪ In the US, the prospect of a fiscal stimulus package has supported
business and consumer sentiment.
o Globalization Backlash: The influence of the theme will likely increase in coming
quarters as countries digest lasting impacts from the pandemic
▪ The world will likely be faced with an amplified wealth divide given
economic and labor market disruptions.
▪ In addition, backlash may continue as countries reassess global supply
chains.
o China Transitions
▪ Tensions between the US and China remain elevated as the US
government attempted to ban apps, such as TikTok and WeChat, from
US platforms given data concerns.
Market Outlook
• US and Non-US Equities
o For certain investors, we recommend a modest strategic overweight to US
markets as we believe the elevated valuations trends are likely to continue.
o We encourage a strategic bias to emerging market equities relative to the MSCI
ACWI weight.
▪ The strategic overweight is designed to capture higher return
expectations and growth potential in emerging Asia.
OPERS 2021 INVESTMENT PLAN Page 11ASSET CLASS STRATEGIES
o Active implementation of small cap equities is generally preferred given relatively
attractive alpha potential.
• Fixed Income
o NEPC recommends the use of safe-haven fixed income for downside protection
and to be a source for liquidity.
o We encourage investors to hold a stand-alone Treasury mandate to mitigate
portfolio drawdowns.
o We feel that a strategic allocation to return-seeking credit can offer enhanced
risk-adjusted returns and diversification.
▪ NEPC recommends a strategic weight to public credit with allocations to
high yield, and blended emerging market debt.
• Real Assets
o The strategic outlook for real assets reflects a high level of uncertainty due to
subdued inflation expectations.
▪ Real assets offer a meaningful portfolio diversification benefit but are
exposed to a wide range of potential inflation scenarios.
o Energy-related asset classes continue to be challenged, with growth inputs
discounted to reflect the uncertainty.
o Real assets exhibit different betas to inflation and each asset class is exposed to
various economic factors.
o Inflation-sensitivity and portfolio objectives should influence an investor’s
strategic allocation to real assets.
• Private Equity
o 2021’s Private Equity (PE) activity is expected to remain relatively constant with
the lower levels of the first half of 2020 after having declined consistently every
quarter since 4Q 2018 and slowing significantly in the second quarter of 2020 as
a result of the COVID pandemic. New investment activity is expected to be
difficult due to uncertainty in the market.
▪ Purchase price multiples for new investments remain high at the five-year
average of 10.6x EBITDA, lower only than the 2019 peak of 11.6x.
Decreases in purchase prices are expected to be slow as sellers are
reluctant to reduce expectations and General Partner (GP)’s feel pressure
to deploy record levels of dry powder (capital committed but not yet drawn
down). Creating value at these multiples is difficult and GPs are
increasingly focusing on higher quality companies thus limiting the
number of transactions completed.
▪ Debt availability has tightened with debt multiple falling to the lowest level
since 2012. This is a result of uncertainty surrounding the economy and
company EBITDA. This also creates pressure to complete only high-
quality deals since a larger portion of the purchase price must be financed
with equity.
▪ Exit volume decreased by almost 50% in 2Q 2020 over 1Q 2020 and will
continue remain at lower levels as the backlog of deals completed during
the Great Financial Crisis (GFC) are largely exited, and deals completed
post GFC require high exit multiples to maintain value created in light of
the higher entrance multiples.
OPERS 2021 INVESTMENT PLAN Page 12ASSET CLASS STRATEGIES
▪ Total fundraising in 2020 is expected to be less than 80% of that in 2019
and will likely decrease further in 2021 given the lower activity level and
record dry powder level of $1.9 trillion.
▪ While allocations to PE have generally been increasing amongst
institutional investors, the combination of the impact from the COVID
pandemic on portfolios and the slowdown in exit activity has caused many
investors to surpass their target allocation to PE.
▪ Managers with strong track records will continue to raise larger funds,
often with only one close. Appetite for the best-performing funds is high,
potentially pushing those managers to raise too much capital.
Meanwhile, lesser performing funds are encountering trouble reaching
their targets.
o Capital markets have slowed with reduced debt availability despite high
valuations.
▪ Debt availability has decreased, currently running at a Last Twelve Month
(LTM) level of $288 billion -- less than half the peak level reached in 4Q
2017. Terms and conditions have moved to the favor of lenders and total
leverage has fallen to 5.1x EBITDA from 2019 levels of 5.8x.
▪ 30.5% of all new debt issuance is being used to refinance old deals rather
than support new transactions which is double the level at the end of
2019.
▪ While the number of distressed companies coming to market has not
reached the level anticipated, the LTM High Yield bond default rates are
at 5.1%, the highest level in over 10 years.
▪ These negative trends are not likely to reverse until the impact on the
economy begins to be felt from the availability of COVID vaccinations.
o U.S. GDP growth slowed and is expected to fall by 3.5% for the full year.
Projected growth of 4.1% in 2021 is largely dependent on the passage of another
stimulus package but could also be slowed by expected potential changes from
the new administration. Europe overall is expected to complete the year with a
GDP decline of 8.75% and is only expected to rebound by 6.1% in 2021. Asia is
mixed depending on the region but overall is expected to show lower losses of
0.5% for the year and slowly return to stronger growth of ~5.5% in late 2021.
o Interest in Venture capital (VC), while still high, is moderating. We expect 2021
to experience continued but judicious interest.
▪ Investment activity remains at high levels and is likely to stay there.
Frothy and highly anticipated IPOs continue to increase late stage round
investment activity from non-traditional investors like hedge funds and
mutual funds.
▪ Recent vintage funds have seen strong returns but pre-money valuations
are high for all deal stages except seed.
▪ Despite the hyped IPO activity, overall exit activity is slow with the lowest
number of exits, outside of IPOs, in over ten years. A rebound in this area
is contingent upon improved economic conditions and likely will not come
to fruition until the 2nd half of 2021.
OPERS 2021 INVESTMENT PLAN Page 13ASSET CLASS STRATEGIES
o 2021 is a year to be judicious and selectively invest only in promising managers /
strategies. Lower investment levels from some investors may create
opportunities that would otherwise not be available. Even in downturns, top
performing managers generate solid returns. There are pockets of attractive
investment strategies within all sectors of private equity.
▪ We favor investment in all sectors over multiple vintage years in order to
avoid overexposure to any one strategy or economic cycle as one cannot
time the market and good funds are raised in all vintage years. It may be
prudent to temper allocations to mega-cap markets and late stage
venture. There will be a short window for secondary investing at
attractive discounts; as such co-invests in this area could be lucrative.
▪ As always, manager selection will be the key to generating the best
returns, with a current focus on choosing managers with strong
operational capabilities and high levels of valuation discipline on new
deals.
• Real Estate
o Pre-COVID real estate markets were fundamentally strong, with supply and
demand in equilibrium and solid growth in occupancies and valuations. Late
cycle market conditions reflected full pricing across property sectors and risk
profiles, supporting growth-oriented strategies to achieve enhanced returns.
o The COVID Pandemic caused a real estate market correction that continues
today. The impact of the COVID correction has varied greatly by sector and
geography. We expect this correction and resulting volatility in performance to
continue into 2021. Substantial uncertainty exists regarding the timing and
shape of a real estate recovery.
o Most investors paused their programs during a substantial portion of 2020,
contributing to limited transactions and minimal price discovery; uncertainty
exists over current valuations.
o Overall Core real estate returns turned negative for the first time since the Global
Financial Crisis due to a variety of factors, such as occupancy disruptions,
suspension of rent payments, and reduced expectations for growth.
o The impact of the COVID correction can be grouped into three categories:
severe disruption, temporary disruption, and acceleration of some positive
trends.
▪ Severe disruption is limited primarily to retail and hospitality property
types. The retail trend away from traditional store formats to shop-at-
home/e-commerce has been greatly accelerated, resulting in store
closures, foreclosures and bankruptcies. Hotels and resorts are
experiencing dramatic declines in occupancy and revenue; however, the
prospects for this sector are perceived to be better because recovery is
expected post-COVID (unlike traditional retail).
▪ Temporary disruption visited many property types, including the
apartment sector (rent suspensions), office (debate over future incidence
of remote working), seniors housing (suspended move-ins), and student
housing (high incidence of remote learning). Most of these sectors are
expected to rebound relatively quickly post-Pandemic, with office being
the exception.
▪ Some sectors and geographies are actually seeing improved demand for
space associated with the COVID Pandemic. Generally, technology-
oriented real estate (data centers), life science facilities (R&D and lab
space), and logistics (e-commerce) are experiencing accelerated demand
OPERS 2021 INVESTMENT PLAN Page 14ASSET CLASS STRATEGIES
for space, strong leasing activity, high occupancies, and growth in
property values.
▪ Another trend accelerated by COVID is seen in population migration
trends. Increased growth in populations is benefitting markets in the
South and Southwestern U.S., where the climate for living and for
business are perceived to be favorable.
▪ Finally, a migratory trend away from large urban centers is benefitting the
suburbs. A developing trend in this direction was observed pre-COVID,
but it accelerated with remote working and the desire for social
distancing. Debate exists about the strength of the de-urbanization trend,
post-COVID.
OPERS 2021 INVESTMENT PLAN Page 15ASSET CLASS STRATEGIES
Performance Expectations – Excess Return Targets
Public Equity
The following table shows the benchmarks and performance objectives for the Public Equity asset
class. The benchmark for the U.S. Equity asset class is the Russell 3000 Index with an alpha
target of 12 basis points, net of fees. The tracking error target is 30 basis points with a range of
0 to 100 basis points. The performance objective and target tracking error for Non-U.S. Equity
are 60 basis points and 150 basis points, respectively.
Public Equity Asset Class
Alpha Target and Target Tracking Error
Alpha Target Tracking
Target Tracking Target Error
(net of fees) Error Information Range
Benchmark (bps) (bps) Ratio (bps)
U.S. Equity Russell 3000 12 30 0.40 0 - 100
Non-U.S. Equity Custom Benchmark 60 150 0.40 0 - 300
The custom benchmark for Non-U.S. Equity is composed of 55% MSCI World Index ex U.S.
Standard Index; 10% MSCI World Index ex U.S. Small Cap Index; 31% MSCI Emerging Markets
Standard Index; and 4% MSCI Emerging Markets Small Cap Index. This structure reflects a
strategic overweight to Emerging Markets compared to the Emerging Markets allocation of the
MSCI All Country World Index ex U.S. Investable Markets Index (“MSCI ACWI ex U.S. IMI”).
Fixed Income
The following table shows the benchmarks and performance objectives for the Fixed Income
asset class.
Fixed Income Asset Class
Alpha Target and Target Tracking Error
Alpha Target Tracking
Target Tracking Target Error
(net of fees) Error Information Range
Benchmark (bps) (bps) Ratio (bps)
Core Fixed Bloomb erg Barclays Aggregate 30 75 0.40 0 - 150
Emerging Markets Debt EMD Custom Benchmark** 46 230 0.20 0 - 800
Securitized Debt Securitized Deb t Custom Benchmark*** 80 200 0.40 0 - 400
High Yield Bloomb erg Barclays U.S. High Yield 20 100 0.20 0 - 700
TIPS Bloomb erg Barclays TIPS 0 15 NA 0 - 50
U.S. Treasury Bloomb erg Barclays U.S. Treasury 0 30 NA 0 - 50
**50% JP Morgan Emerging Markets Bond Index Global & 50% JP Morgan Government Bond Index-
Emerging Markets Global Diversified
***50% Bloomberg Barclays Non-Agency Investment Grade CMBS: BBB Total Return Index Unhedged
USD & 50% Bloomberg Barclays Non-Agency CMBS Agg Eligible Total Return Index Value Unhedged
USD.
OPERS 2021 INVESTMENT PLAN Page 16ASSET CLASS STRATEGIES
Securities Lending
In the securities lending program, Staff utilizes lending agents to maximize lending revenue. Staff
strives to hire agents who provide competitive fee splits, while providing adequate risk controls
and expertise in the asset class being loaned. There is a bias toward lending assets in an auction
environment, so borrowers are providing maximum revenue in a competitive environment on a
regular basis. Staff will continue lending the U.S. Treasury, Agency and a portion of the Corporate
Bond assets in-house. The collateral from the securities lending program is managed internally.
The combination of lending revenue and investment income comprise the total securities lending
performance.
Cash Management
The cash portfolios are managed with a low-to-moderate risk profile that results in principal
preservation while exceeding the performance of the respective benchmarks. The benchmark for
the OPERS Short Term Investment Funds (“STIF”) is the Tier 1 30-Day CP Index. The benchmark
for the Securities Lending STIF is the Overnight Bank Funding Rate.
Alternatives
The Alternatives asset class is composed of Private Equity, Real Estate, Opportunistic, REITs,
and Commodities investment strategies. The Defined Benefit and Health Care Funds invest
differently in the Alternatives asset class to meet their unique investment objectives.
The following table summarizes the benchmark, performance objectives and tracking error for the
various alternative investment strategies utilized within the Fund.
Alternatives Asset Class
Alpha Target and Target Tracking Error
Alpha Target Tracking
Target Tracking Target Error
(net of fees) Error Information Range
Benchmark (bps) (bps) Ratio (bps)
Private Equity State Street Private Equity Index 100 700 0.14 NA
Real Estate Net NFI-ODCE + 0.85% 30 700 0.04 NA
Opportunistic Custom Benchmark* 0 40 0.40 NA
REITs DJ U.S. Select RESI 0 10 NA 0 - 250
Commodities S&P GSCITR Index 36 90 0.40 0 - 300
* Market value weight of the underlying benchmarks
Opportunistic
The Opportunistic sub-asset class is intended to permit investments in assets or strategies not
presently contemplated in the respective Defined Benefit or Health Care Funds. In this regard,
assets or strategies used in the Opportunistic sub-asset class must have the potential to be
mainstreamed into OPERS investment program over time or be opportunistic based on either
valuation or circumstance. Strategies are developed based on their individual merit and
circumstances and are assessed as to their scalability and feasibility for a potentially larger
allocation. The maximum size for any single benchmarked strategy is 0.5% of the total fund.
Staff launched a $100 million internal Risk Parity portfolio, with an initial volatility target of 8% and
maximum leverage of 1.5x. This portfolio is now part of the Opportunistic Fund allocation.
OPERS 2021 INVESTMENT PLAN Page 17ASSET CLASS STRATEGIES
Hedge Fund
The Hedge Fund allocation was terminated in 2020 and is currently in liquidation mode. The
custom benchmark for 2021 is defined by the table below and is based on the estimated remaining
assets.
Strategy Target Range
Event Driven 65% 0-100%
Relative Value 35% 0-100%
Risk Parity
Risk Parity is an alternative approach to investment portfolio management, which focuses on the
allocation of risk rather than allocation of capital. The Risk Parity approach is underpinned by the
expectation that when asset allocations are adjusted to the same risk level, a portfolio can achieve
a higher Sharpe ratio and be more resilient to market downturns.
The performance benchmark for the OPERS Risk Parity asset class is the HFR Institutional Risk
Parity 15 Volatility Index and is managed as a passive allocation.
OPERS 2021 INVESTMENT PLAN Page 18POLICIES, COMMITTEES, AND RESOURCES
POLICIES, COMMITTEES, AND RESOURCES
OPERS Retirement Board Policies Governing Investment Activities
The following exhibit illustrates the structure and relationship of the Policies within the OPERS
System and its two investment Funds.
OPERS FUNDS
FUND POLICIES
DEFINED BENEFIT HEALTH CARE
FUND FUND
Investment Investment
Objectives and Asset Objectives and Asset
Allocation Policy Allocation Policy
ASSET/SUB-ASSET CLASS POLICIES
Public Equity Policy Cash Policy
Fixed Income Policy Commodities Policy
Private Equity Policy Hedge Funds Policy
Real Estate Policy Opportunistic Policy
Risk Parity Policy
INVESTMENTS-WIDE POLICIES
Broker - Dealer Policy Ohio-Qualified & Minority-Owned Manager Policy
Corporate Governance & Proxy Voting Guidelines Personal Trading Policy
Derivatives Policy Responsible Contractor Policy
External Investment Managers’ Insurance Policy Securities Lending Policy
Iran and Sudan Divestment Policy Soft Dollar Policy
Material Nonpublic Information Policy OFAC Policy
Defined Contribution Fund Policy Leverage Policy
Liquidity Policy
OPERS 2021 INVESTMENT PLAN Page 19POLICIES, COMMITTEES, AND RESOURCES
Staff Committee Structure
The Chief Investment Officer (“CIO”) utilizes a variety of committees, working groups and meeting
structures to govern the Investment Division’s activities. This internal governance arrangement
enhances collective inputs, retains institutional knowledge, provides documentation of the due
diligence process and other processes, promotes transparency and accountability, and formalizes
decision-making processes. These committees are designed to combine structure and flexibility
to efficiently bring the appropriate decision makers together on a timely basis and maintain a
controlled environment to minimize operational risk.
The following provides an outline of the Investment related committees.
Committee/Meeting Purpose and Description
Staff Investment Committees * Approvals and Decisions
Broker Review Monitor/Approve and Evaluate Brokers, Complete ORSC Reports
Counterparty Risk Set Counterparty Limits and Monitor Counterparty Exposures
DC Funds Staff Investments Committee Review/Monitor Defined Contribution Fund's Allocation and
Rebalancing Activities
Fund Management Implement Asset Allocation and Investment Strategies, Cash
Forecasting, Fund and Portfolio Exposure Metrics, and Set
Quarterly Fund Target Benchmark Allocations During Transition,
Liquidity Management
Operational Risk Management Identify and Monitor Operational Risks
GEC - Global Equity Committee Recommend to hire or terminate External Managers, to open or
close internally managed portfolios in relation to OPERS
Investment Polices
GFIC - Global Fixed Income Committee Recommend to hire or terminate External Managers, to open or
close internally managed portfolios in relation to OPERS
Investment Polices
PMAC - Public Market Alternative Committee Recommend to hire or terminate External Managers, to open or
close internally managed portfolios in relation to OPERS
Investment Polices
Real Estate Committee Review RE Opportunities for CIO Approval
Private Equity Committee Review PE Opportunities for CIO Approval
* Committee has charter and maintains minutes
OPERS 2021 INVESTMENT PLAN Page 20POLICIES, COMMITTEES, AND RESOURCES
Staffing
Recruiting and retaining the best and most talented Staff is a critical priority for the Investments
Division. The following table shows the anticipated full staffing for 2021.
Target Staffing for Year End 2021
Office Total
of the Fund Risk Internal External Invest.
CIO Mgmt. Mgmt. Funds Funds Division
2021 Investment Plan Projected Staffing 4 5 5 31 16 61
Current Staffing 4 4 5 30 15 58
Vacant Positions - To be filled in 2021 3 1 0 1 1 6
Year End 2021 Target Staffing 7 5 5 31 16 64
Current Open and Budgeted Positions
Position Vacant
Internal Management Senior Portfolio Manager 1
External Management Lead Portfolio Manager EPM 1
Internal Management Senior Analyst 1
Internal Management Investment Analyst - Quantitative Management 1
Internal Management Associate Investment Analyst - Fund Management 1
Internal Management Associate Analyst 1
Total 6
Staffing Costs
Assuming full staffing levels in 2021, the chart below details the estimated $17.55 million of
salaries, benefits, and incentive compensation for the Investments Division. This represents
approximately 1.58 basis points of cost, a decrease of 0.25 basis points from the 2020 projection
due to lower staffing levels (more vacancies) expected in 2021.
Estimated 2021 Total Compensation Costs
($ millions)
Office 2021 2020
of the Internal External Projected Projected
CIO Mgmt. Mgmt. Total Total
Salaries $1.46 $5.47 $2.41 $9.34 $10.08
Benefits $0.73 $2.79 $1.22 $4.73 $5.07
Incentive Compensation $0.44 $2.16 $0.87 $3.47 $3.46
Total Compensation $2.63 $10.42 $4.50 $17.55 $18.62
Average Assets ($ billions) $110.84 $55.43 $55.41 $110.84 $101.67
Compensation (Basis Points) 0.24 1.88 0.81 1.58 1.83
Operating Budget
The Investments Division’s 2021 operating budget (excluding compensation) is $10.62 million.
This operating budget reflects a decrease of $0.42 million, or 3.8% percent, from the 2020 budget
and, as a percentage of assets, is 0.96 basis points as compared to 1.09 basis points in 2020.
OPERS 2021 INVESTMENT PLAN Page 21POLICIES, COMMITTEES, AND RESOURCES
Operating Budget less Total Compensation
($ millions)
Total
Internal External Invest.
Mgmt. Mgmt. Division
2020 Operating Budget $8.59 $2.45 $11.04
2021 Operating Budget $8.48 $2.14 $10.62
Percent Change -1.3% -12.7% -3.8%
Percent of Total 79.8% 20.2% 100.0%
Average Assets ($ billions) $55.43 $55.41 $110.84
Operating Budget (Basis Points) 1.53 0.39 0.96
Total Costs
The total costs of the investment program in 2021 are projected to be $442.0 million, or 39.8 basis
points of assets under management. External Management fees are projected to be $416.5
million in 2021. In 2019 OPERS actual cost of 49.1 basis points was below the CEM benchmark
average cost of 52.6 basis points. CEM Benchmarking, Inc. is an independent firm that provides
an assessment of pension plans and it evaluates OPERS investment program relative to the peer
group of comparable size. CEM Benchmarking excludes the Incentive/Performance fees for
Private Equity and Real Estate in their peer group analysis.
Estimated 2021 Total Costs
($ millions)
Total
Internal External Invest. % of
Mgmt. Mgmt. Division Total
Total Compensation 13.1 4.5 17.5 4.0%
Operating Budget less Compensation 8.5 2.1 10.6 2.4%
Manager Fees 406.3 406.3 91.9%
Custody 5.0 2.5 7.5 1.7%
Total Costs 26.5 415.5 442.0 100.0%
Percent of Total 0.1 0.9
Average 2020 Asset Size ($ Billions) 55.4 55.4 110.8
Costs in Basis Points 4.8 75.0 NA
Costs in Basis Points to Total Fund NA NA 39.8
OPERS 2021 INVESTMENT PLAN Page 22POLICIES, COMMITTEES, AND RESOURCES
Peer Group Comparison
The following chart compares the OPERS asset size and Investments Staff to its peer group
as of June 30, 2020.
The following table lists the public pension peer group referenced in the chart.
Public Plan Peer Group (as of 6/30/2020)
Asset Size Investment Asset Size per
Peers ($ millions) Staff Investment Staff
California Public Employees' Retirement System $389,000 193 $2,016
California State Teachers' Retirement System $246,000 154 $1,597
State Board of Administration of Florida $160,700 60 $2,678
State of Wisconsin Investment Board $122,250 82 $1,491
New York State Teachers' Retirement System $120,500 46 $2,620
Washington State Investment Board $111,580 48 $2,325
North Carolina Retirement System $103,900 18 $5,772
Ohio Public Employees Retirement System $98,000 64 $1,531
New Jersey Division of Investment $76,630 29 $2,642
Ohio State Teachers Retirement System $77,000 91 $846
Average $150,556 79 $2,352
Source: PFDE (Pension Fund Data Exchange), OPERS
*Staffing data sourced from PFDE is as of 06/30/2020
OPERS 2021 INVESTMENT PLAN Page 23APPENDIX
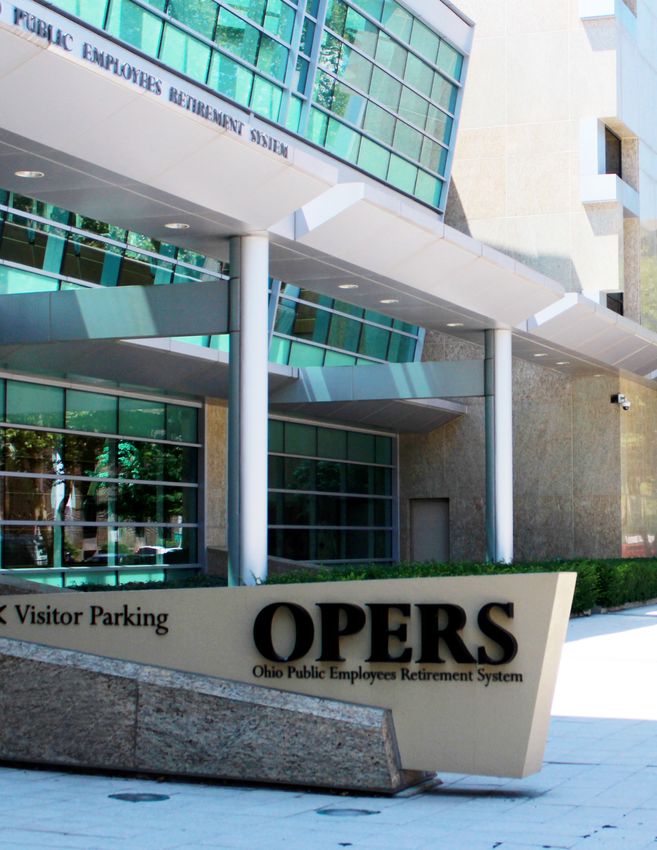
Investments - Organizational Structure
Paul Greff
CIO
Deanne Mannion
Deputy CIO
Private Alternatives Quantitative Research Fund Management Risk Management Fixed Income Internal Global Equity Equity Trading External Management Cash/ Sec Lending
Cheri Woolsey JG Lee Prabu Kumaran Dan German Mark Ehresman Erick Weis Joan Stack Vacant Jerry May
Sr. Portfolio Manager Quantitative Manager Fund Manager (Lead) Investment Risk Officer Sr. Portfolio Manager Sr. Portfolio Manager Head Trader Sr. Portfolio Manager Sr. Portfolio Manager
Alternatives Quantitative Research Fund Management Risk Management Fixed Income Internal Global Equity Equity Trading External Management Cash/Securities Lending
OPERS 2021 INVESTMENT PLAN
Hunter Graham James Richardson Craig Carroll Elizabeth Homeier Chris Rieddle Vacant Matt Sherman Ryan Casebolt Teresa Black
Assoc. Investment Analyst Assoc. Investment Analyst Investment Analyst Sr. Op Investment Analyst Portfolio Manager Sr. Portfolio Manager Sr. Trader Asst. Portfolio Manager Sr. Investment Analyst
Alternatives Quantitative Research Fund Management Risk Management Fixed Income Internal Global Equity Equity Trading External Management Cash/Securities Lending
Tana Haddix Anthony Bader Jack Lake Todd Soots Avijit Barua Vacant Lincoln Carnam Greg Corcoran
Portfolio Assistant Investment Analyst Sr. Investment Analyst Portfolio Manager Asst. Portfolio Manager Sr. Trader Sr. Investment Analyst Investment Analyst
Alternatives Fund Management Risk Management Fixed Income Internal Global Equity Equity Trading External Management Cash/Securities Lending
Michael Lotko
Brad Sturm Vacant Michelle Lewis Nick Kotsonis Amit Sanyal Lori Davie Michael Trotta
Assoc. Investment
Portfolio Manager (Lead) Assoc. Investment Analyst Sr. Investment Analyst Sr. Inv Analyst/ Economist Asst. Portfolio Manager Trader II Investment Analyst
Analyst
Real Estate Fund Management Risk Management Fixed Income Internal Global Equity Equity Trading External Management
Cash/Securities Lending
Stephen Stuckwisch Anisha Augustine Sean McCarthy Zach Zerman Jeff Golden John Blue
Portfolio Manager Assoc. Investment Analyst Assoc. Investment Analyst Investment Analyst Asst. Portfolio Manager Portfolio Manager (Lead)
Real Estate Fund Management Risk Management Fixed Income Internal Global Equity External Management
AJ Sayers Dave Dury Roger Tong Ryan O' Connor
Sr. Investment Analyst Investment Analyst Sr. Investment Analyst Investment Analyst
Real Estate Fixed Income Internal Global Equity External Management
POLICIES, COMMITTEES, AND RESOURCES
Anthony Tanner RJ Cruz Chad Hamberg Noumouke Berete
Portfolio Manager (Lead) Portfolio Manager Investment Analyst Investment Analyst
Private Equity High Yield Internal Global Equity External Management
Lewis Tracy David Buchholz Erik Cagnina Chiao Wang
Portfolio Manager Asst. Porfolio Manager Portfolio Manager (Lead) Investment Analyst
Private Equity High Yield Fixed Income Internal Global Equity
RJ Visser David Xia Sangwoo Park Vacant
Investment Analyst Sr. Investment Analyst Portfolio Manager Sr. Investment Analyst
Private Equity High Yield Fixed Income Internal Global Equity
Diego Gil Aron Lau Vacant
Investment Analyst Investment Analyst Assoc. Investment Analyst
High Yield Fixed Income Internal Global Equity
Zach Martin Tony Enderle
Assoc. Investment Analyst Trading Manager
High Yield Fixed Income
JoAnn Yocum
Investment Assistant
Fixed Income
Page 24
As of date - 12/31/2020You can also read