Applied Energy - waste2grids-project
←
→
Page content transcription
If your browser does not render page correctly, please read the page content below
Applied Energy 290 (2021) 116700
Contents lists available at ScienceDirect
Applied Energy
journal homepage: www.elsevier.com/locate/apenergy
Reversible solid-oxide cell stack based power-to-x-to-power systems:
Economic potential evaluated via plant capital-cost target
Yumeng Zhang a, b, Ningling Wang b, Xiaofeng Tong a, Liqiang Duan b, Tzu-En Lin c,
François Maréchal d, Jan Van herle e, Ligang Wang a, f, *, Yongping Yang f, *
a
Innovation Research Institute of Energy and Power, North China Electric Power University, Beijing, China
b
National Research Center for Thermal Power Engineering and Technology, North China Electric Power University, Beijing, China
c
Institute of Biomedical Engineering, National Chiao Tung University, China
d
Industrial Process and Energy Systems Engineering, Swiss Federal Institute of Technology in Lausanne, Sion, Switzerland
e
Group of Energy Materials, Swiss Federal Institute of Technology in Lausanne, Sion, Switzerland
f
Key Laboratory of Power Station Energy Transfer Conversion and System (North China Electric Power University), Ministry of Education, China
H I G H L I G H T S
• A decomposition-based method for optimally deploying dual-direction solid-oxide stack-based plants.
• Economic feasibility evaluated for the plant concepts enabled by H2, CH4, CH3OH, syngas and NH3.
• Plant CAPEX target representing economic feasibility evaluated for multiple scenarios.
• By reducing onsite storage via the market, economic feasibility ranked as H2 > syngas > CH4 > CH3OH > NH3.
• With no chemical sale, hydrogen, methanol and ammonia pathways no longer economically feasible.
A R T I C L E I N F O A B S T R A C T
Keywords: Electrical energy storage systems are indispensable for the electrical grid with high penetration renewables.
Reversible solid-oxide technology Reversible solid-oxide cell stack based power-to-x-to-power systems, which can switch between power genera
Power-to-x-to-power tion and power storage, can achieve a high round-trip efficiency and are technology neutral for, e.g., hydrogen,
Grid balancing
methane, methanol, ammonia and syngas. This paper evaluates, with a systematically decomposition-based
Economic feasibility
Plant CAPEX target
optimization method, the economic feasibility of such dual-direction plants to assist wind farms for reliable
electricity supply, under various scenarios with 150%/200%/250% wind electricity penetration and strong/
weak interactions with chemical markets. The economic feasibility is represented by Plant CAPEX Target (€/ref-
stack), defined as maximum affordable total plant investment costs divided by the equivalent number of refer
ence stacks (5120 cm2 active cell area). The results show that, with strong interaction with chemical markets,
hydrogen pathway is the most economically potential, especially under high wind electricity penetration (200,
250%). Plant CAPEX target of hydrogen pathway reaches 2300 €/ref-stack, followed by syngas (1900 €/ref-
stack), while the methane, methanol and ammonia ones are less economically-feasible with targets around 1000
€/ref-stack. Economic feasibility of hydrogen pathway is less sensitive (above 2000 €/ref-stack) to hydrogen
price when it is below 4 €/kg. Deploying multiple plants with operation-coordination freedom allows for the
reduction of lost wind rate and the enhancement of profit. Plant designs with either high round-trip efficiency or
good match with imbalance characteristics are preferred. When the chemicals produced are not sold to markets,
syngas and methane pathways are more economically-feasible, with plant CAPEX target within 500–1000 €/ref-
stack due to affordable onsite fuel storage and high round-trip efficiency.
* Corresponding authors at: North China Electric Power University, China.
E-mail addresses: ligang.wang@ncepu.edu.cn (L. Wang), yyp@ncepu.edu.cn (Y. Yang).
https://doi.org/10.1016/j.apenergy.2021.116700
Received 6 November 2020; Received in revised form 13 February 2021; Accepted 18 February 2021
0306-2619/© 2021 The Authors. Published by Elsevier Ltd. This is an open access article under the CC BY-NC-ND license
(http://creativecommons.org/licenses/by-nc-nd/4.0/).
Y. Zhang et al. Applied Energy 290 (2021) 116700
Nomenclature n discount rate
S Status of plant selection
Abbreviations t startup/shut down time
CAPEX capital expenditures TD the number of typical days
ESS energy storage system Y plant status
LHV lower heat value Z plant start-up status
PowGen power generation τ plant lifespan
PowSto power storage α repetition times
PXP power-to-x-to-power θ price
Ref-stack reference stack
RT round-trip Subscripts/Superscripts
RSOC reversible solid-oxide cell af available factor
c index of chemical
Mathematical symbols chem chemical
Cap capacity con consumption
ND the number of designs curt curtailed power
F flow d index of plant design
f sizing factor D design
j index of year elec electricity
k stable power generation/storage level i index of hours
L tank level imb imbalance
m tank capacity pro production
N number of selected reversible solid-oxide cell plant rd ramp down
P power ru ramp up
R revenue/cost td index of typical day
r ramp up/down rate u index of plant
1. Introduction unitized low-temperature fuel cells may be hindered mainly by (1) CO2
poisoning or imperfect membrane [9], (2) low lifetime when coupling
The vigorous developed renewable energies can contribute signifi with intermittent renewables with frequently switching between fuel
cantly to energy sustainability and environmental protection; however, cell and electrolysis [10], (3) expensive cell components due to noble
it also leads to grid instability due to, e.g., power quality issues [1]. High metal catalysts, gas diffusion layer, and (4) low round-trip (RT) effi
penetration of renewables is expected to be better addressed by ciency (40%–50% based on lower heat value, LHV) [11]. Instead, a
employing energy storage systems (ESSs), which reduce the imbalance reversible solid oxide fuel cell (RSOC) can potentially (1) reduce the
between power generation and demand via storing excess or unexpected electrolysis-induced degradation to realize a prolonged lifespan [12],
power and releasing it when needed [2]. The energy-storage demand (2) reach low capital investment costs due to no use of precious and
worldwide will hit 266 GW [3] in 2030 (compared to 183 GW in 2019) expensive metal catalysts [13], and (3) achieve high RT efficiency of
to meet the target of 45% power generated from renewables [4]. 55%–70% (LHV) [14]. Thus, the RSOC based PXP systems are attractive
However, the deployment of mature storage technologies, e.g., pump to cope with the imbalance between power generation and demand.
hydro storage and compressed air storage, suffers from either the limited There have been several applications of the hydrogen and methane
geological sites or high exergy-destruction and losses. Thus, other po based PXP systems. For example, a grid-connected RSOC system with 50
tential energy storage technologies are currently actively explored. The kW in power generation (PowGen) mode and 120 kW in power storage
lithium-ion battery is predicted to be dominating with a contribution of (PowSto) mode has been employed for the stabilization of a microgrid
150 GW in 2030 [5] due to its high energy density and round-trip effi by Sunfire and Boeing [15] with the interactions among multi-market
ciency (70%–80%) [6]. However, it is not capable of meeting the need segments including hydrogen production, energy storage and grid
for long-term electricity storage. Hydrogen-based energy storage is balancing. The system was successfully operated with micro-grid
another promising alternative by storing electric energy to chemical connection for over 1000 h although experiencing several abrupt shut
energy for short- or long-term storage. For example, over 20% of Danish downs. Sunfire also installed an RSOC plant prototype in Salzgitter to
electricity will be converted to hydrogen or hydrogen-based fuels produce hydrogen for iron-and-steel works when renewable electricity is
(power-to-x) after building a 10 GW offshore wind plant for a 70% CO2 sufficient or to supply power when the electricity price is high [16]. An
reduction target in 2030 [7]. The increased use of hydrogen or RT efficiency of 50% (LHV) was achieved under steady-state, full-load
hydrogen-based fuels enables the decarbonization of portable, trans operation [16]. By storing water–vapor containing gas mixture rather
portation and stationary sectors. than condensed water separately to reduce the heat required for steam
Renewable power can be converted to hydrogen via electrolysis, generation for electrolysis, a 100 kW-scale RSOC methane-based system
while in turn, the hydrogen stored can be converted to electricity via fuel can achieve an RT efficiency of nearly 74% [23]. Even with 15% of rated
cell. This whole energy storage and release process chain can be called as capacity, an RT efficiency of 44% is still viable [17].
a power-to-x-to-power (PXP) system. Compared with conventional PXP The large-scale deployment of RSOC-based dual-direction plants is
systems using separate fuel cell and electrolyzer, the unitized fuel cells, currently limited by economic feasibility. The installed capital expen
which can switch between fuel cell mode and electrolysis mode by one ditures (CAPEX) of an RSOC-based dual-direction system converted
single stack, could potentially reduce the capital cost due to enhanced from Ref. [18] is 1850 $/ref-stack with the reference stack defined as the
annual utilization hours [8,9]. State-of-the-art unitized fuel cells mainly electrode-supported cell stack with an active cell area of 5120 cm2. The
include unitized regenerative alkaline fuel cell, unitized proton ex levelized cost of energy with 5694-hour annual operation is estimated to
change membrane fuel cell, and reversible solid oxide fuel cell. The be 20 ¢/kWh without coupling with a real application, i.e., operating at
2
Y. Zhang et al. Applied Energy 290 (2021) 116700
rated power and storage [17], which is almost double of that of pumped optimal deployment methodology to identify potential business cases of
hydro energy storage [19]. When reducing the CAPEX down to 1200 RSOC based energy storage system is described in Section 3. Section 4
$/ref-stack (5120 cm2/ref-stack), the levelized energy cost with 5694- describes the application of coping RSOC with renewables in detail with
hour annual operation can be decreased to 11 ¢/kWh [17], reaching the specifications and assumptions. The economic feasibility is further
the level of pumped hydro technology. Thus, the CAPEX of the RSOC- discussed comprehensively in Section 5 to draw the conclusions in
based system needs to be reduced for commercial applications Section 6.
[20,18], for which varying the plant design (energy efficiency and
density) is helpful [21,22]. There are trade-offs between efficiency, gas 2. Concept and design pool of dual-direction RSOC plant
storage sizes and CAPEX [23], thus the maximum RT efficiency differs
from the lowest CAPEX system due to large intermediate gas storage 2.1. Concept of dual-direction plant
tanks [24,25]. For the plants with the same stack size, there can be a
number of plant design alternatives realizing different capacity (energy Five power-to-x-to-power process chains enabled by different
density) and efficiency for power generation, power storage and gas chemicals (hydrogen, ammonia, syngas, methane, and methanol) were
storage [25]. With a set of plant designs, the optimal plant size (and studied and compared in Ref. [25]:
CAPEX) to cope with a specific power imbalance profile might vary
significantly [26]. 1. Hydrogen pathway via steam electrolysis: power-to-hydrogen-to-
There were only limited studies on the economic feasibility of power
coupling RSOC plants with renewables. The payback time of a hydrogen- 2. Ammonia pathway via steam electrolysis: power-to-ammonia-to-
based RSOC system was concluded to be close to the stack lifespan when power
the plant worked with an average of 50% load factor [27], and became 3. Syngas pathway via co-electrolysis of steam and carbon dioxide
even worse when considering start-up and part-load operation [27,28]. (CO2): power-to-syngas-to-power
The literature has not identified, in a sufficient manner, the economic 4. Methane pathway via steam electrolysis: power-to-hydrogen-to-
feasibility of such RSOC-based plants, since they dissevered the optimal methane-to-power
RSOC plant design and system deployment under a fixed plant size 5. Methanol pathway via stem electrolysis: power-to-hydrogen-to-
[29,30], or optimized plant size with a limited number of design alter methanol-to-power
natives [28,29]. Only one single plant was considered in the literature
without considering the coordinative operation of multiple plants The dual-direction plants can switch between PowGen and PowSto
installed with varied thermodynamic performances and different plant modes with the aid of intermediate storage tanks, as illustrated in Fig. 1.
sizes to better address the imbalance profiles. Moreover, the literature In the PowGen mode, fuels are electrochemically oxidized by pure ox
only investigated the economic feasibility of the hydrogen and methane ygen to produce electricity with the exhaust gas (CO2 or N2) stored in
based RSOC plants, while those realized by other chemicals, e.g., exhaust tanks. In the PowSto mode, the steam is electrolyzed to
methanol, ammonia and syngas, have never been investigated. hydrogen, which may be further converted to chemical products for the
The objective of this work is to investigate, in a comprehensive PowGen mode. The management of mass storage tanks for the contin
manner, the economic feasibility of RSOC dual-direction plants uous operation depends on practical applications. When evaluating the
combining both technological and application viewpoints. The system thermodynamic performance, the power consumed to pressurize
maximum affordable plant CAPEX is evaluated by considering (1) a the chemicals for storage is considered. The pressures of chemicals
number of plant concepts (process chains) realized by different chem storage tanks are referred to Ref. [25].
icals, (2) a number of plant design alternatives, (3) optimal plant sizing
and scheduling with different plant designs, (4) a number of application 2.2. Design pool of dual-direction plant
scenarios, and (5) sensitivity analysis of key influential factors. This
paper is a follow-up of our previous study [25], which proposed a The design pool of this dual-direction RSOC plant concept has been
decomposition-based two-step optimization method for the optimal generated in our previous study [25], which contains a set of optimal
deployment of RSOC plants and investigated thermodynamic perfor design alternatives for different process chains. Design candidates were
mances of the RSOC process chains based on hydrogen, methane, generated at first by (1) varying the key operating variables of the stack
methanol, syngas and ammonia, thus creating an application-free pool as well as chemical reactors of different processes, and (2) optimizing
of optimal plant designs for each process chain. The two-step optimi the heat cascade utilization. Then, the optimal design alternatives were
zation method proposed before is further enhanced and put into practice evaluated for multiple objective functions including the round-trip ef
in this paper. ficiency and power densities of both modes. The optimal plant designs in
The remaining paper is organized as follows: In Section 2, the RSOC the pool represent the trade-offs between the three objectives, thus with
based energy storage system is introduced with the description of dual- the same size of stacks, the plant can interact with the grid and market at
direction RSOC plant concept and design pool. Then, the extended different capacities.
O2
storage
Excess Pressure
renewable changer
power Chemical
PowSto PowGen
product
(power-to-x) (x-to-power) Electricity
Storage
Water CO2 or N2 Water
storage
PowSto boundary PowGen boundary
Fig. 1. The general schematic and system boundaries of the dual-direction RSOC plant [25].
3Y. Zhang et al. Applied Energy 290 (2021) 116700
a b
Optimal plant New application Pool of optimal New application
design plant design
Grid imbalance profile
Trade-off
designs • Power generation
• Power demand
Optimal matching with
Pool of optimal
multiple plants
plant designs Optimal matching: Unit commitment model
Optimal design Plant
• Obj: Profit
selection, plant sizing number
Pre-selected designs with Thermodynamic • Constraints:
and scheduling
thermodynamic performances PowGen/PowSto capacity
performances Minimum UP/DOWN time
Ramp UP/DOWN rate
Storage level
Target CAPEX identified for the plants Optimal deployment under multiple plants
employed Plant design selected
Plant size
Plants schedule
Optimal solutions for the plant deployment Plant CAPEX Target
Fig. 2. Optimal deployment of the RSOC plants for specific applications: (a) the decomposition-based two-step optimization method proposed in Ref. [25], (b) the
extended optimal deployment methodology of multiple plants.
3. Method of economic feasibility evaluation 3.2.1. Objective function
The profit of RSOC based energy storage systems obtained in l years,
3.1. Extended optimal deployment methodology to identify potential as given in Eq. (2), is affected by (1) the revenue from increased elec
business cases td,i ) due to the accommodation of additional renewable
tricity sale (Relec
energy, (2) the revenue from reduced imbalance costs (Rimb
td,i ), (3) addi
The decomposition-based two-step optimal deployment method
tional revenue (positive) or cost (negative) of chemical trade with the
originally proposed by the authors (Fig. 2(a)) is further extended as
market (Rchem
td,i ), (4) the costs of chemical storage tank (R
tank
), and (5) the
shown in Fig. 2(b) to assist the identification of potential business cases.
By optimal matching the plant design for specific applications, the plant startup cost (Rstart
td,i ):
imbalance can be best handled by the coordination of multiple RSOC-
∑
l ∑
TD
based plants. The profits from imbalance handling and chemical trade Profit(l) =
are maximized by proper sizing and scheduling of different plants with j=1 td=1
[ ]
varied plant designs and sizes. The optimal scheduling considers the 24 αtd (R
elec elec,0 imb,0 imb chem start
∑ td,i − Rtd,i )+(Rtd,i − Rtd,i ) + Rtd,i − Rtd,i
PowGen/PowSto capacity limits, ramp up/down rates, start-up/ × − Rtank
shutdown times, and the storage level of chemical tanks. The solving i=1 (1 + n)l
of the optimal matching problem under multiple plants results in (1) (2)
specific plant designs selected, (2) optimal sizes of each plant and
chemical tank, and (3) optimal scheduling of each plant employed. where the payback years l should be shorter than the stack lifespan τ, TD
Then, the economic indicator, Plant CAPEX Target (€/ref-stack) in is the number of typical days td representing long-term historical data
payback time l years, defined as the maximum affordable total plant [37], αtd is the repetition times of each typical day in an entire year, i
investment costs divided by the equivalent number of reference stacks represents the hours (1–24 h) in each typical day, n is the discount rate
(ref-stack, each with 5120 cm2 active cell area), can be calculated: (0.05).
The revenue of electricity sale (€/year) can be calculated as:
Maximum profit over the lifetime (l)
Plant CAPEX target (l) = (1)
Total number of reference stacks of all plants installed
Relec
td,i = θ
elec
(Pload imb
td,i − Ptd,i ) (3)
3.2. Formulations of optimal design selection, plant sizing and scheduling where θ elec
(€/MWh) is the electricity price, the Pload
td,i (MW) is load
td,i (MW) rep
demand in the time step i of the typical day td, and the Pimb
The profit of the RSOC based energy storage system is derived with a resents the part that imbalanced.
base case where no RSOC plant is installed. The investment and O&M The imbalance costs Rimb
td,i can be calculated by using the imbalance
costs of the renewable power plants themselves are not considered in all
power and the imbalance price (θimb , €/MWh):
cases since these costs remain the same.
4Y. Zhang et al. Applied Energy 290 (2021) 116700
Rimb imb imb
td,i = Ptd,i θ (4) (CapPowGen,D
d ) and a sizing factor fd :
The revenue from chemical trade Rchem
td,i is calculated as the chemical CapPowGen
d = fd CapPowGen,D
d (12)
sale income minus chemical purchase costs:
Therefore, the actual plant employed is sized from the preselected
∑
Rchem (θout out in in
(5) design by a factor of fd . The power output of the RSOC-based plant
td,i = c Fc,td,i − θc Fc,td,i )
c should be over the stable generation level kPowGen
d if committed:
where the Fc,td,i
out
(kg/h) represents the outflow of chemical c from PPowGen
d,td,i ≥ kdPowGen Yd,td,i
PowGen
CapPowGen
d (13)
chemical storage tanks to the market at typical day td, time step i; The plant power output at the time (td, i) is also related to that in the
Oppositely, the Fc,td,i
in
(kg/h) represents the inflow of chemical c. The θout
c previous hour (td, i − 1) and the ramp-up/down rates (rdru,PowGen ,rdrd,PowGen )
and θin
c (€/kg) are the prices of chemical sale and chemical purchase to settle down on another steady state:
respectively.
(14)
PowGen
The startup costs Rstart
td,i (€) of the plant are considerable: Around 1.3
ru,PowGen
PPowGen
d,td,i − PPowGen
d,td,i− 1 ≤ rd Capd
kWh of energy is needed for the cold-start of a 1 kW stack [31]. The
startup costs are evaluated by the related energy costs: (15)
PowGen
PPowGen PowGen
d,td,i− 1 − Pd,td,i ≤ rdrd,PowGen Capd
∑
ND
Rstart
td,i = 1.3θelec fd CapPowGen,D
d Zd,td,i (6) 3.2.2.3. Power storage constraints. Similar to the power generation
d
constraints, the actual power storage (PPowSto
d,td,i , MW) is limited by the
where d represents the RSOC plant design with a given size in the design capacity(CapPowSto
d , MW) and stable level kPowSto
d (–):
pool, with PowGen capacity CapPowGen,D
(MW), fd (-) is the sizing factor
d PPowSto PowSto PowSto
(16)
d,td,i ≤ Ud,td,i Capd
of design d referring to the given size. The binary variable Zd,td,i repre
sents the plant start-up status: PPowSto PowSto PowSto
Yd,td,i CapPowSto (17)
d,td,i ≥ kd d
Zd,td,i ≥ PowGen
(Yd,td,i + PowSto
Yd,td,i )− PowGen
(Yd,td,i− + PowSto
Yd,td,i− 1) (7)
1
The PowSto capacity CapPowSto
d (MW) of actual RSOC plant is calcu
lated by PowSto capacity of the plant design (CapPowSto,D , MW) and the
where, the binary variables Yd,td,i
PowGen
and Yd,td,i
PowSto
represent the status of d
sizing factor fd
PowGen mode and PowSto mode, respectively.
The costs of chemical storage tanks Rtank (€) is calculated by the tank CapPowSto
d = CapPowSto,D
d fd (18)
capacity mc (kg) and the tank price θtank (€/kg) of chemical c:
c The power charging to the RSOC plants is limited by the ramp-up/
∑
tank
R = tank
θc mc (8) down rates:
c
PPowSto PowSto PowSto ru,PowSto
d,td,i − Pd,td,i− 1 ≤ Capd rd (19)
3.2.2. Constraints
(20)
rd,PowSto
PPowSto PowSto PowSto
d,td,i− 1 − Pd,td,i ≤ Capd rd
3.2.2.1. Power balance constraints. The main constraint is the sup The storage level Lc,td,i (kg) of a chemical storage tank is limited by
ply–demand balance. For each time step (td, i), the load demand Pload
td,i the tank capacity mc (kg):
(MW) is to be met by the power generation of the PowGen mode PPowGen
u,td,i
Lg,td,i ≤ mc (21)
(MW). However, when the demand cannot be fully met, there exits an
imbalanced power Pimb
td,i (MW). If there is excess electricity, it will be first
The storage level Lc,td,i in time (td, i) is related to that in the previous
stored by the power consumed of the PowSto mode PPowSto hour (td, i − 1), the chemical produced/consumed by the RSOC plants
d,td,i (MW), while
(Fd,c,td,i
pro
/Fd,c,td,i
con
, kg/h) and traded with the market (Fc,td,i in
/Fc,td,i
out
, kg/h):
the part beyond the PowSto capacity will be curtailed (Pcurt
td,i , MW). Thus,
∑ pro
the supply–demand balance is expressed as below: Lc,td,i = Lc,td,i− 1 + con
(Fd,c,td,i − Fd,c,td,i in
) + Fc,td,i out
− Fc,td,i (22)
∑ ∑ d
Pload imb
td,i − Ptd,i = PPowGen
u,td,i − PPowSto curt
d,td,i − Ptd,i (9)
u d The chemical production/consumption is correlated to the power
generation and storage (PPowGen
d,td,i , Pd,td,i ) of the RSOC plant:
PowSto
where the set u represents renewable power plants and the RSOC-based
plants, d⊆u. For off-grid applications or power systems with reliability PowGen,pro,D
Fd,c PowSto,pro,D
Fd,c
pro
Fd,c,td,i = PPowGen + PPowSto (23)
requirement, the supply–demand imbalance is strictly not allowed: d,td,i
CapPowGen,D
d,td,i
CapPowSto,D
d d
Pimb
td,i = 0 (10) PowGen,con,D PowSto,con.D
Fd,c Fd,c
con
Fd,c,td,i = PPowGen
d,td,i + PPowSto
d,td,i (24)
CapPowGen,D CapPowSto,D
3.2.2.2. Power generation constraints. The power generation of the d d
employed plants at each time is limited by its power capacity:
where Fd,c
PowGen,pro,D
and Fd,c
PowSto,pro,D
are the production of chemical c from
PPowGen
u,td,i
af
≤ fu,td,i PowGen
Yu,td,i CapPowGen
u (11) the plant design d in PowGen and PowSto modes, while Fd,c
PowGen,con,D
and
Fd,c
PowSto,con,D
are the consumption of chemical c in both modes.
where the available factor fu,td,i
af
(%) is used to define the maximum time-
The optimization is carried out with the aid of typical days to reduce
dependent power generation level of renewable power plants, which
the computational efforts. The scheduling of the plants on each typical
depends on wind or solar conditions. It is one for the RSOC-based dual-
day is independent. Thus, the storage levels in the first and the last hour
direction plants.
in each typical day are set to be equal for continuous operation of the
The PowGen capacity CapPowGen (MW) of the actual RSOC plant
d storage tanks:
employed plant design d is calculated by the design PowGen capacity
5Y. Zhang et al. Applied Energy 290 (2021) 116700
Lc,td,i=1 = Lc,td,i=24 (25) with the market, thus the onsite storage tanks will be large to allow for
continuous switch between two modes.
The number (N) of the RSOC-based plants employed is specified by
The electrical grid of the application transmits 300 GWh electricity
the summation of binary variables Sd , which represents whether the
per year with data available from 01.01.2018 to 31.12.2018 on an
plant design d is selected or not:
hourly basis. The 16 MW wind power plant installed supplies 33 GWh
PowGen
Sd ≥ Yd,td,i PowSto
+ Yd,td,i (26) electricity in 2010. To find the prerequisites for potential business cases,
the wind power capacity is scaled up to 165 MW and 220 MW, corre
∑
Sd = N (27) sponding to a wind electricity penetration of 150% and 200%, which is
d defined as the annual wind electricity generated divided by the gross
annual electricity demand. The hourly profiles of power demand and
3.2.2.4. Minimum up and down time. Several components of the RSOC wind power (365 days, 8760 values) are clustered into 8 typical days
based plant operate at a high temperature of over 600 ◦ C, thus the plant using the k-means developed in Ref. [33].
needs time (up to several hours) to start up and shut down [32]. This will
affect the plant’s interaction with the electrical grid. Thus, the startup 4.2. Design preselection from the design pool
and shutdown are considered by employing specified t su (h) and tsd (h):
su − 1
The design pool for each PXP process chain is pre-selected from the
∑
i+t
PowGen
Yd,td,ii ≥ tsu (Yd,td,i
PowGen PowGen
− Yd,td,i− (28) Pareto fronts obtained in our previous study [25]. Each design pool
1)
ii=i contains 31 RSOC plants, which are evenly selected from hundreds of
optimal designs generated. As an example, the design pool of hydrogen
based RSOC plants is shown in Fig. 4. The characteristics of the plant
su − 1
∑
i+t
PowSto
Yd,td,ii ≥ tsu (Yd,td,i
PowSto PowSto
− Yd,td,i− 1) (29)
ii=i
design used for optimal deployment include:
∑
i+t sd − 1 • Specific PowGen capacity: Net system electricity generation capacity,
PowGen
(1 − Yd,td,ii ) ≥ tsd (Yd,td,i−
PowGen PowGen
1 − Yd,td,i ) (30) kWe/ref-stack
ii
• Specific PowSto capacity: Total system electricity consumption ca
sd − 1
pacity, kWe/ref-stack
∑
i+t
• The system-level balance of the materials, i.e., CO2, O2 and the tar
PowSto
(1 − Yd,td,ii ) ≥ tsd (Yd,td,i−
PowSto PowSto
1 − Yd,td,i ) (31)
ii geted fuel/chemical, in kg/ref-stack
4. Application and specifications 4.3. Specifications and assumptions
4.1. Application description The economic parameters specified in the optimization are listed in
Table 1.
The application investigated as schematically shown in Fig. 3 is to
address the power imbalance related to a local power grid supporting 5. Results and discussion
Sicily, Sardinia and South of Italy. Major renewable energy involved is
from a wind farm. The RSOC-based dual-direction plants are expected to The scenario with strong interactions with the chemical markets,
serve as a power supplier to complement the power shortage by con whose economic feasibility is less affected by the sizes of chemical
verting fuels to electricity in the PowGen mode (red lines), or as a power storage tanks, is first discussed in Section 5.1. Then, the scenario with
consumer to store excess wind power in the PowSto mode (blue lines). weak interactions with the chemical markets is investigated in Section
This power system has reliability requirement i.e., all the load demand 5.2 for, e.g., remote applications.
should be satisfied (Eq. (10)). The chemical trade with the market is
managed to keep the continuous operation of fuel tanks with the
5.1. The scenario with strong interactions with the chemical market
enhancement of plant revenue. The interactions with the market are
defined at two levels: (a) strong or (b) weak. The former stands for an
5.1.1. Overview of the plant CAPEX target
easy access to the market, allowing for daily trades of chemicals and thus
By solving the optimization problem described in Section 3.2, the
a reduction of the tank sizes. The latter stands for a limited interaction
Plant CAPEX Target (€/ref-stack) for 5-year stack lifetime is calculated as
Fig. 3. Application description with either (a) strong or (b) weak interactions with the chemical market.
6Y. Zhang et al. Applied Energy 290 (2021) 116700
2.4 6
(a) (b)
PowGen cap., kWe/ref-stack
PowSto cap., kWe/ref-stack
2.1
4.5
1.8
1.5
3
1.2 Pareto fronts Pareto fronts
Design pool Design pool
0.9 1.5
35.5 40.5 45.5 35.5 40.5 45.5
RT eff., % RT eff., %
Fig. 4. Evenly selected plant designs (colored) for design pool from all optimal trade-off designs (grayed) generated in Ref. [25]: (a) RT efficiency vs PowGen
capacity per reference stack; (b) RT efficiency and PowSto capacity per reference stack.
Table 1
Parameters specifications.
Parameters Descriptions Units Values Ref.
Market prices O2 /θO2 /θO2
θout in tank O2 sell/buy/tank price €/kg 0.06/0.1/8 [34]
CO2 /θCO2 /θCO2
θout in tank CO2 sell/buy/tank price €/kg 0.12/0.2/6 [35]
CH4 /θCH4 /θCH4
θout in tank CH4 sell/buy/tank price €/kg 0.8/1.2/14 [36]
SYN /θSYN /θSYN
θout in tank SYN sell/buy/tank price €/kg 0.36/0.54/12
MeOH /θMeOH /θMeOH
θout in tank MeOH sell/buy/tank price €/kg 0.4/0.6/3 [34]
NH3 /θNH3 /θNH3
θout in tank NH3 sell/buy/tank price €/kg 0.4/0.7/15 [37]
N2 /θN2 /θN2
θout in tank N2 sell/buy/tank price €/kg 0.2/0.3/9
H2 /θH2 /θH2
θout in tank H2 sell/buy/tank price €/kg 2.7/4.0/200 [38,39]
θelec Electricity price €/MWh 40
θimb Imbalance price €/MWh 195 [38]
RSOC plant performance rru,PowGen /rru,PowSto Ramp up rate – 0.75 [40]
d d
rrd,PowGen /rrd,PowSto Ramp down rate – 0.75 [40]
d d
tsu /tsd Startup/ Shut down time h 4 [40]
kPowGen
d /kPowSto
d
PowGen/ PowSto stable level – 0.3 [40]
τ RSOC plants lifespan – 5 [41,42]
(a) Wind electricity penetration of 150% (b) Wind electricity penetration of 200%
Fig. 5. Plant CAPEX targets of different process chains under various scenarios with different renewable electricity penetration, different plant numbers from 1 to 5,
a stack lifetime of 5 years, and a payback time of 5 years. Integer-cut to obtain the sub-optimal solutions is performed 5 times for each process chain and scenario with
the highest plant CAPEX target highlighted by the symbols filled.
7Y. Zhang et al. Applied Energy 290 (2021) 116700
shown in Fig. 5 for each PXP process chain under various scenarios with revenue or the costs related to the gas purchase and plant startup
different plant numbers (1–5), different levels of renewable electricity occurring before reaching the set payback year. Here the results for the
penetration (150% and 200%). The RSOC plants should satisfy all the case with the highest economic feasibility in Fig. 5, i.e., hydrogen
power shortage due to the reliability requirement of the target appli pathway under 200% wind electricity penetration, is given in Fig. 6. In
cation (Eq. (10)). The stack lifetime is assumed to be 5 years, which is general, to reach a short payback time, the plant CAPEX target decreases
commonly viable for state-of-the-art technologies [41,42]. Overall, the significantly, indicating the strong need for reducing system CAPEX for
plant CAPEX target ranges widely under different scenarios and reaches high economic feasibility. For the hydrogen case, the plant CAPEX tar
up to 2000 €/ref-stack for the hydrogen pathway with 3 plants and gets are reduced almost linearly from 1400 to 2100 €/ref-stack for the
200% wind electricity penetration. However, the plant CAPEX target of payback time of 5 years to 900–1300 €/ref-stack for the payback time of
the ammonia pathway calculated can be even as low as 400 €/ref-stack 3 years. Additionally, the plant CAPEX needs to be below 300–400 €/ref-
under the scenario with a single plant and 150% wind electricity stack to pay back the investment within one year.
penetration. The methanol and ammonia process chains tend to have Considering the definition of plant CAPEX target (Eqs. (1) and (2)),
lower plant CAPEX target than those enabled by syngas, hydrogen, and the major influential factors causing the above observations are (1) the
methane, which indicates that the methanol and ammonia process plant sizes, representing the total number of reference stacks employed,
chains are with lower economic feasibility. (2) the lifetime income, (3) the lifetime operating costs, and (4) the
When the wind electricity penetration reaches 150% (Fig. 5(a)), the investment costs of the storage tanks. However, since the last factor
syngas-based plant concept achieves the highest plant CAPEX of presents a very limited effect when with strong interactions with the
1100–1900 €/ref-stack, followed by the methane and hydrogen based chemical markets, the first three factors are further discussed below to
plant concept 1000–1200 and 700–1200 €/ref-stack. The methanol- elaborate on the plant CAPEX target difference between different plant
based plants seem to be more difficult to be economically feasible concepts.
with the plant CAPEX target being 800–1000 €/ref-stack. The lowest
plant CAPEX target is still achieved by the ammonia process chain, 5.1.2. RSOC plant design selected
400–800 €/ref-stack. For each pathway with a specific plant number from one to five, five
For the scenarios with 200% wind electricity generation (Fig. 5(b)), deployment solutions (cases) with one optimal solution and four sub-
the hydrogen based plant concept shows the highest economic potential optimal solutions (cases) generated by integer-cut technique were ob
with the plant CAPEX target reaching up to 1400–2100 €/ref-stack, tained, thus there were 25 deployment solutions for each process chain,
much higher than that under 150% wind electricity penetration. The which deploy in total 75 plants. The plant-design repetition for the 75
syngas case gives a slightly decreased CAPEX target of 1100–1700 €/ref- plants deployed is shown in Fig. 7.
stack. A similar descending situation is also observed for the methane With the wind electricity penetration of 150%, the hydrogen-based
and methanol cases with the targets of 900–1100 €/ref-stack and process chain strongly prefers the designs with high RT efficiency, as
800–1000 €/ref-stack, respectively. With the increased penetration of shown in Fig. 7(a), and particularly, the design with the highest RT ef
renewable electricity, the economic feasibility of the ammonia pathway ficiency (45.2%) was selected in 21 cases, followed by the designs with
is slightly enhanced 700–1000 €/ref-stack. The difference of the plant the second and third highest RT efficiencies (45%, 44.5%) selected for
CAPEX target under the two levels of renewable electricity penetration 15 and 13 cases, respectively. The use frequency of these three most
is further investigated in Section 5.1.3. efficient designs accounts for over 65% of all 75 plants deployed in the
The number of the RSOC-based plants employed has a great influ 25 cases, while the designs with RT efficiency lower than 42% have
ence on the plant CAPEX target. With 150% renewable electricity never been chosen. Thus, the RT efficiency is the dominating factor for
penetration, the highest plant CAPEX target is achieved by two or three plant-design selection, while the PowGen and PowSto capacities are less
plants, while those with one (hydrogen, methanol, ammonia) or five important. The same situation is also observed for methane, methanol
(syngas, methane) plants show the worst economic feasibility, i.e., the and ammonia pathways. Particularly, for the methane pathway, only the
lowest CAPEX target. When increasing wind electricity penetration to ten designs with RT efficiency of over 45% were selected, and the most
200%, using a single plant is no longer the most unaffordable case, and efficient three designs appear 46 times out of all 75 plants deployed.
even becomes the most economically potential for syngas- or methane- For the syngas process chain (Fig. 7(b)), the design with the highest
based plants. PowSto capacity 8 kWe/ref-stack (system electricity consumption) is the
The plant CAPEX target is also evaluated for the scenarios with a most frequently selected (19 cases). Similarly, the designs with high RT
payback time of 1–4 years, which is affected by the tank costs incurred at efficiency are preferred, with those with the highest RT efficiencies
the first year and the sum of the reduced imbalance costs, additional (46.6% and 46.3%) selected in 16 and 14 cases. There is a special situ
ation that only occurs in the syngas pathway: The design with the
highest PowSto capacity but a lower RT efficiency has been selected for
19 cases. The features of this design are (1) the ratio of PowSto/PowGen
capacity, enabled by a large PowSto capacity and a small PowGen ca
pacity, better matches the imbalance profile, and (2) the PowSto effi
ciency is not the highest but still high (75%) due to the benefit of co-
24 24
(a) (b) Design with highest
Design selected times
Design selected times
18 18 PowSto cap.
12 12
6 6
0 0
36 38 40 42 44 46 37 39 41 43 45 47
RT eff., % RT eff., %
Fig. 6. Plant CAPEX target of the hydrogen process chain for the scenarios with Fig. 7. Selection of designs under 150% wind electricity penetration: (a)
payback time between 1 and 5 years and wind electricity penetration of 200%. Hydrogen based designs, (b) Syngas based designs.
8Y. Zhang et al. Applied Energy 290 (2021) 116700
electrolysis [25]. Therefore, with the same PowGen capacity, the plant sale of additional wind electricity accommodated (Relec ), i.e., 4.0 M€/
with this design could convert more electricity in the PowSto mode, thus year. The two income contributions Rimb and Relec remain the same under
reducing the wind power curtailment. The amount of the chemical different process chains and plant numbers, because all the positive
production of the PowSto mode is also affected by the PowSto efficiency. deviations, i.e., the electricity needs, are completely addressed by the
Therefore, the selection of this plant design is a result of the trade-off RSOC plants (Eq. (10)). Thus, with the same wind electricity penetra
between increased accommodation of wind power and reduced Pow tion, the variation of profit between different process chains and plant
Sto efficiency. numbers is only affected by the expenditures related to the chemical
Increasing wind electricity penetration to 200%, the selection of trade, and plant startup. It is found that the chemical produced from the
plant designs of different concepts has a similar preference as the sce PowSto mode is not enough to satisfy the need for the PowGen mode.
nario with wind electricity penetration of 150%, i.e., (1) the designs Overall, chemical purchase costs contribute to over 90% of annual
with the highest RT efficiency for the hydrogen, methane, methanol and operating costs. The syngas-based pathway realizes the lowest chemical
ammonia pathways, and (2) the designs with highest PowSto capacity or purchase costs (9.1–11.3 M€/year), resulting in the highest profit. The
high RT efficiency for the syngas pathway. chemical purchase costs of the methane and hydrogen process chains are
The designs selected in the cases with the highest plant CAPEX target in 12.5–14.0 and 14.2–17.8 M€/year, respectively. The ammonia
are illustrated in Fig. 8 with the average efficiency (Fig. 8(a)) and ca pathway has the highest chemical purchase costs 16.2–19.1 M€/year
pacity (Fig. 8(b)) of the plants deployed. The average efficiencies of the because of the lowest PowSto efficiency, resulting in the lowest profit.
selected designs are close for the two scenarios with different wind The startup costs contribute only 4–9% of the annual costs, 0.8–1.0 M€/
electricity penetration (150% and 200%), because only several designs year; while the storage tank costs account for only less than 1% due to
with high RT efficiency or the highest PowSto capacity (for only syngas the strong interactions with the chemical market.
pathway) are selected. The PowSto and PowGen efficiencies of the With the increase in wind electricity penetration from 150% to
selected designs are within 67% (ammonia) – 80% (syngas) and 55% 200%, the annual incomes are still contributed by the reduction of
(syngas) – 67% (methane). imbalance costs Rimb (15.1 M€/year, 83%) and the sale of additional
For the selected plant designs with high RT efficiency, the capacities electricity Relec (3.1 M€/year, 17%). Both incomes decrease since more
of both modes are limited due to the trade-off between efficiency and electricity demand can be satisfied by wind power in terms of both ca
capacity. For the scenarios with a wind electricity penetration of 150%, pacity and energy. The increased penetration of wind electricity could
the PowGen capacities of the selected designs are ranked as syngas (1.3 reduce the chemical purchase costs since more fuel could be produced
kWe/ref-stack) > hydrogen (1.2 kWe/ref-stack) > methanol (1.1 kWe/ from the PowSto mode due to increased excess electricity. The chemical
ref-stack) > ammonia ≈ methane (1 kWe/ref-stack), while the PowSto purchase costs of the hydrogen pathway drop sharply to 2.5–6.2 M€/
capacities are within 3.4 (methanol) – 4 kWe/ref-stack (ammonia). year because of saving large amount expensive hydrogen purchase,
Increasing the wind electricity penetration to 200%, the PowSto enabling it to become the most economically feasible. By using syngas,
capacity is increased to address the increased excess wind power by methane and methanol, the chemical purchase costs are decreased to
enhancing the proportion of plant designs with higher PowSto capacity, 3.6–6.5, 8.8–10.2 and 9.6–11.0 M€/year, respectively, while the de
ranging from 5.4 (hydrogen) – 4.3 kWe/ref-stack (ammonia). The creases in chemical purchase costs cannot compensate for the reduction
PowGen capacity is ranked as hydrogen (1.5 kWe/ref-stack) > syngas ≈ of income from Rimb and Relec , thus resulting in the reduced profit
methane (1.3 kWe/ref-stack) > ammonia (1.2 kWe/ref-stack) > meth compared with the scenarios with a wind power electricity penetration
anol (1 kWe/ref-stack). To meet all the power shortage, hydrogen-based of 150%. The chemical purchase costs of the ammonia pathway
plants have the smallest sizing factor, followed by syngas, methane and (8.7–11.2 M€/year) are still higher than those of other pathways, thus its
methanol. Ammonia-based RSOC plant has the highest sizing factor. profit remains the lowest.
The plant designs affect (1) the sizing factor, (2) energy conversion The chemical purchase costs of each process chain decrease with the
efficiencies, thus the chemical purchase costs and sale profits. The increased number of plants installed, as shown in Fig. 9. The increments
variation of chemical purchase costs with different wind electricity are at least 1 M€/year (the methane pathway for the wind electricity
penetrations and plant concepts is analyzed below. penetration of 150%) and even 4 M€/year (the hydrogen pathway for
the wind electricity penetration of 200%). The high chemical costs when
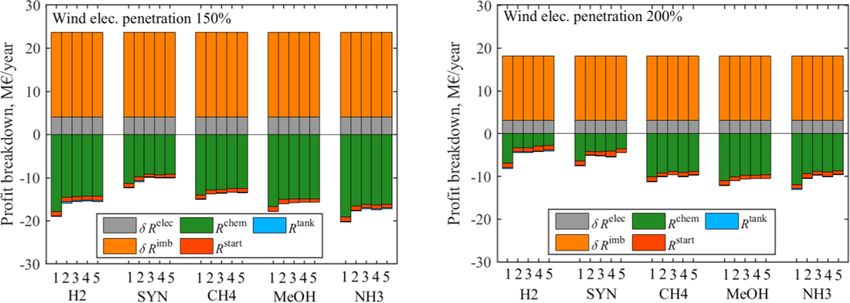
5.1.3. Profit breakdown using a single plant will be further investigated below.
The profit employed in Eqs. (1) and (2) is further broken down into Considering the definition in Eqs. (1) and (2), the variation of plant
income and cost contributions as illustrated in Fig. 9. For the case with CAPEX target under different plant concepts and wind electricity pen
150% wind electricity penetration in Fig. 9(a), the annual income (23.7 etrations as mentioned in Section 5.1 can be investigated based on (1)
M€/year) is mainly contributed by the reduction of imbalance costs the profit analyzed above and (2) the sizing factors analyzed in Section
(Rimb ), i.e., 19.6 M€/year, with the remaining 17% contributed by the 5.1.2. With wind electricity penetration of 150%, the syngas-based plant
85 5.6
150%
PowSto cap., kWe/ref-stack
SYN SYN H2
PowSto efficiency, %
80 5 200%
H2 CH4
75 4.4 MeOH
NH3 CH4
H2
70 MeOH 3.8 NH3
150% SYN
NH3 CH4
200% MeOH
65 3.2
50 60 70 0.8 1 1.2 1.4 1.6
PowGen efficiency, % PowGen cap., kWe/ref-stack
(a) Average PowGen and PowSto efficiency (b) Average specific PowGen and PowSto capacity
Fig. 8. Plant designs selected for the cases with the highest plant CAPEX targets: (a) average PowGen and PowSto efficiency, (b) average specific PowGen and
PowSto capacity.
9Y. Zhang et al. Applied Energy 290 (2021) 116700
(a) Wind electricity penetration of 150% (b) Wind electricity penetration of 200%
Fig. 9. Annual cost/profit breakdown of different process chains under different scenarios with various plant numbers and wind electricity penetration: (a) 150%,
(b) 200%.
has the highest profit and smallest sizing factor hence the largest plant plants. The PowSto capacity range is extended to 5–122 MW, reducing
CAPEX target, followed by methane, hydrogen and methanol. The the lost wind rate down to 0.5%. However, the lost wind rate cannot be
lowest plant CAPEX target in the ammonia process chain is caused by the further decreased by employing more plants. For example, when using 5
lowest profit and highest sizing factor. plants, the lost wind rate is still 0.5% due to the limit of PowSto stable
Increasing wind electricity penetration to 200%, the hydrogen pro level, thus the fuel costs and annual earning remain almost unchanged
cess chain has the highest profit and lowest sizing factor resulting in the (Fig. 9(a)). However, a capacity oversize is observed when employing 5
highest plant CAPEX target, followed by the syngas process chain. plants, which means that the annual full load operating load becomes
Methane, methanol and ammonia have a low profit while having high lower and the hardware is not fully utilized, leading to a reduced plant
sizing factors, leading to low plant CAPEX targets. CAPEX target (Fig. 5(a)), thus a lower economic feasibility. The in
fluences of the numbers of plant on plant CAPEX targets for the process
5.1.4. Dispatch chains enabled by methane, methanol and ammonia are similar to the
The maximum profit is gained by the optimal coordination of mul hydrogen pathway.
tiple plants and different modes. Starting from the case with a single For the syngas process chain, the case with one plant tends to allow
plant installed for the hydrogen pathway with wind electricity pene for a higher plant CAPEX target than the cases with multiple plants,
tration of 150% (Fig. 10), the plant capacity is 82 MW for the PowSto especially with higher wind electricity penetration (e.g., 200%) (Fig. 5
mode and 37.2 MW for the PowGen mode. The optimal PowGen ca (b)). The syngas process chain has high PowSto efficiency compared
pacity is higher than the maximum power shortage to satisfy the with other process chains due to the benefit of co-electrolysis as
application reliability requirement, i.e., all the load demand should be analyzed in Ref. [25]. The highest plant CAPEX target of the case with a
satisfied (Eq. (10)). The power storage is limited by the insufficient single plant is due to the smallest sizing factor.
PowSto capacity. After reaching the maximum power storage capacity,
additional wind power will be curtailed. For this example, 8.6% wind 5.1.5. Sensitivity analysis
power is lost, which is one factor leading to fuel purchase in the PowGen
mode, as mentioned in Section 5.1.3. This lost wind due to the (1) Hydrogen price
employment of a single plant could be solved by the coordination among
multiple plants. For example, for one case with 3 plants with 65 MW The case of hydrogen pathway with the highest plant CAPEX target is
PowSto/12 MW PowGen, 39 MW PowSto/18 MW PowGen and 18 MW further investigated with the most potential syngas-based case given as a
PowSto/8 MW PowGen, the excess wind electricity curtailed when using
a single plant is consumed by dispatching the operation of these three
2300
Wind elec. Penetration 200%
N=3
Ref-stack 5120 cm2
Plant CAPEX Target, €/ref-stack
50
Max deviation 37 MW 2100 Stack lifetime 5 years
Payback time 5 years
N=1
0 1900
Imbalance, MW
N=2
-50 Stable 24 MW N=4
1700
Capacity 82 MW
-100
H2 price: 4 €/kg SYN
P1 1500
Max deviation 110 MW Lost wind Plant number=2
N=5
Imbalance 1700 €/ref-stack
-150 1300
1 2 3 4 5 6 7 8 9 1 2 3 4 5 6 7 8
Typical days H2 purchase price, €/kg
Fig. 10. Dispatch of a single plant for the hydrogen pathway with wind elec Fig. 11. The effects of hydrogen purchase price on plant CAPEX target with the
tricity penetration of 150%. sale price set as 70% of the purchase price.
10Y. Zhang et al. Applied Energy 290 (2021) 116700
comparison. The variation of hydrogen purchase price (1–8 €/kg) is 2500
applied to the reference hydrogen-based case with a hydrogen price of 4
Plant CAPEX target, €/ref-stack
Ref-stack 5120 cm2
€/kg, a plant number of 3 and a wind electricity penetration of 200%. As 2000 Stack lifetime 5 years
shown in Fig. 11, with the hydrogen price rising from 1 to 8 €/kg, the Payback time 5 years
plant CAPEX target decreases from 2200 to 1400 €/ref-stack, due to (1)
the reduced plant profit caused by the increased costs of hydrogen (from 1500
1.5 to 4 M€/year) to allows for continuous operation of the PowGen
mode, and (2) the increased plant sizes to convert more wind power into 1000
hydrogen thus reducing the hydrogen purchase. When the hydrogen
price is over 7 €/kg, the hydrogen pathway becomes less economically 500
feasible than the syngas process.
150% 200% 250%
(2) Imbalance price and electricity price 0
H2 SYN CH4 MeOH NH3
The plant CAPEX target of the most potential case, i.e., three plants Fig. 13. The variation of plant CAPEX target for the three wind electricity
employed for the hydrogen pathway with wind electricity penetration of penetrations: 150%, 200% and 250%. The hydrogen price is set as 4 €/kg.
200%, is also evaluated with imbalance price of 195–300 €/MWh [38]
and electricity price of 20–100 €/MWh [43] as shown in Fig. 12. The
plant CAPEX target decreases at higher electricity or imbalance prices, 2500
Wind elec. Penetration 200%
Plant CAPEX target, €/ref-stack
indicating a high economic feasibility of the RSOC plants. The plant
2000 Ref-stack 5120 cm2
CAPEX target may reach 3400 €/ref-stack if the imbalance price is up to
300 €/MWh and electricity price reaches 100 €/MWh. While, if the
Stack lifetime 5 years
imbalance price is down to 195 €/MWh and the electricity price is 20 1500 Payback time 5 years
€/MWh, the profit from addressing the imbalance will be significantly
1000
reduced and leading to plant CAPEX target down to 1600 €/ref-stack.
500
(3) Wind electricity penetration
0 Strong
With the increase in wind electricity penetration up to 250%, the
Weak
plant CAPEX target of the hydrogen pathway can increase up to 2300 -500
€/ref-stack due to revenue from hydrogen sales, as shown in Fig. 13. The H2 SYN CH4 MeOH NH3
hydrogen pathway remains the most economic potential under high
wind power generation and with no big need for hydrogen storage. Fig. 14. Plant CAPEX targets under weak interactions with the chemical
However, for the syngas, methane and methanol pathways, the plant markets for the scenario with wind electricity penetration of 200%.
CAPEX targets reduce down to 1550, 1000 and 900 €/ref-stack, indi
cating reduced economic feasibility. This is due to that (1) the revenue 5.2. The scenario with weak interactions with the chemical market
from the chemical sale cannot compensate for the reduction of revenue
from addressing grid imbalance Rimb and increasing electricity sale Relec , The economic feasibility of RSOC plant under weak interactions with
thus resulting in reduced profit, and (2) the plant sizes is increased to the chemical markets is assessed for the scenario with a wind electricity
handle the increased excess wind power under a higher wind electricity penetration of 200%. The chemicals generated by the RSOC plant are
penetration. The plant CAPEX target of the ammonia process chain also not sold to the market but stored onsite, while the purchase of chemicals
increases with the increased penetration of wind electricity, but the is allowed if there is a lack of fuel to drive PowGen mode. Overall, the
enhancement remains limited. However, its CAPEX target is still over plant CAPEX targets of all pathways are reduced (Fig. 14), due to the
stringent which will not be advocated from the perspective of increased onsite storage sizes. The hydrogen pathway drops sharply to
economics. [− 300, 50] €/ref-stack and becomes not economically feasible any
more, because of expensive hydrogen storage (200 €/kg) and hydrogen
purchase costs (4 €/kg). The syngas and methane pathways perform
better with the increased onsite chemical storage, with their plant
CAPEX targets reaching 800–1000 and 500–800 €/ref-stack, respec
3600
Wind elec. Penetration 200% tively. The chemical purchase and storage costs are levelized to around
10 M€/year. The methanol and ammonia pathways, however, present
Plant CAPEX target, €/ref-stack
3300 Ref-stack 5120 cm2
Stack lifetime 5 years much higher chemical storage and purchase costs of around 14 and 17
3000 Payback time 5 years M€/year, which makes them not economically feasible as well repre
H2, N=3 sented by a plant CAPEX target of 200–400 and 0–100 €/ref-stack. This
2700 low plant CAPEX target also results from a higher lost wind rate because
(1) the design characteristics do not match well with the imbalance
2400
characteristics, and (2) the energy conversion efficiency is lower as
2100 analyzed in Section 5.1.2.
Electricity price
1800 20 40 60 6. Conclusions
80 100
1500
180 200 220 240 260 280 300 320 The economic feasibility of employing dual-direction reversible
solid-oxide cell stack based plants for addressing grid imbalance is
Imbalance price, €/MWh
evaluated via the Plant CAPEX Target (€/ref-stack), defined as the
Fig. 12. The effects of imbalance price and electricity price on plant maximum affordable plant investment cost, i.e., the maximum afford
CAPEX target. able total plant investment costs divided by the equivalent number of
11You can also read


