Liquefied Natural Gas Developments and Market Impacts A Report by Staff of the Market Intelligence Branch Division of Market Oversight U.S ...
←
→
Page content transcription
If your browser does not render page correctly, please read the page content below
Liquefied Natural Gas
                Developments and Market Impacts

    A Report by Staff of the Market Intelligence Branch
               Division of Market Oversight
       U.S. Commodity Futures Trading Commission

                                    May 2018

                                        DISCLAIMER
This is a report by staff of the U.S. Commodity Futures Trading Commission. Any views
 expressed in this report are solely the views of staff, and do not necessarily represent
             the position or views of any Commissioner or the Commission.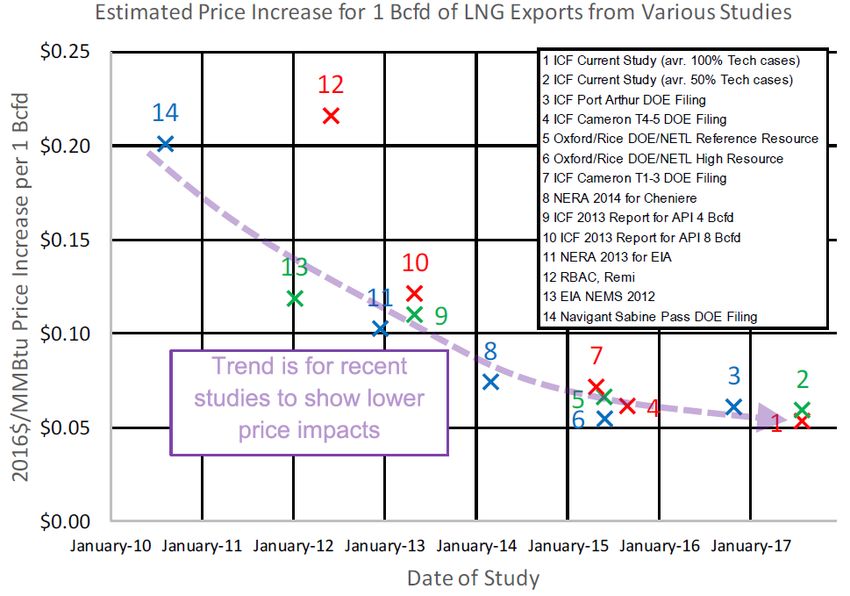
Table of Contents

Executive Summary.......................................................................................................... 1
I. Natural Gas and LNG Background .................................................................................. 3
          LNG Value Chain ................................................................................................... 4
II. Recent History of LNG in the U.S. ................................................................................. 5
III. Global Demand for Natural Gas and LNG ..................................................................... 6
IV. Natural Gas and U.S. LNG Exports ............................................................................... 7
          U.S. Liquefaction Plants ........................................................................................ 8
          U.S. LNG Exports ................................................................................................... 9
V. Changes in Global LNG Markets ................................................................................. 10
          Pricing Mechanism.............................................................................................. 10
          Contract Duration ............................................................................................... 11
VI. Potential Impact of LNG Exports on U.S. Natural Gas Markets ................................... 12
VII. Conclusions.............................................................................................................. 15
Appendices .................................................................................................................... 17
          1. Deloitte Center for Energy Solutions “LNG at the crossroads” Executive
          Summary© ......................................................................................................... 18
          2. BP Projects Global Natural Gas Supply Growth to Come Primarily from U.S.
          Shale .................................................................................................................. 19
          3. EIA Increases Forecasts for U.S. LNG Exports ................................................... 20
          4. BP Projects Pipeline Gas Supply to Growth 1.6% P.A. while LNG Trade Grows
          Seven Times Faster ............................................................................................. 21
          5. Destination Countries for LNG from the First 23 Months of Operation of
          Cheniere’s Sabine Pass ........................................................................................ 22
          6. Increased Diversity of Imported Gas Supplies Includes Marked Growth in
          LNG .................................................................................................................... 23
          7. Global Gas Price Benchmarks .......................................................................... 24
          8. References ...................................................................................................... 26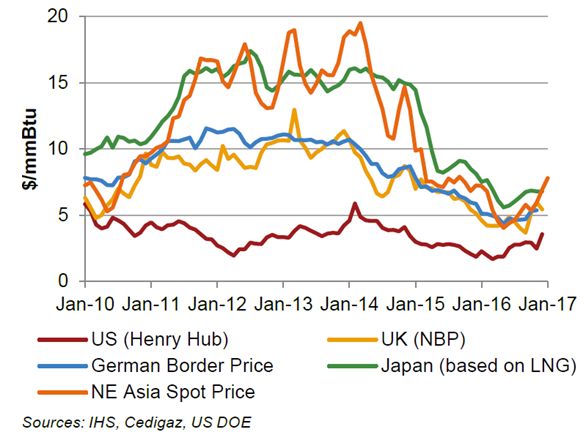
List of Exhibits

   Exhibit 1:  LNG market forces .................................................................... 1
   Exhibit 2:  Shale production in U.S. – Source: EIA ..................................... 6
   Exhibit 3:  Global LNG demand projection – Source: 2017 BP Energy
               Outlook © BP ............................................................................ 6
   Exhibit 4: Oil vs natural gas prices ............................................................ 8
   Exhibit 5: U.S. LNG liquefaction plants – Source: EIA ............................... 9
   Exhibit 6: Global LNG supply projection – Source: 2017 BP Energy
               Outlook © BP ............................................................................ 9
   Exhibit 7: Oil vs gas-indexed imports into Europe – Source: IGU
               World LNG Report © IGU ....................................................... 10
   Exhibit 8: LNG transactions by contract duration – Source: EIA............. 11
   Exhibit 9: Estimated price impact of LNG exports – Source: API/ICF
               “Impact of LNG Exports on the U.S. Economy”© 2017 API.... 13
   Exhibit 10: Price impact of LNG exports by region – Source: “Five
               years on: The outlook and impact of American LNG
               exports” © Deloitte Center for Energy Solutions ................... 14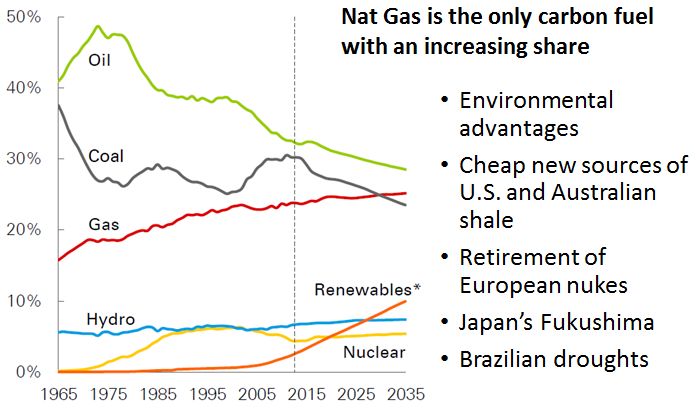
List of Acronyms and Defined Terms

    •   Bcf – Billion cubic feet
    •   Bcf/day – Billion cubic feet per day
    •   CEE – Center for Energy Economics
    •   CFTC – Commodity Futures Trading Commission
    •   CME – Chicago Mercantile Exchange, Inc.
    •   EIA – U.S. Energy Information Agency
    •   FSRU – Floating storage and regasification unit are ships with the ability to re-
        gasify LNG off-shore and transport it to a distribution system circumventing the
        need for expensive onshore storage and regasification plants
    •   GIIGNL – International Group of Liquefied Natural Gas Importers
    •   IEA – International Energy Association
    •   IECA – Industrial Energy Consumers of America
    •   IFED – Intercontinental Exchange (ICE) Futures Energy Division
    •   IGU – International Gas Union
    •   JKM – Japan Korea Marker Index of Asian LNG prices
    •   LDC – Local Distribution Company, the state regulated “pipes” utility
    •   MMBtu – Million British Thermal Units
    •   NGLs – Natural gas liquids, such as propane and butane
    •   NYMEX – New York Mercantile Exchange, a CME owned Designated Contract
        Market (DCM)
    •   Natural gas – interstate pipeline quality gas, primarily methane (CH4) natural
        gas, as used herein refers to physical as well as financial traded products
    •   OI – open interest
    •   P.A. – per annum
Executive Summary
There have been significant recent developments in the United States (U.S.) energy
industry related to exports of Liquefied Natural Gas (LNG). 1 In 2016, the U.S.
transitioned from being a net importer to a net exporter of LNG. In aggregate, U.S. LNG
export plants in operation and under construction have a capacity of 10 Bcf/day, 2 which
is about 13% of U.S. dry production. 3 Aside from limited pipeline gas traded with
Canada and Mexico, U.S. natural gas has been relatively insulated from international
market dynamics. Increasing exports of LNG from the U.S. may mean that the domestic
market will be influenced more by global forces.
This report assesses the impact of the growth in LNG trade. The report is a compilation
of public source evaluations by market observers of the impact of LNG market changes.
Rarely does a new market spring into existence in a sector as large and mature as
natural gas. The amount of capital to be invested and the consequences will have a
profound impact. Thus, there is no shortage of opinions from market observers about
what the future holds. This report attempts to synthesize the key factors and how the
LNG market outlook has evolved; it does not attempt to take sides or offer new
opinions.
Exhibit 1 illustrates the market forces both leading to and resulting from the anticipated
growth in U.S. LNG exports.
Exhibit 1: LNG market forces
The three main conclusions of this report are:
1. Global LNG trade growth is expected to continue with U.S. LNG exports having
the most rapid growth rate and a competitive price advantage.
12. U.S. LNG export growth may put upward pressure on domestic (U.S.) natural gas
prices and expose a heretofore relatively isolated North American market to
global market dynamics.
3. Burgeoning U.S. LNG exports are affecting global LNG market dynamics,
including contracting and risk management practices in CFTC regulated markets.
2I. Natural Gas and LNG Background
Natural gas is the only fossil fuel with a growing share of global energy, and natural gas
is poised to replace oil as the leading fuel in U.S. energy consumption within five years.
BP forecasts that, by 2035, oil will account for 30% of U.S. energy consumption, and
natural gas for 39%. 4
On the physical side, natural gas production in the U.S. increased from 52 Bcf/day in
2007 to 78 Bcf/day by the end of 2017, 5 a 34% increase. Estimates place cash market
transactions five times greater than production levels. 6 Further, estimates place
derivatives trading 10 to 12 times greater than physical trading. 7 Over time, the growth
in natural gas production has been accompanied by a growth in financial trading.
Natural gas is one of the major derivatives markets under CFTC regulation. CFTC-
regulated exchanges list approximately 180 futures and options contracts with open
interest. The reference natural gas futures contract trades on NYMEX (Henry Hub)8 and
currently has open interest of around 1.5 million contracts, with trading in the average
range of 200,000 - 500,000 lots per day with a peak of over 1 million lots on January 12,
2018.9 Besides the reference contract, natural gas futures include financial, basis, and
spread contracts. These contracts together have an open interest of 18 million, second
only to the 3-month Eurodollar as of the end of 2017. 10
Without conversion to LNG, natural gas can only be transported via pipelines, which
leads to regional pricing differences based upon the pipeline grid. Much of the financial
trading in natural gas is “basis” trading reflecting the need to hedge differences
between the reference Henry Hub futures contract and the myriad of production,
aggregation, and demand hubs (market centers).
LNG transportation via ships has changed the dynamic that natural gas at the receipt
point (production source) of the pipeline can only serve the downstream delivery
location (demand sink) of the pipeline by opening up new international markets with
the consequent global pricing influence.
LNG uses natural gas as feedstock, taking the gaseous form and chilling it to -260°F until
it becomes a liquid. In liquid form it occupies just 1/600th the space and can be
transported over sea using specialized tankers. The process increases the cost of the
commodity significantly, so the LNG industry depends on substantial natural gas price
spreads around the globe to support trade. At the point of receipt, regasification plants
3convert the LNG back to a gaseous state for use as a source of energy or as industrial
feedstock.
Traditionally, local distribution companies produced domestic LNG for use as peak
storage to provide supplemental gas supply on the coldest winter days. There are over
110 LNG plants operating in the U.S. with the vast majority owned and operated by
state regulated utilities. 11 The U.S. also imports LNG to supply natural gas to New
England where peak demand exceeds pipeline capacity. LNG provides about 8% of New
England’s annual supply. 12 However, with the development of shale production in the
U.S., LNG imports into New England have declined over time. LNG annual imports at the
Distrigas, Massachusetts terminal through November 2017 were 66% less than a decade
ago.
LNG Value Chain
The key steps in the LNG value chain are Exploration and Production, Liquefaction,
Shipping, and Storage & Regasification.
FERC estimates the costs of the four segments in the value chain are:
Exploration & Production: $0.90/MMBtu +/- $0.30
Liquefaction: $1.10/MMBtu +/- $0.20
Shipping: $1.15/MMBtu +/-$0.65
Storage & Regasification: $0.50/MMBtu +/-$0.10
Total Cost: $3.65/MMBtu +/-$1.25 13
All of these segments have seen development and investment, with notable
improvements in efficiency. As discussed below, shale production of natural gas has
fundamentally altered the natural gas market in the U.S., providing LNG exporters a
significant competitive advantage. LNG shipping has also seen significant developments
and improvements in efficiency:
• Between 2012 and 2016 charter rates for advanced LNG ships has declined from
over $150,000/day to $33,500/day. 14
• The global fleet of LNG tankers has expanded rapidly, with 31 new tankers added
in 2016, bringing the total fleet to 478 vessels, double the number ten years
ago. 15
4The regasification sector has also seen improvements in efficiency as a result of the
expanding use of Floating Storage and Regasification Units (FSRUs). These units are
cheaper and faster to build than land-based regasification units and can be re-deployed
to other areas if needed.
All of these factors have helped increase global LNG trade, and this trend is likely to
continue in the future.
II. Recent History of LNG in the U.S.
In 2016, the U.S. transitioned from being a net importer to a net exporter of LNG with
the commencement of Cheniere’s Sabine Pass terminal in Cameron Parish, Louisiana. 16
In March 2018, Dominion Energy’s Cove Point Terminal in Calvert County, Maryland
began exporting, which brought the aggregate U.S. export capacity in operation to 3.7
Bcf/day. 17 Within 20 years, EIA forecasts that U.S. LNG exports will grow to 14
Bcf/day, 18 while BP forecasts a more bullish 19 Bcf/day. 19 Liquefaction facilities for LNG
exports require significant capital: Cheniere is investing over $17 billion 20 at Sabine Pass
for Trains 1-5 21 and has another plant in Corpus Christi, Texas under construction.22
A major driver of U.S. LNG export projections is the low natural gas prices resulting from
shale production. 23 The shale revolution began in earnest in 2008 stimulating significant
increases in production of oil and natural gas in the U.S. The revolution is the product of
advances in oil and natural gas production technology—notably horizontal drilling and
hydraulic fracturing. In addition to these developments, high global oil prices also
played a role in spurring investment in shale production.24
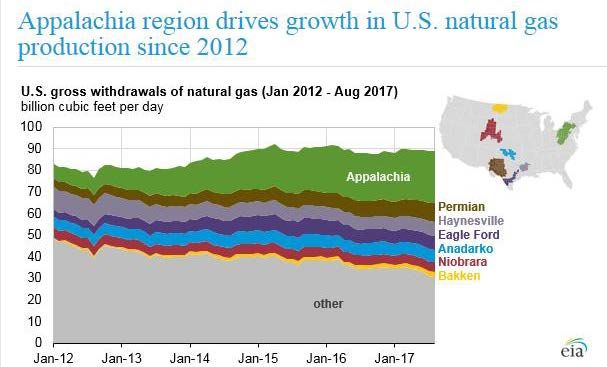
As shown in Exhibit 2 below, the seven U.S. shale regions produce the bulk of current
U.S. supply, with Marcellus and Utica basins (Appalachian) accounting for about one-
third of the U.S. total dry production.25 Shale gas is projected to account for 42 Bcf/day
in new supply by 2035, which is 33% of global supply growth. 26
5Exhibit 2: Shale production in U.S. – Source: EIA
III. Global Demand for Natural Gas and LNG
Global natural gas demand is Exhibit 3: Global LNG demand projection – Source: 2017 BP Energy
Outlook © BP
forecast to grow at 1.6% P. A.
and is the only hydrocarbon with
a growing share of global energy
supply. As shown in Exhibit 3,
the largest growth is projected to
be from Asian economies,
followed by Europe. 27
Projections show that much of
this demand growth is in regions
with insufficient domestic
production and infrastructure,
and LNG imports into these
regions are expected to meet the
shortfall. One industry analysis
forecasts that global LNG trade
will double over the next two
decades, 28 after increasing four-
fold over the past twenty years.
6Key drivers for demand growth include:
• Global GDP is forecast to grow 3.4% P. A., almost doubling in the next 20 years. 29
• Economic growth in countries with insufficient energy resources and related
pipeline and storage infrastructure. Many Asian markets rely solely on LNG for
their natural gas needs. In China, growth in gas consumption (5.4% P. A., 36
Bcf/day by 2035) is expected to outstrip domestic production, such that the
share of imported gas in total consumption is expected to rise to nearly 40% by
2035, up from 30% in 2015. 30
• Push for cleaner energy: environmentally, natural gas is the cleanest
hydrocarbon, emitting 30% less CO2 per Btu than fuel oil.31
• Japanese demand has grown as a result of shut-down of nuclear plants after the
Fukushima disaster.
• European demand for LNG is also increasing due to energy security concerns.
The EU receives 39% of its natural gas from Russia 32 and diversity of supply
through LNG imports support strategic objectives of diversity of energy
supplies. 33 In 2017, the Cheniere’s Sabine Pass Louisiana plant exported LNG to
Italy, Spain, Lithuania, and Poland among other EU countries. (Appendix 5 has a
complete list of countries receiving U.S. LNG). The EU LNG share of imports
reached 16% in the second and third quarters of 2017, the highest in four
years. 34
• Electric power generation is the sector with the largest projected increase in gas
consumption. BP estimates that two-thirds of the increase in global energy
consumption over the next 20 years will be for power generation. Several
European countries have policies encouraging the closure of nuclear power
plants, increasing demand for power generation.
• Finally, as discussed earlier, developments and investments in all segments of
the LNG value chain, from natural gas production to LNG storage and re-
gasification, have made LNG trade more economic and hence helped increased
demand for LNG.
IV. Natural Gas and U.S. LNG Exports
Historically, global LNG prices were indexed to oil prices. 35 With the shale revolution
starting about a decade ago, U.S. natural gas prices declined significantly and, as shown
below in Exhibit 4, became significantly lower than oil prices on a per MMBtu basis. This
price advantage of natural gas versus oil created a competitive advantage for U.S.
companies to export LNG to global buyers. This business can be thought of as an
arbitrage between low domestic prices and high global prices, although it is not an
7inexpensive opportunity to exploit. The decline in oil prices over the last few years has
reduced, but not eliminated, the competitive advantage of U.S. natural gas-indexed
LNG, and illustrates the risks inherent in such investments.
In addition to pricing advantages, note that well-functioning and liquid physical and
derivatives markets also play a part in enabling LNG exports by providing buyers
effective means to procure gas and hedge their exposures. (Appendix 7 presents a
comparison of the Henry Hub domestic benchmark to foreign natural gas and LNG
indices).
Exhibit 4: Oil vs natural gas prices
U.S. Liquefaction Plants
In addition to the 10 Bcf/day of liquefaction capacity, either in operation or under
construction, as illustrated below in Exhibit 5, FERC and DOE have approved another 14
Bcf/day. 36 In total, DOE has approved export licenses for 52.9 Bcf/day, 37 although it is
highly unlikely that this level of investment will actually occur.
8Exhibit 5: U.S. LNG liquefaction plants – Source: EIA
U.S. LNG Exports Exhibit 6: Global LNG supply projection – Source: 2017 BP Energy
Outlook © BP
Exhibit 6 shows the current and projected
exports of LNG by different regions. 38
Currently, the total LNG supply is 35
Bcf/day. Qatar is the largest exporter of
LNG followed by Australia. Current LNG
exports from the U.S. are very low relative
to total global supply, but it is expected to
grow significantly over the next twenty
years. BP estimates that by 2035 the U.S.
will be exporting 19 Bcf/day, or 25% of
global trade. 39 EIA’s Reference Case
(baseline scenario) projects 14 Bcf/day of
U.S. LNG exports with most of that growth
coming in the next 3-4 years. 40 Note that
LNG exports from the U.S. could be
affected by growth and investments by
other LNG exporters. Qatar recently
announced plans to increase LNG
production by 30% by 2024, ending a
moratorium that has been in place since
2005.41 In addition, changes in global LNG
9market practices may influence U.S. exports, as could developments in the natural gas
production sector. The net result of these uncertainties is that the realized exports of
LNG from the U.S. could vary widely from the estimates.
V. Changes in Global LNG Markets
Pricing Mechanism
Recently, there has been a trend towards indexing LNG prices to natural gas
benchmarks with less reliance on global oil benchmark escalation clauses for physical
LNG delivery contracts. The entry of the U.S. as a substantial exporter of LNG will
further this trend. Exhibit 7 from the International Gas Union 42 shows the share of
European import contracts indexed to oil has decreased from over 90% to less than 40%
in 10 years43 and newer contracts are much more likely to be indexed to natural gas.
The same trend holds to a lesser degree in Asia. This change towards gas-indexed
pricing for LNG may put pressure on U.S. LNG exports, because U.S. natural gas has less
of a pricing advantage against other natural gas supplies than it does against oil.
Exhibit 7: Oil vs gas-indexed imports into Europe – Source: IGU World LNG Report © IGU
100%
80%
60%
40%
20%
0%
2005 2007 2009 2010 2012 2013 2014 2015
Oil price based Gas price based
10Contract Duration
Another contract practice change is the trend towards shorter term contracts. An EIA
compilation of GIIGNL contract survey data in Exhibit 8 illustrates the percent of spot
and short-term deals has grown five-fold from a 5% market share in 2000 to over 25% in
2015.44
Exhibit 8: LNG transactions by contract duration – Source: EIA
This growth is the result of several key factors identified by IGU:
• The growth in LNG contracts with destination flexibility, which has facilitated
diversions to higher priced markets.
• The increase in the number of exporters and importers, which has increased the
complexity of the industry and introduced new permutations and linkages
between buyers and sellers. In 2016, 29 countries (including re-exporters)
exported spot volumes to 35 end-markets. This compares to six spot exporters
and eight spot importers in 2000.
• The lack of domestic production or pipeline imports in Japan, South Korea and
Taiwan, which has pushed these countries and others to rely on the spot market
to cope with any sudden changes in demand like the Fukushima crisis.
• The decline in competitiveness of LNG relative to coal in some countries and
shale gas (North America) that has freed up volumes to be re-directed
elsewhere.
11• The large disparity between prices in different basins from 2010 to 2014, which
made arbitrage an important and lucrative monetization strategy.
• The faster development timeline and lower initial capital costs of FSRUs
compared to onshore regasification, which allow new countries to enter the LNG
market.
• The large growth in the LNG fleet, especially vessels ordered without a long-term
charter, which has allowed low-cost inter-basin deliveries. 45
Along with the increase in LNG demand, the increase in spot trading has increased the
demand for derivatives. According to the Financial Times, Asian LNG derivatives
volumes quadrupled in 2017 on strong demand for physical LNG in China. In 2017,
exchanges [ICE and CME] cleared “50,236 lots of LNG swaps contracts linked to S&P
Global Platts’ Japan Korea Marker index… up from 12,717 lots the previous year.” 46
Additionally, the increased demand allowed for a surge in “Asian LNG prices… to a
three-year record of more than $11 per million British thermal units at the end of
2017.” 47
Overall, the shift towards shorter contracts is likely to be driven more by demand than
supply. However, it may benefit U.S. LNG exports to certain markets, depending on
geographic accessibility.
VI. Potential Impact of LNG Exports on U.S. Natural Gas Markets
Over time, estimates are that both U.S. production and LNG exports will increase. In
2017, Cheniere’s Sabine Pass terminal exported 209 cargoes totaling 706 Bcf, 48 which
was 2.6% of U.S. dry gas production. By 2022, EIA projects U.S. dry gas production to
increase by 30%. 49 Factoring in plant utilization and netting LNG imports, expectations
are that net LNG exports will be approximately 11% of U.S. dry production by 2025. 50
Production estimates for 2040 are in the range of 114-118 Bcf/day.51 Estimates of LNG
exports vary even more widely, with estimates ranging from 6 to 29 Bcf/day. 52 For the
purpose of this report, a reasonable range of estimates for LNG exports appears to be
between 9 - 20% of U.S. production of natural gas.
By its very nature, estimating the impact of LNG exports on domestic natural gas prices
is difficult and estimates of the impact of incremental LNG exports on domestic prices
vary widely. Some analysts argue that there will be no significant price change, while
others estimate an impact in the 5 - 10% range.
12DOE 53 and API54 sponsored studies of the projected impact on U.S. natural gas prices for
various LNG export growth scenarios. ICF conducted a study for API, updated in
September 2017, which considered five different LNG export scenarios, including 8
Bcf/day on the low end and 24 Bcf/day on the high end. The estimated average U.S.
natural gas price from 2016 through 2040 under the 24 Bcf/day scenario was 10.6%
higher than the average price during the period under the 8 Bcf/day scenario. 55
However, LNG exports in all scenarios grow over time, and so price differences are
initially small but grow. By 2040, the difference between the 8 Bcf/day and 24 Bcf/day
export scenarios is nearly $1/MMBtu, or approximately 23%. ICF modeling found that
over the 2017-2040 period, average natural gas price increases range from 5.1 cents to
6.3 cents per Bcf/day of LNG exports. 56 This is a 50% reduction from ICF’s 2013
estimate of an 11-12 cent increase per Bcf/day of LNG exports.
ICF concludes that “there has been a trend for the estimates of price impacts to drop
over time. Based on our [ICF’s] modeling experience reflected in various ICF studies,
shown in Exhibit 9, this general trend has occurred because improved technologies for
natural gas production have tended to drop the forecasted prices for natural gas and
have tended to make natural gas supplies more price-elastic.” 57 Unlike conventional
gas, shale gas production is highly price responsive. “[U.S.] Northeast production has
become so responsive to cash prices, it indicates that producers are operating their dry
gas wells as implied storage.” 58
Exhibit 9: Estimated price impact of LNG exports – Source: API/ICF “Impact of LNG Exports on the U.S.
Economy”© 2017 API
13The 2015 DOE study states, “the Henry Hub price is, on average, 4.3 percent higher in
the 20 Bcf/day export case than the 12 Bcf/day case over the period 2026–2040.59 This
fact that the price increase as we move from 12 Bcf/day to 20 Bcf/day of LNG exports
slowly climbs to $0.50 by 2040 renders the domestic demand response to be relatively
small.” 60
In 2011, Deloitte estimated a 23 cent/MMBtu impact at the Henry Hub and a 12 cent
increase nationally on all gas consumed on average from 2016-2035 from 6 Bcf/day of
export capacity.61 A 2015 Deloitte update to the 2011 study reported a “9.8 Bcf/day
increase in US demand via LNG exports requires an increase in North American domestic
production but may only lead to a marginal $0.05 per MMBtu increase in price due to
availability of low cost of supply.” 62 That 5 cent impact is on all domestic flows over the
20-year horizon. The impact is smaller in the early years and grows larger as more
liquefaction capacity for exports comes into service. As these studies indicate, any price
impact in domestic markets is likely to be greater near LNG export terminal and
especially on the Gulf Coast. Exhibit 10 illustrates Deloitte’s 2011 projection that the
Henry Hub price impact would be twice as large as the national average from an
estimated 6 Bcf/day of LNG exports. 63 A key reason for lower impact in market areas is
that significant shale production is close to these areas, whereas conventional gas
production was concentrated in the Gulf region.
Exhibit 10: Price impact of LNG exports by region – Source: “Five years on: The outlook and impact of American
LNG exports” © Deloitte Center for Energy Solutions
Estimates of U.S. LNG export levels and price impacts on domestic markets vary widely,
but generally these estimates suggest that there is a potential for U.S. domestic natural
gas markets to be influenced by global supply-demand factors. In addition, U.S.
14derivative markets could see increased trading as overseas traders use these markets to
hedge their exposures. While still relatively low, there are expectations that overseas
traders’ share of trading in natural gas futures will increase.64
VII. Conclusions
The shale revolution has reshaped the energy industry and given rise to U.S. exports of
oil and natural gas. The glut of U.S. shale supply has coincided with a global shift to
natural gas from other fossil fuels. Exporting U.S. natural gas to countries other than
Canada and Mexico requires that it be liquefied for transport by ocean-going tankers.
The combination of global demand growth and U.S. price-competitive, reliable supply
has led to significant investments in LNG that in turn are impacting energy markets. A
synopsis of the three main conclusions follows.
Global LNG trade and U.S. exports are expected to grow.
Global LNG trade has increased sharply over the last decade, and there are strong
indications that this trend will continue. The U.S. LNG industry has already made
significant investments in LNG export capacity and further increases are underway.
Under current market conditions, U.S. exports enjoy a competitive advantage that is
also expected to continue for the foreseeable future. As a result, estimates are that the
U.S. will become one of the largest exporters of LNG. However, exports from the U.S.
will likely face competitive pressures, ranging from low oil prices, to competitive
responses by other exporters. One example of this is the global move to gas-indexed
LNG pricing; since natural gas in producing countries is typically cheaper than oil (on a
per MMBtu basis), this puts competitive pressure on U.S. exports.
U.S. LNG export growth may put upward pressure on domestic natural gas prices.
As U.S. LNG exports increase, some studies suggest that domestic natural gas prices
could increase. Estimates of this impact vary widely, from negligible to 9-20% over time.
The biggest variable in determining the magnitude of this potential impact is the
production response from domestic natural gas producers. Over time, U.S. production
has become more efficient; and if this trend continues, LNG exports will have a lower
impact on domestic prices. Given the magnitude of U.S. exports, there is also the
potential that domestic natural gas markets could become subject to global supply-
demand dynamics with the potential for increased volatility.
15Changes in LNG markets may drive increased participation in derivatives markets.
The LNG market is evolving to shorter contract durations and more spot transactions.
These factors point to an increased need for derivatives markets for hedging, and recent
experience supports this point. Additionally, as gas-indexed contracts become more
prevalent, and U.S. exports increase, it is very likely that trading in U.S. derivatives
markets will increase as a result, especially by overseas traders.
16Appendices
171. Deloitte Center for Energy Solutions “LNG at the crossroads” Executive
Summary© 65
The volume of LNG traded globally has quadrupled in the last two decades and is set to
double in the next two. Future supply will come heavily from the U.S. and Australia,
with demand coming from many of the traditional players in Europe and Asia. As
volumes continue to increase, the market has potential to reach critical mass, leading to
shifts in the countries and companies involved and market structure. These
developments hinge on maximizing the strengths and opportunities of the LNG value
chain, while reducing the impact of the strategic weaknesses and threats from external
developments. Seven key factors are expected to drive how the LNG industry will grow,
including:
• Global economic growth: LNG consumption is driven by global growth in Europe
and Southeast Asia. A slip in regional growth, particularly in China, would flatten
natural gas demand in key importing countries.
• Energy efficiency: Energy intensity of global growth has declined over the last
few decades as high energy prices and environmental concerns have driven the
adoption of higher efficiency technologies.
• Excess capacity: New capacity coming online in the U.S. and Australia is weighing
down on an already saturated market. As few as one in twenty planned projects
may be needed to meet demand through 2035 and only those with lower costs,
direct access to markets, and signed buyers will move forward.
• Shipping costs: Shortening the trading distance with more flexible contracts and
widening of the Panama Canal can reduce the cost of shipping, driving an
increase in volumes as incremental margins improve. This will reduce the
natural gas price differential required to drive investment.
• New markets: Japan and South Korea import half of all LNG volumes, historically
paying a premium over shipments in the Atlantic basin. Growth in trade will
require new LNG regasification facilities to be built in more countries to meet
growing global fuel needs.
• New end users: LNG is traditionally consumed for utility-scale power generation,
but LNG as an alternative transport fuel for shipping, trains, or trucks as well a
power source for remote small-scale grids, will provide a long tail of potential
demand growth.
• Market liquidity: Floating liquefaction and regasification combined with new
countries building both import and export capacity, can transform the current
contract-dependent market into one that provides trading opportunity through
transparent gas benchmarks and a flexible spot market.
182. BP Projects Global Natural Gas Supply Growth to Come Primarily from U.S. Shale
The BP Energy Outlook, 2017 edition shows U.S. supply growth.66
193. EIA Increases Forecasts for U.S. LNG Exports
From 2017 to 2018, EIA increased LNG export projections by 2 Bcf/day by 2030.67
204. BP Projects Pipeline Gas Supply to Growth 1.6% P.A. while LNG Trade Grows Seven
Times Faster
The BP Energy Outlook, 2017 Edition © 68
215. Destination Countries for LNG from the First 23 Months of Operation of Cheniere’s
Sabine Pass
Sabine Pass customers:
• BG Group • Gas Natural Fenosa
• Korea Gas Corp. • Gail (India) Limited
• Total Gas & Power N.A. • Centrica PLC
• Trafigura (Train #6)
Source: U.S. Energy Department, Office of Fossil Energy: https://www.energy.gov/fe/listings/lng-reports
226. Increased Diversity of Imported Gas Supplies Includes Marked Growth in LNG
The BP Energy Outlook, 2017 Edition © 69
237. Global Gas Price Benchmarks
LNG trade is enabled by (1) long-term fixed price contracts, (2) high basis differentials,
and (3) large investments hedged by functioning risk markets.
Gas prices in North America are largely set at liquid trading hubs, the largest and most
important of which is Henry Hub in Louisiana. In Europe, wholesale gas is sold mainly
via long-term contracts. These contracts variously take into account gas hub-based or
oil-linked pricing, and often both. In Asia and many emerging markets without
established and liquid gas trading markets, the price of LNG is for the most part set via
oil-linkages, supplemented by a smaller share of spot imports.
Oil prices are particularly important for the LNG market. As oil prices fell in late 2014
through late 2016, traditionally oil-linked prices in Europe and Asia also declined. From
an average of over $100/bbl in the first eight months of 2014, crude prices fell rapidly to
an average of $52/bbl in 2015 and $43/bbl in 2016. Given that most oil-indexed
contracts have a three to six month time lag against the oil price, Asian term import
prices remained relatively steady through the end of 2014, with Japanese imports
holding at the $15/MMBtu level. However, by 2015 the impact of oil price became
apparent and continued through 2016. The Japanese import price averaged
$9.77/MMBtu in 2015 and $6.59/MMBtu in 2016.
24Source: “IGU 2017 World LNG Report” ©
“Over the past six years, Asian buyers have increasingly sought to diversify the pricing
structures of their LNG portfolios, shifting away from the traditional fixed-destination,
long-term, oil-linked LNG contract. The sustained growth of shale gas production in
North America has seen Henry Hub trade at a discount to other major gas benchmarks
in the Pacific Basin and Europe; prompting Japanese, South Korean, Indian, and
Indonesian companies, among others, to sign a number of offtake agreements based on
Henry Hub linkage. However, as oil price has declined, buyer contracting activity from
the U.S. has also waned. While Henry Hub linked LNG contracts will continue to offer
buyer’s portfolio diversification, the perception that these contracts will result in lower
priced LNG relative to oil-linked contracts is less assured.70
258. References
• Energy Information Administration (EIA)
– “Perspectives on the Development of LNG Market Hubs in the Asia Pacific
Region,” March 2017
– Annual Energy Outlook 2017
– Annual Energy Outlook 2018
• U.S. DOE’s “The Macroeconomic Impact of Increasing U.S. LNG Exports”
– IECA response letter to Secretary Perry
• International Energy Agency (IEA)
– “Developing a Natural Gas Trading Hub in Asia”
• International Group of Liquefied Natural Gas Importers, GIIGNL
– “The LNG Industry Annual GIIGNL Report 2017”
• Center for Energy Economics (CEE at UT)
– “LNG Supply Outlook 2016 to 2030”
• International Gas Union (IGU)
– 2017 World LNG Report
• BP Energy Outlook 2017 edition
• Deloitte Center for Energy Solutions
– https://www2.deloitte.com/us/en/pages/energy-and-resources/articles/lng-
industry-trends-oil-natural-gas-report.html
– http://www.gaselectricpartnership.com/L%20LNG%20deloitte.pdf
• ExxonMobil “2018 Outlook for Energy”
• FERC
• Natural Gas Supply Association (NGSA)
• Center for Liquefied Natural Gas (CLNG)
• Financial Time, “Asian LNG derivative volumes quadruples” in 2017
• Platts articles on JKM, Shipping, and blogs
• ICIS Heren
• API/ ICF : http://www.api.org/news-policy-and-issues/lng-exports/impact-of-lng-
exports-on-the-us-economy
• https://breakingenergy.com/2015/01/21/impact-of-falling-oil-prices-on-lng/
• http://online.wsj.com/ad/article/ceraweek-low-oil-prices-lng-withstanding-rough-seas-
ahead/
• Trafigura signs 15-year LNG accord with Cheniere:
https://www.ft.com/content/bdfd35f4-facc-11e7-a492-2c9be7f3120a
• WSJ: https://www.wsj.com/articles/global-trade-thrusts-louisianas-henry-hub-into-
center-of-natural-gas-world-1502967607
• CME clears first JKM Swap: Platts link
• https://www.theice.com/article/globalizing-nat-gas-mkt-drives-liquidity-in-LNG-futures
26End Notes
1
Liquefied natural gas (LNG): Natural gas (primarily methane) that has been liquefied by reducing its
temperature to -260 degrees Fahrenheit at atmospheric pressure.
2
FERC and EIA: https://www.ferc.gov/industries/gas.asp.
Many of these plants such as Sabine Pass and Cove Point are brown field projects on the sites of moth-
balled import terminals.
3
Dry Natural Gas Production: The process of producing consumer-grade natural gas. Natural gas
withdrawn from reservoirs is reduced by volumes used at the production (lease) site and by processing
losses. Volumes used at the production site include (1) the volume returned to reservoirs in cycling, re-
pressuring of oil reservoirs, and conservation operations; and (2) gas vented and flared. Processing losses
include (1) nonhydrocarbon gases (e.g., water vapor, carbon dioxide, helium, hydrogen sulfide, and
nitrogen) removed from the gas stream; and (2) gas converted to liquid form, such as lease condensate
and plant liquids. Volumes of dry gas withdrawn from gas storage reservoirs are not considered part of
production. Dry natural gas production equals marketed production less extraction loss. From EIA:
https://www.eia.gov/dnav/ng/TblDefs/ng_prod_sum_tbldef2.asp.
4
BP: https://www.bp.com/content/dam/bp/pdf/energy-economics/energy-outlook-2017/bp-energy-
outlook-2017.pdf.
5
A Bcf is approximately 1.04 million MMBtus. The primary unit of measure by industry segment is:
• Physical gas production and delivery measured in cubic feet (or Bcf/day)
• Financial gas measured in MMBtus (or Dth)
• LNG liquefaction measured in MT, millions of metric tonnes
• Shipping measured in cubic meters
Conversions table 1 and table 2.
6
Cornerstone Research: https://www.cornerstone.com/Publications/Reports/Characteristics-of-US-
Natural-Gas-Transactions-2017.
7
Naturalgas.org.
8
The NYMEX “NG” reference contract specifications are listed here:
http://www.cmegroup.com/trading/energy/natural-gas/natural-gas_contract_specifications.html.
27The most active natural gas contract on ICE, the “H” contract, also settles to the NYMEX “NG” contract.
The ICE “H” contract specifications are listed here: https://www.theice.com/products/6590258/Henry-
LD1-Fixed-Price-Future.
9
PRNewswire release of CME Group: https://www.prnewswire.com/news-releases/cme-group-
announces-henry-hub-natural-gas-futures-all-time-daily-volume-record-surpassing-1-million-contracts-
300583608.html. Volume of the NYMEX “NG” contract is available here:
http://www.cmegroup.com/trading/energy/natural-gas/natural-gas_quotes_volume_voi.html.
10
From CFTC data.
11
FERC: https://www.ferc.gov/industries/gas/indus-act/lng.asp.
12
Northeast Gas Association: http://www.northeastgas.org/about_lng.php.
13
FERC Energy Primer and other estimates.
14
IGU: LNG tankers cost about $200 million and have gotten larger on average coinciding with the
expansion of the Panama Canal; 91% of the global fleet can now pass through the Panama Canal. “As of
end-2016, the order book included 121 tankers expected to be delivered through 2022, of which 6 were
ordered during 2016; a significant decrease from the 28 tankers ordered in the prior year. The slowdown
in newbuild orders coincides with the slowdown in liquefaction project FIDs being reached. Only 66% of
the tankers currently on the order book are tied to a specific charterer, leaving many options for potential
project offtakers.”
15
http://www.gasinfocus.com/en/indicator/evolution-of-the-global-lng-carrier-fleet/.
16
Institute for Energy Research:
• https://instituteforenergyresearch.org/analysis/u-s-oil-natural-gas-exports-soar
• https://instituteforenergyresearch.org/analysis/u-s-become-major-lng-exporter/
17
FERC and EIA: https://www.ferc.gov/industries/gas.asp. Also, refer to end-note 1.
18
EIA scenarios range from 6 Bcf/day to 29 Bcf/day: #AEO2018, page 75. Note the 2018 EIA baseline
scenario raised LNG exports by 2 Bcf/day from the previous estimate and the high case increased 6
Bcf/day. See Appendix 3.
19
BP Energy Outlook 2017: https://www.bp.com/content/dam/bp/pdf/energy-economics/energy-
outlook-2017/bp-energy-outlook-2017.pdf.
20
Cheniere 2016 Annual report, page 5. http://phx.corporate-
ir.net/External.File?item=UGFyZW50SUQ9NjY2NjcyfENoaWxkSUQ9Mzc0NDY0fFR5cGU9MQ==&t=1.
21
An LNG train is a liquefied natural gas plant's liquefaction and purification facility. For practical and
commercially viable transport of natural gas from one country to another, its volume has to be greatly
reduced. To do this, the gas must be liquefied (condensed) by refrigeration to less than -161 °C (the
boiling point of methane at atmospheric pressure). This process requires strict safety precautions during
all liquefaction stages, due to the flammability of the gas. There are numerous impurities that freeze at
low temperatures that are found in raw gas. Since these would block the cryogenic section of the plant,
the gas must be purified before it can be liquefied. Each LNG plant consists of one or more trains to
convert natural gas into liquefied natural gas. A typical train consists of a compression area, propane
condenser area, methane, and ethane areas. https://en.wikipedia.org/wiki/LNG_train.
22
Cheniere LNG Terminals: http://www.cheniere.com/terminals/lng/.
23
Exploration and production from shale rock of both oil and natural gas.
24
Note that shale gas is a subset of gas representing extraction from the generic term “tight formations”
CFR: https://www.cfr.org/report/shale-gas-and-tight-oil-boom.
25
EIA: https://www.eia.gov/todayinenergy/detail.php?id=33972. Note that this includes both dry and
wet production. Wet production includes hydrocarbons heavier than methane.
26
BP: https://www.bp.com/content/dam/bp/pdf/energy-economics/energy-outlook-2017/bp-energy-
outlook-2017.pdf illustrated in Appendix 2.
2827
BP as shown in Appendix 4.
28
Deloitte Center for Energy Solutions: Four-part “LNG industry trends”, Highlights from the Deloitte
report appear in Appendix 1.
29
BP Energy Outlook: https://www.bp.com/content/dam/bp/pdf/energy-economics/energy-outlook-
2017/bp-energy-outlook-2017.pdf. Natural gas is forecast to grow 1.6% P.A. during this period. Energy
intensity (the amount of energy required per unit of GDP) declines by 31% by 2035. Per capita energy use
reaches its lowest level since at least 1965.
30
BP: The BP Energy Outlook, 2017 Edition, page 35.
31
EIA: https://www.eia.gov/energyexplained/index.cfm?page=natural_gas_environment and
NaturalGas.org: http://naturalgas.org/environment/naturalgas/.
32
See Appendix 6.
33
European Commission: https://ec.europa.eu/energy/en/topics/imports-and-secure-supplies/supplier-
countries.
34
EU report:
https://ec.europa.eu/energy/sites/ener/files/documents/quarterly_report_on_european_gas_markets_q
3_2017_final_20171221finalcover.pdf.
35
Oil indexing involves more than just crude escalation clauses and the term “crude cocktail is a broader
term.
36
EIA: https://www.eia.gov/todayinenergy/detail.php?id=32412. Note that the Cove Point operation has
slipped to March 2018. Approved projects are also available from FERC and DOE. A list of proposed
export terminals. IER: https://instituteforenergyresearch.org/analysis/u-s-oil-natural-gas-exports-soar.
37
IECA: Letter to Secretary Perry.
38
BP as shown in Appendix 4.
39
BP as shown in Appendix 4.
40
EIA AEO 2017 reference case, with a range of 7-23 Bcf/day by 2035.
41
EIA: https://www.eia.gov/naturalgas/weekly/archivenew_ngwu/2017/07_06/.
42
IGU: Note: Oil Price Escalation = prices linked, usually through a base price and an escalation clause, to
competing fuels, typically crude oil, gas oil and/or fuel oil. Gas-on-Gas Competition = prices determined by
the interplay of supply and demand – gas-on-gas competition – that are traded at physical or notional
hubs. “Wholesale Gas Price Survey 2016 Edition,” Table 3.3 on page 23.
43
IGU: “Since 2009, European gas contracts have increasingly been signed or renegotiated to include hub
gas price indexation (particularly in the Northwest), dropping the historically dominant links to crude and
fuel oil.” See page 17.
44
EIA: https://www.eia.gov/analysis/studies/lng/asia/pdf/lngasia.pdf.
45
IGU: 2017 World LNG Report, page 15.
46
Financial Times, https://www.ft.com/content/a5f34b38-ff68-11e7-9650-9c0ad2d7c5b5.
47
Financial Times, https://www.ft.com/content/a5f34b38-ff68-11e7-9650-9c0ad2d7c5b5.
48
DOE Office of Fossil Energy: https://www.energy.gov/fe/listings/lng-reports.
49
EIA: https://www.eia.gov/outlooks/aeo/data/browser/; BP:
https://www.bp.com/en/global/corporate/energy-economics/energy-outlook/country-and-regional-
insights/us-insights.html.
50
EIA: https://www.eia.gov/outlooks/aeo/data/browser/.
51
EIA scenarios range from 6 Bcf/day to 29 Bcf/day: #AEO2018, page 75. Note that the 2018 EIA baseline
scenario raised LNG exports by 2 Bcf/day from the previous estimate and the high case increased 6
Bcf/day.
52
Id.
53
DOE: “The Macroeconomic Impact of Increasing U.S. LNG Exports”.
2954
API/ICF: Impact of LNG Exports on the U.S. Economy: A Brief Update: http://www.api.org/news-policy-
and-issues/lng-exports/impact-of-lng-exports-on-the-us-economy.
55
API/ICF: Impact of LNG Exports on the U.S. Economy: A Brief Update: http://www.api.org/news-policy-
and-issues/lng-exports/impact-of-lng-exports-on-the-us-economy.
56
API/ICF: Impact of LNG Exports on the U.S. Economy: A Brief Update: http://www.api.org/news-policy-
and-issues/lng-exports/impact-of-lng-exports-on-the-us-economy.
57
Id.
58
RiskDesk, Vol. 16, Issue 20, November 30, 2017, “NE natty gas opec in the offing?”
59
DOE: “The Macroeconomic Impact of Increasing U.S. LNG Exports”.
60
DOE: “The Macroeconomic Impact of Increasing U.S. LNG Exports”, page 62.
61
Deloitte Volume 2, Figure 2.1: https://www2.deloitte.com/us/en/pages/energy-and-
resources/articles/lng-industry-trends-oil-natural-gas-report.html.
62
Deloitte Volume 2: https://www2.deloitte.com/us/en/pages/energy-and-resources/articles/lng-
industry-trends-oil-natural-gas-report.html. “In many cases, LNG imports and exports represent the
marginal cubic foot (or million Btu), only a small percentage of the domestic gas produced or consumed.
In major exporting countries or in importing countries whose imports are only seasonal, the natural gas
supply curve follows the marginal cost of production for each country plus the cost of intra-country
transport. For example, 9.8 bcf/day increase in US demand via LNG exports requires an increase in North
American domestic production but may only lead to a marginal US$0.05 per MMBtu increase in price due
to availability of low cost of supply.”
63
Deloitte Volume 2: https://www2.deloitte.com/us/en/pages/energy-and-resources/articles/lng-
industry-trends-oil-natural-gas-report.html.
64
WSJ June 6, 2017, “Worries by U.S. political leaders that gas exports would drive domestic prices
significantly higher haven’t been borne out, at least so far, as Energy Department studies show only
marginal effects. The U.S. appears to be exporting its low gas prices rather than importing higher ones
from the rest of the world. As LNG import terminals open in more locations, gas pricing and trading
mechanisms are developing as well. Some investors are increasingly using the gas price at a pipeline
intersection in Louisiana, called the Henry Hub, as a global benchmark. Trading in the New York
Mercantile Exchange’s Henry Hub gas futures contract is becoming more global, said Peter Keavey, global
head of energy at Nymex owner CME Group.”
See also:
CME’s CEO Terry Duffy in an August 1, 2017 earnings report and as reported by the WSJ: “CME Group
expects its flagship US natural gas futures contract to evolve into a global benchmark. We believe our
Henry Hub contracts will continue to rise in global relevance. Growing exports of liquefied natural gas, or
LNG, will put CME's Henry Hub products on a similar track as its popular WTI oil futures. The percent of
CME energy trading volume originating from outside the US grew to 23% in the second quarter of 2017
from 18% in the same period last year, a figure that includes both oil and gas, according to CME.”
65
Deloitte LNG Update, Part 1.
66
BP Energy Outlook 2017 edition, page 32: https://www.bp.com/content/dam/bp/pdf/energy-
economics/energy-outlook-2017/bp-energy-outlook-2017.pdf.
67
EIA AEO 2018: https://www.eia.gov/outlooks/aeo/.
68
BP Energy Outlook, 2017 edition, pages 14-15: https://www.bp.com/content/dam/bp/pdf/energy-
economics/energy-outlook-2017/bp-energy-outlook-2017.pdf
69
BP Energy Outlook, 2017 edition, pages 34-35: https://www.bp.com/content/dam/bp/pdf/energy-
economics/energy-outlook-2017/bp-energy-outlook-2017.pdf
70
IGU, page 17. See also Platts Gas Daily 20170404.
30You can also read