Sustainable Energy & Fuels
←
→
Page content transcription
If your browser does not render page correctly, please read the page content below
Volume 4
                                                                                           Number 9
                                                                                           September 2020
                                                                                           Pages 4305–4886

Sustainable
Energy & Fuels
Interdisciplinary research for the development of sustainable energy technologies
rsc.li/sustainable-energy

                                 ISSN 2398-4902

                                 PAPER
                                 André Bardow et al.
                                 Rock ‘n’ use of CO2: carbon footprint of carbon capture
                                 and utilization by mineralization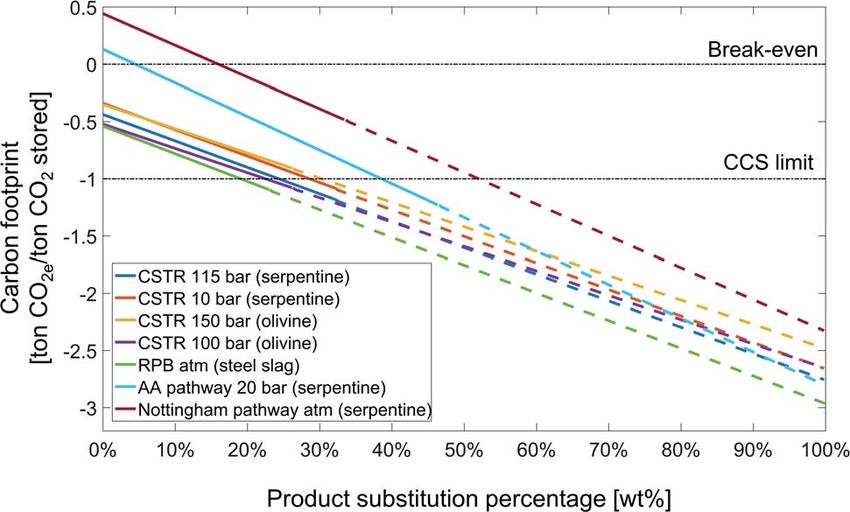
Sustainable
Energy & Fuels
View Article Online
PAPER View Journal | View Issue
Rock ‘n’ use of CO2: carbon footprint of carbon
This article is licensed under a Creative Commons Attribution 3.0 Unported Licence.
Cite this: Sustainable Energy Fuels,
capture and utilization by mineralization†
Open Access Article. Published on 30 April 2020. Downloaded on 9/18/2020 7:48:26 PM.
2020, 4, 4482
Hesam Ostovari, a
André Sternberg ‡a and André Bardow *ab
A recent approach to reduce the carbon footprint of industries with process-inherent CO2 emissions is CO2
mineralization. Mineralization stores CO2 by converting it into a thermodynamically stable solid. Beyond
storing CO2, the products of CO2 mineralization can potentially substitute conventional products in several
industries. Substituting conventional production increases both the economic and the environmental
potential of carbon capture and utilization (CCU) by mineralization. The promising potential of CO2
mineralization is, however, challenged by the high energy demand required to overcome the slow reaction
kinetics. To provide a sound assessment of the climate impacts of CCU by mineralization, we determine
the carbon footprint of CCU by mineralization based on life cycle assessment. For this purpose, we analyze
7 pathways proposed in literature: 5 direct and 2 indirect mineralization pathways, considering serpentine,
olivine, and steel slag as feedstock. The mineralization products are employed to partially substitute cement
in blended cement. Our results show that all considered CCU technologies for mineralization could reduce
climate impacts over the entire life cycle based on the current state-of-the-art and today's energy mix.
Reductions range from 0.44 to 1.17 ton CO2e per ton CO2 stored. To estimate an upper bound on the
potential of CCU by mineralization, we consider an ideal-mineralization scenario that neglects all process
inefficiencies and utilizes the entire product. For this ideal mineralization, mineralization of 1 ton CO2 could
even avoid up to 3.2 times more greenhouse gas emissions than only storing CO2. For all mineralization
Received 4th February 2020
Accepted 26th February 2020
pathways, the carbon footprint is mainly reduced due to the permanent storage of CO2 and the credit for
substituting conventional products. Thus, developing suitable products is critical to realize the potential
DOI: 10.1039/d0se00190b
benefits in practice. Then, carbon capture and utilization by mineralization could provide a promising route
rsc.li/sustainable-energy for climate change mitigation.
GHG emissions by 7.7 Gt CO2e by 2060 to achieve the 2 C goal,
1. Introduction despite increase in global cement production.3 Aer the cement
Global anthropogenic greenhouse gas (GHG) emissions need to industry, the steel industry is the second largest industrial
become zero and even negative in order to contain the negative contributor to global GHG emissions with 5% and 2.1 Gt CO2e
impacts of climate change.1,2 A key technology to reduce per year in 2017. For the steel industry, the IEA recommends 10
greenhouse gas emissions is renewable energy. Renewable Gt CO2e cumulative emission reductions by 2060.6
energy avoids GHG emissions by substituting fossil energy. Currently, the only technology to reduce process-inherent
However, energy substitution is not sufficient for industries CO2 emissions is carbon capture and storage (CCS).7 A variety
with process-inherent CO2 emissions such as the cement and of technologies are available for both CO2 capture and storage.
steel industry. The cement industry contributes 7% to the global To store the captured carbon dioxide, two approaches are
GHG emissions with 2.2 Gt CO2e per year in 2014.3 E.g., China's currently discussed: geological storage and mineralization.8,9
GHG emissions from cement production (approximately 1 Gt For geological storage, the captured CO2 is compressed and
CO2e per year) are higher than the total GHG emissions from pumped underground. Several storage projects are currently
Germany (0.87 Gt CO2e per year in 2018).4,5 The IEA thus running to demonstrate and develop the required technologies
requires that the cement industry should cumulatively reduce for storage itself but also for the monitoring, safety, and social
acceptance.10,11
a
In carbon capture and storage by mineralization, CO2 is
Institute of Technical Thermodynamics, RWTH Aachen University, Aachen, Germany.
E-mail: andre.bardow@ltt.rwth-aachen.de stored by conversion into a thermodynamically stable solid. For
b
Institute of Energy and Climate Research, Energy Systems Engineering (IEK-10), this purpose, CO2 reacts with metal-oxide-bearing materials MO
Forschungszentrum Jülich GmbH, Jülich, Germany such as magnesium oxide or calcium oxide to produce
† Electronic supplementary information (ESI) available. See DOI: carbonates MCO3, which are stable for geological timeframes
10.1039/d0se00190b (over millions of years):
‡ Present address: Fraunhofer Institute for Solar System, Freiburg, Germany.
4482 | Sustainable Energy Fuels, 2020, 4, 4482–4496 This journal is © The Royal Society of Chemistry 2020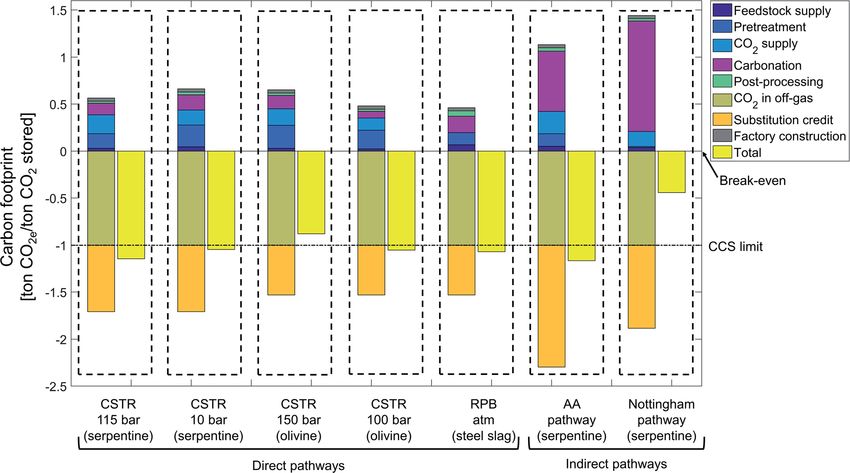
View Article Online
Paper Sustainable Energy & Fuels
MO + CO2 / MCO3 + heat12 (1) LCA to investigate mineralization for land reclamation in Singa-
pore and demonstrate that mineralization has the potential to
The mineralization reaction (1) is thermodynamically favor- reduce GHG emissions. To further increase benets from
able (exergonic) and already occurs in nature. However, the mineralization, process energy demand should be reduced.
mineralization reaction is challenging due to its slow reaction Nduagu et al.35 compared two mineralization pathways to reduce
kinetics. To overcome the slow reaction kinetics, high reaction emissions from a power plant and showed that mineralization of
pressures and temperatures have been recommended13 as well 1 ton CO2 from coal power plant could avoid between 317–483 kg
as mechanical and thermal pretreatment of feedstock14–16 and CO2e. Cuéllar-Franca et al.36 analyzed the results of Khoo et al.33,34
a variety of reaction additives.17 and Nduagu et al.35 in their review of LCA studies and concluded
This article is licensed under a Creative Commons Attribution 3.0 Unported Licence.
While mineralization has already been intensively discussed that the GHG emission reduction of mineralization is sensitive to
for carbon capture and storage,9 more recently, the potential CO2 capture, allocation methods and assumptions for heat
Open Access Article. Published on 30 April 2020. Downloaded on 9/18/2020 7:48:26 PM.
utilization of the mineralization products has been gaining recovery. Cuéllar-Franca et al.36 also point to the potential utili-
attention.18 This shi leads to a new approach: carbon capture and zation of mineralization products but the impacts associated with
utilization (CCU) by mineralization. CCU by mineralization retains utilization were not considered in the LCA yet.
the benets of CCS by mineralization but additionally yields value- As mentioned above, recently, the perspective is changing from
added products. Value-added products increase the economic mineralization for CO2 storage to CO2 utilization for value-added
potential of CCU by mineralization through additional revenues products. In a LCA study, Kelly et al.37 evaluated a brine mineral-
and increase the environmental benets of CCU by mineralization ization plant including utilization of mineralization products such
through the substitution of conventional production. as sodium bicarbonate but concluded that this caustic pathway
The promising potential of mineralization is challenged by the needs to overcome several challenges such as the energy demand
energy required to overcome the slow reaction kinetics. Thus, of sodium hydroxide production and the generation of potentially
most available mineralization studies discuss energy consump- hazardous wastes in form of chlorine or hydrogen chloride. Oh
tion.13,14,19–27 However, to conrm the environmental benets of et al.38 investigated the combination of a caustic mineralization
CCU by mineralization, a comprehensive and systematic assess- with brackish water desalination. The brackish water desalination
ment of environmental impacts is required. Life Cycle Assess- rejects sodium ions that react with CO2 in caustic mineralization
ment (LCA) is a systematic method to assess the environmental to produce sodium bicarbonate. The authors performed a ‘cradle-
impacts of processes by taking into account the entire life cycle of to-gate’ LCA and concluded that the suggested process is not
the product from raw material extraction until the nal waste competitive against carbon capture and geological storage when
disposal.28 Thereby, LCA avoids problem shiing between life- coal-based electricity is used. Kirchofer et al.39 investigated envi-
cycle stages or between environmental impacts.28 ronmental impacts of alkalinity sources on the life cycle energy
For carbon capture and storage, a number of LCA studies have efficiency of mineralization pathways including the utilization of
already been performed for CO2 mineralization. Giannoulakis mineralization products as aggregate for concrete production. The
et al.29 performed a LCA study for a power plant and showed that results showed that reaction yield, heating, mixing, and grinding
the implementation of CCS by mineralization could reduce life are environmental hot-spots, and for a better comparison,
cycle GHG emissions by 15–64% but would increase the levelized detailed simulation of processes is necessary. Pan et al.40 investi-
cost of electricity by 90–370% compared to a reference power gated the engineering, environmental, and economic perfor-
plant without CCS. Xiao et al.30 studied the mineralization of steel mance of a rotary packed-bed reactor for mineralization of steel
slag via several pathways and showed that key factors effecting slag. The mineralization product is used in the cement industry.
the overall process are the particle size of alkaline solid waste, the These authors showed that the environmental impacts can be
rotating speed of the rotary packed bed, the solid/liquid ratio, and substantially reduced by up to 1279 kg CO2e per ton steel slag.
the reaction temperature. In another LCA study, Julcour et al.31 Ghasemi et al.41 performed a LCA study of slurry and wet miner-
investigated the effect of mechanical exfoliation on mineraliza- alization pathways of basic oxygen furnace slag. The mineraliza-
tion to reduce emissions from a power plant. A reduction of the tion product is used as building material. These authors
overall GHG emissions was reached but the additional energy concluded that both pathways are capable of storing CO2 and
consumption required for the process increased other environ- reducing GHG emissions. In a recent LCA study, Di Maria et al.42
mental impacts. Ncongwane et al.32 compared the potential of six compared the environmental impacts of construction blocks from
mineralization processes with pyroxene minerals (platinum carbonated steel slag with block based on Portland cement. The
group metal tailings) as feedstock to reduce GHG emissions and study showed that the blocks from carbonated steel slag can
showed that all processes cause more GHG emissions than they potentially reduce GHG emission in comparison to blocks based
avoid. The study concluded that environmentally benecial on Portland cement. However, the market for steel slag is limited
mineralization processes require higher reaction conversions and and other sources for production of carbonated construction
lower energy demand. Khoo et al.33 simulated a dry mineraliza- blocks should be investigated.
tion pathway and performed a preliminary life cycle assessment. The mentioned LCA studies yield important insights on the
The authors showed that the mineralization pathway can avoid specic processes studied. However, the studies are difficult to
GHG emission; however, conrmation of the results requires compare and lead to inconsistent conclusions due to different
experimental studies that have been hindered “due to various assumptions, system boundaries, and life cycle stages in the
engineering limitations”. In another study, Khoo et al.34 applied LCA analysis.
This journal is © The Royal Society of Chemistry 2020 Sustainable Energy Fuels, 2020, 4, 4482–4496 | 4483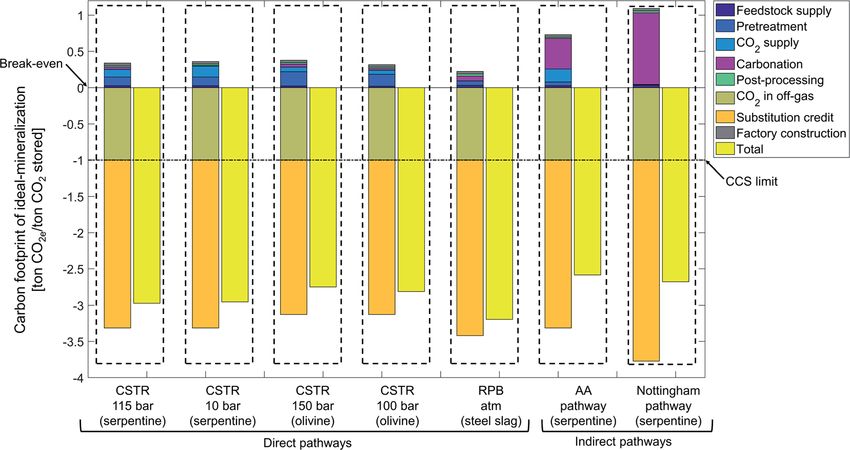
View Article Online
Sustainable Energy & Fuels Paper
In this work, we present a method for consistent life cycle
assessment of carbon capture and utilization by mineralization
(Section 2). The life cycle assessment method is then employed
for the 7 main pathways for CCU by mineralization currently
discussed in literature, described in Section 3, to calculate their
carbon footprint (Section 4). In a state-of-the-art scenario, we
illustrate the current status of CCU by mineralization to reduce
carbon footprint (Section 4.2). An ideal-mineralization scenario
is studied upper bound for the potential reductions by CCU by
This article is licensed under a Creative Commons Attribution 3.0 Unported Licence.
mineralization (Section 4.3). From this analysis, we identify hot-
spots for further investigations (Section 4.4). Fig. 1 System boundaries of carbon capture and utilization by
Open Access Article. Published on 30 April 2020. Downloaded on 9/18/2020 7:48:26 PM.
Our results show that state-of-the-art CCU by mineralization mineralization (CCUM) and carbon capture and storage by minerali-
could reduce carbon footprint by up to 1.17 ton CO2e per ton zation (CCSM).
CO2 stored based on current technologies. For an ideal-
mineralization scenario, carbon footprint could even be
reduced by up to 3.2 ton CO2e per ton CO2 stored. Thus, CCU by be identical for the mineralization and the conventional prod-
mineralization could reduce carbon footprint by more than 1 ucts. The feedstock (rich in magnesium oxide or calcium oxide)
ton CO2e per ton CO2 stored and could thus reduce the carbon enters the system and passes through “Feedstock supply” and
footprint more than CCS. The increased benets are due to the “Pretreatment” stages to “Carbonation” where it reacts with CO2,
fact that CCU by mineralization both stores CO2 and substitutes which comes from the “CO2 supply” stage. In contrast to
conventional products. mineralization for CO2 storage, CO2 utilization sends the
carbonation products to “Post-processing” and “Use” stages.
“Post-processing” includes all processes to prepare the product
2. LCA method for the desired application. In the “Use stage”, the mineralization
product substitutes a conventional product. Products from CO2
Life cycle assessment is a well-established method to analyze
mineralization have been shown to be useable for a variety of
the environmental impacts of products and processes.28 LCA is
applications (see the ESI, Section S2†). In our study, we consider
standardized in ISO 14040/14044.43,44 The ISO standard divides
blended cement as potential product, where CO2 mineralization
LCA into 4 phases: (1) goal & scope denition; (2) life cycle
products serve as cement substitutes to replace conventional
inventory (LCI) analysis; (3) life cycle impact assessment;
cement.45 Blended cement offers a large market size in the giga-
(4) interpretation. In the following, we specify the 4 LCA phases
ton scale with a good price. The life cycle stages are discussed in
and derive our LCA method for carbon capture and utilization
more detail in Section 3.1 and in the ESI, Section S2.†
by mineralization.
Our denition of the functional units makes any CCU tech-
nology inherently multi-functional: on the one hand, a CCU tech-
2.1. Goal & scope denition nology fullls the function specied in the functional unit, i.e.,
The rst phase of LCA states the goal (reason) and the scope storing CO2; on the other hand, the CCU technology has the
(conditions and assumptions) of the study. function to produce a value-added product. Multi-functionality
Functional unit for CCU by mineralization. In LCA, the basis requires special treatment in LCA to distribute the environmental
for comparison is called functional unit (FU) and is a quantitative impacts to the different functions. General LCA guidelines such as
measure for providing a function with a certain performance. All the ISO norm,43 ILCD handbook,28 and CCU-specic guidelines46
results in LCA are presented with respect to the functional unit.28 recommend to include all functions in the functional unit (system
For carbon capture and utilization by mineralization, we identify expansion). However, system expansion does not allow to compute
4 potential functional units (see the ESI, Section S1†). The goal of product-specic footprints. To be able to report technology-specic
the present study is to compare the climate impacts of technol- environmental impacts, we employ system expansion via substi-
ogies for CCU by mineralization and to benchmark them to the tution (avoided burden). For comparative LCAs, the avoided
maximum potential of carbon capture and storage (CCS). We burden approach is mathematically equivalent to system expan-
therefore choose a functional unit of 1 ton of stored CO2. This sion, since the same changes in environmental impacts are
functional unit allows us to compare mineralization pathways computed.47 In the avoided-burden approach, we subtract the
yielding different products on a consistent basis. At the same avoided impacts from additional functions.28
time, our results can be easily compared to previous studies on For CCU by mineralization, the expanded system (Fig. 2a)
mineralization and other CCS technologies. includes of course the mineralization plant that captures CO2
System boundary for CCU by mineralization. The scope of and produces the cement substitute. In this work, the CO2 for
a LCA study is captured by the system boundary. A comparative the mineralization plant is provided by a steel plant. Therefore,
LCA study of mineralization pathways for utilization should the steel plant is also included in the expanded system.
include all life cycle stages from feedstock supply to the use stage Furthermore, the mineralization products partially substitute
where the mineralization product substitutes a conventional cement. To capture this substitution effect, a cement plant is
product (Fig. 1). The remaining life cycle can then be assumed to also included in the expanded system. Thus, the functions of
4484 | Sustainable Energy Fuels, 2020, 4, 4482–4496 This journal is © The Royal Society of Chemistry 2020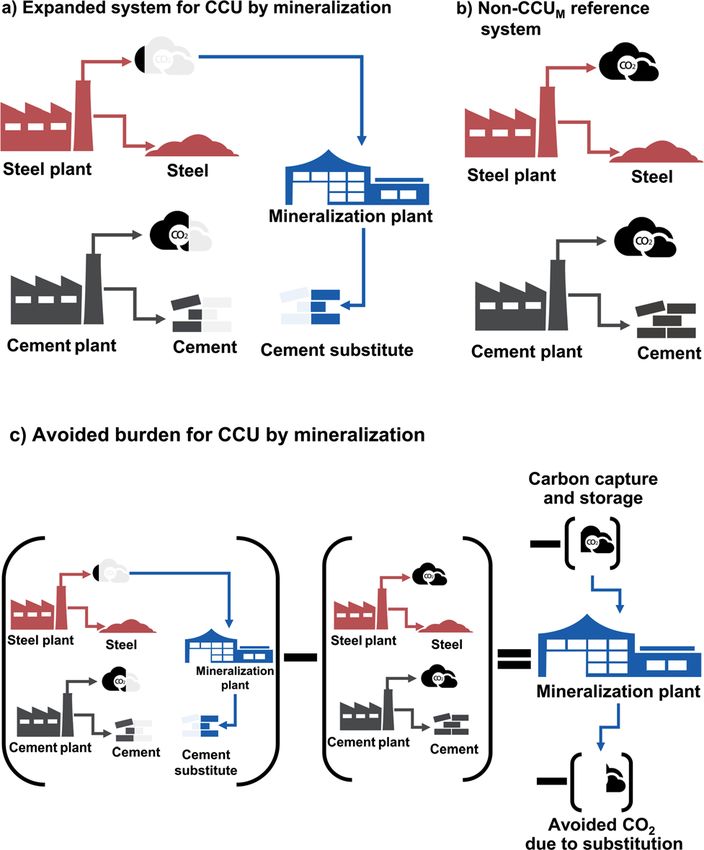
View Article Online
Paper Sustainable Energy & Fuels
An important stage in the life cycle for CCU is the use stage. As
discussed in Section 2.1, we assume for the use stage that the
value-added mineralization product from CCU substitutes
a conventional product. Hereby, we need to account for the fact
that the feedstock of mineralization is usually not 100% pure
magnesium oxide or calcium oxide but rather a natural mineral
or a waste with high percentage of silicon.48 As a result, products
of mineralization are carbonates plus silicates. In our case study,
mineralization products can be mixed with Ordinary Portland
This article is licensed under a Creative Commons Attribution 3.0 Unported Licence.
Cement (OPC) to produce blended cement. Thus, mineralization
products partially substitute ordinary Portland cement.45 The
Open Access Article. Published on 30 April 2020. Downloaded on 9/18/2020 7:48:26 PM.
blended cement with the mineralization products has been
shown to fulll cement standards (e.g., ASTM C150 standard).49
Still, the blended cement has also been shown to reduce
performance for some applications:45 Benhelal et al.45 showed
that blended cement with 10% silicon dioxide (SiO2) from
mineralization has approximately 95% of the performance of
pure ordinary Portland cement. The substitution credit
considered in our study is thus 95% of the environmental
impact due to production of ordinary Portland cement.
Apart from its own performance, the substitution credit could
also be affected by other parameters such as alternative substi-
tution materials or market size.46,50 Due to the uncertainty of
these parameters for the considered novel products from CCU by
mineralization, we analyze these parameters in Section 4.4.
Fig. 2 Definition of avoided burden for carbon capture and utilization
by mineralization (CCUM). “a” shows system expansion for CCU by
mineralization (CCUM, blue) which includes the CO2-source (steel 2.3. Life cycle impact assessment (LCIA)
plant, red) and the substituted cement plant (black) inside the system
boundary. “b” shows the non-CCUM reference system, which has the The third phase of LCA, the life cycle impact assessment,
same functions as the expanded system for CCUM but without the translates the ows from and to the environment determined in
CCUM plant. In “c”, the non-CCUM reference system is subtracted from the life cycle inventory into environmental impacts such as
the expanded system to calculate the avoided burden for CCU by
climate change, fossil resource depletion, and toxicity. Since the
mineralization.
main motivation of CO2 mineralization is the reduction of GHG
emissions, we focus on impacts on climate change for our
the expanded system are: storage of CO2, as well as the
study. The climate change impact is determined according to
production of both steel and cement. To determine the avoided
IPCC following the recommendations for Life Cycle Assessment
impacts from the functions beyond CO2 storage, we dene
of the European Commission.28 To express the climate change
a reference system with the same additional functions but
impacts, we use the standardized methodology of carbon foot-
without CCU by mineralization (non-CCUM). In our case, the
printing.51 The reason for limiting this rst study to a single
reference system is the steel plant without CO2 capture and the
environmental impact is that reductions in climate change
conventional cement plant (Fig. 2b). To calculate the avoided
impacts are the most critical requirement for CO2 mineraliza-
burden (Fig. 2c), we subtract the non-CCUM reference system
tion to be environmentally reasonable. However, other impact
from the expanded system. The resulting reductions in CO2e
categories should be analyzed to assess all environmental
emissions are thus due to the capture and storage of CO2 from
impacts of CO2 mineralization.
the steel plant and due to the substitution of conventional
cement. The resulting carbon footprint represents a compar-
ison between the CCU system and the reference system. A 2.4. Interpretation
negative carbon footprint thus indicates that the CCU system In the fourth phase of LCA, the life cycle inventory and/or life
has less CO2e emissions than the reference system. cycle impact assessment results are interpreted, and uncer-
tainties are investigated.28 Interpretation of our results is
2.2. Life cycle inventory (LCI) provided in Section 4.4.
The second phase of LCA is the life cycle inventory where we
collect all mass and energy balances to compute the ows to 3. Life cycle inventory of CO2
and from the environment. A general description of the mineralization pathways
processes inside each life cycle stage is given in the ESI, Section
S2.† The specic process data employed in this study is dis- To specify the life cycle inventories of our study, rst we
cussed together with the process descriptions in Section 3. describe the considered mineralization pathways in detail
This journal is © The Royal Society of Chemistry 2020 Sustainable Energy Fuels, 2020, 4, 4482–4496 | 4485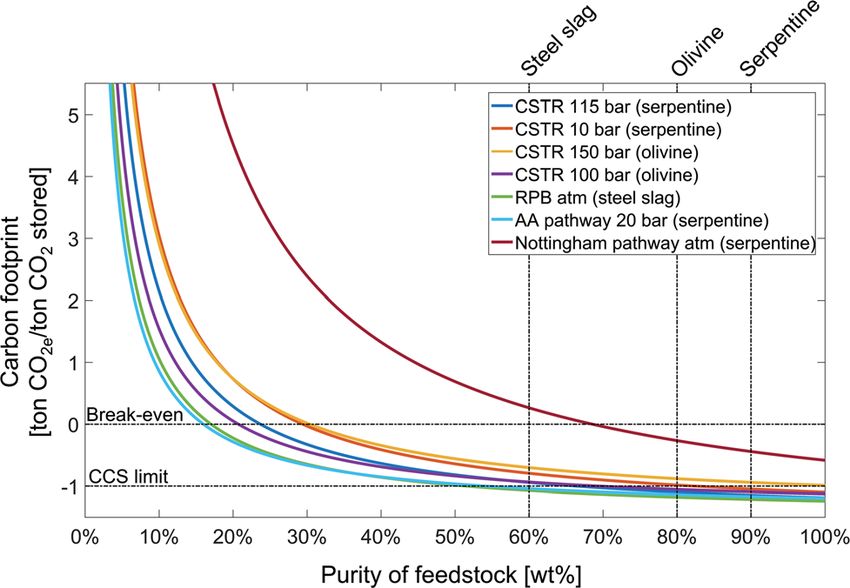
View Article Online
Sustainable Energy & Fuels Paper
(Section 3.1). In Section 3.2, we describe the employed life cycle
inventory data and our scenarios for the LCA calculation.
3.1. Process description of pathways for carbon capture and
utilization by mineralization
LCA requires data on the complete pathway from resource
extraction to the nal product and use stage. In literature, the
focus is mostly on the mineralization reactions themselves and
This article is licensed under a Creative Commons Attribution 3.0 Unported Licence.
oen the studies do not include the entire pathway. In this work,
we extract 7 mineralization pathways from published studies and
Fig. 4 Process flow diagram of carbon capture and utilization by
Open Access Article. Published on 30 April 2020. Downloaded on 9/18/2020 7:48:26 PM.
close the process and/or data gaps to perform a comparative LCA.
mineralization via direct mineralization in CSTR using serpentine
In particular, we consider 2 direct mineralization concepts (with 5 (pathways CSTR 150 bar and CSTR 10 bar; pathway CSTR 10 bar does
pathways) and 2 indirect mineralization concepts (with 2 path- not require CO2 separation). CCSM is carbon capture and storage by
ways). Simply put, direct mineralization concepts directly react mineralization. CCUM is carbon capture and utilization by
CO2 with the feedstock in one step, whereas indirect minerali- mineralization.
zation breaks the process into multiple steps.
(a) Direct concepts
Continuously stirred tank reactor pathways (CSTR pathways). improved using various additives, pretreatments, and reactor
This direct concept uses a continuously stirred tank reactor conditions (pressure, temperature, reaction time, stirring
(CSTR) for mineralization.13 The pretreatment and the reaction speed).13,52–55 For CSTR pathways using serpentine as feedstock,
conditions depend on the feedstock, which allows us to divide we consider the pathway based on O'Connor et al.13 using pure
the CSTR pathways into two categories depending on their CO2 at 115 bar (CSTR 115 bar serpentine) and the pathway
respective feedstock serpentine and olivine. based on Kemache et al.22 using directly off-gas that is
In the olivine pathways (Fig. 3), olivine is mined, crushed, compressed to 10 bar for the mineralization (CSTR 10 bar
and transported to the mineralization plant. In the pretreat- serpentine). For olivine as feedstock, we consider the pathway
ment stage, olivine is prepared via grinding and milling. In the based on O'Connor et al.13 using pure CO2 at 150 bar (CSTR 150
following carbonation stage, the powdered olivine is rst mixed bar olivine) and the pathway based on Eikeland et al.53 using
with water and additives, and subsequently reacted with CO2 pure CO2 at 100 bar (CSTR 100 bar olivine).
from the CO2 supply. The products are transferred to the post- Rotary packed bed pathway (RPB pathway). This direct concept
processing stage, where they are separated and dewatered. uses a rotary packed bed (RPB) for mineralization. The rotary
The solution of water and additives is recycled to the carbon- packed bed pathway commonly employs steel slag as feedstock.56
ation stage, and the products continue to the use stage. In the In the rotary packed bed pathway (Fig. 5), steel slag is rst
use stage, the products substitute ordinary Portland cement. crushed and then transported to the mineralization plant. No
The serpentine pathways (Fig. 4) are identical to the olivine mining is required since steel slag is a by-product of the steel
pathways except for the pretreatment stage. As pretreatment, industry.61 Next, the steel slag is grinded in the pretreatment
serpentine is rst grinded, then iron is separated via magnet stage and mixed with water (or wastewater) in the carbonation
separation. Aerwards, the grinded serpentine is activated via stage to produce a suspension. The suspension enters the
heat treatment. reactor and reacts with the CO2 directly from the off-gas. In the
The main benet of the CSTR pathways is the simple ow- following post-processing stage, the products are dewatered,
sheet which makes scale-up easy. The CSTR pathways have been
Fig. 3 Process flow diagram of carbon capture and utilization by Fig. 5 Process flow diagram of carbon capture and utilization by
mineralization via direct mineralization in CSTR using olivine (pathways mineralization via direct mineralization in rotary packed bed reactor
CSTR 150 bar and CSTR 100 bar). CCSM is carbon capture and storage (RPB) using steel slag. CCSM is carbon capture and storage by
by mineralization. CCUM is carbon capture and utilization by mineralization. CCUM is carbon capture and utilization by
mineralization. mineralization.
4486 | Sustainable Energy Fuels, 2020, 4, 4482–4496 This journal is © The Royal Society of Chemistry 2020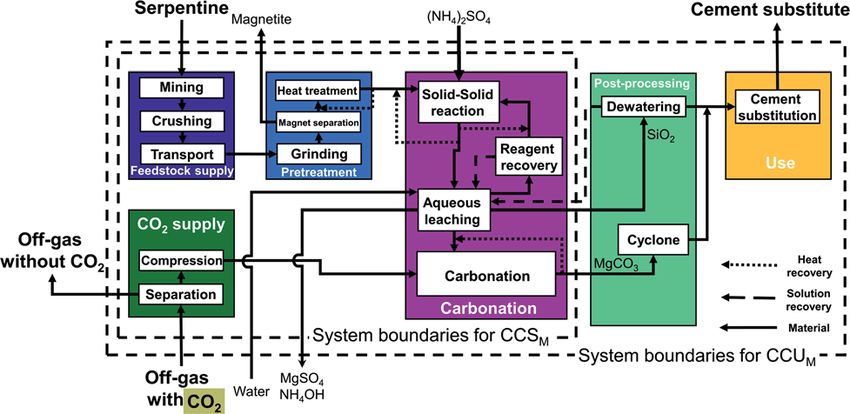
View Article Online
Paper Sustainable Energy & Fuels
and the recovered solution is recycled to the carbonation stage. Nottingham pathway. This indirect concept also proceeds in
Finally, the dewatered products substitute ordinary Portland two steps: rst, aqueous extraction and then aqueous carbon-
cement in the use stage. The benets of the rotary packed bed ation. The Nottingham pathway commonly employs serpentine
pathway are the atmospheric conditions of the reactor (pres- as feedstock. In the Nottingham pathway (Fig. 7), the feedstock
sure, temperature) and the possibility to directly employ off-gas supply and the pretreatment stage are thus also identical to the
with 15–20% CO2 instead of pure CO2, which can lower the CSTR pathways with serpentine (cf. Fig. 4) with the exception of
energy demand. For our study, we consider the pathway based the heat pretreatment: no heat pretreatment is required in the
on Pan et al.57 Nottingham pathway. Serpentine is mined, crushed, trans-
(b) Indirect concepts ported, grinded, and magnetically separated. In the carbon-
This article is licensed under a Creative Commons Attribution 3.0 Unported Licence.
Abo Academy pathway (AA pathway). This indirect concept has ation stage, the grinded serpentine is rst reacted with
two main steps: rst, solid/solid extraction and then carbon- ammonium bisulfate (NH4HSO4) in the aqueous extraction step
Open Access Article. Published on 30 April 2020. Downloaded on 9/18/2020 7:48:26 PM.
ation in a uidized bed. The feedstock of the Abo Academy to produce a magnesium-rich solution and silicon dioxide
pathway is serpentine. In the Abo Academy pathway (Fig. 6), the (SiO2). The magnesium-rich solution and the silicon dioxide are
feedstock supply and pretreatment stage are identical to the then further processed separately:
CSTR pathways with serpentine (cf. Fig. 4), i.e., serpentine is Silicon dioxide (SiO2) is transferred to the post-processing
mined, crushed, transported, grinded, magnetically separated, stage, where it is dewatered. The solution is recycled to reagent
and treated by heat. In the carbonation stage, the activated recovery, and silicon dioxide (SiO2) is transferred to the use stage.
serpentine is rst reacted with ammonium sulfate ((NH4)2SO4) The magnesium-rich solution is transferred to the pH-
in a solid/solid extraction. The products are transferred to an adjustment process, where residues are separated. Aer the
aqueous leaching process where water is added and magnesium pH-adjustment process, the magnesium-rich solution reacts
is leached. The aqueous leaching process splits the process with ammonium bicarbonate (NH4HCO3) to produce carbon-
streams: residues and silicon dioxide (SiO2) are dewatered in ates in the aqueous carbonation step. Ammonium bicarbonate
the post-processing stage. The solution is recycled to the (NH4HCO3) comes from the CO2 supply stage, where CO2 is
carbonation stage, and the silicon dioxide (SiO2) is transferred captured using ammonia (NH3) and water. Aer the aqueous
to use stage. Ammonium sulfate ((NH4)2SO4) in aqueous solu- carbonation step, the produced carbonates are dewatered in the
tion is sent to reagent recovery, where the ammonium sulfate is post-processing stage. Solids are transferred to the use stage.
crystallized and separated from the solution. The ammonium The recovered solution is recycled to the reagent recovery
sulfate in solid phase is reused in the solid/solid extraction. process, where ammonium bisulfate (NH4HSO4) is regenerated
The leached magnesium is sent to the carbonation process. and recycled to the different processes. The regeneration
In the carbonation process, the leached magnesium reacts with process is modelled following Sanna et al.60,61 However, to
the CO2 from the CO2 supply stage in a gas/solid reactor integrate the heat of the regeneration process, vapor recom-
(uidized bed) to produce carbonates. The carbonates are pression is employed here for the steam produced from
separated in the post-processing stage and transferred to the regeneration step such that it can be reused to recover ammo-
use stage. In the use stage, products are mixed (if required) and nium bisulfate. Thus, the resulting electricity demand is higher
substitute ordinary Portland cement. than in Sanna et al.60,61 while the thermal energy demand of the
The advantage of the Abo Academy pathway is the produc- carbonation stage is much lower.
tion of separated and very pure products in each step, which In the use stage, products are mixed (if required) and
avoids separation processes. For our study, we consider the substitute ordinary Portland cement.
pathway based on Fagerlund et al.58,59 The pH of the solution in the Nottingham pathway changes
from the aqueous extraction process to the carbonation process.
Fig. 6 Process flow diagram of carbon capture and utilization by Fig. 7 Process flow diagram of carbon capture and utilization by
mineralization via indirect concept of the Abo Academy pathway (AA mineralization via indirect concept of the Nottingham pathway (pH
pathway) using serpentine. Carbonation takes place in a fluidized bed swing) using serpentine. CCSM is carbon capture and storage by
(FB). CCSM is carbon capture and storage by mineralization. CCUM is mineralization. CCUM is carbon capture and utilization by
carbon capture and utilization by mineralization. mineralization.
This journal is © The Royal Society of Chemistry 2020 Sustainable Energy Fuels, 2020, 4, 4482–4496 | 4487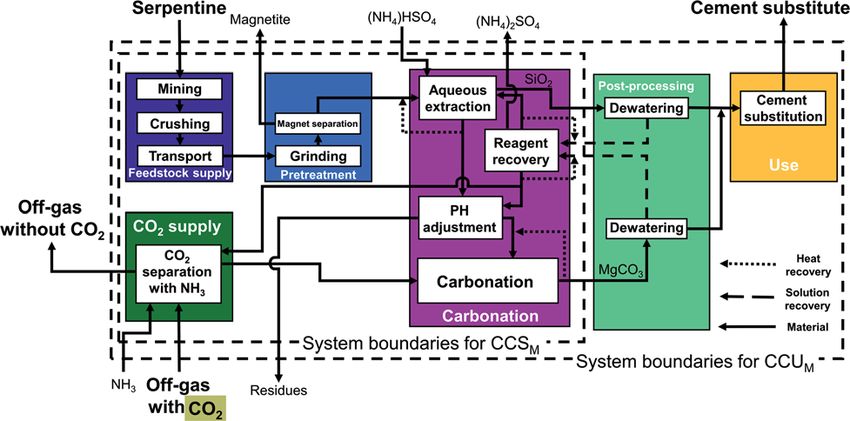
View Article Online
Sustainable Energy & Fuels Paper
Due to this fact, the Nottingham pathway is also known as “pH- ASPEN Plus.77 If the pathway applies directly the off-gas as CO2
swing pathway”. source, only the compression of the off-gas is considered.
The Nottingham pathway has three advantages: the In the carbonation stage, we consider a heat recovery
production of separated and very pure products at each step, the system based on pinch analysis. We assume no credit for
moderate conditions of the reactor (temperature, pressure), and excess thermal energy. The life cycle inventory of additives
the ability to directly employ off-gas (15–20% CO2) instead of and chemicals are based on a LCA database (see the ESI,
pure CO2. These features allow to avoid energy-intensive Section S5†).62,63,78
processes and lower the energy demand of the pathway. For For post-processing, separation of both the aqueous solution
our study, we consider the pathway based on Wang & Maroto- and the mineralization products are calculated based on liter-
This article is licensed under a Creative Commons Attribution 3.0 Unported Licence.
Valer et al.14,19 ature data with an energy demand of 8 kWh per ton.13,18 The
electricity demands of dewatering, classication, and gravity
Open Access Article. Published on 30 April 2020. Downloaded on 9/18/2020 7:48:26 PM.
separation are also based on literature data.18 We assume that
3.2. Background data and scenarios the mineralization plant is located at a cement plant, thus
In this section, we specify the data for the calculation of the life- distance of product transport is zero.
cycle inventories. We divide our data into 3 groups: background For the use stage, we calculate the substitution of ordinary
data, the state-of-the-art scenario, and the ideal-mineralization Portland cement via mineralization products based on perfor-
scenario. mance (Section 2.2).45 The carbon footprint of conventional
Background data. For the energy supply, we use the current ordinary Portland cement is 819 kg CO2e per ton.79
European grid mix, and the required thermal energy is provided State-of-the-art scenario. To illustrate the status of current
directly from natural gas combustion. The LCA data sets for research, we dene the state-of-the-art scenario based on
energy supply are based on the LCA database GaBi (see the ESI, accomplished data. In particular, we employ the highest reac-
Section S6†).62 The construction of the CO2 mineralization tion yields reported in the literature. The accomplished
factory is modeled by a generic dataset for construction of reaction yield is based on laboratory analysis (see the ESI,
a metal industry factory from the LCA database ecoinvent,63 Section S7†).13,14,53,57,59,80 We assume heat recovery based on
which is based on a production capacity of 100 000 ton per year pinch analysis and a minimum temperature difference of
and plant lifetime of 50 years (see the ESI, Section S5†). 10 C.70 90% of the solution is assumed to be recovered based
For the feedstock supply stage, we consider open-pit mines on reported losses of additives that is around 10% in solid/
for olivine and serpentine.23 Based on a study for the economic solution separation (90% solution recovery).13,18 Further, we
feasibility of bulk minerals, the mines are assumed to be within consider conventional CO2 capture using monoethanolamine
260 km radius of the mineralization plant, and the method of (MEA) as solvent.73 MEA technology is one of the most devel-
transport is a truck for the rst 60 km and a train for the next oped technology in CO2 capture and can thus certainly be
200 km.48,64 Feedstock composition is taken from literature: considered as state-of-the-art.73,81
olivine is 80 wt% forsterite and 20 wt% ferrian;65–67 serpentine is Most importantly, we consider only the substitution of
90 wt% lizardit and 10 wt% magnetite,19and steel slag is 60 wt% cement by silicon dioxide (SiO2). According to a recent study,
calcium silicate.68 We assume steel slag of Basic Oxygen Furnace silicon dioxide (SiO2) can have pozzolanic properties and can
(BOF) as a waste stream of the steel industry. Hence, the carbon thus substitute ordinary Portland cement with a 5% decrease in
footprint of incoming steel slag is zero CO2e.40,69 performance.45 The other products of mineralization, magne-
For the feedstock pretreatment stage, we calculate the elec- sium carbonate or calcium carbonate (MgCO3 or CaCO3), are
tricity demand of crushing and grinding (down to 75 mm) via assumed to have no pozzolanic or cementitious properties.
Bond's equation.70 The electricity demand of milling (ner than Thus, no substitution credit is given. However, we study the
75 mm) is based on literature data.13 The thermal energy substitution credit in the sensitivity analysis (Section 4.4).
demand of heat pretreatment is based on literature data, and we Ideal-mineralization scenario. To compute an upper bound
assume the recovery of 80% of the sensible heat from the for the potential of CCU by mineralization, we dene an ideal-
feedstock aer the heat pretreatment.13,15 Based on literature,71 mineralization scenario, where all process inefficiencies are
we assume that magnetite can be magnetically separated from neglected, and all products are utilized completely to substitute
serpentine and the recovered magnetite can substitute iron ore. cement. Thus, we assume 100% reaction yield for all reactions as
Iron ore substitution avoids the environmental impacts of the well as an almost complete process heat integration based on
conventional production of iron ore (data taken from litera- pinch analysis with a minimum temperature difference of 5 C.70
ture72 and LCA database, see the ESI, Section S5†).62,63 Likewise, the complete amount of solution is recovered without
For CO2 supply, we consider a steel plant as the CO2 point any losses of additives or water (100% solution recovery). A CO2
source. If the pathway requires pure CO2, the CO2 is captured capture technology with a novel solvent (2-amino-2-methyl-1-
from the off-gas. The energy demand of the CO2 capture is propanol, AMP), which has a lower energy consumption than
based on literature data.73–76 The electricity demand of CO2 MEA solvent, is assumed (low emission CO2 capture).75 Most
compression is calculated individually for each pathway importantly, all mineralization products (silicon dioxide plus
through process simulation. We consider a multi-stage magnesium carbonate or calcium carbonate, SiO2 + MgCO3 or
compressor with a polytropic efficiency of 80%, a compression CaCO3) are assumed to substitute ordinary Portland cement 1 : 1
ratio of maximum 2 and an intercooler aer each stage, in on mass basis (100% substitution).
4488 | Sustainable Energy Fuels, 2020, 4, 4482–4496 This journal is © The Royal Society of Chemistry 2020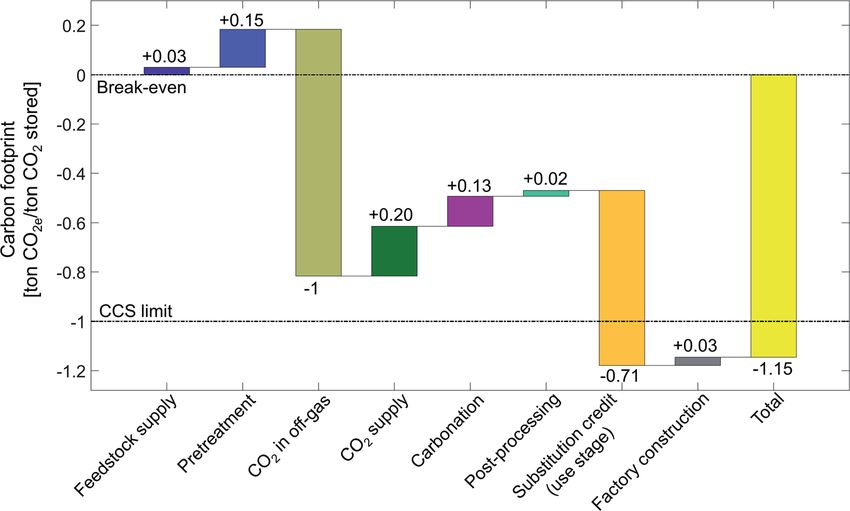
View Article Online
Paper Sustainable Energy & Fuels
4. Carbon footprint of CCU by CO2 supply stage, which adds +0.20 ton CO2e per ton CO2
stored, as CO2 capture and compression is an energy-intensive
mineralization process. The next large positive contributions to the carbon
To illustrate our LCA method, we rst present the carbon footprint come from the carbonation stage and the pretreat-
footprint for the aqueous mineralization in CSTR at 115 bar ment with +0.13 ton CO2e per ton CO2 stored and +0.15 ton CO2e
using serpentine in detail. In Sections 4.2 and 4.3, we show the per ton CO2 stored, respectively. The carbonation stage emits
carbon footprints for all 7 CCU by mineralization pathways in CO2e despite being exergonic as a result of the carbon footprint
a more condensed form. of additives, heat losses, pumping, etc., which offset the effect of
exergonic reaction. The carbon footprint of the pretreatment
This article is licensed under a Creative Commons Attribution 3.0 Unported Licence.
stage is due to the high energy demand of grinding and heat
4.1. Carbon footprint of CSTR 115 bar pathway using pretreatment. Smaller contributions to the carbon footprint of
Open Access Article. Published on 30 April 2020. Downloaded on 9/18/2020 7:48:26 PM.
serpentine CCU by mineralization are due to post-processing (+0.02 ton
By applying the presented LCA method for CCU by minerali- CO2e per ton CO2 stored), feedstock supply (+0.03 ton CO2e per
zation (Section 2), we calculate the carbon footprint of the CSTR ton CO2 stored) and factory construction (+0.03 ton CO2e per ton
115 bar pathway for the state-of-the-art scenario (Fig. 8). CO2 stored). We present the life cycle inventory data in more
The total carbon footprint by mineralization and utilization detail in the ESI, Sections S8 and S9.†
of 1 ton CO2 is negative with a value of 1.15 ton of CO2e. The To contextualize the carbon footprint of CCU by minerali-
negative carbon footprint means that the CCU system (Fig. 2a) zation pathways, we dene a break-even target and the CCS
has less emissions than the reference system (Fig. 2b) since the limit (Fig. 8). Break-even is achieved when the avoided CO2e
CCU system avoids more CO2e emissions than it produces. CCU emissions equal to CO2e emissions caused throughout the life-
by mineralization avoids CO2e emissions by two mechanisms: cycle such that the total carbon footprint is zero. Thus, a nega-
(1) by removing and converting CO2 from the off-gas and (2) by tive carbon footprint shows that the CCU pathway (Fig. 2a) has
substituting cement. The CO2 reacted by mineralization is lower GHG emissions than the reference system (Fig. 2a).
permanently stored in stable magnesium carbonate (MgCO3). However, a negative carbon footprint does not mean that CCU
Furthermore, without the mineralization plant, the CO2 in the by mineralization is carbon negative from cradle-to-grave.82
off-gas would be emitted from the steel plant into the atmo- The CCS limit illustrates the maximum potential of carbon
sphere (cf. Section 2.1). Thus, the 1 ton of CO2 stored from off- capture and storage (CCS) technologies without utilization. A
gas reduces the carbon footprint by 1 ton CO2e. The uptake from CCS technology reaches its maximum potential for reductions
CO2 is the largest contribution to the carbon footprint. The of CO2e emissions if the CCS process does not cause any direct
second largest contribution to the reduction in the carbon or indirect CO2e emissions while capturing and storing 1 ton
footprint is the product substitution with a value of 0.71 ton CO2. The carbon footprint of such an ideal CCS process would
CO2e per ton CO2 stored. be 1 ton CO2e. The carbon footprint of a CCU technologies can
All other life cycle stages increase the carbon footprint of be theoretically better than the CCS limit. This advantage is due
CCU by mineralization. The largest contribution is due to the to the substitution credit in the “use stage”. With the
Fig. 8 Carbon footprint of CSTR 115 bar using serpentine for state-of-the-art scenario. Carbon footprint contribution of each life cycle stage is
shown as separate bar. Break-even is where the avoided CO2e emissions is equal to CO2e emissions caused throughout the life-cycle such that
the total carbon footprint is zero. CCS limit is the maximum potential of CCS technologies.
This journal is © The Royal Society of Chemistry 2020 Sustainable Energy Fuels, 2020, 4, 4482–4496 | 4489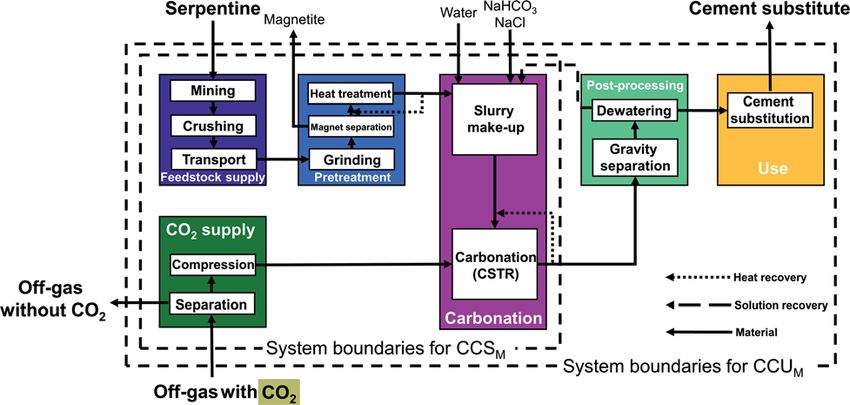
View Article Online
Sustainable Energy & Fuels Paper
substitution credit, CCU by mineralization can avoid more than the substitution credit. Due to the lower reaction yield of the
1 ton CO2e per ton CO2 captured. second carbonation step, indirect pathways require more
product from the rst carbonation step, which increases the
production of silicon dioxide (SiO2) thus the substitution credit.
4.2. Carbon footprint of CCU by mineralization pathways for Except for the substitution credit and storing CO2, all other
the state-of-the-art scenario life cycle stages increase the carbon footprint of the CCU by
The state-of-the-art scenario illustrates the status of current mineralization. For most pathways, the largest contribution to
research and is based on accomplished rates in laboratory for the carbon footprint is due to the carbonation stage, which vary
all considered CCU pathways (Fig. 9). from +72 to +1175 kg CO2e per ton CO2 stored. This variation
This article is licensed under a Creative Commons Attribution 3.0 Unported Licence.
CCU by mineralization avoids up to 1.17 ton CO2e per ton shows the strong dependence of the carbon footprint on the
CO2 stored, which is the carbon footprint of the indirect Abo employed carbonation process. Carbonation for CSTR 100 bar
Open Access Article. Published on 30 April 2020. Downloaded on 9/18/2020 7:48:26 PM.
Academy pathway using serpentine. Overall, 5 pathways has a small contribution to the carbon footprint due to the
(CSTR 115 bar, CSTR 10 bar, CSTR 100 bar, rotary packed bed exergonic nature of the reaction. In contrast, in the indirect
and Abo Academy pathway) avoid more emissions than just pathways, the carbonation stage has a much higher contribu-
storing CO2. tion to the carbon footprint (e.g., +72 kg CO2e per ton CO2 stored
All pathways avoid CO2e emissions by storing CO2 and by for the direct CSTR100 pathway vs. 1175 kg CO2e per ton CO2
substituting cement. Since the stored CO2 is the functional unit stored for the indirect Nottingham pathway). This difference
of our study, all pathways reduce CO2e by 1 ton CO2e by CO2 from can be traced back to energy-intensive processes, such as
the off-gas. The credit for substituting cements ranges from 0.53 reagent recovery, that are specic to the indirect pathways. To
to 1.3 ton CO2e per ton CO2 stored. The variation in the substi- avoid the reagent recovery but benet from benets of the
tution credits is due to variation of the product mass, which are indirect pathways, Park and Fan83 introduced a mineralization
in turn caused by the diverse feedstock and reaction routes of the concept with CO2 as an extraction agent.
pathways. The substitution credit of the indirect pathways is The second largest positive contribution to the carbon foot-
always higher than for the direct pathways. The reason is our print is oen the CO2 supply stage, which also varies substan-
functional unit of 1 ton CO2 stored which means that 1 ton of tially between the pathways. The pathways that require pure
CO2 is reacted in the carbonation process. In indirect pathways, CO2 (CSTR 115 bar, CSTR 150 bar, CSTR 100 bar, and Abo
silicon dioxide (SiO2) is produced in the rst carbonation step Academy pathway) have higher CO2e emissions (range from 130
and CO2 is reacted in the second carbonation step. Silicon to 237 kg CO2e per ton CO2 stored) in the CO2 supply stage than
dioxide (SiO2) can substitute cement, thus more SiO2 increases pathways operating directly with off-gas (rotary packed bed,
Fig. 9 Carbon footprint of the 7 CCU by mineralization pathways for state-of-the-art scenario. For each pathway, the left bar shows the
contribution of each life cycle stage and the right bar shows the total carbon footprint of the pathway. Break-even is where the avoided CO2e
emissions is equal to CO2e emissions caused throughout the life-cycle such that the total carbon footprint is zero. CCS limit is the maximum
potential of CCS technologies. RPB – rotary packed bed, AA – Abo Academy.
4490 | Sustainable Energy Fuels, 2020, 4, 4482–4496 This journal is © The Royal Society of Chemistry 2020View Article Online
Paper Sustainable Energy & Fuels
CSTR 10 bar and Nottingham range from 0.1 to 160 kg CO2e per pretreatment, which cause 243 kg CO2e per ton CO2 stored.
ton CO2 stored). Note that for the pathways that require pure Thus, the carbon footprint without heat pretreatment is 90 kg
CO2 (CSTR 115 bar, CSTR 150 bar, CSTR 100, bar and Abo CO2e per ton CO2 stored higher. This analysis shows that heat
Academy pathway), the excess heat generated in the carbon- pretreatment cannot be excluded in general for CCU by
ation stage is integrated into the CO2 supply stage and reduces mineralization pathways.
the need for external energy supply. We present the life cycle The post-processing, factory construction and feedstock
inventory data of the considered CCU by mineralization path- supply stage cause relatively few CO2e emissions in all pathways,
ways in the ESI, Sections S8 and S9.† ranging from 22 to 67 kg CO2e per ton CO2 stored, respectively.
In literature, the pretreatment stage is one of the most dis-
This article is licensed under a Creative Commons Attribution 3.0 Unported Licence.
cussed subjects in mineralization.84 Indeed, the carbon foot-
print of the pretreatment stage varies strongly depending on: 4.3. Carbon footprint of CCU by mineralization pathways for
Open Access Article. Published on 30 April 2020. Downloaded on 9/18/2020 7:48:26 PM.
The particle size: decreasing the particle size from 75 mm to the ideal-mineralization scenario
10 mm adds 91 kg CO2e per ton feedstock to the carbon footprint The ideal-mineralization scenario neglects all process ineffi-
(Nottingham pathway vs. CSTR 100 bar). ciencies and utilizes the entire product, so that an upper bound
The necessity of heat pretreatment, which adds 31 kg CO2e on the potential of CCU by mineralization can be determined
per ton feedstock to the carbon footprint (Nottingham vs. Abo (Fig. 10).
Academy pathway). For the ideal-mineralization scenario, the carbon footprint
In general, direct pathways require a more intensive due to mineralization of 1 ton CO2 ranges from 2.6 to 3.2 ton
pretreatment than indirect pathways because the indirect CO2e. The carbon footprint reduction is thus much higher than
pathways benet from chemical leaching, which accelerates in the state-of-the-art scenario. This increase is due to the
carbonation. The pathways that require a heat pretreatment or increased amounts of CO2e avoided by substitution and the
a ner particle size have a higher carbon footprint for decreased carbon footprint of all processing stages.
pretreatment. Heat pretreatment is an energy-intensive From the two mechanisms to avoid CO2e emissions, the
process and could offset the benets of CCU by mineraliza- amount of stored CO2 is by denition the same as in the state-
tion. Thus, some researchers have proposed to disregard of-the-art scenario, but the substitution credit increases
pathways that required heat pretreatment.85 To assess this substantially to 2.1 to 2.7 ton CO2e per ton CO2 stored. The
proposition, we can compare the carbon footprint of the substitution credit increases since we assume that all products
pretreatment stage for the pathways CSTR 115 bar and CSTR can be employed as cement substitutes: not only silicon dioxide,
150 bar. In the CSTR 115 bar pathway using serpentine, heat but also magnesium or calcium carbonate (SiO2 + MgCO3 or
pretreatment is applied to the feedstock, and the carbon CaCO3). In this way, the substitution credit increases. However,
footprint of the pretreatment stage is 153 kg CO2e per ton CO2 it should be pointed out that this assumption would require
stored. On the other hand, the CSTR 150 bar pathway using a massive development in product properties. This analysis
olivine requires extra grinding and milling for feedstock shows that this development would be highly desirable.
Fig. 10 Carbon footprint of the 7 CCU by mineralization pathways for the ideal-mineralization scenario. For each pathway, the left bar shows the
contribution of each life cycle stage, and the right bar shows the total carbon footprint. Break-even is where the avoided CO2e emissions are
equal to CO2e emissions caused throughout the life-cycle such that the total carbon footprint is zero. CCS limit is the maximum potential of CCS
technologies. RPB – rotary packed bed, AA – Abo Academy.
This journal is © The Royal Society of Chemistry 2020 Sustainable Energy Fuels, 2020, 4, 4482–4496 | 4491View Article Online
Sustainable Energy & Fuels Paper
Fig. 10 shows also a massive reduction of CO2e emissions for purities lower than 50%. The dependence on feedstock purity is
all other stages. This reduction is due to the higher reaction mainly determined by the energy demand of the pathway. As
yield, higher heat recovery, and higher solution recovery as well a result, the Nottingham pathway shows a stronger dependence
as the high efficiency CO2 capture technology, which all reduce on feedstock purity than the other pathways and crosses the
the energy or material demand, and consequently decrease break-even line at the feedstock purity of approximately 68%.
carbon footprint. For a feedstock purity lower than 20%, just the Abo Academy
Overall, the upper bound on the CO2e emissions avoided by and the rotary packed bed pathways still reduce GHG emissions
CCU by mineralization is 2.6 to 3.2 times higher than just storing as indicated by the negative carbon footprint.
CO2. Even though the ideal-mineralization scenario will not be The sensitivity analysis on the carbon footprint of the elec-
This article is licensed under a Creative Commons Attribution 3.0 Unported Licence.
achievable in practice, the calculation shows the large potential tricity supply (see the ESI, Section S3†) shows that decreasing the
of CCU by mineralization and the signicant opportunities to carbon footprint of electricity supply decreases the carbon
Open Access Article. Published on 30 April 2020. Downloaded on 9/18/2020 7:48:26 PM.
improve the process itself and the product properties. footprint of all mineralization pathways. The minimum carbon
footprint is reached for an electricity supply with zero emissions
and ranges from 1.41 ton CO2e per ton CO2 stored for the
4.4. Sensitivity analysis for the state-of-the-art scenario
CSTR 150 bar pathway to 2.20 ton CO2e per ton CO2 stored for
The preceding analysis xed the feedstock, the carbon footprint the Abo Academy pathway. The order of the pathways stays
of the electricity supply, and the location of the mineralization practically the same with the exception of the Nottingham
plant. To investigate the impact of these parameters, we perform pathway which has the largest carbon footprint in the state-of-
a sensitivity analysis. The results also show the important role of the-art scenario and the second smallest for zero-carbon elec-
the substitution credit for the carbon footprint. Thus, we also tricity due to its higher energy demand. Still, for all minerali-
perform a sensitivity analysis on the substitution credit. zation pathways, the dependence on electricity supply is much
Feedstock purity. Most of the mineralization feedstock are smaller than observed for other CCU pathways depending on
not 100% pure, and the purity can vary strongly depending on water electrolysis for hydrogen production.86
the feedstock source.67 The purity of the feedstock has a strong For the feedstock transport distance (see the ESI, Section S4†),
effect on the carbon footprint of CCU by mineralization the effect on the carbon footprint is moderate for all pathways
(Fig. 11). for CCU by mineralization. Doubling the transport distance to
Low feedstock purity increases the amounts of solid 520 km increases the carbon footprint at most by 60 kg CO2e per
handling and treatment, which consequently increases the ton CO2 stored for the rotary packed bed pathway. Beyond 1000
energy demand and thus the carbon footprint of CCU by km transport distance, the effect of feedstock transport distance
mineralization pathways. For all pathways, the carbon footprint on the carbon footprint becomes negligible since long distance
is inversely proportional to feedstock purity. The carbon foot- transports typically employs efficient cargo ships.
print of the CCU by mineralization pathways increases moder- Substitution credit. As the results showed (Sections 4.2 and
ately from 100% until approximately 50% feedstock purity, 4.3), substitution credit is a major contribution to the carbon
however, the carbon footprint increases rapidly for feedstock footprint of CCU by mineralization. The substitution credit
itself depends strongly on product performance. In most
previous studies,39,40 it has been assumed that the substitution
credit is equal to the environmental impacts of conventional
production of the substituted product (1 : 1 credit). However,
the performance of new products can differ from the conven-
tional product. Therefore, the 1 : 1 substitution can be
misleading. Here, we employed a substitution factor of 95%
based on experimental ndings on performance of blended
cement.45
To determine the substitution credit for mineralization
products in general, we present a workow (Fig. 12): The central
question is how the new product performs in comparison to the
conventional product. The performance can be the same, better
or worse. If the performance is the same, the substitution credit
is indeed equal to the environmental impact of the conventional
product (1 : 1 credit). If the performance is better, the substi-
Fig. 11 Carbon footprint of the 7 CCU by mineralization pathways as tution credit is still 1 : 1 if the higher performance of the new
function of feedstock purity for the state-of-the-art scenario. Break- product is not benecial for its function. In contrast, if the
even is where the avoided CO2e emissions are equal to CO2e emissions higher performance of the new product is benecial for its
caused throughout the life-cycle such that the total carbon footprint is
function (e.g., less mass required for the same material
zero. CCS limit is the maximum potential of CCS technologies. The
feedstock purity assumed in the state-of-the-art scenario is also strength), the substitution credit should measure this increase
marked with 60% for steel slag, 90% for serpentine, and 80% for in performance (percentage credit, e.g., for reduced reference
olivine. RPB – rotary packed bed, AA – Abo Academy. ow to achieve the same function). If the performance is worse,
4492 | Sustainable Energy Fuels, 2020, 4, 4482–4496 This journal is © The Royal Society of Chemistry 2020You can also read