Maui Energy Storage Study - SANDIA REPORT
←
→
Page content transcription
If your browser does not render page correctly, please read the page content below
SANDIA REPORT
SAND2012-10314
Unlimited Release
Printed December 2012

Maui Energy Storage Study
James Ellison, Dhruv Bhatnagar, and Benjamin Karlson

Prepared by
Sandia National Laboratories
Albuquerque, New Mexico 87185 and Livermore, California 94550

Sandia National Laboratories is a multi-program laboratory managed and
operated by Sandia Corporation, a wholly owned subsidiary of Lockheed
Martin Corporation, for the U.S. Department of Energy's National Nuclear
Security Administration under contract DE-AC04-94AL85000.

Approved for public release; further dissemination unlimited

.
Issued by Sandia National Laboratories, operated for the United States Department of Energy by
Sandia Corporation.

NOTICE: This report was prepared as an account of work sponsored by an agency of the United
States Government. Neither the United States Government, nor any agency thereof, nor any of
their employees, nor any of their contractors, subcontractors, or their employees, make any
warranty, express or implied, or assume any legal liability or responsibility for the accuracy,
completeness, or usefulness of any information, apparatus, product, or process disclosed, or
represent that its use would not infringe privately owned rights. Reference herein to any specific
commercial product, process, or service by trade name, trademark, manufacturer, or otherwise,
does not necessarily constitute or imply its endorsement, recommendation, or favoring by the
United States Government, any agency thereof, or any of their contractors or subcontractors. The
views and opinions expressed herein do not necessarily state or reflect those of the United States
Government, any agency thereof, or any of their contractors.

Printed in the United States of America. This report has been reproduced directly from the best
available copy.

Available to DOE and DOE contractors from
         U.S. Department of Energy
         Office of Scientific and Technical Information
         P.O. Box 62
         Oak Ridge, TN 37831

         Telephone:         (865) 576-8401
         Facsimile:         (865) 576-5728
         E-Mail:            reports@adonis.osti.gov
         Online ordering:   http://www.osti.gov/bridge

Available to the public from
         U.S. Department of Commerce
         National Technical Information Service
         5285 Port Royal Rd.
         Springfield, VA 22161

         Telephone:         (800) 553-6847
         Facsimile:         (703) 605-6900
         E-Mail:            orders@ntis.fedworld.gov
         Online order:      http://www.ntis.gov/help/ordermethods.asp?loc=7-4-0#online

                                                2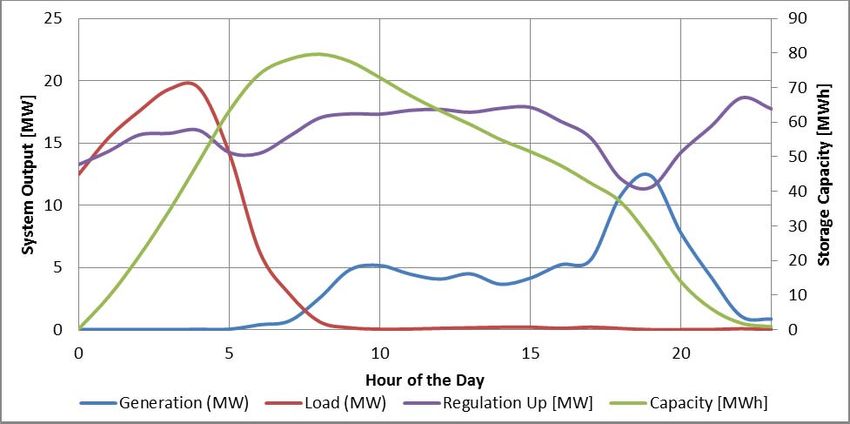
SAND2012-10314
                                  Unlimited Release
                               Printed December 2012

          Maui Energy Storage Study

                         James Ellison and Dhruv Bhatnagar
                      Energy Storage and Transmission Analysis

                                 Benjamin Karlson
                              Wind Energy Technologies

                            Sandia National Laboratories
                                   P.O. Box 5800
                       Albuquerque, New Mexico 87185-1124

                                       Abstract

This report investigates strategies to mitigate anticipated wind energy curtailment on
Maui, with a focus on grid-level energy storage technology. The study team
developed an hourly production cost model of the Maui Electric Company (MECO)
system, with an expected 72 MW of wind generation and 15 MW of distributed
photovoltaic (PV) generation in 2015, and used this model to investigate strategies
that mitigate wind energy curtailment. It was found that storage projects can reduce
both wind curtailment and the annual cost of producing power, and can do so in a
cost-effective manner. Most of the savings achieved in these scenarios are not from
replacing constant-cost diesel-fired generation with wind generation. Instead, the
savings are achieved by the more efficient operation of the conventional units of the
system. Using additional storage for spinning reserve enables the system to decrease
the amount of spinning reserve provided by single-cycle units. This decreases the
amount of generation from these units, which are often operated at their least efficient
point (at minimum load). At the same time, the amount of spinning reserve from the
efficient combined-cycle units also decreases, allowing these units to operate at
higher, more efficient levels.

                                           3
ACKNOWLEDGMENTS
This study was conducted with funding from the U.S. Department of Energy (DOE). The
authors wish to express appreciation to DOE’s Office of Electricity, and to Dr. Imre Gyuk,
manager of the Energy Storage Program, for their support.

The authors would like to thank the Maui Electric Company (MECO) and the Hawaiian Electric
Company (HECO) for their partnership and support of this effort. Without their willingness to
share data and participate, this study could not have happened. We appreciate the support of Ed
Reinhardt, then the President of MECO, at the onset of this study.

We would like to thank Mat McNeff at MECO for his leadership and commitment throughout
this project, and Marc Matsuura and Dean Oshiro at HECO for their guidance and input. Grant
Imamura and Gemini Yau at HECO and Steven Rymsha at MECO also contributed to this
project, as did others at HECO and MECO that we have neglected to name here. In addition, we
appreciate the input and guidance of Leon Roose, now with the Hawaiian Natural Energy
Institute (HNEI).

                                               4
CONTENTS

EXECUTIVE SUMMARY ............................................................................................................ 9
BACKGROUND AND STUDY SCOPE ..................................................................................... 13
  The MECO Problem ............................................................................................................... 13
  Analysis Approach .................................................................................................................. 14
  Study Methodology Strengths and Limitations ...................................................................... 15
  System Review Relevant to the Problem ................................................................................ 16
  Previous and Current Studies .................................................................................................. 17
STUDY SCENARIOS AND RESERVE REQUIREMENTS ...................................................... 19
  Study Scenarios ....................................................................................................................... 19
  Reserve Requirements ............................................................................................................ 22
RESULTS ..................................................................................................................................... 27
  Summary Results .................................................................................................................... 27
  Individual Scenario Discussion............................................................................................... 33
        10-MW/15-MWh BESS ............................................................................................... 33
        10-MW/70-MWh BESS ............................................................................................... 34
        10-MW/70-MWh BESS, no K4 ................................................................................... 34
        25-MW Waena ............................................................................................................. 35
        25-MW/175-MWh BESS ............................................................................................. 35
        25-MW/1200-MWh Cryogen Storage.......................................................................... 36
        30-MW Waena + 5-MW/35-MWh BESS .................................................................... 37
        35-MW Waena + Transmission Line ........................................................................... 37
CONCLUSIONS........................................................................................................................... 39
REFERENCES ............................................................................................................................. 41
APPENDIX A: Model Verification ............................................................................................. 43
APPENDIX B: Storage Modeling ............................................................................................... 45
APPENDIX C: Three-Day dispatch results ................................................................................. 47
APPENDIX D: Load, Reserve, and Renewable Generation Characterization ............................ 57
APPENDIX E: Added Resource Operations ................................................................................ 61
APPENDIX F: Sensitivity Analysis ............................................................................................ 67

                                                                       5
FIGURES
Figure 1. Daily load and generation stack example for Maui. ......................................................13
Figure 2. Status quo versus proposed spinning reserves requirements.........................................23
Figure 3. Proposed spinning reserves specification vs. formula used in analysis. .......................24

                                                            TABLES
Table 1. Wind Curtailment by Scenario. ......................................................................................10
Table 2. Scenario Generation Cost (million USD) and Project Economic Analysis. ...................10
Table 3. Study Scenarios...............................................................................................................19
Table 4. Status Quo Spinning Reserves Requirement. .................................................................22
Table 5. “New” Spinning Reserves Requirement Approximation. ..............................................24
Table 6. Wind Curtailment (in percent) by Scenario. ...................................................................27
Table 7. Wind Generation (in GWh) by Scenario. .......................................................................28
Table 8. Scenario Generation (in GWh) by Fuel Type. ................................................................29
Table 9. Annual System Savings From Scenario Projects. ...........................................................30
Table 10. Breakdown of Annual System Savings. .......................................................................31
Table 11. Scenario Project Evaluation ..........................................................................................32

                                                                   6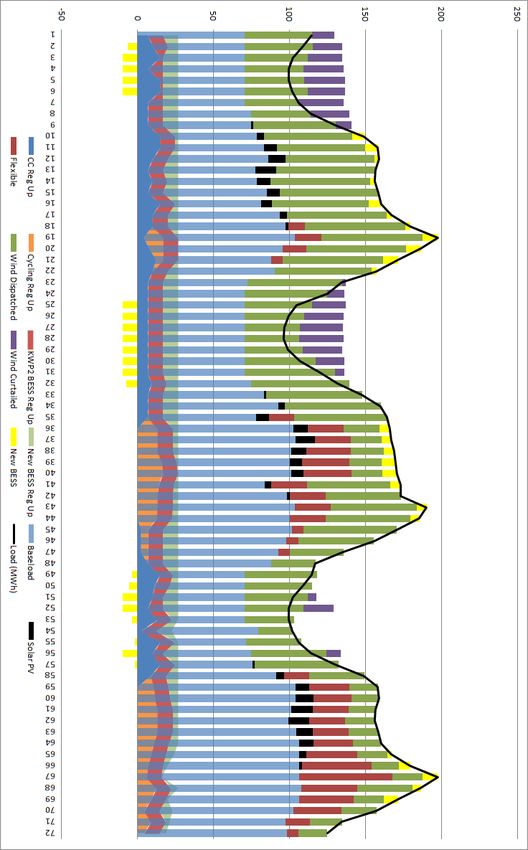
NOMENCLATURE
BESS   Battery Energy Storage System

DOE    Department of Energy

GE     General Electric
GWh    gigawatt-hour

HC&S   Hawaiian Commercial and Sugar Company
HECO   Hawaiian Electric Company
HNEI   Hawaiian Natural Energy Institute

IPP    Independent Power Producer

KPP    Kahului Power Plant
kV     kilovolt
kVAR   kilovolt-amperes reactive
kW     kilowatt
kWh    kilowatt-hour

MECO   Maui Electric Company
MPP    Maalaea Power Plant
MVAR   megavolt-amperes reactive
MW     megawatt
MWh    megawatt-hour

NPV    net present value
NREL   National Renewable Energy Laboratory

PPA    Power Purchase Agreement
PV     photovoltaic

SIS    Solar Integration Study
SNL    Sandia National Laboratories

VO&M   variable operation and maintenance

WIS    Wind Integration Study

                                       7
8
EXECUTIVE SUMMARY
The Department of Energy funded Sandia National Laboratories to investigate strategies to
mitigate anticipated wind curtailment on Maui, with a focus on evaluating the impact of grid-
level energy storage. The installed wind capacity will increase from the existing 30 MW to a
planned 72 MW by 2015. Previous studies have indicated that the levels of curtailment on Maui
are likely to be significant [1].
This bulk power system study uses hourly production cost modeling to evaluate the operation of
the Maui Electric Company (MECO) system in 2015. Wind, solar, and load data used are the
same as those being used for the ongoing Solar Integration Study (SIS) being conducted by the
National Renewable Energy Laboratory and General Electric for the Hawaiian Electric Company
(HECO) [2]. MECO provided data on the planned makeup of the generation fleet in 2015, and
on the generator characteristics. In addition, the model used for this study was calibrated against
the HECO’s P-Month generation planning model to ensure that it accurately reflects the MECO
dispatch order.

Study scenarios were developed collaboratively with MECO and HECO personnel. Of the eight
scenarios, five add an energy storage system to the reference case, two add a reciprocating
engine plant running on biodiesel, and one combines an energy storage system with a new
reciprocating engine biodiesel plant.1

All of the scenarios maintain or increase the level of installed capacity on the Maui grid. The
installed capacity is kept the same by changing the use of the Kahului Power Plant (or KPP)
units. The must-run status of the KPP units is currently necessary to maintain active and reactive
power on the low-voltage side of the Maui electric grid in the event of a transmission
interconnect contingency. Designating KPP as must-run, however, results in an increase in wind
curtailment. Any scenario reducing KPP generation must allow for sufficient active and reactive
power on the low-voltage side of the network in the event of a contingency.

The level of regulation up (or “spinning”) reserves plays an important role in this analysis as the
regulation requirement is tied proportionally to the renewable energy generation accepted onto
the grid. The more spinning reserve required, the greater the likelihood that additional
generators will need to be brought online to provide that reserve. This additional generation can
cause wind to be curtailed. In order to provide comparability with the ongoing SIS for Hawaii,
this study uses an approximation of the new regulation up requirement as proposed by that
project.

Table 1 indicates the level of wind curtailment resulting from the modeling of each scenario.
The scenario name reflects the storage or other mitigation project that was added to the reference
scenario. The scenarios are not cumulative – in other words, the scenario “10-MW/70-MWh
BESS” examines a 10-MW/70-MWh Battery Energy Storage System (BESS) added to the
reference case, and does not contain the 10-MW/15-MWh BESS examined in the previous
scenario. The “KPP” column shows the operation of the KPP units in each scenario.

1
    Pumped storage hydro was not considered, as MECO/HECO personnel stated that such a plant could not
    possibly be permitted, constructed, and in operation by 2015. It was therefore not a feasible option for this study.

                                                           9
Table 1. Wind Curtailment by Scenario.
Scenario KPP WindGen1 WindGen2 WindGen3 TOTAL
Reference Run available 4.1% 14.3% 36.1% 16.5%
10-MW/15-MWh BESS available 3.0% 11.7% 31.8% 14.0%
10-MW/70-MWh BESS available 1.2% 6.6% 24.1% 9.5%
10-MW/70-MWh BESS, no K4 no K4 1.1% 4.6% 18.3% 7.1%
25-MW Waena no K3/K4 2.1% 7.3% 24.1% 10.1%
25-MW/175-MWh BESS no K3/K4 0.3% 1.0% 6.5% 2.3%
25-MW/1200-MWh cryogen no K3/K4 0.3% 1.1% 6.6% 2.4%
30-MW Waena + 5-MW/35-MWh not 1.0% 3.9% 18.1% 6.9%
BESS available
35-MW Waena + transmission line not 2.1% 7.1% 24.0% 10.0%
available
While Table 1 shows how the various scenario projects impact wind curtailment, it does not
address the level of cost savings resulting from the change in system operations. Table 2
contains estimations of the total cost of generation in each scenario, the yearly system savings of
each scenario as compared to the reference case, and the project value based on calculated
system savings and estimated project cost. The purchase price of wind from each wind farm,
based on the Power Purchase Agreements (PPAs), was taken into account in calculating the level
of annual savings.
Table 2. Scenario Generation Cost (million USD) and Project Economic Analysis.
Estimated Simple Net
Diesel + Annual
Scenario Diesel Wind System Payback Present
Wind Savings
Cost2 (years) Value3
Reference Run 194.8 45.0 239.8 - - - -
10-MW/15-MWh BESS 190.0 46.3 236.3 3.5 11 3.1 34.4
10-MW/70-MWh BESS 187.7 48.0 235.7 4.1 35 8.5 12.7
10-MW/70-MWh BESS, no K4 185.9 48.6 234.4 5.4 35 6.5 30.6
25-MW Waena 189.8 47.7 237.6 2.2 25 11.4 5.3
25-MW/175-MWh BESS 180.2 49.4 229.7 10.1 87.5 8.7 29.6
25-MW/1200-MWh cryogen 185.2 49.4 234.6 5.2 31.25 6.0 40.3
30-MW Waena + 5-MW/35-MWh
185.5 48.6 234.1 5.7 47.5 8.3 31.0
BESS
35-MW Waena + transmission
188.9 47.7 236.7 3.1 40 12.9 2.7
line
2
The Estimated System Cost is an estimate of the capital cost of a system installed in the continental United States
in 2015.
3
Net present value (NPV) calculations assume a 30-year total project life with no terminal value. Those involving
battery storage assume a 15-year battery stack life, and that the replacement stack would cost 60% of the initial
capital cost of the project.
10If one were interested in the project that would provide the greatest return for the least risk (in
terms of amount of investment), the 10-MW/15-MWh BESS would likely be that project. If one
were interested in the project with the highest estimated NPV, as well as with significant upside
should the round-trip efficiency be increased above 50%, then the 25-MW/1200-MWh cryogen
storage facility is worth investigating.
The Waena biodiesel plants, if not paired with a storage system, do not rank highly in terms of
project NPV. However, one must consider that such a plant allows the system to replace about
150 GWh per year of residual fuel-fired generation at a net reduction in system operational cost –
even though it is required to burn biodiesel, which is almost three times more expensive than
residual fuel.
Most of the savings outlined in Table 2 are not from replacing constant-cost diesel-fired
generation with wind generation. Instead, the savings are achieved by the more efficient
operation of the conventional units of the system. Using additional storage for spinning reserve
enables the system to decrease the amount of spinning reserve provided by single-cycle units.
This decreases the amount of generation from these units, which are often operated at their least
efficient point (at minimum load). At the same time, the amount of spinning reserve from the
efficient combined-cycle units also decreases, allowing these units to operate at higher, more
efficient levels.
In the MECO system of 2015, the ability to do time-of-day shifting facilitates the dispatch of
more wind. However, adding additional energy storage volume to a storage device does not
appear to significantly increase the efficiency of conventional unit operations. The difference in
annual savings between the scenarios that add a 10-MW BESS can be almost entirely attributable
to greater wind dispatch and the avoidance of diesel consumption; the savings from conventional
generation system efficiencies increase only slightly with increased energy storage volume.
Some important caveats are in order. First, the primary focus of this study was to calculate the
annual system savings (compared to the reference case) of each scenario. In order to calculate
the financial value of each project, the assumption is made that the annual savings calculated are
a reasonable estimate of annual savings going forward. Annual savings going forward can differ
from those calculated for 2015 for the following reasons: (1) wind and solar generation amounts
or variability could differ from the study year; (2) changes may be made to the conventional
generation fleet over time; and (3) fuel prices may vary from those assumed for 2015.
Because they are based on the cost savings calculated for a single year, the study team does not
believe that NPV calculations in this report are highly accurate estimates of project value, and
would therefore advise that an investment decision should not be made on the basis of these
numbers alone. Instead, the study team believes that the NPV calculations here are an indication
of how large a project’s benefit may be, and are therefore a useful addition to the simple payback
calculation.
11Second, this study used the spinning reserves specification that has been developed in the
ongoing SIS. The specification of spinning reserves is an important factor in how the system is
dispatched, and will have an impact on the cost savings yielded by storage projects and new
generator additions. At the time this study was conducted, the proposed reserves specification
had not yet been thoroughly vetted, and a decision had not been made as to whether it would be
adopted – or whether modifications to the specification would be required. In addition, adopting
a new reserves specification would require MECO to secure agreement from the independent
power producers (IPPs), as the wind farm PPAs contain provisions tied to the existing MECO
reserves practice.
While not a focus of this report, the study team did analyze the same storage scenarios using the
existing reserves specification. The results of runs were broadly similar, though they show
somewhat lower savings as compared to the reference run. At the same time, if MECO decides
to maintain the existing reserves specification, it would be prudent to do a detailed review of the
results using that specification.
Third, the estimated system cost used here represents an estimation of what such a system might
cost in the continental United States in 2015. This does not include any additional costs for
transporting and installing the system in Hawaii.
12BACKGROUND AND STUDY SCOPE
The MECO Problem
The Maui Electric Company (MECO) is responsible for the safe and reliable delivery of electric
energy on the island of Maui. In 2011, the MECO system load peaked just under 200 MW and
carried a minimum of around 85 MW. To serve this load, MECO employs firm generation from
three main power plants: (1) the Maalaea Power Plant (MPP) with 15 internal combustion units
and 4 combustion turbines that run on diesel along with 2 heat recovery units, for a total capacity
of 200.65 MW; (2) the Kahului Power Plant (KPP) with 4 steam boilers that run on fuel oil No.
6, for a total capacity of 32.33 MW; and (3) from a co-generation biomass plant owned by the
Hawaiian Commercial & Sugar Company (HC&S) that provides a scheduled 12 MW during on-
peak hours and 8 MW during off-peak hours. MECO has also entered into Power Purchase
Agreements (PPAs) with three different wind farms, Kaheawa I (30 MW), Kaheawa II (21 MW),
and Auwahi (21 MW). These are the main power plants on the MECO system. At the time of
this report only one of the three wind farms was installed and operating.
With all other constraints remaining equal (must-run units, regulation reserve requirements,
minimum generation points, etc.), the estimated wind power production from all three wind
farms could result in operations that require significant curtailment of wind energy. The
majority of the curtailment happens at night when there are high winds, low load, and must-run
units operating at their minimum load levels. An example of this is shown in Figure 1.
Figure 1. Daily load and generation stack example for Maui.4
4
Source: Marc Matsuura and Mat McNeff presentations at UWIG Fall Technical Conference 2011.
13The issue of wind curtailment on Maui is related to the challenges around unit commitment and
economic dispatch, must-run requirements, reserve requirements and automatic gain control
functions, and system topology and reactive power support. These challenges are not
independent of each other and need to be examined in unison to develop a robust solution.
The purpose of this study is to examine these challenges and answer the question of how to best
reduce wind energy curtailment with energy storage technologies while maintaining safe and
reliable power.
Analysis Approach
To answer this question, the following process was used:
1. Research and develop an understanding of the system to be examined.
This included obtaining an understanding of the electrical topology of the system,
generating assets and characteristics, load characteristics, and operating characteristics.
For the Maui system it was important to understand the current operations and assets as
well as how those might change for the study year.
2. Identify current and future needs of the system.
For this study this included understanding renewable energy policies and plans,
generation reserve requirements, system capacity adequacy requirements, required
reactive power support on the system, and projected load growth for 2015. In some cases
it might also be necessary to understand the political landscape with regard to renewables
and energy regulation to develop plausible scenarios.
3. Develop and validate system models.
This study created a representation of the MECO system in a commercially-available
production cost model called PLEXOS. Given system hourly load, hourly wind and solar
output data, and spinning reserve requirements as a function of the amount of variable
energy dispatched, PLEXOS was used to simulate the unit commitment and dispatch of
generation assets. The amount of wind energy curtailed and the overall cost of operating
the system were key outputs of the model runs. The Maui PLEXOS model the Sandia
National Laboratories (SNL) team created for this study was calibrated against the P-
Month generation planning model used by the Hawaiian Electric Company (HECO) to
ensure that it accurately reflects the MECO dispatch order.
4. Develop Study Scenarios.
A technical review committee that included employees from MECO and HECO held
regular teleconferences to discuss and agree upon the scenarios to be studied. In order to
give results that can be compared against a parallel study being performed by the
National Renewable Energy Laboratory (NREL) and General Electric (GE), the reference
case for this study contains identical assumptions of that of the NREL/GE reference case.
5. Run and analyze study scenarios.
6. Report findings.
This process can be applied to other systems interested in adding energy storage systems to their
generation portfolio.
14Study Methodology Strengths and Limitations
There are many advantages to using a production cost model to place a value on a proposed
storage facility, or on any other change to a bulk power system.
The primary advantage is that the model can be an accurate representation of system unit
commitment and dispatch at the bulk power level, and thus yield detailed and accurate estimates
of how changes in the system may impact actual operational cost. Actual load and renewable
generation profiles, combined with accurate data on generation unit characteristics, allows the
model to use the same information the system operators have when deciding unit commitment
and dispatch. The model can be calibrated to mimic actual unit dispatch order, when that
dispatch order differs from what one might expect from a strictly economic dispatch. For
example, a unit that appears to be economic based on fuel and heat rate may be rarely dispatched
because it results in excessive nitrous oxide emissions. Taking this into account increases the
realism of the model, and hence makes it more accurate when evaluating hypothetical changes to
the system.
A limitation of this study is that the model is deterministic – in other words, whereas system
operators in real life do not know exactly how much wind and solar energy will be produced
later in the day, the model used here has that information. Having perfect knowledge is useful in
scheduling conventional units and in planning for storage charging and withdrawals, and can
result in savings higher than those that can be achieved in the real world.
In order to compensate for this perfect knowledge, the model used here is limited to taking into
account a 24-hour horizon for planning purposes. In other words, the model only uses the hourly
load and variable generation within a 24-hour period to schedule unit commitment and dispatch.
If the model were allowed to look ahead a week, for example, then it may find some block of
time with high demand and low variable generation, and determine that it would be better to save
energy in anticipation of this event than to optimize performance over a 24-hour period. Having
perfect knowledge of hourly load and variable generation for an entire week is unrealistic, and
likely to result in inflated estimates of storage system value. At the same time, assuming no
knowledge beyond the current 24-hour period may be underestimating the value that can be
achieved from a storage device with a large volume of storage.
One conclusion that can be drawn from this is that value that is derived from the provision of
reserves is of high quality – in other words, it is likely to be realizable in the real world. This is
because providing reserves depends on the level of variable generation in real time, and therefore
does not rely on the accuracy of a forecast. Value derived from time-of-day shifting (sometimes
called “arbitrage”) is of less quality, since unlocking this value does depend on the quality of
forecasting future load and variable generation.
15System Review Relevant to the Problem
This section provides details about the Maui system that are germane to this study. The electric
transmission grid on the island of Maui is comprised of two primary voltage levels: 69 kV and
23 kV. The 69-kV system covers west Maui, south Maui, and much of central Maui, while the
23-kV system covers central Maui and extends radially east to Hana. The two systems are
connected in synchronism, yet out of phase, through four zig-zag transformers, one of which
operates in the normally open position.
As noted earlier, firm generation comes from three main power plants: MPP, with a total
capacity of 200.65 MW; KPP, with a total capacity of 32.33 MW; and, from an independent
power producer, the HC&S co-generation biomass plant, which provides a scheduled 12 MW
during on-peak hours and 8 MW during off-peak hours. Currently, the Kaheawa Wind Farm,
with a 30-MW capacity, is the only installed wind farm on the island. When installed, all
72 MW of wind generation will be located on the 69-kV side of the system.
KPP is the oldest plant in the MECO fleet (units were commissioned from 1948 to 1966) and
burns No. 6 oil (also termed “residual fuel oil”). Because KPP is the only source of generation
that is connected directly to the 23-kV system, it not only provides a source of generation
capacity and active power, but it also provides the necessary reactive power to keep system
voltage levels within acceptable limits in the event of an intertie contingency. This function of
KPP keeps it categorized as a must-run unit.
Because of the size of the MECO system, it is operated without any contingency or operating
reserves. MECO operates only with regulating reserves. With the integration of variable wind
energy onto the system, MECO found it necessary to carry additional regulating up reserve. The
current formula to calculate the required up reserve is dependent on the amount of delivered
wind power to the grid. For delivered wind power less than 30 MW, MECO carries the greater
of 6 MW or 50% of delivered wind power. For delivered wind power greater than 30 MW,
MECO carries the delivered wind power less 15 MW of regulating up reserve. The down
reserve is typically 6 MW at all times. Down regulation requirements of the system are not
affected by wind energy levels, but are determined by a load rejection factor.
The two major factors that cause curtailment of wind energy are:
Baseload must-run units are operating at their minimum load levels and cannot decrease
generation any further; and
There is not enough regulating reserve on the system.
Must-run units, operating at minimum load levels, are a key contributor to nighttime wind energy
curtailment. HECO looked at options for removing KPP from must-run status. Without KPP
online there are several contingencies that could cause voltage collapse on the 23-kV side of the
system. HECO has four recommended solutions for this issue with KPP offline, which are
discussed below.
16Previous and Current Studies
In 2008, General Electric Energy performed the “MECO Wind Integration Study” (WIS) for
MECO to determine the required changes in MECO system operations to increase installed wind
capacity to 72 MW. The WIS analyzed four scenarios for wind energy on the Maui system:
Scenario 1: 30 MW (2011 Baseline Model)
Scenario 2: 30-MW and 22.5-MW wind plants
Scenario 3: 30-MW and 21-MW wind plants
Scenario 4: 30-MW and 22.5-MW and 21-MW wind plants
Because MECO has since entered into PPAs for the two additional wind power plants, the SNL
team built this study from the results of Scenario 4 above. Based on the results of GE MAPS™
simulations, the estimated wind energy delivered from each wind plant was determined.
Curtailment of wind energy happened in such a way that, if needed, the following curtailment
order was respected: the 21-MW plant, the 22.5-MW plant, and the 30-MW plant (first-to-last
curtailed).
The results of the simulations estimate that 97% of the available energy from the 30-MW plant,
72% of the available energy from the 22.5-MW wind power plant, and only 27% of available
energy from the 21-MW wind power plant can be accepted by the system in Scenario 4. Based
on a set of simplified estimations, the stakeholders of the WIS selected a set of operational
changes and equipment additions for a detailed study. Those changes included removing
Kahului Units 1 and 2 from must-run status, creating the current up-regulation requirement
calculation, adjusting the down-regulation requirements for the combustion turbines at MPP, and
included a 10-MW/20-MWh battery energy storage system (BESS) dedicated to only providing
up-regulation. The changes resulted in increased acceptance of wind energy such that 99% was
accepted from the 30-MW plant, 84% from the 22.5-MW plant, and 45% from the 21-MW plant.
Additionally, in 2011 HECO studied the impacts to the transmission system with reduced
operations at KPP [1]. As discussed earlier, KPP is the only generation source connected to the
23-kV system. By reducing the power provided by KPP, the 23-kV system must draw more
power from the 69-kV transmission and tie transformers. HECO examined the system for 10
different cases under normal operating conditions and then again under N-1 contingencies. In
general, with KPP offline, the 23-kV system voltage may drop under normal conditions and may
drop significantly during contingencies, the reactive power import from MPP increases,
overloads on tie transformers occur during contingencies, and overload on some transmission
lines may occur.
17HECO found that with only Kahului Units 1 and 2 operating that all 69-kV/23-kV tie
transformers are operating within an acceptable range; however, low-voltage conditions exist
across the 23-kV system. Additionally, the total system losses increase by 12.5%. With all
Kahului units offline, HECO found that during normal operating conditions all the tie
transformers are operating within an acceptable range. For the worst N-1 contingency without
any Kahului units online, the 69-kV/23-kV tie transformers begin to overload and undervoltage
conditions are seen across the majority of the 23-kV system.
HECO developed three alternatives to alleviate these issues:
Alternative 1: Build a new 69-kV transmission line from Waiinu to Kanaha Substation;
Alternative 2: Add a second circuit of 69-kV transmission lines from MPP to Waiinu,
from MPP to Puunene, and from MPP to Kanaha; and
Alternative 3: Upgrade the existing 23-kV Waiinu to Kanaha line to a 69-kV line.
HECO concluded that Alternative 1 would mitigate the undervoltage and overloading conditions
for all KPP units offline, but would not be sufficient if both KPP and HC&S are offline.
Alternative 2 requires the addition of three new lines to create the double circuits, which is likely
the least economical solution but provides adequate redundancy for each of the three worst N-1
contingencies. Alternative 3 performed similarly to Alternative 1 in that it would not be
sufficient to handle tie transformer overloads with both KPP and HC&S offline. Alternative 3
would also require the conversion of some 23-kV substations to 69 kV.
18STUDY SCENARIOS AND RESERVE REQUIREMENTS
Study Scenarios
The study scenarios were selected for this study in consultation with MECO/HECO personnel.
They are listed in Table 3 below.
Table 3. Study Scenarios.
Scenario Name KPP Operations Scenario Characteristics of Interest
Reference run
10-MW/15-MWh battery unchanged spinning reserve value only
10-MW/70-MWh battery unchanged spin + arbitrage
10-MW/70-MWh battery, no K4 K4 not available spin + arbitrage + K4 off
25-MW Waena K3/K4 not available spin (w/minimum output) + K3/K4 off
25-MW/175-MWh battery K3/K4 not available spin + arbitrage + K3/K4 off
spin (w/min output) + large arbitrage +
25-MW/1200-MWh cryogen K3/K4 not available
K3/K4 off
30-MW Waena + 5-MW/35-MWh flexible diesel (spin) + 5 MW spin + KPP
KPP not available
battery off
35-MW Waena + transmission line KPP not available flexible diesel (spin) + KPP off
In this table, “KPP Operations” refers to how KPP is operated in each scenario. “No Change”
means that the plant operates as it does in the Reference case – with Units 1 and 2 (K1 and K2)
operating on alternate days between 2 p.m. and 11 p.m., and Units 3 and 4 (K3 and K4) on must-
run at all times. The “Scenario Characteristics of Interest” refers to what the study team was
interested in when selecting a given scenario, where “spin” refers to spinning reserves, and
“arbitrage” refers to time-of-day shifting.
The scenario selection criteria was to investigate different options for mitigating wind
curtailment and reducing cost, while maintaining the amount of installed capacity. The scenarios
chosen, therefore, leave the MECO system with close to the same amount of installed capacity as
in the reference case. While reducing must-run generation below the amounts shown would
have been possible in several of these scenarios (and would have further reduced the cost of
operating the system), it would introduce the risk that MECO might not be able to meet load
under certain conditions (such as when one combustion turbine is out for maintenance, and then
a second one experiences a forced outage). Requiring the capacity to be the same as the
reference case means that the resulting savings is not the result of taking more or less risk of
losing load, but is the result of changes in how the system can be operated.
19The study team was primarily interested in scenarios involving storage, and in understanding
how much value is contributed by spinning reserves versus time-of-day shifting.5 However,
since storage is not the only option available to decrease wind curtailment, several scenarios
involving a new, efficient diesel generation facility were included.
The generation units envisaged at Waena would be of the reciprocating engine type, which are
high in efficiency for a single-cycle plant, and perhaps more importantly, are highly flexible, in
that they can be started quickly (within 3 to 5 minutes) and can undergo several stop/start cycles
per day without incurring significant maintenance costs. The minimum capacity assumed on the
Waena units is 30% of installed capacity, and the modeled heat rate curves were based on
communications with a manufacturer of these types of engines. In all scenarios involving this
plant, it is assumed to operate on biodiesel, which is almost twice as expensive as low-sulfur
diesel (and three times as expensive as residual fuel oil).6 The cost savings presented for these
scenarios, therefore, are less than they would be were this plant allowed to use low-sulfur diesel.
A 75% round-trip efficiency is assumed for the scenarios involving batteries capable of time-of-
day shifting. This is what one would expect for sodium sulfur batteries, which are currently the
most likely technology where 7-hour storage is called for.
In addition, the model is constrained to doing a 24-hour optimization for dispatch. In cases
involving storage units capable of time-of-day shifting, dispatch includes deciding when to use
the battery for spinning reserve and when (and how) to use it for time-of-day shifting. In the
view of the project team, allowing weekly optimization would allow the model (given perfect
information on load and variable generation) to perform better than system operators could likely
do in reality, and so would lead to an overly optimistic assessment of the value of time-of-day
shifting.
The 10-MW/15-MWh battery scenario explores the additional value of 10 MW of spinning
reserve from a battery system. The advantage of this is that the needed reserve can be supplied
without starting a diesel unit (which operates at a minimum output level). At times of high wind
and low load, this minimum output level can further contribute to wind curtailment. The battery
in this scenario is not allowed to participate in time-of-day shifting. This battery could be placed
at any point in the MECO system with sufficient transmission capacity. No other changes to the
reference case are made.
The 10-MW/70-MWh battery scenario is similar to the previous scenario, but allows the battery
to do time-of-day shifting. In this way, the incremental value of the ability to do time-of-day
shifting can be determined. In deciding when to use the battery for spinning reserve and when
(and how) to use for time-of-day shifting, the model is constrained to doing a 24-hour
optimization. As in the previous scenario, this battery could be placed at any location in the
5
Pumped storage hydro was not considered, as some MECO/HECO personnel estimated that it could take as long
as 10 years to go through the permitting and construction process. As this plant could not be available for 2015,
it was not a feasible option for this study.
6
The MECO/HECO team informed us that any new diesel-fueled power plant on Maui would, in all likelihood, be
permitted on the condition that it burn biodiesel. All existing units use either low-sulphur diesel or ultra-low
sulphur diesel, with the exception of the Kahului units, which use residual fuel oil.
20MECO system with sufficient transmission capacity. No other changes to the reference case are
made.
The 10-MW/70-MWh battery + K4 offline scenario is the same as the previous scenario, but
takes Kahului Unit 4 offline. It can be considered that this unit is mothballed or
decommissioned. For this scenario, the key point is that it is unavailable to the model to be
dispatched. This is expected to decrease system cost, primarily because reducing must-run
generation should allow for more wind power to be dispatched. The addition of the 10-MW
battery, and the removal of Kahului Unit 4, gives the system close to the same capacity as in the
reference case.
The 25-MW Waena Plant scenario places a reciprocating engine plant (5 units of 5-MW
capacity each) running on biodiesel on the 69-kV side of the network.7 This allows Kahului
Units 3 and 4 to be taken offline, while maintaining roughly the same installed capacity as in the
reference case. Again, by “offline,” we mean that these units are unavailable for system
dispatch. Since Kahului Units 1 and 2 would still be in operation (on their alternate day
schedule), there would likely be enough real power production on the 23-kV side of the network
in the event of an interconnect contingency (between the 23-kV and 69-kV networks). However,
power factor correction would likely be needed, since the other Kahului unit could not be started
quickly enough. Therefore, MECO would likely need to install a 10-MVAR capacitor bank or
the functional equivalent on the 23-kV side of their network in order to deal with this
contingency.
The 25-MW/175-MWh battery scenario places a battery capable of up to 25 MW of regulation
as well as time-of-day shifting on the grid. Kahului Units 3 and 4 are taken offline in this
scenario. If placed on the 23-kV side of the system, power factor issues in the event of a
transmission line contingency could be addressed with proper storage system inverter design.
The inverter could be made capable of modifying the power factor of power on the grid (in
other words, it would not have to use stored energy to “produce” reactive power). If placed on
the 69-kV side of the system, it would be necessary to install a 10-MVAR capacitor bank or the
functional equivalent on the 23-kV side of their network in order to deal with an interconnect
contingency.
The 25-MW/1200-MWh cryogen scenario places a cryogen storage system with 25 MW of
liquefaction capacity as well as 25 MW of generation capacity on the grid, and takes K3/K4
offline. This type of system relies on standard liquefaction technology to produce liquid air or
nitrogen, stores the liquid in a thermally insulated container, and then uses a gas expansion
turbine to generate electricity from the expansion of the liquid to the gas. It is assumed that this
is a single-turbine unit with a minimum output level of 8 MW. If placed on the 23-kV system,
the unit could produce enough active and reactive power to deal with an interconnect
contingency – in order to do this, this scenario specifies a minimum of 50 MWh in storage, so
that the unit could always generate on-peak in the event of such a contingency. The cryogen
storage system is assumed to have a round-trip efficiency of 50%, which is what one
7
The MECO/HECO team informed the study team that it has already been determined that the next power plant to
be built on Maui would have to be built on the 69-kV side (high-voltage side) of the Maui network.
21manufacturer expects if the system cannot be co-located with another industrial process. If it can
be co-located with a source providing heat, the efficiency could be increased.
The 30-MW Waena Plant + 5-MW/35-MWh battery scenario places a new Waena plant
(6 units of 5 MW each) on the 69-kV network, and takes Kahului completely offline. In order to
avoid building an additional transmission line (to mitigate an interconnect contingency), a 5-
MW/35-MWh battery system is placed on the 23-kV network. In addition, a 10-MVAR
capacitor bank or the functional equivalent on the 23-kV side of their network would be
necessary in order to deal with an interconnect contingency.
Finally, the 35-MW Waena Plant + New Transmission Line scenario calls for a new Waena
plant (7 units of 5 MW each) on the 69-kV network, takes Kahului completely offline, and calls
for a new transmission line to be built between the 23-kV and 69-kV networks. The addition of
this line would prevent overloads in the remaining interconnections in the event of the failure of
a single interconnection. Based on MECO/HECO analysis, it is likely that no additional sources
of reactive power (such as capacitor banks) would be needed on the 23-kV network given the
additional transmission line.
Reserve Requirements
The level of regulation up (or “spinning”) reserves plays an important role in this analysis.
When efficient generators carry reserve, not only do they operate at a less-efficient output level,
other (less-efficient) generators must be dispatched to make up the shortfall in generation. The
more spinning reserve required, the greater the likelihood that generators with a minimum output
will need to be brought online to provide that reserve. This additional generation on the system
can exacerbate wind curtailment.
Currently, the formula for calculating spinning reserves is solely a function of the amount of
wind energy dispatched.8 We have called this the “status quo” reserves requirement. This
reserves formula is given in Table 4.
Table 4. Status Quo Spinning Reserves Requirement.
Wind Power Dispatched Spinning Reserves Required
Less than 12 MW 6 MW
Between 12 MW and 30 MW WIND/2
Between 30 MW and 65 MW WIND – 15 MW
Over 65 MW 50 MW
8
Historically, MECO has not required spinning reserves in the event of a contingency. They use load shedding
for this purpose.
22The ongoing Solar Integration Study (SIS) has produced a proposed reserves requirement, in the
form of a table function.9 This function depends on the total amount of variable generation
online (that is, wind plus solar), as opposed to being a function of wind only. That function,
along with the status quo requirement, is illustrated in Figure 2.
The proposed reserves requirement calls for more spinning reserve at lower levels, and less
spinning reserve at higher levels, of variable generation than does the status quo requirement.
Figure 2. Status quo versus proposed spinning reserves requirements.
MECO and HECO requested that this study use the reserve requirement recently proposed by
GE, in order to provide comparability with the ongoing SIS. All results discussed in this report,
unless otherwise noted, were determined using the new reserve requirement.
9
Note: The actual table function proposed by GE goes down to 0 MW of reserve required at 0 MW of renewable
output. MECO/HECO personnel indicated to us that they would not operate the system below 6 MW of spinning
reserve, no matter how low renewable generation output falls. Therefore, the study team modified the GE table
function to reflect this.
23Since the study team was unable to use a table function for the level of spinning reserve required
in the production cost modeling, it was necessary to use a formula to approximate this function.
While the formula used is an approximation, the study team feels that it is both a reasonable
representation of what is called for in the new reserve specification, as well as being a formula
that would be easy for MECO system operators to follow. This approximation is detailed in
Table 5.
Table 5. “New” Spinning Reserves Requirement Approximation.
Renewables Spinning Reserves
Dispatched Required
Less than 6 MW 6 MW
6 MW to 26.8 MW Equal to level of variable generation
dispatched
Over 26.8 MW 26.8 MW
The proposed spinning reserves requirement approximation is illustrated in Figure 3, which
compares it with the proposed reserves requirement as developed in the ongoing SIS.
Figure 3. Proposed spinning reserves specification vs. formula used in analysis.
24While not presented in this report, the study team tested the same storage scenarios with the
status quo reserves requirement. Though the annual savings (as compared to the reference run)
using the status quo reserves requirement are not identical to those calculated with the new
requirement, in general they are close. If MECO decides against adopting the new reserves
requirement, it would be prudent to review the detailed results of the calculations using the status
quo requirement, or to redo the runs based on whatever new reserves specification that may be
adopted.
2526
RESULTS
This section of the report contains a discussion of the study results. The discussion is organized
into two sections – a summary section, which presents the overall results and compares and
contrasts the scenario results, and an individual scenario section, which contains a more in-depth
discussion of each scenario.

Summary Results
Table 6 through Table 11 provide insight into the results of each scenario. Along with the
scenario name and Kahului (KPP) operations that are a part of each scenario, Table 6 displays
the wind curtailment that resulted from each scenario. Each of the scenarios provides additional
system flexibility, whether through additional spinning reserve, the ability to use energy storage
for time-of-day shifting, or increased generating unit flexibility. It is therefore no surprise that
each scenario allows the system to accept more wind than the reference run.

                     Table 6. Wind Curtailment (in percent) by Scenario.
           Scenario Name                 KPP       WindGen1    WindGen2     WindGen3      TOTAL
  Reference Run                       available    4.1%        14.3%        36.1%        16.5%
  10-MW/15-MWh BESS                   available    3.0%        11.7%        31.8%        14.0%
  10-MW/70-MWh BESS                   available    1.2%        6.6%         24.1%        9.5%
  10-MW/70-MWh BESS, no K4            no K4        1.1%        4.6%         18.3%        7.1%
  25-MW Waena                         no K3/K4     2.1%        7.3%         24.1%        10.1%
  25-MW/175-MWh BESS                  no K3/K4     0.3%        1.0%         6.5%         2.3%
  25-MW/1200-MWh cryogen              no K3/K4     0.3%        1.1%         6.6%         2.4%
  30-MW Waena + 5-MW/35-MWh           not          1.0%        3.9%         18.1%        6.9%
  BESS                                available
  35-MW Waena + transmission line     not          2.1%        7.1%         24.0%        10.0%
                                      available

As Table 6 shows, the curtailment order of the wind generators is considered in the model runs.
In the 10-MW/15-MWh BESS scenario, the battery can only contribute to spinning reserve. This
yields a total wind curtailment of 14%, as opposed to the 16.5% of the reference run. The
addition of the ability to do time-of-day shifting, which is the only difference between this
scenario and the 10-MW/70-MWh BESS scenario, allows for an additional drop in total
curtailment – down to 9.5%. Taking this same battery system and removing Kahului Unit 4 from
service reduces the amount of inflexible baseload generation on the system, and thus further
decreases curtailment, to 7.1% for the year.

Placing a flexible 25-MW biodiesel-fired power plant at Waena does not add any storage to the
reference run, yet yields a total wind curtailment of 10.1%. This is due to taking a large amount
of inflexible baseload generation off of the grid (Kahului Units 3 and 4), and installing a flexible,

                                                  27
quick-start power plant where each of the five units can operate at a minimum of 1.5 MW, thus
providing 3.5 MW of spinning reserves.
The 25-MW/175-MWh BESS yields the lowest amount of annual wind curtailment – 2.3%. The
25-MW/1200-MWh Cryogen storage facility comes close to this same level of wind curtailment,
providing for total wind curtailment of 2.4%.
The combination of a 30-MW Waena power plant and a 5-MW/35-MWh battery results in wind
curtailment of 6.9%, while the 35-MW Waena power plant plus transmission line results in wind
curtailment of around 10%. The latter result is roughly the same as in the 25-MW Waena power
plant scenario, which indicates that the additional spinning reserve provided by the larger plant
cannot be used to reduce wind curtailment – and that eliminating the baseload production of
Kahului Units 1 and 2 is also not of much help in increasing the amount of wind power
dispatched.
Rather than displaying the percent of annual wind curtailment, Table 7 shows the amount of
generation from each wind farm (and in total) resulting from each of the runs. As expected, the
amount of improvement is greatest at WindGen3, which is the wind farm that is the first in order
of curtailment. WindGen1 is not curtailed much in the reference case, and so has little room for
improvement.
Table 7. Wind Generation (in GWh) by Scenario.
Scenario KPP WindGen1 WindGen2 WindGen3 TOTAL
Reference Run available 123.4 75.0 57.8 256.3
10-MW/15-MWh BESS available 124.9 77.3 61.7 263.9
10-MW/70-MWh BESS available 127.3 81.8 68.6 277.7
10-MW/70-MWh BESS, no K4 no K4 127.4 83.6 73.9 284.9
25-MW Waena no K3/K4 126.1 81.2 68.6 275.9
25-MW/175-MWh BESS no K3/K4 128.3 86.7 84.6 299.6
25-MW/1200-MWh cryogen no K3/K4 128.3 86.6 84.4 299.4
30-MW Waena + 5-MW/35-MWh not available 127.5 84.2 74.1 285.7
BESS
35-MW Waena + transmission not available 126.0 81.4 68.7 276.1
line
Table 8 examines generation by fuel type. Here wind is combined with solar, which is
distributed photovoltaic (PV) energy and cannot be curtailed because of its distributed nature –
and is the same in all scenarios. Biomass, which is used to fire the HC&S facility that MECO
does not own but purchases power from, is also the same in all runs, given the fixed nature of the
PPA. Therefore, generation from biomass and biodiesel are reported together. On Maui,
residual diesel is burned only at the Kahului plant. Finally, the “Other Diesel” category
combines generation from plants fired by standard diesel and those fired by ultra-low sulfur
diesel fuel.
28In calculating the percent renewable generation in each run, the study team counted generation
from wind, solar, biomass, and biodiesel plants as being renewable.
Table 8. Scenario Generation (in GWh) by Fuel Type.
Scenario Renewable
Residual Other Biomass10 Wind+
(Note: figures in GWh, Total Generation
Diesel Diesel +Biodiesel Solar
unless otherwise noted) (%)
Reference Run 148 734 96 286 1,264 28.4%
10-MW/15-MWh BESS 150 724 96 294 1,264 29.0%
10-MW/70-MWh BESS 150 714 96 308 1,268 30.0%
10-MW/70-MWh BESS, no 79 778 96 315 1,268 30.5%
K4
25-MW Waena 9 832 118 306 1,264 31.6%
25-MW/175-MWh BESS 9 839 96 330 1,274 31.5%
25-MW/1200-MWh cryogen 8 865 96 329 1,299 30.9%
30-MW Waena + 5-MW/35- - 834 117 316 1,266 32.3%
MWh BESS
35-MW Waena + - 833 125 306 1,264 32.2%
transmission line
Of note is that the scenario that produced the lowest levels of wind curtailment, the 25-MW/175-
MWh BESS scenario, does not produce the highest levels of renewable generation. That
distinction goes to the 30-MW Waena + 5-MW/35-MWh BESS scenario. Though this scenario
does not dispatch as much wind as the 25-MW/175-MWh BESS scenario, there are lower levels
of system losses, and the biofuel generation of the new Waena plant counts towards renewable
generation.
Table 9 provides information about the annual savings, as compared to the reference case,
resulting from the inclusion of the resource specified in each scenario examined. The crux of
this study is the calculation of this number. In order to calculate this number, one has to take
into account how much more wind generation is possible, how much less diesel generation
would be needed, what losses would result in using the particular storage technology specified,
and how the cost of operating the conventional generation fleet changes as it is dispatched
differently. The detail required to take these factors into account is the reason a production cost
model was used for this study.
10
Note: The “Biomass + Biodiesel” column here categorizes the HC&S plant as a biomass plant, and puts all of its
production in this category. However, the HC&S power plant burns both biomass and coal. MECO has
indicated that the plant uses biomass for roughly 75% of its power production, with the remaining 25% from
coal. The percent renewable generation in this table, therefore, counts 75% of the production of the HC&S plant
as renewable.
29You can also read