CURTAILING CARBON EMISSIONS - CAN 5G HELP? - Huawei Carrier
←
→
Page content transcription
If your browser does not render page correctly, please read the page content below
Executive Briefing Service

   Executive Briefing

   CURTAILING CARBON
   EMISSIONS – CAN 5G HELP?
   Data volumes are growing inexorably. 5G can help to improve networks’
   energy performance and curtail carbon emissions.

Philip Laidler, Partner & Consulting Director | philip.laidler@stlpartners.com | October 2019

CURTAILING CARBON EMISSIONS – CAN 5G HELP? | OCTOBER 2019

Preface
The document has been prepared by independent consulting and research firm STL Partners. It is
based on extensive research into the impact of 5G on industries and leveraged the output of an
interview programme and surveys with telecoms and manufacturing industry representatives,
including regulators, in developing and developed countries. The research programme has kindly been
supported by Huawei.

This report should be read by telecoms regulators, governments seeking to leverage 5G technology,
and telecoms operators, particularly CSOs, strategists, CMOs, enterprise executives and CSR directors.
The content is also relevant to industry players who are interested in using technology to enhance
operations, particularly those responsible for operations and digitalisation: COOs, CEOs and CSOs.

Mentions of companies in this document are intended as illustrations of market evolution and are not
intended as endorsements or product/service recommendations.

If you find this report of interest and would like to discuss any aspects of the content further, please
contact any of the following:

STL Partners:

•     Philip Laidler: Partner & Consulting Director, philip.laidler@stlpartners.com

•     Sufyen Buras-Stubbs, Consultant, sufyen.buras-stubbs@stlpartners.com

Key contributors:

•     Ian Mash: Director - CTO Carrier Business Group, ian.mash@huawei.com

•     Mark Easton: Principal Consultant - CTO Carrier Business Group, mark.easton@huawei.com

    STL Partners is continuously working to understand how 5G can benefit other industries and
    develop strategies for telecoms operators and other industries to accelerate the delivery of benefits.
    Should you like to learn more about this research and future projects or find out how we can help
    regulators, governments and operators to work more effectively together and take advantage of 5G
    please contact us.

Other reports in this 5G series include:
•     $1.4Tn Of Benefits In 2030: 5G’s Impact              •   5G’s Healthcare Impact: 1 Billion Patients
      On Industry Verticals                                    With Improved Access In 2030

•     5G’s Impact On Manufacturing: $740bn Of              •   5G Regulation: Ensuring Successful
      Benefits In 2030                                         Industrial Transformation

       © STL Partners                         EXECUTIVE BRIEFING                                       2
CURTAILING CARBON EMISSIONS – CAN 5G HELP? | OCTOBER 2019

Executive Summary
Global warming: a shared challenge
The telecoms industry has a clear role in the Coordination Age1 in tackling global warming by making
other industries much more efficient, enabling a greater proportion of renewable electricity generation
and reducing travel. Faster 5G roll-out will accelerate this.

Indirectly supporting customers to reduce CO2 emissions is not enough. The telecoms industry also
needs to urgently address its own direct greenhouse gas emissions. This is expected (and
increasingly demanded) by our customers (consumers, public and private sector organisations).
Investors are also factoring in the higher risk profile associated with companies with high carbon
emission exposure. Finally, this also matters to employees – particularly younger ones with the digital
skill sets that operators are looking to attract. Operators must openly set themselves ambitious
targets, plan to meet these, and report on outcomes.

Significant improvements in energy load (the average amount of energy needed for a network to
transmit a given amount of data to a device) will be achieved with existing 4G networks through
greener electricity supply, continuous improvements in network hardware, software upgrades, and by
introducing smarter network power optimisation (e.g. base station shutdown, intersite co-coverage,
carrier dormancy).

However, the inexorable growth in data volumes over mobile networks means that relying on
“evolutionary” improvements to 4G will not be sufficient to curtail emissions from networks. Telcos
need to achieve a step-change in networks and business practices. In essence, public authorities,
operators, customers, and investors are asking: How should mobile network operators deal with the
rapid rate of growth in data, and seek to curtail the associated energy consumption and CO 2
emissions?

It turns out that part of the answer to this question lies in the question: What is the net carbon
emissions impact of accelerating the roll-out of 5G? This study seeks to address both these
questions, the second in most detail.

Our findings: Faster 5G roll out could reduce cumulative
carbon emissions by 0.5 billion tonnes of CO2 by 2030
Our analysis shows that rapidly rolling out 5G networks could reduce the cumulative CO2 footprint of
mobile networks globally by over a third, compared with a slower roll-out. The difference between a
quick roll-out and medium “base-case” roll-out of 5G networks is also significant – cumulative global
savings (2020-2030) would be 0.5 billion tonnes of CO2, slightly less than the annual carbon emission

1   See https://stlpartners.com/research/the-coordination-age-a-third-age-of-telecoms/

         © STL Partners                                    EXECUTIVE BRIEFING                                         3
CURTAILING CARBON EMISSIONS – CAN 5G HELP? | OCTOBER 2019
of all international aviation in 2018. We describe these scenarios in more detail in the methodology
section as well as detail numerically in the appendix.
Figure 1: Faster 5G roll-out would have a material impact on greenhouse emissions
Source: STL Partners
5G networks will contribute to containing (and then reducing) carbon emissions from mobile networks
in several ways. However, the most significant contribution will come from 5G New Radio, massive
MIMO and mmWave. The energy load – the average amount of energy required to transmit data
(e.g. kWh/GB, GWh/EB, Joule/bit) - of a 5G cell site is 8-15% that of a like-for-like 4G cell site. With
mmWave, this has the potential to fall to 1-2% of a 4G macro site. In practice, these theoretical
“optimal” energy loads are not achievable across entire networks and we have accounted for this in
our modelling which reflects relative performances.
Recommendation: 5G sooner, faster, wider
Faster 5G network deployment is a big part of the answer to the question: How should mobile
network operators deal with the rapid rate of growth in data, and seek to curtail the associated
energy consumption and CO2 emissions?
Alongside self-generation of greener electricity or by under-writing others’ generation of power from
green energy sources, rolling out 5G networks can be a key component of operators’ and national
authorities’ ambitions to reduce the emission of greenhouse gases from the operation of mobile
networks. As we have seen, rolling out 5G networks quickly (rather than slowly) could save the
© STL Partners EXECUTIVE BRIEFING 4CURTAILING CARBON EMISSIONS – CAN 5G HELP? | OCTOBER 2019
world over 1bn tonnes of CO2 cumulatively between 2020 and 2030 – more than one year of
greenhouse gas emissions from all maritime shipping or all aviation globally.
This leads us to offer the following guidance to the stakeholders in the mobile network in order to
achieve these vital sustainability targets:
• Network operators should see 5G network deployment not only as an investment in their
services, but also as part of a strategy to contain growing energy demands of escalating data
volumes. Rolling out 5G networks as soon as possible will limit the network operators’ CO2
emissions and will make a major contribution to operators’ own sustainability targets. This is
doubly true for operators running networks in countries with carbon-intense energy grids, or in
situations where operators are relying on diesel generators to run their base stations in remote
areas.
• National authorities have a key role in ensuring the sustainability of the networks they oversee:
− Setting realistic low-carbon operational targets within license terms (on energy loads,
adoption of specific standards, use of renewables, carbon-intensity of network power);
− Incentivising the accelerated roll-out of 5G through policy and licensing through smart
coverage requirements rather than high spectrum pricing;
− Establishing and enforcing rights of way, access to ducting, nationwide frameworks for use
of power / lighting poles and streamlining other planning processes;
− Reducing or eliminating import duty on 5G infrastructure;
− Encouraging efficient and low-carbon practices: network sharing and the use of low-carbon
energy sources (e.g. through lower energy taxation);
− Incentivising migration off 2G/3G and early decommissioning of these networks.
• Tower and power suppliers: As well as ensuring that energy is low-carbon and optimised, they
will increasingly have an influence on the selection of active component technology (antenna) in
the future as they deliver shared infrastructure to multiple telco operators. They should support
operators’ carbon emissions objectives by adopting stringent reporting and carbon accounting
practices.
• Technology providers supply operators with equipment, software and services for their 5G
networks. Ultimately, they will need to ensure that 5G meets its promise of lower emissions:
− Setting out clear performance standards and benchmarks, ideally at a global industry level
(not unlike the energy ratings on white goods);
− Pro-actively engaging regulators and authorities to make the case for 5G’s energy
performance;
© STL Partners EXECUTIVE BRIEFING 5CURTAILING CARBON EMISSIONS – CAN 5G HELP? | OCTOBER 2019
− Pursuing new business models with operators (e.g. similar to the ESCO energy saving
companies who introduce a range of measures in exchange for a share in the reduction in
energy costs);
− Committing to better energy performance through SLAs to ensure their network equipment
adheres to strict KPIs.
The one Watt challenge
Telecoms’ long-term objective will be to achieve carbon neutrality. In the mid-term, the industry,
investors, regulators, and analysts need to adopt a common language and set objective performance
objectives. We propose four:
• By 2025, all mobile operators should report on and aim to achieve:
1. An average end-to-end network load of 10W/Mbps (or 10J/Mb)
2. CO2 emissions of 1mg/Mb
• By 2030, all mobile operators should report on and aim to achieve:
3. An average end-to-end network load of 1W/Mbps
4. CO2 emissions of 30mg/Gb
© STL Partners EXECUTIVE BRIEFING 6CURTAILING CARBON EMISSIONS – CAN 5G HELP? | OCTOBER 2019
Table of Contents
Preface ..................................................................................................................................................................... 1
Executive Summary ............................................................................................................................................... 3
Introduction ............................................................................................................................................................. 9
Scope of this report.......................................................................................................................................... 10
Four scenarios modelled .................................................................................................................................... 11
Our findings ........................................................................................................................................................... 12
Faster 5G roll out could reduce cumulative carbon emissions by 0.5 billion tonnes of CO 2 globally
by 2030 ............................................................................................................................................................... 12
How will accelerating 5G roll-out reduce carbon emissions from mobile networks? ............................. 15
5G technologies as drivers of sustainability ............................................................................................... 15
Country level findings: Uneven distribution of carbon savings ................................................................... 19
Conclusions and Recommendations ............................................................................................................... 23
Operators ........................................................................................................................................................... 23
Regulators and other national authorities ................................................................................................... 23
Tower and power suppliers ............................................................................................................................ 24
Technology providers ...................................................................................................................................... 24
Methodology ......................................................................................................................................................... 25
Projections ......................................................................................................................................................... 25
Scenarios ........................................................................................................................................................... 26
Country level differences ................................................................................................................................ 27
Other Assumptions .......................................................................................................................................... 27
Appendix ................................................................................................................................................................ 29
© STL Partners EXECUTIVE BRIEFING 7CURTAILING CARBON EMISSIONS – CAN 5G HELP? | OCTOBER 2019
Table of Figures
Figure 1: Faster 5G roll-out would have a material impact on greenhouse emissions ............................. 4
Figure 2: Areas where 5G could impact global carbon emissions ............................................................. 11
Figure 3: Cumulative reduction in emissions under different roll-out scenarios .................................... 12
Figure 4: Projected CO2 emissions from mobile networks under 4 scenarios ........................................ 13
Figure 5: Where do emissions reductions come from .................................................................................. 14
Figure 6: Access technologies’ evolving energy performance .................................................................... 17
Figure 7: Carbon intensity of different countries used in modelling emissions ....................................... 19
Figure 8: Potential reduction in emissions from fast roll-out of 5G against carbon intensity of grid .. 20
Figure 9: Top 30 Countries by potential reduction in emissions from fast 5G roll-out ........................... 21
Figure 10: STL’s carbon emissions methodology .......................................................................................... 25
© STL Partners EXECUTIVE BRIEFING 8CURTAILING CARBON EMISSIONS – CAN 5G HELP? | OCTOBER 2019
Introduction
In 2009, mobile phone networks carried 91 Petabytes (that’s 9.1x1016 bytes) of data per month2. Ten
years later, mobile networks are estimated to carry around 30 Exabytes of data per month. That’s 30
x1019 bytes or 15 billion HD movies, or an average of 2.5 movies for the 6 billion smartphone users on
the planet. This represents an increase of over 330-fold in data traffic. This rapid increase in data
carried by mobile networks is projected to slow, but even a reduction in CAGR to 30% a year would
see volumes reaching over 130 Exabytes a month in 5 years.3
This increase in data travelling over mobile networks reflects the increasingly data-heavy applications
running on mobile devices as well as the increasing penetration of smartphones in many developing
markets. Although enterprises and public sector firms will also drive demand for mobile data, this is
minor compared to consumer user demand. As mobile device penetration rates continue to increase
and mobile device owners adopt more data heavy applications such as video streaming and
immersive experiences, growth in volumes will continue far past 2024 and we could easily still see a
20-fold increase over current levels over the next 10 years.
In many ways this is exciting, as more computing power reaches the hands of more people around
the world delivering applications that help billions of people in their daily lives. But this comes with a
caveat – there is an input inherent in delivering this data traffic: the energy needed for running the
network infrastructure.
The electrical energy required to power networks represents a cost to operators, but it also represents
CO2 emissions arising from burning fossil fuels to power the network (either directly from local
dedicated generators or through the power grid). Greenhouse gas emissions therefore also risk
increasing significantly as a result of data growth, particularly in countries heavily dependent on fossil
fuels for their electricity production. Previously, this has been managed by the fact that mobile
networks have been optimised to support larger amounts of data with a similar topology in terms of
infrastructure, if slightly higher energy needs and costs. However, as spectrum is a limited resource,
continued growth of mobile traffic over current LTE networks would quickly lead to densification – an
increased amount of antenna and network infrastructure – by some estimates this would be an
increase of 160% by 2025.4
Even with improvements in hardware performance, growth in mobile data over LTE networks would
result in significant growth in energy consumption which represents a significant source of emissions.
This is at odds with the goals that operators have set for themselves in terms of greenhouse gas
emissions and risks breaching the standards to which (consumer, public and private sector)
customers are increasingly holding their suppliers. Investors are also factoring in the higher risk profile
2 Cisco Visual Networking Index, 2019
3 Ericsson Mobility Report, 2019
4 A playbook for accelerating 5G in Europe, BCG, 2018
© STL Partners EXECUTIVE BRIEFING 9CURTAILING CARBON EMISSIONS – CAN 5G HELP? | OCTOBER 2019
associated with companies with high carbon emission exposure 5 . Finally, this also matters to
employees – particularly younger ones with the digital skills-sets that operators are looking to attract6.
The key question posed by this dilemma then is: How should mobile network operators deal with this
rapid rate of growth in data and the associated energy consumption and CO2 emissions?
In this report, we focus on one part of the answer – accelerating the adoption of more energy efficient
5G technologies and associated operational practices. A faster roll-out of 5G networks is a key weapon
in operators’ arsenal of measures for de-coupling energy costs and carbon emissions arising from
data growth.
Scope of this report
Network operators need to mitigate the ever-increasing energy costs and carbon footprint of their
networks resulting from the forecast data growth in some way. There are six ways that the
accelerated adoption of 5G can do this:
1. Direct curtailment of energy consumption in mobile access networks through the better energy
“performance” of 5G network equipment and operational practices relative to 4G.
2. Direct curtailment of energy consumption in 5G core networks through the better energy
“performance” of network equipment and operational practices relative to 4G core networks.
3. Reduced energy consumption by devices (particularly smartphones and IoT devices).
4. Decarbonising the grid: indirectly enabling lower levels of national carbon emissions from
electricity generation through 5G supported “smart-grid” applications, increasing the proportion
contributed by renewables and improving wider efficiencies in distribution and non-renewables
generation.
5. Indirectly improving energy efficiency across all sectors through reducing waste and improving
operations. Reduced emissions are largely a by-product of improved productivity and process
efficiencies.
6. Reducing carbon emissions from travel through reducing the number of journeys (e.g. remote
monitoring and management, virtual meetings) and reducing the emissions per journey.
5 UNEP Finance Initiative (2017) Portfolio Investment in a Carbon Constrained World: The Third Annual Progress Report of the Portfolio
Decarbonisation Coalition
6 https://www.fastcompany.com/90306556/most-millennials-would-take-a-pay-cut-to-work-at-a-sustainable-company
© STL Partners EXECUTIVE BRIEFING 10CURTAILING CARBON EMISSIONS – CAN 5G HELP? | OCTOBER 2019
Figure 2: Areas where 5G could impact global carbon emissions
Source: STL Partners
In this report, we focus on the first two – the management of energy consumption via increasing the
carbon performance of the network (expressed as a reduction in the tonnes of CO2 per TB of data
transmitted). While we see significant potential upside in “de-carbonising the grid”, in enabling greater
energy efficiencies and reducing waste across the economy, these are not in operators’ direct control.
They are also more challenging to estimate. We would recommend this form part of a future study.
For nearly all operators, over 90% of the direct energy usage of network operators is accounted for via
electricity drawn from the grid to service their own networks. Limiting the growth of this would
represent the largest direct reduction in future greenhouse gas production for a mobile network.
Four scenarios modelled
We have modelled our analysis around four 5G scenarios. We treat each of these scenarios differently
in our model and scenario assumptions vary by country type.
No 5G roll out
No 5G roll out assumes that there is no roll out of 5G radio access or core technologies. This scenario
shows emissions growth well below the growth in data volumes. This is because we anticipate
reductions from lower-carbon power generation (e.g. renewables) and significant performance
improvements in 4G core and access networking. These are discussed at length in this report.
Slow 5G rollout
A slow roll out of 5G would see the most delayed launch dates for 5G (between 2021 and 2024) and
assumes that 5G accounts for the lowest share of data volumes over time (10-25% by 2025 and 60-
80% by 2030).
Medium 5G rollout
A medium roll out of 5G can be considered a base-case. This would see an average launch date of
2019-2022. There would see a significant volume of data running over 5G – up to 60% by 2025 and
85% by 2030. Implicitly, we would expect decommissioning of 2G or 3G (or even 4G) networks with
spectrum re-farming to 5G.
© STL Partners EXECUTIVE BRIEFING 11CURTAILING CARBON EMISSIONS – CAN 5G HELP? | OCTOBER 2019
Fast 5G rollout
A fast roll out would see the highest and quickest realisation of the benefits of 5G to energy efficiency.
It would see 5G launch between 2019 and 2021, and the highest percentage of the access network
run on 5G networks (up to 99% in 2030 for advanced economies). Consequently, we have also
assumed the highest energy efficiency levels by 2030 as 2/3/4G networks are decommissioned. It
would also see the highest roll-out of millimetre wave cells.
Our findings
Faster 5G roll out could reduce cumulative carbon emissions
by 0.5 billion tonnes of CO2 globally by 2030
Our findings suggest that quickly rolling out fast 5G networks could reduce the cumulative CO2
footprint of mobile networks globally by over a third, compared with a slow roll-out. The difference
between a quick roll-out and medium “base-case” roll-out of 5G networks is also significant –
cumulative global savings (2020-2030) would be 0.5 billion tonnes of CO2, slightly less than the
annual carbon emission of all international aviation in 2018. If we turn to the yearly carbon footprint
of mobile networks, the only scenario that would see an actual reduction in annual carbon footprint
of the mobile network would be our fast roll-out scenario. We describe these scenarios in more detail
in the methodology section as well as detail numerically in the appendix.
Figure 3: Cumulative reduction in emissions under different roll-out scenarios
Source: STL Partners projections
© STL Partners EXECUTIVE BRIEFING 12CURTAILING CARBON EMISSIONS – CAN 5G HELP? | OCTOBER 2019
Figure 4: Projected CO2 emissions from mobile networks under 4 scenarios
Source: STL Partners projections
Behind these high-level figures, we can drill down into the different effects on net emissions in Figure
3. About half of the carbon reduction can be accounted for by “non 5G” effects. Essentially, these are
improvements that are expected to occur under 4G anyway: improvements to the core network
(virtualisation, function optimisation, hardware performance) which will occur in a 4G-only scenario
and de-carbonisation of electricity grids via a move to more environmentally friendly energy sources.
The other half of cumulative carbon “savings” are accounted for by 5G technologies. These are
discussed in more detail below. The largest saving is accounted for by mmWave radio access
technologies highlighting the jump in efficiency compared to lower spectrum frequencies.
© STL Partners EXECUTIVE BRIEFING 13CURTAILING CARBON EMISSIONS – CAN 5G HELP? | OCTOBER 2019
Figure 5: Where do emissions reductions come from7
Source: STL Partners projections
By accelerating the roll-out of 5G networks, national authorities and operators can set (and meet)
tougher emission targets: in terms of total emission (MtCO2eq), network carbon efficiency (tCO2/PB)
and network energy efficiency (GWh/EB). Improvements to the 4G networks alone will not produce
the same results.
In summary, accelerated roll-out of 5G offers a means to prevent escalating network energy demand
and CO2 emissions arising from ever-increasing data volumes. Even with improvements to 4G
technology, the only way to decrease yearly energy increases is 5G rollout – including the use of
mmWave.
7Values in chart show the reductions in cumulative global emissions relative to the previous steps. For example, introducing 4G radio
improvements would result in 32% less emissions than the emissions levels after Grid decarbonisation and 4G core improvements have
been applied. All benefits are therefore multiplicative rather than additive.
© STL Partners EXECUTIVE BRIEFING 14CURTAILING CARBON EMISSIONS – CAN 5G HELP? | OCTOBER 2019
How will accelerating 5G roll-out reduce
carbon emissions from mobile networks?
As can be seen from the charts above, most of the energy savings arising from 5G can be accounted
for by other expected changes to the technology within mobile networks. We drew these conclusions
via interviews and literature reviews into the energy costs and efficiency gains of different mobile
network technologies. For this exercise, we have divided and modelled networks into two parts:
• Core network and IT, mostly located in distributed and centralised technical sites (essentially
datacentres and transmission)
• Radio access, mostly located at or near base stations.
Historically, radio access accounts for around two-thirds of most networks’ energy consumption and
so this is where we might expect most energy savings to occur and where changes in technology
should make the largest difference. In practice, our modelling work suggests that this is set to change,
partly due to greater gains being made in radio access technologies versus core networking and partly
due to adoption of caching, break-out and “edge compute” developments which should reduce the
proportion of mobile traffic being carried over core networks.
We have not estimated the energy consumed for caching and “edge compute” from our analysis as
this is relatively small and/or largely displacing workloads that would otherwise have occurred
elsewhere.
5G technologies as drivers of sustainability
The core network
The core network is expected to see improvements in energy efficiency through advances in
technology combined with changes in underlying architecture. Edholm’s Law8 (which has parallels
with Moore’s Law9) predicts that improvements in compute and transmission technologies mean that
data rates double every 18 months. As consumers, we have all experienced this first-hand in growth
in data allowances offered to us on broadband plans. Although Phil Edholm did not specifically discuss
energy, the implication is that there is little or no growth in resources (including energy) needed to
support growth in bandwidth.
Increasing improvements in optical transmission, higher performance chipsets used in network
equipment and the “cloudification” of network functions (writing for virtualised/containerised
infrastructure) will continue to deliver more “bang for buck” (or GB per kWh).
8 https://en.wikipedia.org/wiki/Edholm’s_law
9 https://en.wikipedia.org/wiki/Moore’s_law
© STL Partners EXECUTIVE BRIEFING 15CURTAILING CARBON EMISSIONS – CAN 5G HELP? | OCTOBER 2019
These trends will affect core networks regardless of whether a 5G-specific core is deployed – and
most initial 5G deployments will use 4G cores anyway. However, several factors mean that
accelerating roll-out of 5G will result in a further, albeit modest, improvement in energy efficiency in
core networks:
• Investment in infrastructure, skills and operating practices will be brought forward, which means
older (less efficient) equipment, software and practices will be “frozen” and then
decommissioned sooner.
• The nature of 5G architecture means that far greater levels of automation will be possible,
resulting in greater optimisation.
• End-to-end network slicing (only really possible through 5G) will result in more efficient use of
core network resources, as only functions that are needed for a given application will be
executed.
• As mentioned above, there is potential that adoption of caching, local break-out and “edge
compute” could reduce core traffic volumes. Although these will also apply to 4G networks, we
expect them to be more prevalent in 5G networks, partly because this should be easier to do and
partly because of the need for densifications.
In practice – and this is reflected in our projections – 5G roll-out has a relatively modest impact on
core network emissions and much of this is down to accelerated adoption of new technology and the
business practices associated to this rather than 5G core technologies per se.
5G New Radio, new spectrum
There are three main improvements in the access network from 5G that will result in significant
savings in the energy consumption of the network per bit of data transmitted:
• A collection of technologies referred to as ‘New Radio’ (NR)
• New spectrum and higher array Massive MIMO antennas associated with this
• Millimetre wave (mmWave) spectrum
5G New Radio represents a collection of new 3GPP standards that provide higher spectral efficiency,
Massive MIMO, beam forming technologies and new network protocols. These, alongside
improvements in energy use such as automated sleep modes on base station functions, provide the
basis for significant increases in energy performance. As networks are scaled and optimised, by
2030, we expect 5G New Radio (NR) to eventually fall to 10% of the energy consumption per bit of
data transmitted with current 4G access technologies. This projection is drawn from a range of
figures we collected from interviews with network equipment providers comparing power ratings for
different cell site and antenna configurations. We assumed that in practice, actual performance
levels would be much lower than the theoretical levels and converge to these over time (Fig. 5).
© STL Partners EXECUTIVE BRIEFING 16CURTAILING CARBON EMISSIONS – CAN 5G HELP? | OCTOBER 2019
Millimetre Wave (mmWave)
Millimetre wave spectrum (for 5G, this is referred to as FR 2 and refers to spectrum above 24 GHz) is
expected to see novel antenna devices, beam forming and network protocols, enabling a massively
increased amount of data to be transmitted for less energy on smaller and cheaper-to-power cells.
Perhaps more importantly, mmWave ‘overlay’ cells are expected to provide a far more efficient
mechanism to support peaks in demand and thereby improve utilisation and energy performance of
(3/4/5G) macro cells.
Figure 6: Access technologies’ evolving energy performance
Source: STL Partners projection
However, millimetre wave technology is still being developed and with no deployments expected
before 2023, estimates of energy performance are therefore informed by lab findings. We have
drawn from a recent IEEE report10 on the energy efficiency of millimetre wave in 3 different use case
scenarios and conclude that by using the ‘50+mbps everywhere’ use case scenario, which is a
middle ground between high density city scenarios and scenarios with lower density of mobile
devices, we project energy consumption that is under 2% of current 4G energy usage per bit
transmitted.
Performance, Power and Area Design Trade-Offs in Millimeter-Wave Beamforming Architectures. Han Yan, Sridhar Ramesh, Timothy
10
Gallagher, Curtis Ling and Danijela Cabric. IEEE Circuits and Systems Magazine, Second Quarter 2019 1531-636X/19@2019IEEE
© STL Partners EXECUTIVE BRIEFING 17CURTAILING CARBON EMISSIONS – CAN 5G HELP? | OCTOBER 2019
Since we anticipate millimetre wave to be rolled out in a scalable way only after 2025, the effect is only
seen in the latter half of our projections. That being said, the savings are significant. We assume that
to begin with, millimetre wave technology will be relatively inefficient due to limited cell size (and
relative under-utilisation), interference and propagation barriers. However, once the technology
matures we predict overall performance to pick up by 2030.
Network sharing, operational and competitive dynamics
In STL Partners’ report we anticipate that 5G networks will see greater levels of network sharing
across operators and more variety in the forms of network sharing than is possible (or needed) for
4G. As well as potential reduction in capital expenditure, we would expect that network sharing will
result in even greater levels of network energy efficiencies. This is particularly true for mmWave
deployments for the reasons set out above. This has not been explicitly modelled in our projections.
Devices
A further way that 5G networks will be more energy efficient falls outside of the network and onto the
device. Because transmission of data between devices is so much more efficient, this can help reduce
the battery consumption of IoT devices, smartphones and other devices. 5G technologies represent a
potential saving in consumption of energy for 5G devices (smartphones and IoT devices alike).
This falls outside the scope of our report on the direct impact of the network on carbon emissions, so
we do not include it in our calculations. However, rough estimates suggest that devices could
potentially account for 2-3x the carbon emissions of the core and radio network.
© STL Partners EXECUTIVE BRIEFING 18CURTAILING CARBON EMISSIONS – CAN 5G HELP? | OCTOBER 2019
Country level findings: Uneven distribution of
carbon savings
Technology and new operating practices from transitioning to 5G are the most significant contributors
to lowering the carbon footprint of mobile networks. What this also means is that the benefits of 5G
roll out (in terms of carbon emissions) are not equally distributed. Networks that will save the most in
in terms of CO2 emissions are those that draw from more carbon-intense grids relying on power
generation from fossil fuels such as coal and oil.
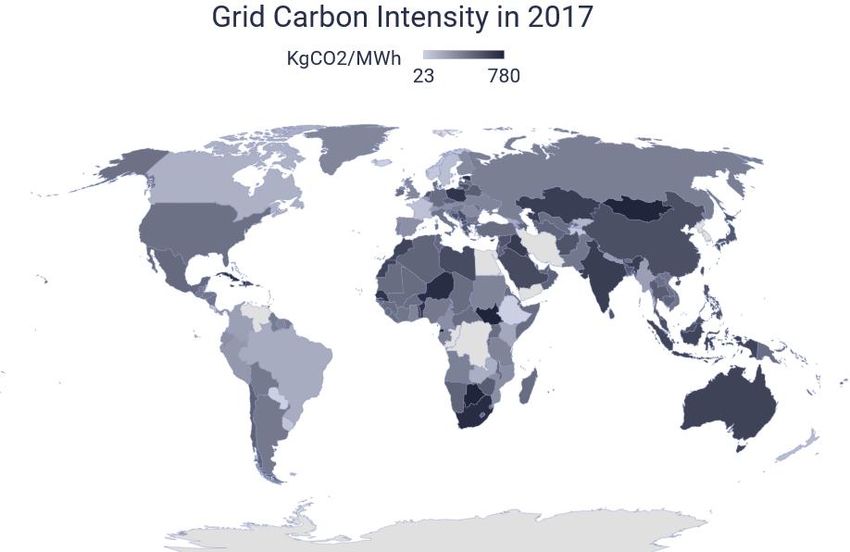
Figure 7: Carbon intensity of different countries used in modelling emissions
Source: STL Partners
This is set out in Figure 7 – the 10-year cumulative CO2 savings resulting from a faster roll-out of 5G
technology versus no 5G roll-out is concentrated in countries with the most carbon intense grids.
Countries such as Indonesia could reduce the equivalent of 82 Million Tonnes of CO2 between 2020
and 2030 in cumulative CO2 emissions by rolling out 5G quickly, compared to not rolling out 5G at all.
Figure 9 indicates the profile of the top 30 countries in terms of total cumulative savings between
2020-2030. A uniting factor between them all is having high-mobile-use populations with relatively
carbon intensive grids.
© STL Partners EXECUTIVE BRIEFING 19CURTAILING CARBON EMISSIONS – CAN 5G HELP? | OCTOBER 2019
Figure 8: Potential reduction in emissions from fast roll-out of 5G against carbon intensity of grid
Source: STL Partners projectionCURTAILING CARBON EMISSIONS – CAN 5G HELP? | OCTOBER 2019
Figure 9: Top 30 Countries by potential reduction in emissions from fast 5G roll-out
Source: STL Partners projection
Even in the top 10 countries the carbon saved cumulatively is large – China for example would
cumulatively save more carbon emissions from 5G roll out as the entire sub-Saharan Africa regionCURTAILING CARBON EMISSIONS – CAN 5G HELP? | OCTOBER 2019
would. This should not deter all countries from making their contribution to curtailing carbon
emissions.
© STL Partners EXECUTIVE BRIEFING 22CURTAILING CARBON EMISSIONS – CAN 5G HELP? | OCTOBER 2019
Conclusions and Recommendations
Faster 5G network deployment is a big part of the answer to the question we posed at the start of
this report: How should mobile network operators deal with the rapid rate of growth in data, and
seek to curtail the associated energy consumption and CO2 emissions?
Alongside self-generation of greener electricity or by under-writing others’ generation of power from
green energy sources, rolling out 5G networks can be a key component of operators’ and national
authorities’ ambitions to reduce the emission of greenhouse gases from the operation of mobile
networks. As we have seen, rolling out 5G networks quickly (rather than slowly) could save the world
over 0.5 bn tonnes of CO2 cumulatively between 2020 and 2030 – more than one year of greenhouse
gas emissions from all maritime shipping or all aviation globally.
This leads us to offer the following guidance to the stakeholders in the mobile network in order to
achieve these vital sustainability targets:
Operators
Network operators should see 5G network deployment not only as an investment in their services,
but also part of a strategy to contain growing energy demands of escalating data volumes. Rolling
out 5G networks as soon as possible will limit the network operators’ CO2 emissions and will make a
major contribution to operators’ own sustainability targets. This is doubly true for operators running
networks in countries with carbon-intense energy grids, or in situations where operators are relying
on diesel generators to run their base stations in remote areas.
We think that a single operator with data traffic of over 10 ectabytes per year in 2030 (for example
the second operator in Saudi Arabia) would reduce CO2 emissions by 7 million tonnes cumulatively
between 2020 and 2030, which is equivalent to the annual emissions from over 800,000 US homes’
energy use.
Regulators and other national authorities
Regulators and other national authorities have a key role in ensuring the sustainability of the
networks they oversee by:
• Setting low-carbon operational targets within license terms (on energy performance, adoption of
specific standards, use of renewables, carbon-intensity of network power)
• Incentivising the accelerated roll-out of 5G through policy and licensing
− Set tough coverage requirements rather than high spectrum pricing
− Establish and enforce rights of way, access to ducting, nationwide frameworks for use of
power / lighting poles and streamlining other planning processes
© STL Partners EXECUTIVE BRIEFING 23CURTAILING CARBON EMISSIONS – CAN 5G HELP? | OCTOBER 2019
− Reduce or eliminate import duty on 5G infrastructure
• Encouraging efficient and low-carbon practices
− Network sharing
− Use of low-carbon energy sources (e.g. through lower energy taxation)
• Incentivising migration off 2G/3G and early decommissioning of these networks
Regulators have historically not held operators to meeting specific KPIs regarding network
operators’ sustainability. Making sure that operators meet target GWh/PB of data transmitted in
their core and access networks would both ensure sustainability and also provide transparency –
forcing operators to publish figures, for example, would help to cut through the obfuscation and
provide customers with clearer information on the environmental impact of their mobile use. Tying
5G licenses and spectrum to efficiency standards should also be encouraged. Efficient 5G networks
will require new legal environments around having the right to build much smaller but more efficient
millimetre wave radio cells throughout cities. Similarly, building larger massive MIMO new radio
masts will need to be supported by authorities to prevent planning laws from causing significant
constraints to efficient deployment of 5G networks.
Tower and power suppliers
Independent tower businesses and energy suppliers operate more than two-thirds of the base station
infrastructure and are responsible for the supply and management of power through grid, generators,
batteries, wind and solar power. As well as ensuring that energy is low-carbon and optimised, they will
increasingly have an influence on the selection of active component technology (antenna) in the future
as they deliver shared infrastructure to multiple telco operators. They should support operators’
carbon emissions objectives by adopting stringent reporting and carbon accounting practices.
Technology providers
Our final set of recommendations are for the technology community that supplies operators with
equipment, software and services for their 5G networks. Ultimately, they will need to ensure that 5G
meets its promise of lower emissions. Potential areas where they can support include:
• Set out clear performance standards and benchmarks, ideally at a global industry level (not
unlike the energy ratings on white goods)
• Pro-actively engage regulators and authorities to make the case for 5G’s energy performance
• Pursue new business models with operators (e.g. similar to the ESCO energy saving companies
who introduce a range of measures in exchange for a share in the reduction in energy costs)
• Commit to performance through SLAs to ensure their network equipment adheres to strict KPIs
• Drive awareness and support industry-wide initiatives
© STL Partners EXECUTIVE BRIEFING 24CURTAILING CARBON EMISSIONS – CAN 5G HELP? | OCTOBER 2019
Methodology
Projections
This section details how our forecasting model functions and where our assumptions and figures are
drawn from. We urge readers to explore the appendices with key figures at a country level to get an
idea of how the model works on a country level from scenario to scenario.
This exercise has required a number of simplifying assumptions and modelling approaches. We have
consistently sought to ensure that these are conservative and that they understate rather than
overstate the specific contribution of 5G technologies. In practice, the levels of energy consumption
(and carbon emissions) from mobile networks are a function of many factors (network architecture
and topology, spectrum availability, coverage requirements, operating policy, geography and
demographics). Actual networks are composed of several overlaid “life cycles” of investment with
each life cycle potentially achieving significant improvements in energy performance over the previous
cycle. Ideally each investment cycle would need to be modelled over its life up to decommissioning.
Furthermore, the cycles are not strictly independent (for example 5G coverage can be more effectively
used to address peak loads, thereby ensuring a more constant loading of 4G networks and improving
the resultant 4G energy performance). Attempting to model this at an operator level is both complex
and requires making many assumptions. Extending this to 800 operators globally would be a
gargantuan task.
The model works by taking a single projection for mobile network data growth for each country and
running this through four scenarios of 5G deployment and adoption. We have taken actual mobile
network figures for energy consumption for Core and Access networks. We then divide the energy
consumption by the mobile network data and use this as our starting point for 2018 network energy
efficiency.
Figure 10: STL’s carbon emissions methodology
Source: STL Partners
© STL Partners EXECUTIVE BRIEFING 25CURTAILING CARBON EMISSIONS – CAN 5G HELP? | OCTOBER 2019
We have generated theoretical maximum network energy efficiency values for 5G radio access
technology (one for new radio technology and one for millimetre wave technology) that we have
inferred from interviews and discussions with industry players as well as the sources set out in the
footnotes. As we move along the timeline, we project that 5G technology will make up a larger
percentage of the data transmitted, as well as moving closer to the theoretical maximum of energy
performance from a fairly inefficient starting point. Once we have projected the theoretical energy
used per unit of mobile data for each year, we then multiply this against the projected data for that
year.
Our final step involves taking this energy used by a country’s mobile networks and multiplying this
with the CO2 footprint per unit of (electrical) energy for that country. We assume that this electrical
energy is drawn from the country’s electricity grid and so assume that the carbon footprint per GWh
of each countries’ national grid functions as a suitable proxy for the environmental impact of the
mobile network.
We have drawn data on the sources of electrical energy for each country from the IEA electricity report
2019 (for countries not featured in the report we use a regional average figure of countries included in
the report – we use the following regional groupings: North America; Latin America; Western Europe;
Central and Eastern Europe; North East Asia; South East Asia and Oceania; India, Nepal and Bhutan;
the Middle East; and Sub-Saharan Africa), we then combine this with the carbon producing potential
of each fuel type to derive a figure for the tonnes of CO2 equivalent produced when creating a GWh of
energy in each country. We then use this to determine a tonnes of CO2 figure produced each year in
each country through servicing mobile networks. Because we predict carbon intensity to decrease
through time globally, we include a de-carbonisation factor that ranges from 30% decrease in tonnes
of CO2 per GWh of electricity generated for the most carbon-intense grids down to a 10% decrease for
the least carbon-intense grids.
This is done on a country level and then summed up regionally and globally. Our data set contains 240
countries, which although not exhaustive contains every significant source of mobile data. We do this
for every year between 2018 and 2030.
Scenarios
We propose there are 4 different scenarios for the future of mobile networks:
• No or negligible 5G roll out
• A slow 5G roll out
• A medium velocity 5G roll out
• A fast 5G roll out.
We treat each of these scenarios differently in our model and alter them by country type.
© STL Partners EXECUTIVE BRIEFING 26CURTAILING CARBON EMISSIONS – CAN 5G HELP? | OCTOBER 2019
No 5G roll out
No 5G roll out assumes that there is no roll out of 5G radio access or core technologies. This scenario
shows emissions growth well below the growth in data volumes. This is because we anticipate
reductions from lower-carbon power generation (e.g. renewables) and significant performance
improvements in 4G core and access networking. These are discussed at length in this report.
Slow 5G rollout
A slow roll out of 5G would see the most delayed launch dates for 5G (between 2021 and 2024) and
assumes that 5G accounts for the lowest share of data volumes over time (10-25% by 2025 and 60-
80% by 2030).
Medium 5G rollout
A medium roll out of 5G can be considered a base-case. This would see an average launch date of
2019-2022. There would see a significant volume of data running over 5G – up to 60% by 2025 and
85% by 2030. Implicitly, we would expect decommissioning of 2G or 3G (or even 4G) networks with
spectrum re-farming to 5G.
Fast 5G rollout
A fast roll out would see the highest and quickest realisation of the benefits of 5G to energy efficiency.
It would see 5G launch between 2019 and 2021, and the highest percentage of the access network
run on 5G networks (up to 99% in 2030 for advanced economies). Consequently, we have also
assumed the highest energy efficiency levels by 2030 as 2/3/4G networks are decommissioned. It
would also see the highest roll-out of millimetre wave cells.
Country level differences
We group countries by World Bank income groupings – we use these groupings to assign status of
High, Upper Middle, Lower Middle and Lower income economies to each country in our data base. We
then assign scenario data relating to network energy assumptions and the adoption of 5G. Highest
income countries are projected to show faster 5G adoption than other countries under all scenarios.
Other Assumptions
We have made simplifying assumptions, primarily with the aim of ensuring that scenarios are
comparable.
• The data volumes projected are the same for all 5G roll-out scenarios. Essentially, we are
projecting that demand is not affected by the presence of new 5G services. This is mainly to
ensure that scenarios are comparable: increasing data volume forecasts for different scenarios
(i.e. faster 5G roll-out generating more growth) would create confusion in interpreting findings.
This approach implicitly accepts the 5G-sceptics’ common assertion that 5G doesn’t do much
that 4G cannot do too. A possible refinement to the projection would be to factor in changes in
data growth under the different scenarios.
© STL Partners EXECUTIVE BRIEFING 27CURTAILING CARBON EMISSIONS – CAN 5G HELP? | OCTOBER 2019
• We have assumed that the carbon footprint embedded in equipment and generated in the
installation of 5G networks is broadly comparable with that required for the equivalent 4G
expansion and can therefore be excluded from our evaluation. In any case, embedded and
installation carbon footprints are expected to be a small fraction (CURTAILING CARBON EMISSIONS – CAN 5G HELP? | OCTOBER 2019
Appendix
Country data tables for all scenarios. Figures show cumulative carbon emissions from mobile
networks 2020-2030 in millions of tonnes of CO2.
Country Fast 5G Medium Slow 5G No 5G roll
roll out 5G roll out roll out out
Afghanistan 14.2 16.6 18.3 22.3
Albania 0.1 0.1 0.1 0.1
Algeria 16.7 20.2 25.9 32.5
American Samoa 0.01 0.01 0.01 0.01
Andorra 0.03 0.04 0.1 0.1
Angola 1.1 1.3 1.5 1.9
Anguilla - - - -
Antigua and Barbuda 0.04 0.05 0.1 0.1
Argentina 15.0 18.0 23.1 29.0
Armenia 0.6 0.7 0.9 1.1
Aruba 0.03 0.04 0.1 0.1
Australia 9.0 11.1 15.1 19.0
Austria 4.6 5.8 7.8 10.0
Azerbaijan 3.5 4.2 5.3 6.6
Bahamas, The 0.1 0.1 0.1 0.2
Bahrain 0.6 0.8 1.1 1.4
Bangladesh 45.1 53.7 63.4 79.1
Barbados 0.1 0.1 0.1 0.2
Belarus 4.3 5.1 6.5 8.1
Belgium 3.4 4.2 5.7 7.3
Belize 0.1 0.1 0.2 0.2
Benin 1.5 1.8 2.0 2.4
Bermuda 0.02 0.02 0.03 0.03
Bhutan 0.2 0.3 0.3 0.3
Bolivia 3.1 3.7 4.4 5.6
Bosnia and Herzegovina 1.4 1.7 2.2 2.7
Botswana 0.5 0.6 0.7 0.9
Brazil 28.4 34.4 44.4 56.4
Brunei Darussalam 0.1 0.2 0.2 0.3
Bulgaria 2.8 3.3 4.2 5.3
Burkina Faso 2.0 2.3 2.6 3.1
Burundi 0.7 0.8 0.8 1.0
© STL Partners EXECUTIVE BRIEFING 29CURTAILING CARBON EMISSIONS – CAN 5G HELP? | OCTOBER 2019
Country Fast 5G Medium Slow 5G No 5G roll
roll out 5G roll out roll out out
Cambodia 5.2 6.2 7.3 9.1
Cameroon 1.3 1.6 1.9 2.4
Canada 8.2 10.3 14.2 18.2
Cabo Verde 0.1 0.1 0.1 0.1
Cayman Islands 0.02 0.03 0.04 0.05
Central African Republic 0.1 0.2 0.2 0.2
Chad 0.7 0.8 0.9 1.1
Chile 6.9 8.7 12.0 15.4
China 708.5 829.0 1032.9 1230.8
Cocos (Keeling) Islands - - - -
Colombia 10.1 12.2 15.8 20.0
Comoros 0.04 0.1 0.1 0.1
Congo, Dem. Rep. 0.3 0.3 0.4 0.4
Congo, Rep. 0.3 0.3 0.4 0.5
Cook Islands - - - -
Costa Rica 0.6 0.7 0.9 1.1
Cote d'Ivoire 2.7 3.2 3.8 4.8
Croatia 1.4 1.8 2.4 3.1
Cuba 2.4 2.9 3.7 4.6
Curacao 0.1 0.1 0.1 0.1
Cyprus 0.7 0.9 1.3 1.7
Czech Republic 4.8 5.9 8.1 10.3
Denmark 4.0 5.0 6.8 8.5
Djibouti 0.04 0.04 0.1 0.1
Dominica 0.02 0.02 0.03 0.04
Dominican Republic 3.4 4.1 5.3 6.6
Ecuador 3.2 3.9 5.0 6.3
Egypt, Arab Rep. 34.9 42.0 49.9 63.9
El Salvador 2.6 3.2 3.7 4.8
Equatorial Guinea 0.1 0.1 0.1 0.2
Eritrea 0.1 0.1 0.1 0.1
Estonia 0.8 1.0 1.4 1.8
Eswatini 0.1 0.2 0.2 0.2
Ethiopia 0.3 0.3 0.3 0.4
Fiji 0.3 0.3 0.4 0.5
Finland 3.7 4.6 6.3 8.0
France 8.0 10.1 13.8 17.7
© STL Partners EXECUTIVE BRIEFING 30CURTAILING CARBON EMISSIONS – CAN 5G HELP? | OCTOBER 2019
Country Fast 5G Medium Slow 5G No 5G roll
roll out 5G roll out roll out out
French Guiana - - - -
French Polynesia 0.1 0.1 0.1 0.1
Gabon 0.2 0.2 0.3 0.4
Gambia, The 0.3 0.4 0.4 0.5
Georgia 0.8 1.0 1.2 1.6
Germany 54.4 67.6 91.8 115.6
Ghana 2.9 3.4 4.0 5.1
Greece 9.7 12.0 16.3 20.6
Greenland 0.03 0.03 0.04 0.1
Grenada 0.03 0.03 0.04 0.1
Guadeloupe - - - -
Guam 0.04 0.05 0.1 0.1
Guatemala 5.1 6.2 7.9 9.9
Guernsey - - - -
Guinea 1.3 1.5 1.6 1.9
Guinea-Bissau 0.2 0.2 0.2 0.2
Guyana 0.2 0.2 0.2 0.3
Haiti 5.3 6.2 6.8 8.3
Honduras 2.3 2.7 3.2 4.1
Hong Kong SAR, China 6.6 8.1 10.7 13.0
Hungary 2.8 3.4 4.7 6.0
Iceland 0.02 0.02 0.03 0.04
India 409.0 473.4 545.3 636.8
Indonesia 108.7 129.6 153.0 190.9
Iran, Islamic Rep. 31.5 38.0 48.8 61.3
Iraq 17.8 21.5 27.6 34.7
Ireland 2.6 3.2 4.3 5.4
Isle of Man 0.04 0.05 0.1 0.1
Israel 3.4 4.3 5.9 7.6
Italy 32.3 40.2 54.5 68.7
Jamaica 1.4 1.7 2.1 2.7
Japan 66.1 80.4 106.3 129.8
Jersey - - - -
Jordan 2.8 3.4 4.4 5.5
Kazakhstan 8.8 10.5 13.3 16.3
Kenya 2.1 2.6 3.0 3.9
Kiribati 0.01 0.02 0.02 0.02
© STL Partners EXECUTIVE BRIEFING 31CURTAILING CARBON EMISSIONS – CAN 5G HELP? | OCTOBER 2019
Country Fast 5G Medium Slow 5G No 5G roll
roll out 5G roll out roll out out
Kosovo 1.1 1.3 1.6 2.0
Kuwait 2.9 3.7 5.0 6.5
Kyrgyz Republic 0.7 0.9 1.1 1.3
Lao PDR 1.3 1.5 1.8 2.2
Latvia 0.8 0.9 1.3 1.6
Lebanon 2.4 2.9 3.7 4.7
Lesotho 0.2 0.2 0.3 0.3
Liberia 0.3 0.3 0.4 0.5
Libya 4.3 5.2 6.6 8.3
Liechtenstein 0.02 0.02 0.03 0.04
Lithuania 1.5 1.8 2.5 3.2
Luxembourg 0.5 0.6 0.9 1.1
Macao SAR, China 0.9 1.1 1.4 1.7
Madagascar 1.1 1.3 1.4 1.7
Malawi 0.8 0.9 1.0 1.2
Malaysia 12.4 14.7 18.7 23.0
Maldives 0.2 0.2 0.3 0.4
Mali 2.0 2.3 2.5 3.0
Malta 0.5 0.6 0.8 1.0
Martinique - - - -
Mauritania 0.4 0.5 0.6 0.7
Mauritius 0.2 0.3 0.4 0.4
Mayotte - - - -
Mexico 35.7 43.0 55.2 69.2
Moldova 1.7 2.0 2.3 2.9
Monaco 0.01 0.02 0.02 0.03
Mongolia 1.7 2.1 2.5 3.1
Montenegro 0.4 0.4 0.5 0.7
Morocco 20.8 25.0 29.8 38.1
Mozambique 1.2 1.4 1.5 1.9
Myanmar 8.1 9.7 11.5 14.5
Namibia 0.3 0.3 0.4 0.5
Nepal 6.7 7.5 8.1 9.3
Netherlands 11.8 14.7 20.0 25.1
New Caledonia 0.1 0.1 0.1 0.1
New Zealand 0.4 0.5 0.6 0.8
Nicaragua 2.4 2.9 3.4 4.4
© STL Partners EXECUTIVE BRIEFING 32You can also read